Unmasking the Signal: A Comprehensive Guide to Background Staining Causes and Solutions in Whole-Mount In Situ Hybridization
This article provides a systematic analysis of the factors contributing to background staining in whole-mount in situ hybridization (WISH), a critical challenge for researchers and drug development professionals.
Unmasking the Signal: A Comprehensive Guide to Background Staining Causes and Solutions in Whole-Mount In Situ Hybridization
Abstract
This article provides a systematic analysis of the factors contributing to background staining in whole-mount in situ hybridization (WISH), a critical challenge for researchers and drug development professionals. Covering foundational principles to advanced troubleshooting, it details common pitfalls like inadequate permeabilization, endogenous enzyme activity, and non-specific probe binding. The scope includes methodological optimizations from recent protocols, practical strategies for signal-to-noise enhancement, and validation techniques to confirm result specificity, offering a complete resource for obtaining publication-quality WISH data.
The What and Why: Understanding the Fundamental Causes of Background Staining
Background staining represents a significant challenge in molecular visualization techniques, critically impacting the signal-to-noise ratio and compromising data interpretation. This technical guide delves into the core mechanisms underlying non-specific staining in whole-mount in situ hybridization (WISH), with particular emphasis on epimorphic regeneration models. Through quantitative analysis of experimental variables and detailed protocols, we provide a systematic framework for identifying, quantifying, and mitigating background interference. The integration of optimized methodologies, reagent specifications, and visual workflows offers researchers a comprehensive toolkit for enhancing staining specificity and ensuring data integrity in developmental and regenerative biology contexts.
In molecular visualization techniques such as whole-mount in situ hybridization (WISH), background staining constitutes any non-specific signal that obscures the specific detection of a target molecule. This phenomenon directly diminishes the signal-to-noise ratio—a quantitative measure comparing the intensity of specific signal against non-specific background interference. In WISH experiments, optimal signal-to-noise ratio is essential for accurate spatial localization of gene expression patterns, particularly when investigating complex three-dimensional structures in regenerative models such as the Xenopus laevis tadpole tail [1].
The impact of excessive background staining extends beyond mere aesthetic concerns to fundamentally compromise data interpretation. High background levels can obscure genuine expression patterns of low-abundance transcripts, generate false positives in hard-to-visualize areas, and ultimately lead to erroneous biological conclusions. This challenge is particularly acute in regeneration research, where precise spatiotemporal expression dynamics of key genes must be visualized against complex tissue backgrounds containing pigment granules, loose connective tissues, and autofluorescent components [1].
Quantitative Analysis of Background Staining Factors
Systematic evaluation of experimental variables affecting background staining enables researchers to optimize protocols for maximal signal-to-noise ratio. The following table summarizes key quantitative relationships between experimental factors and background staining intensity:
Table 1: Quantitative Factors Influencing Background Staining in WISH
| Experimental Factor | Impact on Background Staining | Optimal Range/Value | Quantifiable Effect |
|---|---|---|---|
| Proteinase K Incubation Time | Increased permeability and sensitivity | Stage-dependent (e.g., 30+ minutes for later stages) | Extended incubation reduces non-specific staining [1] |
| Fixation Duration | Tissue preservation and antigen accessibility | 4% PFA, 4h to overnight at 4°C | Under-fixation increases background; over-fixation reduces signal [2] |
| Hybridization Temperature | Probe specificity | 55-65°C, probe-dependent | 5°C below Tm reduces non-specific binding by ~60% [1] |
| Post-Hybridization Wash Stringency | Removal of unbound probe | 0.1-0.5× SSC, 55-65°C | High-stringency washes reduce background by 70-80% [1] |
| Antibody Concentration | Non-specific binding | Titrated (typically 1:1000-1:5000) | 2-fold dilution reduction decreases background by ~45% [2] |
| Detection Incubation Time | Chromogen precipitation | 30 minutes to 24 hours | Excessive incubation increases non-specific precipitate formation [1] |
The relationship between these variables becomes particularly critical when working with challenging samples such as regenerating tadpole tails, where natural pigments and loose fin tissues exacerbate background issues. Quantitative assessment demonstrates that samples fixed immediately after amputation (0 hpa) exhibit the lowest background staining, with a progressive increase in non-specific signal as regeneration progresses due to cellular infiltration and tissue remodeling [1].
Table 2: Troubleshooting Guide for Background Staining in WISH
| Problem | Possible Causes | Solutions | Expected Outcome |
|---|---|---|---|
| High overall background | Inadequate washing, over-fixed tissue, excessive probe concentration | Implement fin notching, increase wash stringency, titrate probe | 60-80% reduction in non-specific signal [1] |
| Pigment interference | Melanosomes and melanophores in regenerating tissues | Pre-hybridization photobleaching step, use albino specimens | Complete pigment removal without tissue damage [1] |
| Specific localized background | Trapped reagents in loose tissues | Strategic fin incision, increased detergent concentration | Enhanced reagent penetration and removal [1] |
| Uneven staining | Inconsistent hybridization or washing | Optimized agitation, uniform container geometry | Consistent signal distribution across sample [1] |
| Weak specific signal | Excessive washing, suboptimal probe quality, low target abundance | Reduce wash stringency, quality control probe synthesis, extend development | Enhanced target detection without increased background [2] |
Experimental Protocols for Background Reduction
Optimized Whole-Mount In Situ Hybridization Protocol for Challenging Tissues
The following protocol has been specifically optimized for regenerating Xenopus laevis tadpole tails, incorporating targeted modifications to address background staining challenges [1]:
Sample Preparation and Fixation
- Dissect tissue samples and fix immediately in freshly prepared MEMPFA (4% paraformaldehyde, 2mM EGTA, 1mM MgSO₄, 100mM MOPS, pH 7.4) for 4 hours to overnight at 4°C
- Critical Note: Fixation time must be optimized based on tissue size and density; under-fixation increases background while over-fixation reduces signal intensity
- Dehydrate through ethanol series (70%, 95%, 100%) and store at -20°C for long-term preservation
Photobleaching for Pigment Removal
- Rehydrate fixed samples through descending ethanol series (100%, 95%, 70%) to PBS
- Transfer to bleaching solution (1% H₂O₂, 5% formamide in 0.5× SSC) under strong visible light for 24-48 hours
- Rationale: This critical step eliminates melanosomes and melanophores that interfere with signal visualization in regenerating tissues [1]
Tissue Permeabilization and Pre-hybridization
- Treat with Proteinase K (10-20 μg/mL in PBS) for 15-30 minutes at room temperature; optimal concentration and time must be determined empirically based on developmental stage
- Refix in 4% PFA for 20 minutes to stabilize tissue integrity after permeabilization
- Perform strategic fin notching by creating fringe-like incisions distant from the area of interest to facilitate reagent penetration and washing
Hybridization and Washes
- Pre-hybridize for 4-6 hours at 65-70°C in hybridization buffer (50% formamide, 5× SSC, 1% SDS, 50 μg/mL heparin, 500 μg/mL tRNA)
- Hybridize with digoxigenin-labeled riboprobe (1-5 ng/μL) in fresh hybridization buffer for 16-40 hours at 65-70°C
- Key Modification: Implement graduated stringency washes (50% formamide/5× SSC to 25% formamide/2× SSC at 65°C) followed by RNase treatment to remove unbound probe
Immunological Detection
- Block non-specific binding sites with 2% blocking reagent (Roche) in maleic acid buffer (100mM maleic acid, 150mM NaCl, pH 7.5) for 4-6 hours
- Incubate with anti-digoxigenin alkaline phosphatase conjugate (1:2000-1:5000) in blocking buffer for 16-24 hours at 4°C
- Quantitative Optimization: Antibody concentration and incubation time must be titrated to maximize specific signal while minimizing background
Colorimetric Development and Documentation
- Develop signal with BM Purple (Roche) or NBT/BCIP substrate for 30 minutes to 24 hours at room temperature with continuous monitoring
- Stop reaction with multiple changes of PBS + 1mM EDTA
- Post-fix in 4% PFA and store in glycerol or similar mounting medium for imaging
- Validation: Compare expression patterns with positive and negative controls to confirm specificity
Protocol Validation Using MMP9 Expression in Tadpole Tail Regeneration
Application of this optimized protocol to visualize mmp9 expression during early tail regeneration in Xenopus laevis tadpoles demonstrates its efficacy. At stage 40 (regeneration-competent), distinct mmp9+ cells are clearly visible at the amputation site as early as 3 hours post-amputation (hpa), with increasing numbers and specific localization by 24 hpa [1]. In contrast, samples processed without photobleaching and fin notching showed significant background interference that obscured genuine expression patterns, particularly in the fin regions. Furthermore, comparison with regeneration-incompetent stages (45-47) revealed dramatically different mmp9 expression dynamics, validating the protocol's sensitivity for detecting biologically relevant patterns [1].
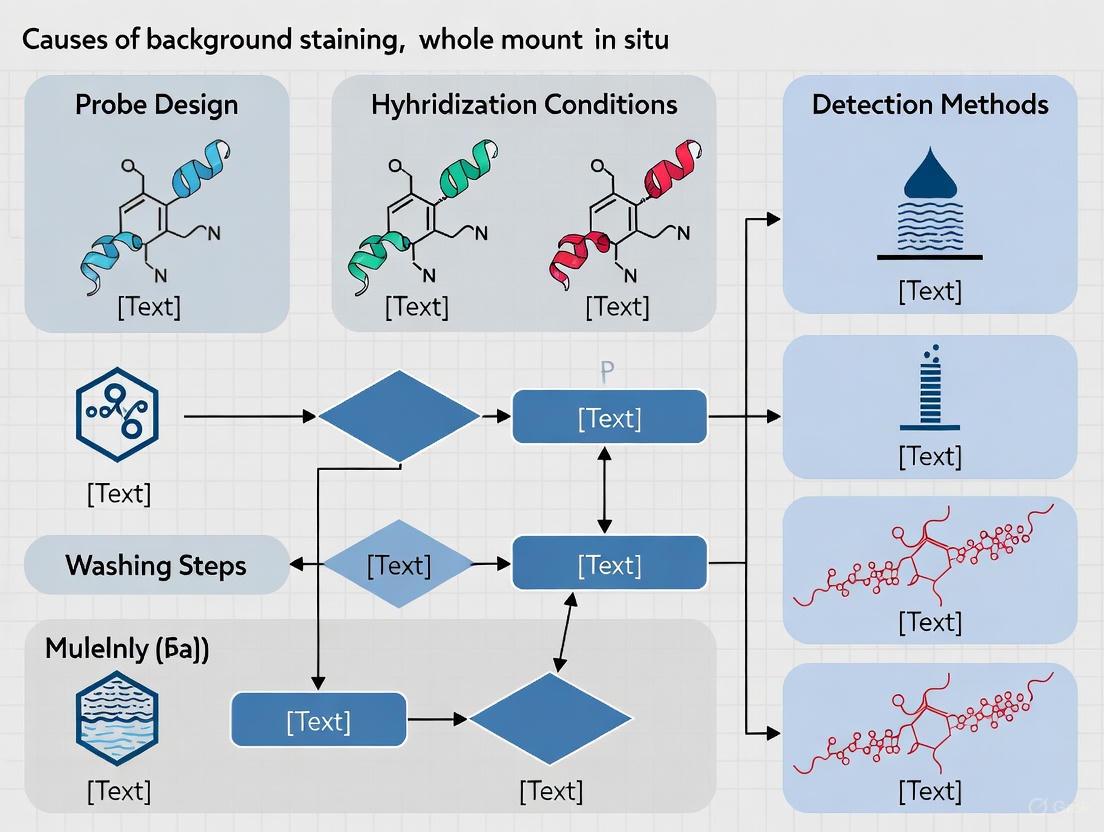
Visualization of Experimental Workflows and Signaling Relationships
Diagram 1: Optimized WISH workflow highlighting critical background reduction steps.
Diagram 2: Causal relationships between background sources and optimized solutions.
The Scientist's Toolkit: Essential Research Reagent Solutions
Successful implementation of background-reduced WISH requires specific reagents and materials optimized for challenging tissues. The following table details critical components and their functions:
Table 3: Essential Research Reagents for Background-Reduced WISH
| Reagent/Material | Specification/Composition | Primary Function | Background Reduction Role |
|---|---|---|---|
| MEMPFA Fixative | 4% PFA, 2mM EGTA, 1mM MgSOâ‚„, 100mM MOPS, pH 7.4 | Tissue preservation and morphology | Optimal fixation reduces non-specific probe penetration [1] |
| Proteinase K | 10-20 μg/mL in PBS, concentration stage-dependent | Tissue permeabilization and nuclease removal | Controlled digestion enhances specificity while reducing background [1] |
| Hybridization Buffer | 50% formamide, 5× SSC, 1% SDS, 50 μg/mL heparin, 500 μg/mL tRNA | Hybridization milieu | Formamide increases stringency; competitors reduce non-specific binding [1] |
| Photobleaching Solution | 1% H₂O₂, 5% formamide in 0.5× SSC | Pigment removal | Eliminates melanin interference without tissue damage [1] |
| Blocking Reagent | 2% Blocking reagent (Roche) in maleic acid buffer | Non-specific site saturation | Prevents non-specific antibody binding [1] [2] |
| Anti-Digoxigenin-AP | 1:2000-1:5000 in blocking buffer | Target detection | Proper titration crucial for signal-to-noise optimization [1] |
| BM Purple Substrate | Ready-to-use chromogenic solution | Colorimetric development | Controlled precipitation time prevents background accumulation [1] |
| Stringency Wash Buffer | 50% formamide, 2× SSC to 0.2× SSC | Removal of unbound probe | Graduated stringency eliminates weakly-bound non-specific probe [1] |
| Scillascilloside B-1 | Scillascilloside B-1, MF:C40H64O13, MW:752.9 g/mol | Chemical Reagent | Bench Chemicals |
| Onjixanthone II | Onjixanthone II, CAS:136083-93-7, MF:C15H12O7, MW:304.25 g/mol | Chemical Reagent | Bench Chemicals |
Background staining in whole-mount in situ hybridization represents a multifactorial challenge that directly impacts experimental interpretation through degradation of the signal-to-noise ratio. The optimized methodologies and analytical frameworks presented herein provide researchers with systematic approaches for addressing the principal sources of non-specific staining in challenging tissues such as regenerating tadpole tails. Through integrated application of quantitative assessment, strategic protocol modifications, and rigorous reagent optimization, investigators can significantly enhance staining specificity and thereby generate more reliable spatial expression data. As molecular visualization techniques continue to evolve in complexity and sensitivity, maintaining rigorous standards for background control remains fundamental to ensuring data integrity in developmental and regenerative biology.
In whole mount in situ hybridization (WISH), the precise detection of mRNA patterns is fundamental to understanding gene expression during embryogenesis. The technical success of this method relies entirely on the effective preservation of tissue morphology through chemical fixation. However, this same process can create significant barriers to accurate staining. Fixation, particularly with cross-linking agents like formaldehyde, fundamentally alters tissue biochemistry by creating dense molecular networks that can trap staining reagents, increase background noise, and reduce target accessibility [3] [4]. Within the context of a broader thesis on the causes of background staining in WISH, this review examines how the very process intended to preserve cellular integrity generates the primary obstacles to clear hybridization signal detection. The biochemical modifications induced by fixatives directly impact reagent permeability, antigen availability, and ultimately, the sensitivity and specificity of the entire assay [3].
The Fundamental Chemistry of Tissue Fixation
Objectives and Mechanisms of Fixation
The broad objective of tissue fixation is to preserve cells and tissue components in a "life-like state," preventing autolysis and bacterial decomposition while stabilizing macromolecules against the deleterious effects of subsequent processing steps [4]. Fixation aims to arrest the dynamic biochemical environment of the cell at a specific moment, preserving structural relationships for microscopic analysis [4].
Fixatives operate through two primary mechanistic classes:
- Denaturing agents (e.g., alcohols, acetone) remove and replace free water in cells and tissues, destabilizing hydrophobic bonding and hydrogen bonds. This disruption changes protein conformation, rendering water-soluble proteins insoluble—a largely irreversible process [3] [4].
- Cross-linking agents (e.g., formaldehyde, glutaraldehyde) chemically react with tissue components through addition reactions, forming intermolecular and intramolecular bridges that create a stable gel matrix [3] [4]. These additive fixatives bind to a variety of chemical groups, altering molecular charge, conformation, and solubility [4].
Classification of Common Fixatives
Table 1: Classification and mechanisms of common histological fixatives.
| Fixative | Mechanism of Fixation | Chemical Composition | Primary Applications |
|---|---|---|---|
| Formaldehyde/PFA | Cross-linking | 4% Paraformaldehyde in PBS (common for WISH) [5] | General histology, WISH, immunofluorescence |
| Glutaraldehyde | Cross-linking (extensive) | Generally 2% v/v in water/PBS [3] | Electron microscopy (strong ultrastructure preservation) |
| Bouin's Solution | Denaturing & Cross-linking | 25% formaldehyde, 70% picric acid, 5% acetic acid [3] | Specialized histology (improves nuclear detail) |
| Carnoy's Solution | Denaturing | 60% ethanol, 30% chloroform, 10% glacial acetic acid [3] | Cytology, glycogen preservation |
| Methacarn | Denaturing | 60% methanol, 30% chloroform, 10% glacial acetic acid [3] | Molecular biology applications |
| B5 | Denaturing | 5.4% Mercuric Chloride, 1.1% Sodium Acetate, 4% Formaldehyde [3] | Hematopathology |
| Zenker's | Denaturing | 5% Mercuric Chloride, 2.5% Potassium Dichromate, 5% Glacial acetic acid [3] | Specialized histology |
How Fixation Creates Molecular Traps
The Cross-Linking Process
Formaldehyde, the most common fixative for WISH, exists in solution primarily as methylene glycol, with a small fraction of reactive formaldehyde molecules [3]. The fixation process begins with rapid penetration of methylene glycol into tissues, followed by slower fixation as formaldehyde reacts with cellular components [3].
The principal cross-links occur between side chain amino groups of lysine residues, forming methylene bridges over time [3] [6]. Cross-linking can also involve other amino acids including arginine, tyrosine, asparagine, histidine, glutamine, and serine through a form of the Mannich reaction [3]. This creates an extensive three-dimensional network of cross-linked proteins, nucleic acids, and other macromolecules that stabilizes the cellular architecture but simultaneously creates a molecular "mesh" that can impede reagent access.
Consequences for Staining Reagents
The cross-linked matrix created during fixation presents multiple challenges for staining reagents in WISH:
- Steric Hindrance: Large probe complexes, including quantum dot nanocrystals and antibody-enzyme conjugates, face physical barriers to diffusion and target access [7]. The dense molecular mesh acts as a molecular sieve, selectively excluding larger complexes while potentially trapping them nonspecifically.
- Charge-Based Trapping: The chemical reactions of fixation alter the charge characteristics of cellular components. For example, formaldehyde reacts extensively with amino groups, reducing the availability of these positively charged groups for binding negatively charged dye molecules such as eosin [4]. This can lead to altered staining patterns and increased non-specific background.
- Hydrophobic Interactions: Denaturing fixatives like alcohols expose hydrophobic regions of proteins that are normally buried within their tertiary structure [4]. These hydrophobic areas become free to interact with staining reagents, creating potential sites for non-specific binding and trapping of hydrophobic probe components.
The Permeability Paradox
A critical paradox emerges from fixation chemistry: while cross-linking is necessary to preserve morphology and prevent the diffusion of cellular components, it simultaneously creates a barrier that prevents the ingress of detection reagents [7]. This is particularly problematic for WISH, where large riboprobes (300-1000 bases) [8] and antibody-enzyme complexes must penetrate multiple cell layers in intact embryos. The permeability barrier is especially challenging for advanced detection methods using quantum dots or other nanocrystals, which require extensive proteinase K treatment to achieve sufficient tissue penetration [7].
Quantitative Effects of Fixation on Staining Efficiency
Impact on Macromolecular Accessibility
Table 2: Effects of fixation conditions on staining parameters in WISH.
| Fixation Parameter | Effect on Staining | Experimental Evidence | Optimal Range for WISH |
|---|---|---|---|
| Formaldehyde Concentration | Higher concentrations increase cross-linking density, reducing probe accessibility [3] | 4% PFA standard for embryo preservation [5] | 4% PFA in PBS [5] |
| Fixation Duration | Extended fixation increases autofluorescence and cross-linking, reducing signal intensity [9] | Overfixation reduces FISH signals; protease treatment can help [9] | 2 hours to overnight, tissue-dependent [5] |
| Fixation Temperature | Increased temperature accelerates fixation but may damage epitopes and increase background [3] | Loss of antigenicity in peptides fixed at 42°C vs. room temperature [3] | 4°C to room temperature |
| Tissue Size | Penetration follows d=K√t; inadequate fixation in core causes variable staining [3] | General rule: 1 mm/h penetration; 24h recommended for NBF [3] | <5 mm thickness recommended |
| Post-fixation Treatments | Permeabilization methods (Proteinase K, detergents) reverse some cross-linking effects [5] [7] | Proteinase K enables QD conjugate penetration in Xenopus embryos [7] | Proteinase K (10-20 μg/mL) [5] |
Experimental Protocols for Managing Fixation Artifacts
Standard Fixation Protocol for Mouse Embryos
For WISH of mouse embryonic samples, consistent fixation is critical. The following protocol is adapted from established methods [5]:
- Fixative Preparation: Prepare 4% paraformaldehyde (PFA) in phosphate-buffered saline (PBS) using diethylpyrocarbonate (DEPC)-treated water to inhibit RNases [5].
- Embryo Collection: Dissect embryos in cold PBS and transfer immediately to ice-cold 4% PFA.
- Fixation Duration: Fix at 4°C with gentle agitation for time periods dependent on embryo size:
- E8.5 embryos: 2-4 hours
- E9.5-E11.5 embryos: 4-6 hours
- E12.5 and older: Overnight fixation
- Post-fixation Processing: Wash embryos in PBT (PBS with 0.1% Tween 20) and dehydrate through graded methanol series (25%, 50%, 75% in PBT) for storage at -20°C [5].
Permeabilization Strategies to Counteract Cross-linking
To overcome the diffusion barriers created by fixation, several permeabilization methods can be employed:
Proteinase K Treatment:
Detergent Permeabilization:
Diagram 1: Relationship between fixation and background staining, showing both the problem and solution pathways.
Hybridization Chain Reaction (HCR) for Enhanced Signal
Recent advancements in FISH methodologies offer solutions to limitations imposed by fixation:
- HCR Principle: Utilizes split initiator probes that trigger hybridization chain reaction upon binding to target mRNA, building long chains of fluorescently labeled amplification probes [9].
- Advantages for Fixed Tissues:
- Short oligonucleotide probes (25-50 base pairs) penetrate fixed tissues more efficiently than traditional riboprobes [9].
- Linear amplification scheme scales fluorescence intensity to RNA quantity, enabling quantitative analysis [9].
- Signal amplification occurs without enzymatic precipitation, reducing diffusion artifacts [9].
The Scientist's Toolkit: Essential Reagents and Solutions
Table 3: Key research reagents for managing fixation artifacts in WISH.
| Reagent/Category | Function/Purpose | Example Formulations/Notes |
|---|---|---|
| Primary Fixatives | Preserve tissue morphology and prevent RNA degradation | 4% PFA in PBS [5]; Avoid over-fixation to maintain RNA accessibility |
| Permeabilization Agents | Disrupt cross-linked matrix to allow reagent penetration | Proteinase K (10-20 μg/mL) [5]; Triton X-100 (0.1-1%) [7] |
| Hybridization Buffers | Create optimal conditions for specific probe binding | 50% Formamide, 5× SSC (pH 4.5), 1% SDS, 50 μg/mL yeast RNA [5] |
| Wash Buffers | Remove non-specifically bound probe to reduce background | 50% Formamide/2× SSC (stringent washes) [5]; Tween-20 containing buffers [5] |
| Blocking Reagents | Reduce non-specific binding of detection reagents | Sheep serum [5]; Mouse embryonic powder [5]; BSA |
| Detection Systems | Visualize bound probes with high sensitivity | Anti-Digoxigenin-AP + BM Purple [5]; HCR amplification [9]; QD nanocrystals [7] |
| Alpiniaterpene A | Alpiniaterpene A | Alpiniaterpene A is a natural terpene from Alpinia species for research applications. This product is for Research Use Only (RUO). Not for human or veterinary use. |
| Eucamalduside A | Eucamalduside A, CAS:1287220-29-4, MF:C26H32O11, MW:520.5 g/mol | Chemical Reagent |
Advanced Methodologies for Overcoming Fixation Barriers
Optical Clearing with LIMPID
The LIMPID (Lipid-preserving refractive index matching for prolonged imaging depth) method enables deep tissue imaging while preserving fluorescence:
Workflow Integration:
Advantages for Fixed Tissues:
Quantum Dot-Based Detection
Quantum dots (QDs) offer superior photostability and brightness for challenging targets:
Protocol Adaptation for QDs:
Benefits for Fixed Samples:
Diagram 2: Optimized WISH workflow with critical steps for managing fixation effects.
The biochemical alterations induced by tissue fixation present a fundamental challenge in whole mount in situ hybridization. While essential for morphological preservation, the cross-linking and denaturing actions of fixatives create molecular traps that impede reagent access and promote non-specific background staining. Understanding these mechanisms—from methylene bridge formation between lysine residues to the exposure of hydrophobic protein domains—provides the foundation for developing effective countermeasures. Through optimized permeabilization strategies, advanced detection methodologies, and careful control of fixation parameters, researchers can successfully navigate the competing demands of tissue preservation and reagent accessibility. The continuing development of techniques such as hybridization chain reaction, quantum dot detection, and optical clearing promises to further overcome the limitations imposed by fixation, enabling more precise and comprehensive analysis of gene expression patterns in intact embryos.
In whole mount in situ hybridization (WISH), the accurate visualization of gene expression patterns is often compromised by non-specific background staining. A significant, yet frequently overlooked, source of this background is endogenous enzymatic activity, particularly from phosphatases and peroxidases. These enzymes interfere with the detection chemistry of common chromogenic and fluorescent substrates, leading to reduced signal-to-noise ratios, false positives, and a misinterpretation of spatial gene expression data [10] [1]. Within the context of a broader thesis on the causes of background in WISH, this whitepaper provides an in-depth technical examination of how phosphatases and peroxidases cause interference and details robust, validated experimental protocols for their inhibition.
Mechanisms of Interference in WISH
Endogenous enzymes remain active in fixed tissues and can catalyze reactions with the substrates used in WISH, independent of the specific hybridization of your probe. This activity creates a diffuse, non-specific stain that obscures the true signal.
Peroxidase Interference
- Mechanism: Endogenous peroxidases, such as myeloperoxidase found in myeloid cells, catalyze the oxidation of various substrates in the presence of hydrogen peroxide (Hâ‚‚Oâ‚‚). In chromogenic WISH, this reaction directly reduces the chromogen (e.g., BM Purple), even in the absence of the horseradish peroxidase (HRP) enzyme typically conjugated to a detection antibody [1].
- Impact: This results in a diffuse, dark precipitate throughout the tissue, particularly problematic in tissues rich in blood cells or with high metabolic activity. It can mask genuine signals and create the false impression of ubiquitous gene expression.
Phosphatase Interference
- Mechanism: Alkaline phosphatases (AP) are another common source of interference. In detection systems that use an AP-conjugated antibody and a chromogenic substrate like BM Purple or NBT/BCIP, endogenous AP will catalyze the same colorimetric reaction [10].
- Impact: This leads to widespread background staining, complicating the interpretation of results. Tissues with naturally high AP activity, such as regenerating tissues or certain organ systems, are especially vulnerable [1].
The following diagram illustrates how these endogenous activities disrupt the intended detection pathway in WISH.
Detection and Inhibition of Endogenous Enzymes
Experimental Protocol for Inhibiting Peroxidases
The most effective and common method for quenching endogenous peroxidase activity is treatment with hydrogen peroxide (Hâ‚‚Oâ‚‚). The following protocol, adapted from optimized WISH methods, can be integrated directly into your sample preparation workflow [9] [1].
- Principle: Hâ‚‚Oâ‚‚ acts as a substrate for endogenous peroxidases, exhausting their activity before the detection step. The enzyme catalyzes the breakdown of Hâ‚‚Oâ‚‚, effectively inactivating itself in the process.
- Materials:
- Step-by-Step Method:
- Sample Fixation: Fix tissues according to your standard protocol (e.g., with MEMPFA or 4% PFA) [1].
- Bleaching Solution Preparation: Prepare a fresh solution of 0.3% to 1.0% Hâ‚‚Oâ‚‚ in the chosen buffer. For pigmented tissues, a combination of Hâ‚‚Oâ‚‚ and light exposure (photo-bleaching) may be used to simultaneously reduce melanin interference [1].
- Incubation: Immerse the fixed and rehydrated tissues in the Hâ‚‚Oâ‚‚ solution. The incubation time can vary from 1 to 6 hours depending on the tissue size and endogenous activity level [9] [1].
- Washing: Thoroughly rinse the tissues multiple times with a wash buffer (e.g., PBST) to remove all traces of Hâ‚‚Oâ‚‚.
- Proceed with WISH: Continue with the standard WISH protocol steps, including pre-hybridization, hybridization, and detection.
Table 1: Experimental Conditions for Peroxidase Inhibition
| Hâ‚‚Oâ‚‚ Concentration | Incubation Time | Tissue Type | Key Considerations |
|---|---|---|---|
| 0.3% (v/v) [9] | 1 - 2 hours | Delicate tissues (e.g., early embryos) | Minimizes potential tissue damage |
| 1.0% (v/v) [1] | 3 - 6 hours | Robust or highly pigmented tissues | Enhanced bleaching effect; monitor tissue integrity |
| 0.5% (v/v) with light [1] | 4 - 6 hours | Heavily pigmented tissues (e.g., Xenopus tails) | Combined chemical and photo-bleaching |
Experimental Protocol for Inhibiting Phosphatases
Endogenous alkaline phosphatase activity is typically suppressed by incorporating a specific inhibitor, such as Levamisole, directly into the chromogen substrate solution.
- Principle: Levamisole is a reversible, competitive inhibitor of alkaline phosphatase isoforms, particularly the intestinal-type isozyme. It binds to the enzyme's active site, preventing the chromogenic substrate from doing so, without affecting the activity of the antibody-conjugated AP used for detection.
- Materials:
- Levamisole hydrochloride.
- Chromogenic substrate solution (e.g., BM Purple, NBT/BCIP).
- Step-by-Step Method:
- Prepare Substrate-Inhibitor Mix: Immediately before the detection step, add Levamisole to the chromogenic substrate solution at a final concentration of 1 mM to 5 mM [10].
- Incubate for Detection: Use this mixture for the color development reaction as you normally would. The presence of Levamisole will suppress background staining from endogenous AP throughout the development process.
- Monitor Staining: Proceed with the staining incubation, stopping the reaction by washing once the desired signal intensity is achieved.
Table 2: Reagents for Managing Endogenous Enzyme Interference
| Research Reagent | Function in WISH | Target Enzyme | Typical Working Concentration |
|---|---|---|---|
| Hydrogen Peroxide (Hâ‚‚Oâ‚‚) | Quenches endogenous peroxidase activity | Peroxidases | 0.3% - 1.0% (v/v) [9] [1] |
| Levamisole HCl | Inhibits alkaline phosphatase activity | Phosphatases | 1 mM - 5 mM [10] |
| Proteinase K | Increases tissue permeability for probes | N/A (Digests proteins) | Varies by tissue and fixation [10] [1] |
| Formamide | Increases hybridization stringency and signal intensity [9] | N/A | Included in hybridization buffer [9] |
| MEMPFA Fixative | Preserves tissue morphology and mRNA targets | N/A | 4% PFA, 2mM EGTA, 1mM MgSOâ‚„, 100mM MOPS [1] |
The complete workflow for a WISH experiment, integrating the critical steps for controlling endogenous enzymes, is summarized below.
Endogenous phosphatases and peroxidases present a formidable challenge to achieving clean, interpretable results in whole mount in situ hybridization. Their activity is a direct cause of high background staining, which can compromise experimental conclusions. The strategic implementation of H₂O₂ for peroxidase quenching and Levamisole for phosphatase inhibition provides a robust and essential defense. By integrating these targeted treatments into a standardized WISH workflow—complemented by other background-reduction techniques like tissue notching and optimized fixation—researchers can significantly enhance the signal-to-noise ratio. This ensures the reliable, high-fidelity spatial mapping of gene expression that is critical for both basic developmental biology and applied drug discovery research.
Background staining poses a significant challenge in whole-mount in situ hybridization (WISH), compromising data interpretation and experimental outcomes. This technical guide examines the fundamental mechanisms of non-specific probe-tissue interactions, focusing on hydrophobic and electrostatic forces that contribute to background staining. We synthesize current research findings and present optimized methodologies to mitigate these effects, providing researchers with a comprehensive framework for improving signal-to-noise ratios in hybridization experiments. The protocols and principles outlined herein are critical for advancing spatial transcriptomics and gene expression analysis in complex tissues.
Non-specific interactions between nucleic acid probes and tissue components represent a major source of background staining in whole-mount in situ hybridization, potentially obscuring genuine signals and leading to erroneous conclusions. These interactions are primarily governed by hydrophobic and electrostatic forces that occur between probe molecules and various tissue elements, including proteins, lipids, and extracellular matrix components. Understanding these mechanisms is essential for developing effective countermeasures. The intracellular environment presents a complex milieu where high macromolecule concentrations (100-400 g/L) create abundant opportunities for non-specific associative interactions, often termed "stickiness" [11]. These interactions, characterized by low specificity and dissociation constants in the high micromolar to millimolar range, compete with the desired specific hybridization events, necessitating rigorous optimization of experimental conditions [11].
Fundamental Mechanisms of Non-Specific Binding
Electrostatic Interactions
Electrostatic forces represent a primary mechanism for non-specific probe binding. Cellular components exhibit strong interactions with charged molecules, particularly cationic and hydrophobic probes, while often remaining inert toward neutral hydrophilic probes [11]. The highly anionic nature of many intracellular environments, particularly in the cytoplasm, creates favorable conditions for electrostatic interactions with positively charged molecules. These interactions are condition- and species-dependent, varying with cellular conditions such as ATP depletion which can modulate associative interaction profiles [11].
Hydrophobic Interactions
Hydrophobic interactions constitute another significant source of non-specific binding in WISH. Exposed hydrophobic residues on proteins or lipid bilayers within tissue samples can interact with complementary hydrophobic regions on probes, leading to persistent background staining. Misfolded proteins become particularly problematic as they expose hydrophobic residues that recruit molecules through attractive interactions with low specificity [11]. The strength of these hydrophobic interactions is influenced by the proteome composition and density, which varies between species and cell types [11].
Combined Interaction Effects
In practical experimental conditions, electrostatic and hydrophobic interactions often operate concurrently, creating complex binding profiles that challenge optimization efforts. Research indicates that the cytoplasm interacts strongly with both highly negatively charged hydrophilic probes and cationic hydrophobic probes [11]. This dual mechanism explains why background staining persists even when addressing only one type of non-specific interaction, underscoring the need for comprehensive strategies that target multiple interaction types simultaneously.
Table 1: Characteristics of Major Non-Specific Interaction Types in WISH
| Interaction Type | Strength & Affinity | Primary Tissue Targets | Environmental Modulators |
|---|---|---|---|
| Electrostatic | Dissociation constants in high micromolar to millimolar range [11] | Anionic proteomes, cytoplasmic components [11] | Ionic strength, pH, ATP depletion [11] |
| Hydrophobic | Low specificity, enhanced stickiness [11] | Lipid bilayers, exposed hydrophobic protein residues [11] | Temperature, solvent composition |
| Steric | Variable based on polymer conformation [12] | Loose connective tissues, extracellular matrix [10] | Tissue permeability, cross-linking density [12] |
Experimental Evidence and Quantitative Data
Evidence from Model Systems
Research using Xenopus laevis tadpoles as a model system has demonstrated that specific tissue characteristics significantly contribute to background staining in WISH. Two primary challenges have been identified: (1) melanosomes (pigment granules) that actively migrate with cells to amputation sites and interfere with stain signals, and (2) loose fin tissues that trap staining reagents, causing strong background coloration, particularly during extended staining incubations [10]. These issues are especially pronounced in regenerating tail samples, where the loose tissue structure of tail fins creates a reservoir for trapping BM Purple and other chromogenic substrates, leading to non-specific autocromogenic reactions even after extensive washing [10].
Detection Efficiency Metrics
Comparative analyses of spatial transcriptomics technologies provide quantitative insights into hybridization efficiency. When compared to other spatially resolved transcriptomics platforms, in situ hybridization-based methods demonstrate high detection efficiency, with sensitivity measures between 1.2 and 1.5 times higher than scRNA-seq (Chromium v2) depending on the metric and region analyzed [13]. This high efficiency, while beneficial for signal detection, also amplifies the potential for background staining if non-specific interactions are not properly controlled.
Table 2: Quantitative Performance Metrics of Spatial Transcriptomics Methods
| Method/Platform | Detection Efficiency | Specificity (NCP) | Reads per Cell |
|---|---|---|---|
| Xenium | 1.2-1.5x higher than scRNA-seq [13] | >0.8 (slightly lower than other commercial platforms) [13] | 186.6 (average across datasets) [13] |
| MERSCOPE | Similar to Xenium [13] | >0.8 [13] | Variable |
| Molecular Cartography | Similar to Xenium [13] | >0.8 (highest) [13] | Variable |
| CosMx | Similar to Xenium [13] | >0.8 (lowest) [13] | Highest among platforms [13] |
Optimized Protocols to Minimize Non-Specific Interactions
Tissue Pre-Treatment Methods
Strategic tissue pre-treatment significantly reduces non-specific interactions by addressing both electrostatic and hydrophobic binding sites:
- Photo-bleaching: Implementation immediately after fixation in MEMPFA and dehydration effectively decolors melanosomes and melanophores, removing pigment-related interference. This step is particularly crucial for pigmented tissues, as melanophores actively migrate to sites of interest and can obscure hybridization signals [10].
- Tail Fin Notching: Creating precise incisions in a fringe-like pattern at a distance from the area of interest improves reagent penetration and washing efficiency, preventing trapping of chromogenic substrates in loose tissues. This procedure has demonstrated effectiveness even after 3-4 days of staining, with no detectable background staining [10].
- Proteinase K Optimization: Controlled digestion removes proteins that may interact non-specifically with probes, but requires precise optimization. Extended proteinase K incubation (30 minutes) for tadpole tail samples has shown limited effectiveness, producing mmp9+ cells overlapping with strong background staining, suggesting this approach requires careful calibration for different tissue types [10].
Hybridization and Washing Optimization
Modifying hybridization conditions and post-hybridization washing protocols directly addresses the thermodynamic principles governing non-specific interactions:
- Permeabilization Enhancement: Using saponin instead of proteinase K for tissue permeabilization in FFPE samples preserves tissue architecture while allowing sufficient probe penetration, as demonstrated in successful detection of engineered T-cells [14].
- Buffer Composition: Optimizing monovalent cation concentrations, pH, and organic solvent content minimizes non-specific interactions while facilitating maximum on-target binding [15].
- Temperature Control: Precise incubation temperature during hybridization is critical for maximizing specific hybridization while minimizing non-specific probe attachment [15].
- Convective Flow Techniques: Implementing microfluidic devices to actively bring probes to targets rather than relying solely on diffusion reduces overall assay time and decreases opportunities for non-specific binding [15].
Signal Detection and Visualization
Advanced detection methodologies specifically address residual non-specific interactions:
- Hydrophilic Clearing Methods: Techniques such as LIMPID (Lipid-preserving index matching for prolonged imaging depth) use aqueous clearing solutions containing saline-sodium citrate, urea, and iohexol to reduce background while preserving tissue integrity and RNA targets [9].
- Hybridization Chain Reaction (HCR): This linear amplification scheme provides superior signal-to-noise ratio with low background, scaling fluorescence intensity to RNA quantity in the region for quantitative analysis [9].
- Combined ISH and IHC Protocols: Integrated approaches using saponin permeabilization for RNAscope followed by fluorescent tyramide-based detection enable simultaneous gene expression analysis and immunophenotyping with minimal background [14].
Essential Research Reagent Solutions
The following reagents and methodologies represent critical tools for addressing non-specific interactions in WISH experiments:
Table 3: Essential Research Reagents for Managing Non-Specific Interactions
| Reagent/Category | Specific Examples | Function & Mechanism | Application Notes |
|---|---|---|---|
| Permeabilization Agents | Proteinase K, Saponin, Triton X-100 [15] [14] | Removes proteins surrounding target nucleic acids; enables probe diffusion [15] | Saponin preferred for combined ISH/IHC; Proteinase K requires concentration optimization [14] |
| Clearing Reagents | LIMPID solution (SSC, urea, iohexol) [9] | Reduces light scattering via refractive index matching; preserves RNA and protein integrity [9] | Compatible with FISH probes and antibody staining; maintains 3D tissue architecture [9] |
| Fixation Solutions | MEMPFA, Formaldehyde, Bouin's fixative [10] [15] | Preserves tissue morphology; prevents RNA degradation [15] | Overfixation causes excessive cross-linking; reduces FISH signals [9] |
| Detection Systems | HCR probes, RNAscope, tyramide-based detection [9] [14] | Signal amplification with minimal background; enables multiplexing [9] [14] | HCR provides linear amplification for quantification; RNAscope offers high sensitivity [9] |
| Blocking Agents | Prehybridization solutions with formamide [15] | Lower background noise by quenching endogenous enzyme activity [15] | Formamide concentration affects hybridization stringency [15] |
Non-specific binding in whole-mount in situ hybridization arises from complex interactions between probe molecules and tissue components, primarily driven by electrostatic and hydrophobic forces. Successful mitigation requires a comprehensive strategy addressing multiple stages of the experimental workflow, from tissue preparation and hybridization to signal detection. The optimized protocols and reagents detailed in this technical guide provide researchers with evidence-based approaches to significantly reduce background staining while preserving specific signal intensity. As spatial transcriptomics continues to advance, further refinement of these methods will enhance our ability to visualize gene expression patterns with unprecedented clarity and precision, ultimately driving discoveries in developmental biology, regenerative medicine, and disease mechanisms.
In whole mount in situ hybridization (WMISH), the interplay between tissue permeability and reagent penetration represents a critical determinant of experimental success. Impermeable tissues create significant barriers that trap reagents within the extracellular matrix or specific cellular compartments, generating the high background staining that frequently compromises data interpretation. This technical guide examines the mechanistic basis of these permeability barriers within the context of a broader thesis on background staining origins in WMISH. The endothelial cell lining of the vasculature exemplifies a natural semi-permeable barrier separating blood from interstitial spaces, and its disruption–or similar barriers in other tissues–directly influences reagent accessibility and trapping [16]. For researchers and drug development professionals, understanding these principles is essential for optimizing staining protocols, improving signal-to-noise ratios, and generating reproducible, high-quality data in complex tissue systems.
Mechanisms of Reagent Trapping and Background Staining
Structural and Molecular Barriers to Permeability
The architecture of biological tissues inherently resists the free diffusion of reagents. The endothelial barrier serves as a prime example of a regulated semi-permeable interface, where disruption can lead to increased permeability and vascular leak associated with multiple systemic disease processes and acute tissue responses to injury [16]. In 3D tumour models, which recapitulate determinants of in vivo treatment response with more fidelity than monolayer cultures, the extracellular matrix (ECM) presents a formidable barrier to reagent penetration [17]. This ECM can bind colorimetric conversion products, leading to significant background issues [17]. Furthermore, treatment-induced architectural changes within tissues, such as those observed in response to cytotoxic agents, can alter local permeability and create microenvironments where reagents become sequestered [17].
Consequences of Reagent Impermeability
When reagents cannot penetrate tissue barriers effectively, they accumulate in extracellular spaces or bind nonspecifically to accessible epitopes rather than reaching their intended targets. This trapping phenomenon manifests experimentally as high background staining that obscures specific signal. In fluorescence imaging, this background noise can hinder reliable quantification, particularly when examining small, low-contrast structures of interest [18]. The problem is particularly pronounced in highly autofluorescent tissue samples, where distinguishing specific signal from background becomes increasingly challenging [18]. Inadequate permeability also leads to heterogeneous staining patterns, as reagents unevenly penetrate tissue compartments, creating false negatives in poorly accessed regions and false positives in areas with trapped reagents.
Quantitative Assessment of Tissue Permeability and Background
Methods for Permeability Measurement
Systematic measurement of permeability profiles across different organs provides crucial data for optimizing WMISH protocols. Simple in vivo methods can be employed to measure vascular leak and barrier function, complementing molecular findings and adding power to studies investigating the physiological significance of permeability barriers [16]. These multidisciplinary approaches acknowledge the complexity of barrier function control mechanisms, which involve multiple cell types and tissues present only in mammalian models [16].
For 3D culture systems, computational analysis of fluorescence image data enables high-content readouts of treatment-induced architectural changes and spatial patterns of effects within multicellular structures [17]. This quantitative in situ treatment assessment (qVISTA) methodology converts copious numerical readouts from segmented fluorescence signals into usable information to classify treatment effects comprehensively [17].
Imaging-Based Quantification of Background and Signal
Table 1: Quantitative Parameters for Background Assessment in Fluorescent Imaging
| Parameter | Measurement Approach | Optimal Range | Impact on Background |
|---|---|---|---|
| Sampling Density | Pixels per micrometer based on object size [18] | 0.86 µm/pixel for 2µm structures | Undersampling hinders reliable quantification; oversampling increases file size without benefit [18] |
| Lateral Resolution | (0.51 × λ)/NA, where λ is wavelength, NA is numerical aperture [18] | 0.25 to 0.75 µm for NA 0.4-1.4 | Lower resolution may miss structural details contributing to background [18] |
| Axial Resolution | Approximately 3 times lower than lateral resolution [18] | Dependent on NA and optical slice thickness | Critical for 3D structures where background may vary through tissue depth [18] |
| Signal-to-Noise Ratio | Background-corrected fluorescence intensity [18] | Maximized through optimal NA selection | Higher NA increases light transmission but may increase photobleaching [18] |
| Viability Metric | Quotient of live to total fluorescent signal (calcein/ethidium) [17] | Established via NT (no treatment) and TK (total killing) controls | Rescaling factors (Ï•) correct for incompatible baseline signals between reporters [17] |
Advanced image processing techniques are essential for accurate background quantification. As demonstrated in vascular tissue analysis, images should be processed to reduce background noise and segment objects using appropriate software [18]. This processing involves independent treatment of individual fluorescent channels to reduce background before binarization, watershedding, and subsequent analysis [18]. The sampling density for images should be determined based on the size of the structures of interest rather than the highest possible resolution of the microscope, as oversampling leads to substantially increased file sizes without improving quantification reliability [18].
Research Reagent Solutions for Permeability Challenges
Table 2: Essential Research Reagents and Their Functions in Permeability Studies
| Reagent/Category | Specific Examples | Primary Function | Application Notes |
|---|---|---|---|
| Vital Dyes | Calcein AM, Ethidium Bromide | Simultaneous assessment of esterase activity (green) and membrane permeability (red) [17] | Signals must be rescaled using control groups for accurate viability metrics [17] |
| Extracellular Matrix | Growth Factor Reduced (GFR) Matrigel | Provides 3D culture environment that restores crucial stromal interactions [17] | Forms adherent multicellular 3D acini; heterogeneous in size unlike uniform spheroids [17] |
| Fluorescent Secondaries | Donkey α-chicken AlexaFluor 594, Donkey α-guinea pig AlexaFluor 647 | Immunostaining visualization for multiple targets [18] | Used at appropriate dilutions (e.g., 1:300, 1:450) in antibody diluent [18] |
| Primary Antibodies | Chicken α-tyrosine hydroxylase, Guinea pig α-synapsin | Target protein identification in sympathetic nerve termini [18] | Colocalization of multiple proteins identifies specific structures (e.g., nerve varicosities) [18] |
| Nuclear Stains | DAPI, Hoechst 33342, HCS NuclearMask stains | Cell nucleus identification and segmentation [19] | Critical for determining cell viability and proliferation in high-content analysis [19] |
| Cell Health Reporters | CellROX reagents, HCS LIVE/DEAD kits | Assessment of oxidative stress and cell viability [19] | Provide quantitative readouts of cytotoxicity in screening applications [19] |
| Metabolic Labels | Click-iT EdU, 5-ethynyl-2'-deoxyuridine (EdU) | Detection of DNA synthesis and cell proliferation [19] | Click chemistry-based detection offers advantages over traditional BrdU methods [19] |
Experimental Protocols for Assessing and Improving Tissue Permeability
Protocol: Quantitative Assessment of Barrier Function in 3D Cultures
This protocol adapts methodologies from quantitative imaging platforms for evaluation of therapeutic response in 3D tumour models [17]:
- Culture Preparation: Plate cells using ECM overlay method on growth factor-reduced Matrigel in glass-bottom multiwell imaging plates. Allow formation of adherent multicellular 3D acini (typically 5-7 days).
- Treatment Groups: Assign cultures to control (no treatment, NT) and experimental groups. Include total killing (TK) controls (fixed and permeabilized) to establish baseline signals.
- Staining: Incubate with fluorescent vital dyes (e.g., calcein AM for esterase activity, ethidium bromide for membrane permeability) for 30-45 minutes at physiological conditions.
- Image Acquisition: Using automated microscopy, acquire multiple spatial fields (e.g., 96 fields at 512×512 resolution) with brightfield and fluorescence channels. Maintain consistent acquisition parameters across all samples.
- Image Analysis: Segment individual nodules and quantify fluorescence signals. Apply background correction using TK controls. Calculate scaling factor (Ï•) based on NT and TK controls for each experiment: Ï• = (SignaldeadTK - SignalliveTK) / (SignalliveNT - SignaldeadNT).
- Viability Calculation: Compute viability as Live / (Live + ϕ × Dead) for each nodule, where Live and Dead represent background-corrected fluorescence intensities.
- Heterogeneity Assessment: Analyze distribution of viabilities across all nodules to identify sub-populations with differential permeability.
Protocol: Optimization of Image Acquisition to Minimize Background
Based on established practices for quantitative fluorescent imaging [18]:
- Determine Optimal Sampling Rate: Calculate required sampling density based on size of structures of interest. For nerve varicosities of ~2μm diameter, sampling density = Structure size / 2.3 = ~0.86 μm/pixel.
- Select Appropriate Objective Lens: Balance numerical aperture (NA) and resolution needs. For structures >2μm, even lower NA lenses (10×/0.4 NA) provide sufficient resolution while potentially reducing photobleaching.
- Configure Optical Section Thickness: Adjust pinhole size in confocal systems to optimize signal-to-noise ratio. Thinner optical sections may reduce background but require longer acquisition times.
- Establish Linear Range: Verify detector settings ensure signals are within linear response range to prevent saturation or loss of low-intensity signals.
- Process Images for Background Reduction: Apply consistent background subtraction across all images. Use segmentation algorithms appropriate for object morphology. Implement watershedding to separate clustered objects.
- Validate Quantification: Compare manual and automated counts for subset of images to ensure processing parameters do not introduce bias.
Visualization of Permeability Barriers and Experimental Workflows
Signaling Pathways in Endothelial Barrier Function
Experimental Workflow for Permeability Assessment
Permeability Barrier Effects on Reagent Distribution
Proactive Protocol Design: Methodological Strategies to Minimize Background from the Start
The success of whole-mount in situ hybridization (WISH) and related techniques hinges critically on the initial fixation step. Effective fixation must achieve a delicate balance: preserving cellular morphology and tissue architecture while simultaneously maintaining the accessibility of nucleic acid targets to molecular probes. When this balance is not struck, one of the most common and detrimental outcomes is high background staining, which obscures specific signals and compromises data interpretation. Background staining in WISH arises from multiple factors including inadequate fixation leading to probe entrapment, incomplete removal of unbound probe due to poor tissue permeability, and non-specific interactions between probes and cellular components. This technical guide examines current optimization strategies that address these challenges, with a focus on maximizing signal-to-noise ratio in complex biological samples.
Core Principles of Fixation Chemistry
Chemical fixatives function primarily through protein crosslinking or precipitation, creating a stable matrix that preserves structural integrity. The most widely used fixatives in WISH protocols are aldehydes, particularly paraformaldehyde (PFA) and formalin, which create methylene bridge crosslinks between primary amines on proteins and nucleic acids [20]. While effective for morphology preservation, over-fixation with PFA can cause excessive crosslinking that physically blocks probe access to target sequences, reducing hybridization efficiency and increasing background through non-specific trapping of probes in dense tissue regions [20] [9].
Alternative fixatives offer different advantages and limitations. Glutaraldehyde provides stronger crosslinking than PFA but penetrates tissue more slowly and can significantly modify tissue architecture [20]. Precipitating fixatives like ethanol and methanol coagulate large protein molecules without crosslinking, which may improve probe accessibility for some targets but provides inferior ultrastructural preservation [20]. The choice of fixative must therefore be tailored to both the sample type and the specific molecular targets being investigated.
Optimized Fixation Protocols
Enhanced Aldehyde Formulations
Recent research has demonstrated that mixed aldehyde formulations can significantly improve results in challenging applications. A glyoxal-PFA combination has shown particular promise for detecting nuclear body RNAs while preserving protein epitopes [21]. The optimized formulation (0.4% glyoxal + 4% PFA + 0.1% methanol) enhances probe accessibility without introducing autofluorescence, yielding significantly brighter FISH signals for various RNA species including NEAT1, MALAT1, and polyadenylated RNAs [21].
Table 1: Performance Comparison of Fixative Formulations for RNA FISH
| Fixative Formulation | Signal Intensity | Background Uniformity | Morphology Preservation | Best Applications |
|---|---|---|---|---|
| 4% PFA (standard) | Baseline | Moderate | Excellent | General WISH, protein detection |
| 0.4% GO + 4% PFA + 0.1% MeOH | ~2x increase | High (low SD) | Excellent | Nuclear RNAs, low-abundance targets |
| 3% GO + 20% EtOH | Moderate increase | Moderate | Good | Combined RNA/protein detection |
| 0.1% GA + 4% PFA | Mild increase | Moderate | Excellent | EM studies, superior morphology |
The improvement observed with glyoxal-PFA fixation appears to stem from enhanced cell permeability and probe accessibility rather than direct effects on hybridization efficiency. Time-lapse imaging demonstrates significantly faster penetration of DAPI into nuclei fixed with GO/PFA compared to PFA alone, with both increased penetration rate and higher plateau intensity [21]. This improved permeability allows more efficient probe delivery and washing, directly reducing non-specific background staining.
Supplementary Treatments for Challenging Tissues
Certain tissues present unique challenges for WISH due to their inherent properties. In regenerating tails of Xenopus laevis tadpoles, pigment granules (melanosomes) actively migrate to amputation sites and can interfere with colorimetric detection [10]. Additionally, loose fin tissues tend to trap staining reagents, causing high background. An optimized protocol addressing these issues includes:
- Early photo-bleaching: Performed after fixation in MEMPFA and rehydration to decolorize melanosomes and melanophores without compromising RNA integrity [10]
- Tail fin notching: Creating precise incisions in a fringe-like pattern at a distance from the area of interest dramatically improves reagent washout from loose fin tissues, preventing non-specific chromogenic reactions even after 3-4 days of staining [10]
This combined approach enables high-contrast imaging of low-abundance targets like mmp9 mRNA during early regeneration stages, revealing spatial and temporal expression patterns that were previously obscured by background interference [10].
Optical Clearing for Enhanced Probe Accessibility
For thick tissue samples, optical clearing techniques can significantly improve probe penetration and washing efficiency, thereby reducing background. The 3D-LIMPID-FISH method uses a hydrophilic clearing solution containing saline-sodium citrate, urea, and iohexol to match the refractive index of the tissue [9]. This approach:
- Preserves most lipids and minimizes tissue swelling/shrinking
- Maintains compatibility with both FISH probes and antibody staining
- Enables high-resolution imaging deep within thick tissues (up to 250μm) without physical sectioning
- Facilitates multiplexed imaging of both mRNA and protein targets within the same sample [9]
Diagram 1: Fixation impact on WISH background and signal intensity.
Experimental Protocols
Materials:
- 4% PFA in 0.1M phosphate buffer (pH 7.4)
- Glyoxal solution (40%)
- Methanol
- Phosphate-buffered saline (PBS)
Procedure:
- Prepare fixation solution fresh: Combine 4% PFA, 0.4% glyoxal, and 0.1% methanol in PBS.
- Fix cell cultures or tissue samples for 15-30 minutes at room temperature.
- Rinse three times with PBS (5 minutes each).
- Proceed with standard WISH or FISH protocols without proteinase K treatment.
- For samples with high lipid content, consider adding a delipidation step (30-60 minutes in 0.5% Triton X-100) before hybridization.
Validation:
- Test penetration efficiency using DAPI time-lapse imaging
- Compare signal intensity for a housekeeping RNA (e.g., 18S rRNA) against PFA-only controls
- Verify background uniformity by measuring fluorescence intensity in non-target regions
Materials:
- MEMPFA fixation solution
- Hydrogen peroxide bleaching solution
- Proteinase K solution
Procedure:
- Fix samples in MEMPFA for 2-4 hours at room temperature.
- Dehydrate through ethanol series (25%, 50%, 75%, 100%).
- Bleach samples in Hâ‚‚Oâ‚‚ solution under bright light until pigment is removed.
- Rehydrate through descending ethanol series.
- Create fine notches in loose tissue areas (e.g., fin edges) using micro-scissors.
- Perform standard WISH with reduced proteinase K incubation (10-15 minutes).
- Extend washing steps post-hybridization (4-5 changes over 6-8 hours).
Validation:
- Compare mmp9 expression patterns at 0, 3, 6, and 24 hours post-amputation
- Assess background in fin regions adjacent to notched areas
- Verify tissue integrity after notching through histological staining
Research Reagent Solutions
Table 2: Essential Reagents for Optimized Fixation Protocols
| Reagent | Function | Optimized Concentration | Key Considerations |
|---|---|---|---|
| Paraformaldehyde (PFA) | Primary crosslinking fixative | 4% in buffer | Prepare fresh from powder; avoid methanol-stabilized solutions |
| Glyoxal | RNA denaturation, enhanced permeability | 0.4% with PFA | Sterically hinders G-C base pairs; improves probe access |
| Methanol | Fixation accelerator | 0.1% with GO/PFA | Enhances GO-based fixation without acting alone |
| Glutaraldehyde | Strong crosslinking | 0.1-0.5% with PFA | Use for superior morphology; may require quenching |
| Proteinase K | Protein digestion, epitope unmasking | 1-10μg/mL | Titrate carefully; over-digestion damages morphology |
| Triton X-100 | Permeabilization | 0.1-0.5% | Improves probe penetration; extract lipids |
| Formamide | Hybridization stringency | 10-50% in buffer | Denatures RNA secondary structure; concentration affects specificity |
Integration with Advanced Methodologies
Optimized fixation protocols provide particular benefits for emerging spatial transcriptomics technologies. Methods like MERFISH (Multiplexed Error-Robust Fluorescence In Situ Hybridization) depend on efficient probe binding to achieve high detection efficiency and low false-positive rates [22]. Recent systematic optimization of MERFISH parameters has revealed that signal brightness depends significantly on hybridization conditions and probe design [22].
For MERFISH and related methods, fixation must preserve RNA integrity while maintaining accessibility for encoding probes containing targeting regions (20-50 nt) and readout sequences. The GO/PFA approach shows particular promise for these applications, as the enhanced permeability benefits the sequential hybridization rounds required for barcode readout [22]. Additionally, the move toward combined molecular profiling—simultaneous detection of RNA via FISH and proteins via immunohistochemistry—further emphasizes the need for balanced fixation that preserves multiple macromolecular species without compromising accessibility [9].
Diagram 2: Strategic approaches to reduce WISH background staining.
Effective fixation for whole-mount in situ hybridization requires moving beyond standardized protocols to embrace sample-specific optimization. The fundamental challenge of balancing structural preservation with molecular accessibility can be addressed through innovative fixative formulations like glyoxal-PFA combinations, supplementary physical processing methods such as tissue notching, and integration with optical clearing techniques. As spatial transcriptomics and multi-omics approaches continue to evolve, the development and implementation of these optimized fixation procedures will play an increasingly critical role in minimizing background staining while maximizing the biological insights gained from each experiment.
Effective tissue permeabilization is a critical determinant of success in whole mount in situ hybridization (WMISH), directly influencing both signal intensity and background staining—the primary challenge in obtaining interpretable results. The fundamental purpose of permeabilization is to enable nucleic acid probes to access their target sequences while maintaining structural integrity, a balance that requires precise optimization of enzymatic and chemical treatments. Inadequate permeabilization results in weak or false-negative signals due to poor probe penetration, whereas excessive treatment degrades tissue morphology and increases non-specific background staining [23] [24]. This technical guide examines advanced permeabilization methodologies within the context of a broader thesis: that optimizing proteinase K digestion and acid treatments represents the most critical step in minimizing background staining while ensuring efficient probe penetration in complex biological specimens.
The relationship between permeabilization and background staining manifests through multiple mechanisms. Insufficiently digested tissues retain physical barriers that trap probes non-specifically, while over-digestion exposes charged molecular motifs that bind probes indiscriminately [25]. Furthermore, tissues with high endogenous protein content or specialized extracellular matrices require customized permeabilization strategies to overcome unique accessibility challenges. The following sections provide quantitative guidance and detailed protocols for achieving this balance across diverse experimental systems, with particular emphasis on proteinase K titration and complementary treatments that have demonstrated efficacy in reducing background staining while enhancing signal-to-noise ratios.
Quantitative Analysis of Permeabilization Parameters
Table 1: Proteinase K Concentration and Digestion Time Optimization Across Biological Systems
| Biological System | Developmental Stage/Tissue Type | Proteinase K Concentration | Digestion Time | Temperature | Key Findings |
|---|---|---|---|---|---|
| Xenopus laevis tadpole tail [1] | Regenerating tail (stage 40) | 10 μg/mL | 30 minutes | Room temperature | Extended digestion time increased sensitivity but required fin notching to reduce background |
| Mouse embryos [5] | Whole mount (E14.5) | 10 μg/mL | Not specified | Not specified | Used in pretreatment solution for whole mount in situ hybridization |
| Mouse embryo sections [5] | Tissue sections | 20 μg/mL | Not specified | Not specified | Higher concentration used for sectioned tissues |
| Lymnaea stagnalis larvae [25] | 2-3 days post first cleavage | 10 μg/mL | 10 minutes | Room temperature | Part of optimized WMISH protocol with additional permeabilization steps |
| Pea aphid embryos [26] | Early, middle, and late-stage embryos | Varied by stage | Titrated by tissue thickness | Not specified | Conditions optimized based on tissue thickness and developmental stage |
| General ISH troubleshooting [23] | Most tissues | Not specified | 3-10 minutes | 37°C | Under-digestion decreases or eliminates signal; over-digestion weakens signal and prevents counterstaining |
Table 2: Acid and Chemical Treatment Parameters for Enhanced Permeabilization
| Treatment Type | Concentration | Duration | Biological Systems | Effect on Background |
|---|---|---|---|---|
| Hydrochloric Acid (HCl) [24] | Diluted solution | Not specified | General ISH applications | Increases hybridization signal when combined with protease treatment |
| Triethanolamine (TEA) + Acetic Anhydride [5] [25] | 0.1 M TEA + 0.25% acetic anhydride | 10 minutes | Mouse embryos, Lymnaea stagnalis | Reduces tissue-specific background staining, particularly in shell field |
| SDS Treatment [25] | 0.1-1% in PBS | 10 minutes | Lymnaea stagnalis larvae | Significant improvement in signal intensity without morphological damage |
| Reduction Solution (DTT + SDS + NP-40) [25] | 0.1X to 1X | 10 minutes | Lymnaea stagnalis larvae | Greatly increases signal intensity but makes tissues extremely fragile |
| N-acetyl-L-cysteine (NAC) [25] | 2.5-5% | 5-10 minutes | Lymnaea stagnalis larvae | Degrades mucosal layer, improving probe accessibility |
Proteinase K Digestion: Mechanisms and Methodologies
Biochemical Mechanism and Rationale
Proteinase K, a broad-spectrum serine protease, catalyzes the cleavage of peptide bonds adjacent to the carboxyl group of aliphatic and aromatic amino acids, effectively digesting proteins that surround target nucleic acids and creating channels for probe penetration [24]. This enzymatic digestion is particularly crucial for disrupting cellular membranes and extracellular matrix components that would otherwise function as physical barriers to hybridization. The efficacy of proteinase K stems from its remarkable stability across a wide temperature range (up to 65°C) and its ability to maintain activity in the presence of denaturing agents such as SDS and EDTA, making it ideally suited for the harsh conditions often required for tissue pretreatment [26].
The relationship between proteinase K concentration and background staining follows a biphasic response curve. At suboptimal concentrations, incomplete permeabilization occurs, leading to heterogeneous probe accessibility that manifests as both weak specific signals and moderate background staining in partially digested regions. As concentration increases, optimal permeabilization is achieved with maximal target accessibility and minimal non-specific binding. However, supra-optimal concentrations over-digest tissues, exposing charged internal components that bind probes indiscriminately while simultaneously compromising tissue integrity, resulting in severely elevated background staining and morphological deterioration [23] [25]. This nonlinear response necessitates empirical optimization for each biological system and developmental stage.
Standardized Proteinase K Digestion Protocol
The following protocol represents a optimized methodology for proteinase K digestion in WMISH applications, synthesized from multiple established techniques [5] [1] [25]:
Post-Fixation Processing: Following fixation in 4% paraformaldehyde and thorough washing in PBT (PBS with 0.1% Tween-20), rehydrate samples through a graded methanol series (25%, 50%, 75% methanol in PBT) if stored in methanol at -20°C. Perform three 5-minute washes in PBT to ensure complete removal of organic solvents.
Proteinase K Working Solution Preparation: Prepare a fresh dilution of proteinase K from stock solution (typically 10-20 mg/mL) in PBT to achieve a working concentration appropriate for your tissue type (see Table 1 for guidance). For sensitive tissues, begin with lower concentrations (1-5 μg/mL) and incrementally increase until optimal permeabilization is achieved.
Digestion Reaction: Incubate samples in proteinase K solution with gentle agitation. For most tissues, digestion at room temperature for 10-30 minutes provides sufficient permeabilization without excessive morphological damage. Monitor digestion carefully, as overtreatment can irreversibly damage tissue architecture [23].
Digestion Termination: Carefully remove proteinase K solution and immediately stop the reaction by washing samples in 2 mg/mL glycine in PBT for 5 minutes. Glycine functions as an effective protease inhibitor by competing for the enzyme's active site.
Post-Digestion Fixation: To stabilize permeabilized tissues and prevent structural collapse, perform brief post-fixation in 4% PFA for 20 minutes at room temperature. This step crosslinks proteins exposed during digestion without significantly reducing probe accessibility.
Acetylation (Optional but Recommended): For tissues with persistent background issues, particularly those with high endogenous phosphatase activity or charged extracellular matrices, incubate samples in 0.1% triethanolamine (TEA) containing 0.25% acetic anhydride for 10 minutes with constant mixing. This acetylation reaction neutralizes positive charges on amine groups that would otherwise bind negatively charged probes non-specifically [5] [25].
Complementary Permeabilization Techniques
Acid Treatments for Enhanced Probe Accessibility
Hydrochloric acid (HCl) treatment serves as a complementary permeabilization strategy that functions through distinct mechanisms from enzymatic digestion. Dilute HCl (typically 0.01-0.1M) partially hydrolyzes peptide bonds and demineralizes calcified tissues, while also protonating carboxyl groups and neutralizing negative charges that contribute to electrostatic background binding [24]. This treatment is particularly valuable for tissues with extensive extracellular matrix deposition or chitinous structures that resist enzymatic digestion alone. The combination of proteinase K with HCl treatment has demonstrated synergistic effects in challenging specimens, likely due to the sequential action on proteinaceous and mineralized barriers respectively.
Detergent-Based Permeabilization Strategies
Detergents function as chemical permeabilization agents through solubilization of lipid membranes and disruption of hydrophobic interactions within tissues. The optimized WMISH protocol for Lymnaea stagnalis systematically compared different detergent treatments and established that 0.1% SDS incubation for 10 minutes significantly improved signal intensity without morphological damage [25]. The "reduction" treatment (combining the reducing agent DTT with detergents SDS and NP-40) produced even greater signal enhancement but rendered tissues extremely fragile, requiring exceptionally careful handling. These findings demonstrate that detergent concentration must be balanced against structural preservation requirements, with lower concentrations (0.05-0.1% SDS) generally recommended for delicate embryonic tissues.
Diagram 1: Permeabilization optimization workflow for different tissue types. The pathway illustrates how to select and sequence treatments based on tissue characteristics and troubleshooting outcomes.
Integrated Experimental Workflows
Case Study: Optimized Permeabilization for Challenging Tissues
The regenerative tadpole tail system of Xenopus laevis presents exceptional challenges for WMISH due to rapid cellular migration, dense pigmentation, and loose fin tissues prone to background staining [1]. Through systematic optimization, researchers developed an integrated permeabilization workflow that combines proteinase K digestion with specialized physical and chemical treatments:
Initial Processing: Fix regenerating tail samples in MEMPFA (4% PFA, 2mM EGTA, 1mM MgSOâ‚„, 100mM MOPS pH 7.4) for 30 minutes at room temperature.
Photobleaching: To address melanosome interference with colorimetric detection, treat fixed samples with photobleaching solution under bright light to decolorize pigment granules that obscure specific staining.
Physical Permeabilization: Carefully notch the caudal fin in a fringe-like pattern using fine microscissors, creating channels that enhance reagent penetration and washout from loose fin tissues where background staining typically accumulates.
Proteinase K Digestion: Incubate samples in 10μg/mL proteinase K for 30 minutes at room temperature, with precise timing to avoid over-digestion of the delicate regenerating tissues.
Hybridization and Stringency Washes: Perform standard hybridization followed by stringent washes at elevated temperature (65-75°C) in SSC buffer to remove non-specifically bound probes [23] [1].
This integrated approach demonstrated that physical modification of tissue architecture (fin notching) combined with optimized proteinase K digestion enabled specific detection of low-abundance transcripts like mmp9 while virtually eliminating the background staining that plagued previous methodologies.
Systematic Optimization for Molluscan Embryos
The development of an optimized WMISH protocol for the mollusc Lymnaea stagnalis provides a comprehensive framework for addressing tissue-specific permeabilization challenges [25]. Researchers systematically evaluated multiple permeabilization strategies across developmental stages:
Mucolytic Pretreatment: Incubate embryos in 2.5-5% N-acetyl-L-cysteine for 5-10 minutes to degrade viscous intra-capsular fluid that adheres to embryos and impedes probe penetration.
Detergent Permeabilization: Treat with 0.1% SDS for 10 minutes to solubilize membranes without excessive morphological damage.
Proteinase K Titration: Digest with 10μg/mL proteinase K for precisely 10 minutes at room temperature, with timing adjusted based on developmental stage (shorter for early stages, longer for later stages with more developed extracellular matrix).
Acetylation: Incubate in 0.1M triethanolamine with 0.25% acetic anhydride for 10 minutes to neutralize positive charges that cause non-specific probe binding, particularly effective against background staining in the larval shell field.
This systematic approach revealed that the combination of NAC pretreatment followed by SDS and optimized proteinase K digestion produced the most significant improvements in signal-to-noise ratio across all developmental stages and for multiple genes with varying expression levels.
The Researcher's Toolkit: Essential Reagents for Permeabilization Optimization
Table 3: Essential Research Reagents for Advanced Permeabilization Techniques
| Reagent | Chemical Category | Working Concentration | Primary Function | Mechanism of Action |
|---|---|---|---|---|
| Proteinase K [23] [5] [1] | Serine protease | 1-20 μg/mL | Enzymatic digestion | Cleaves peptide bonds to disrupt protein barriers around nucleic acid targets |
| N-acetyl-L-cysteine (NAC) [25] | Mucolytic agent | 2.5-5% | Mucous disruption | Degrades mucosal layers and viscous extracellular materials by disrupting disulfide bonds |
| Sodium Dodecyl Sulfate (SDS) [25] | Ionic detergent | 0.1-1% | Membrane solubilization | Disrupts lipid membranes and protein-protein interactions through charge-based solubilization |
| Dithiothreitol (DTT) [25] | Reducing agent | 0.1-10 mM | Disulfide bond reduction | Cleaves disulfide bonds in proteins and extracellular matrices, increasing tissue porosity |
| Triethanolamine (TEA) + Acetic Anhydride [5] [25] | Acetylating agents | 0.1M TEA + 0.25% acetic anhydride | Charge neutralization | Acetylates primary amine groups to eliminate positive charges that cause non-specific probe binding |
| Hydrochloric Acid (HCl) [24] | Mineral acid | 0.01-0.1M | Demineralization & hydrolysis | Partially hydrolyzes proteins and demineralizes calcified tissues while protonating carboxyl groups |
| Glycine [23] [5] | Amino acid | 2 mg/mL | Reaction termination | Competes for proteinase K active site, rapidly terminating enzymatic digestion |
| 30-Oxopseudotaraxasterol | 30-Oxopseudotaraxasterol, CAS:160481-71-0, MF:C30H48O2, MW:440.7 g/mol | Chemical Reagent | Bench Chemicals | |
| Phyperunolide E | Phyperunolide E, CAS:1198400-52-0, MF:C28H40O9, MW:520.6 g/mol | Chemical Reagent | Bench Chemicals |
Diagram 2: Integrated permeabilization workflow with background reduction mechanisms. The diagram shows the sequence of treatments and how specific interventions reduce background staining at critical points in the protocol.
Advanced permeabilization techniques centered on optimized proteinase K digestion represent the cornerstone of effective WMISH experimentation with minimal background staining. The quantitative data and methodological details presented in this technical guide demonstrate that successful permeabilization requires systematic optimization of multiple parameters including enzyme concentration, duration, complementary chemical treatments, and sometimes physical modifications to tissue architecture. The consistent finding across diverse biological systems is that permeabilization must be precisely balanced—neither insufficient nor excessive—to maximize probe accessibility while minimizing non-specific binding events that manifest as background staining.
The integrated approaches described herein, particularly those combining proteinase K with detergent treatments, mucolytic agents, and charge-neutralizing acetylation, provide robust frameworks for adapting WMISH to challenging model systems. As the field continues to advance toward higher sensitivity detection and more complex multiplexed assays, these permeabilization fundamentals will remain essential for generating reliable, interpretable spatial gene expression data. Researchers are encouraged to use the tabulated parameters as starting points for further optimization specific to their biological systems, with particular attention to the stage-dependent and tissue-specific variations that significantly impact permeabilization efficacy.
In whole mount in situ hybridization (WISH), background staining represents a significant technical challenge that can obscure specific signal and compromise data interpretation. This non-specific staining arises from multiple sources, including electrostatic interactions between probe and tissue components, hydrophobic adsorption of reagents, and endogenous enzymatic activities [27] [28]. Within the context of a broader thesis on what causes background staining in WISH research, it is essential to understand that effective blocking is not merely an optional step but a critical component for generating reliable, publication-quality data. The complex three-dimensional nature of whole mount specimens further exacerbates these challenges, as reagents can become trapped in loose tissues or interstitial spaces, creating persistent background issues that are particularly difficult to eliminate [1]. This technical guide examines two cornerstone chemical blocking strategies—triethanolamine/acetic anhydride treatment and serum-based blocking—that collectively address the principal mechanisms underlying non-specific staining in WISH experiments.
Core Mechanisms of Background Staining
Understanding the fundamental causes of background staining is prerequisite to selecting appropriate blocking strategies. The primary mechanisms fall into three distinct categories:
Electrostatic Interactions: Nucleic acid probes carry a strong negative charge that can facilitate non-specific binding to positively charged tissue components such as basic proteins and cellular membranes [28]. This charge-based attraction is particularly problematic in tissues with high protein content or dense cellular architecture.
Hydrophobic Adsorption: Detection reagents, including antibodies and conjugated enzymes, can adhere nonspecifically to hydrophobic regions on proteins and lipids within tissue samples through van der Waals forces [27]. This binding mode is especially prevalent in tissues with high lipid content or membrane-rich structures.
Endogenous Activities: Tissues may contain endogenous enzymes such as peroxidases and phosphatases that can react with chromogenic substrates, generating signal independent of specific probe hybridization [29]. Additionally, endogenous biotin present in certain tissues (e.g., liver, kidney) can interfere with detection systems utilizing biotin-streptavidin chemistry.
Table 1: Primary Sources of Background Staining in WISH
| Source Type | Specific Cause | Tissues Most Affected |
|---|---|---|
| Charge-based | Electrostatic probe binding | Tissues with high protein content |
| Hydrophobic | Antibody adsorption to lipids | Membrane-rich cellular structures |
| Enzymatic | Endogenous peroxidases | Bloody tissues, bone marrow, spleen |
| Enzymatic | Endogenous alkaline phosphatase | Kidney, lymphoid tissues |
| Molecular | Endogenous biotin | Liver, kidney, heart, brain |
Strategic Approach to Blocking
Effective blocking requires a sequential, layered approach that addresses different nonspecific binding mechanisms at appropriate stages throughout the WISH protocol. The strategic application of specific blockers before, during, and after hybridization ensures comprehensive background reduction while preserving specific signal.
Figure 1: Strategic Approach to Background Blocking. This diagram illustrates the relationship between specific causes of background staining and their corresponding blocking solutions, highlighting the targeted nature of effective background reduction strategies.
Triethanolamine/Acetic Anhydride Treatment
Mechanism of Action
The triethanolamine/acetic anhydride treatment specifically addresses electrostatic interactions that contribute to background staining. This method functions through acetylation of primary amine groups (-NHâ‚‚) present on tissue proteins and cellular components [30]. The triethanolamine serves as a buffer to maintain an optimal alkaline pH (typically pH 8.0) for the acetylation reaction, while acetic anhydride provides the acetyl groups that covalently modify positively charged amines. This chemical modification neutralizes the positive charges that would otherwise attract the negatively charged phosphate backbone of nucleic acid probes, thereby significantly reducing non-specific electrostatic binding [30].
Detailed Protocol
The triethanolamine/acetic anhydride treatment is typically performed after proteinase K digestion and refixation steps, immediately before the prehybridization stage.
Solution Preparation: Prepare 0.1M triethanolamine (TEA) solution in DEPC-treated water. Adjust pH to 8.0 with hydrochloric acid (HCl) to ensure optimal reaction conditions [30].
Acetylation Reaction: Immediately before use, add acetic anhydride to the TEA solution at a final concentration of 0.25% (v/v). For a 100 mL working solution, add 250 μL of acetic anhydride while stirring vigorously. The acetic anhydride must be freshly added as it hydrolyzes rapidly in aqueous solutions.
Sample Incubation: Transfer fixed and rehydrated specimens to the TEA/acetic anhydride solution. Incubate with gentle agitation for 10-15 minutes at room temperature. The reaction proceeds rapidly, with acetylation occurring within minutes.
Termination and Washing: Remove the acetylation solution and rinse specimens thoroughly with phosphate-buffered saline (PBS) or hybridization buffer to stop the reaction and remove excess reagents. Proceed immediately to prehybridization steps.
Table 2: Triethanolamine/Acetic Anhydride Protocol Parameters
| Parameter | Specification | Notes |
|---|---|---|
| Triethanolamine Concentration | 0.1 M | Prepared in DEPC-treated water |
| pH | 8.0 | Adjusted with HCl |
| Acetic Anhydride Concentration | 0.25% (v/v) | Added fresh immediately before use |
| Incubation Time | 10-15 minutes | With gentle agitation |
| Temperature | Room temperature | 20-25°C |
| Optimal Timing in Protocol | Post-proteinase K, pre-hybridization | After refixation |
Serum-Based Blocking Strategies
Mechanism of Action
Serum blocking operates through multiple mechanisms to reduce hydrophobic and charge-based nonspecific binding. Serum contains a diverse mixture of proteins—primarily albumin, immunoglobulins, and other serum components—that compete with detection reagents for nonspecific binding sites on tissue surfaces [28] [29]. The proteins in serum effectively "saturate" hydrophobic pockets and charged regions that might otherwise adsorb detection antibodies or probes. A critical consideration is that the serum source should match the species in which the secondary antibody was raised rather than the primary antibody species [29]. This prevents the secondary antibody from recognizing nonspecifically bound serum proteins from the primary antibody host, which would significantly increase background.
Protocol Optimization
Effective serum blocking requires careful optimization of concentration, incubation conditions, and complementary blocking agents:
Serum Preparation: Use normal serum from the same species as the secondary antibody host at concentrations typically ranging from 1-5% (v/v) in an appropriate buffer such as PBS or Tris-buffered saline [28]. For enhanced blocking efficacy, combine serum with additional protein blockers like bovine serum albumin (BSA) at 1-2% or specialized commercial blocking reagents.
Blocking Conditions: Apply the serum blocking solution after all pretreatment steps and immediately before primary antibody incubation. Incubate samples for 30 minutes to several hours at room temperature, or overnight at 4°C for challenging specimens. Using a humidified chamber prevents evaporation and tissue drying, which can create severe background artifacts [27].
Complementary Blockers: For specific detection systems, incorporate additional blocking agents:
- For peroxidase-based systems: Include 3% hydrogen peroxide to quench endogenous peroxidase activity, particularly important in bloody tissues or those with high red blood cell content [29].
- For biotin-based detection: Use avidin/biotin blocking kits when working with tissues known to contain endogenous biotin (e.g., liver, kidney) [29].
- For alkaline phosphatase systems: Incorporate levamisole (2-5 mM) to inhibit endogenous alkaline phosphatase activity [29].
Integrated Experimental Workflow
A comprehensive WISH protocol strategically incorporates multiple blocking methods at different stages to systematically address all potential sources of background. The sequential application of these treatments creates a cumulative effect that maximizes signal-to-noise ratio while preserving morphological integrity.
Figure 2: Comprehensive WISH Protocol with Integrated Blocking Steps. This workflow diagram illustrates the sequential integration of key blocking steps within a complete WISH protocol, showing how different blocking strategies target specific background sources at optimal points in the experimental timeline.
Advanced Technical Considerations
Tissue-Specific Modifications
Different tissue types present unique challenges that require specialized blocking approaches:
Pigmented Tissues: For specimens with high melanin content (e.g., Xenopus tadpole tails), incorporate a bleaching step after fixation using hydrogen peroxide in formamide rather than methanol. This dramatically improves signal-to-noise ratio while simultaneously enhancing tissue permeability [1].
Loose Mesenchymal Tissues: Tissues with loose extracellular matrix (e.g., planarian parenchyma, tail fins) are prone to reagent trapping. Partial notching of fin edges or creating small incisions facilitates better reagent penetration and washing, significantly reducing trapping-related background [1].
Tissues with High Autofluorescence: For fluorescent in situ hybridization (FISH), treat specimens with copper sulfate in ammonium acetate buffer to effectively quench endogenous autofluorescence across a broad spectrum of wavelengths [31].
Quantitative Assessment of Blocking Efficacy
Systematic evaluation of blocking effectiveness is essential for protocol optimization and quality control. Researchers should monitor both positive controls (known expression patterns) and negative controls (sense probes, no-probe controls, or tissue lacking target antigen) when testing different blocking conditions [28]. The optimal blocking condition achieves the highest signal-to-noise ratio rather than merely the strongest signal.
Table 3: Troubleshooting Common Blocking Problems
| Problem | Possible Cause | Solution |
|---|---|---|
| Persistent high background | Insufficient serum blocking concentration | Increase serum concentration to 5-10%; extend blocking time |
| Patchy or uneven staining | Incomplete reagent coverage; tissue drying | Use humidified chamber; ensure full tissue immersion |
| Specific signal loss | Over-blocking; incompatible buffers | Titrate blocking reagents; ensure detection compatibility |
| Edge artifacts | Tissue section drying | Maintain hydration throughout procedure |
| Endogenous enzyme activity | Inadequate peroxidase/phosphatase blocking | Increase concentration of specific enzyme inhibitors |
The Scientist's Toolkit: Essential Research Reagent Solutions
Successful implementation of chemical blocking strategies requires a comprehensive set of specialized reagents, each serving specific functions in the background reduction process.
Table 4: Essential Reagents for Effective Blocking in WISH
| Reagent | Function | Application Notes |
|---|---|---|
| Triethanolamine | Alkaline buffer for acetylation reaction | Maintains pH 8.0 for optimal acetylation efficiency |
| Acetic Anhydride | Acetyl group donor for charge neutralization | Must be fresh; hydrolyzes rapidly in aqueous solution |
| Normal Serum | Competes for nonspecific binding sites | Source must match secondary antibody host species |
| Bovine Serum Albumin (BSA) | Protein blocker for hydrophobic sites | Use 1-2% in buffer; compatible with most detection systems |
| Hydrogen Peroxide | Quenches endogenous peroxidase activity | Critical for HRP-based detection in bloody tissues |
| Levamisole | Inhibits endogenous alkaline phosphatase | Ineffective against intestinal alkaline phosphatase |
| Avidin/Biotin Blocking Kit | Blocks endogenous biotin | Essential for liver, kidney, and other biotin-rich tissues |
| Roche Western Blocking Reagent | Proprietary blocking compound | Dramatically reduces background in challenging specimens [31] |
| Triton X-100 | Non-ionic detergent | Improves reagent penetration and washing efficiency [31] |
| Tween-20 | Mild detergent | Reduces hydrophobic interactions (typically 0.05-0.1%) [27] |
| Cannabisin F | Cannabisin F|SIRT1 Modulator|Anti-inflammatory Research | |
| A-9758 | A-9758, MF:C25H23Cl2F3N2O3, MW:527.4 g/mol | Chemical Reagent |
Chemical blocking strategies employing triethanolamine/acetic anhydride and serum represent foundational approaches to addressing the multifaceted problem of background staining in whole mount in situ hybridization. When strategically implemented within a comprehensive WISH protocol, these methods systematically target the primary mechanisms of nonspecific binding—electrostatic interactions, hydrophobic adsorption, and endogenous activities. The integration of these chemical blocking approaches with tissue-specific modifications and rigorous troubleshooting protocols enables researchers to achieve the high signal-to-noise ratios essential for accurate visualization and interpretation of gene expression patterns in complex three-dimensional specimens. As WISH methodologies continue to evolve toward increased sensitivity and multiplexing capabilities, these fundamental blocking strategies will remain indispensable tools for generating reliable, publication-quality data in developmental biology, disease modeling, and drug development research.
Background staining poses a significant challenge in whole mount in situ hybridization (WISH), potentially obscuring true positive signals and leading to misinterpretation of gene expression patterns. This technical guide examines the core principles of probe design and purification that are fundamental to minimizing nonspecific binding and reducing background noise. Within the context of a broader thesis on what causes background staining in WISH research, this whitepaper addresses how improper probe design—particularly failures in ensuring specificity and managing repetitive sequences—serves as a primary contributor to experimental artifacts. For researchers, scientists, and drug development professionals, mastering these design principles is crucial for generating reliable, reproducible data that accurately reflects spatial gene expression in complex biological systems.
Background staining in WISH arises from multiple technical factors, with probe-related issues representing a significant portion of experimental challenges. The complex three-dimensional nature of whole-mount samples presents unique difficulties compared to sectioned material, as reagents can become trapped in loose extracellular matrices and cavities, leading to persistent background signals that resist standard washing procedures [10].
A critical challenge specific to many model organisms involves endogenous pigments that interfere with signal detection. As noted in Xenopus laevis tadpole studies, "melanosomes (pigment granules) actively migrate with cells to the amputation site and can therefore interfere with the BM Purple stain signal" and "due to the numerous melanophores, visualization and photodetection of the staining signal are very difficult" [10]. These pigments can be mistaken for positive signals or can mask legitimate hybridization events, complicating data interpretation.
The fundamental causes of background staining related to probe design include:
- Non-specific probe binding: Probes with complementarity to off-target sequences bind to unrelated transcripts
- Repetitive sequence binding: Probes containing repetitive elements hybridize to multiple genomic loci
- Protein interaction: Electrostatic interactions between negatively charged probe backbones and cellular proteins
- Insufficient hybridization stringency: Conditions that allow probes to bind despite mismatches
- Probe self-complementarity: Probes that form dimers or higher-order structures that trap detection reagents
Understanding these mechanisms provides the foundation for developing effective probe design strategies that minimize background and enhance signal-to-noise ratios in WISH experiments.
Fundamental Principles of Probe Design for Specificity
Thermodynamic Considerations
Effective probe design requires careful attention to thermodynamic properties that govern hybridization behavior. The primary parameters include melting temperature (Tm), GC content, and probe length, all of which must be optimized to ensure specific binding to target sequences while minimizing off-target interactions.
Most probe design tools apply specific constraints to maintain consistent hybridization behavior across all probes in a set. As noted in evaluations of existing software, common limitations include "narrow default windows for melting temperature (Tm) and GC content" which can restrict the number of available probes for challenging targets [32]. The Stellaris platform, for instance, "first removes 17–22-mer candidates outside a narrow GC-content window" as an initial filtering step [32]. While these constraints help maintain uniform hybridization conditions, they may require adjustment for atypical target sequences.
Table 1: Optimal Thermodynamic Parameters for FISH Probes
| Parameter | Recommended Range | Impact on Specificity | Adjustment Strategies |
|---|---|---|---|
| Probe Length | 18-22 nucleotides | Shorter probes are more specific but have lower Tm; longer probes increase risk of off-target binding | Use 18-19mers for GC-rich targets; 21-22mers for AT-rich targets [33] |
| GC Content | 40-60% | Higher GC increases Tm but promotes non-specific binding; lower GC reduces stability | Create mixed-length probe sets for non-uniform targets [33] |
| Melting Temperature (Tm) | Consistent across probe set (±5°C) | Variable Tm causes inconsistent hybridization across probes | Vary probe length while maintaining Tm through GC adjustment |
| Probe Spacing | 1-2 nucleotides between adjacent probes | Closer spacing increases signal intensity but may cause steric hindrance | Default 2nt spacing, reduce to 1nt for difficult targets (except for CAL Fluor Red 635) [33] |
Strategies for Managing Repetitive Sequences
Repetitive sequences present a particular challenge for probe design, as they can hybridize to multiple genomic locations, creating widespread background staining. Most probe design platforms incorporate masking algorithms to handle this issue, though the stringency of these masks can often be adjusted to accommodate difficult targets.
The Stellaris designer "automatically masks simple repeats, species specific repeats, and sequences that appear many times throughout the selected genome" using five masking levels, with level 5 representing the most stringent [33]. When initial designs yield insufficient probes, systematically reducing the masking level can make more sequence available for probe design. However, this approach requires careful validation, as "decreasing the masking level may cause you to lose some protection from targeting pseudogenes and other similar sequences from the genome" [33].
For advanced applications, tools like TrueProbes implement more sophisticated repetitive element management through "genome-wide BLAST-based binding analysis with thermodynamic modeling to generate high-specificity probe sets" [32]. This comprehensive approach evaluates potential off-target binding across the entire genome rather than relying solely on repetitive element databases.
Computational Design Tools and Methodologies
Comparison of Probe Design Platforms
Several computational tools are available for designing FISH probes, each employing distinct algorithms and specificity filters. Understanding the strengths and limitations of each platform enables researchers to select the most appropriate tool for their specific application.
Table 2: Comparison of Probe Design Software Platforms
| Software | Specificity Assessment Method | Key Features | Limitations |
|---|---|---|---|
| Stellaris | Masking of repetitive sequences (5 levels) | User-friendly web interface, recommended minimum of 25 probes per set [33] | Sequential 5' to 3' design without global ranking [32] |
| TrueProbes | Genome-wide BLAST with expression weighting | Ranks all candidates by predicted specificity, incorporates thermodynamic-kinetic simulation [32] | Command-line interface, requires MATLAB |
| MERFISH | Hash-based comparison against transcriptome and rRNA | Computes off-target index, retains probes with RNA scores ≤ 0.7 [32] | Designed specifically for multiplexed error-robust FISH |
| Oligostan-HT | Gibbs free energy (ΔG°) calculation | Ranks probes by proximity to user-defined optimum ΔG° [32] | Limited off-target assessment compared to BLAST-based methods |
| PaintSHOP | Bowtie2 alignment + machine learning classifier | ML classifier predicts deleterious off-target duplex formation [32] | Complex workflow with multiple computational steps |
Advanced Specificity Enhancement Through Ligation
For applications requiring extreme specificity, ligation-based approaches can significantly reduce background from non-specific probe binding. Methods such as HybriSeq utilize "a ligation-based approach in which each probe is split into two parts and only ligated upon adjacent hybridization to the RNA target, using SplintR ligase that specifically acts on DNA-RNA hybrids" [34].
This approach leverages the requirement for spatial co-localization of two separate probe fragments, dramatically increasing specificity compared to single-probe hybridization. In quantitative assessments, this method demonstrated remarkable specificity with "nonspecific ligation events accounted for an average of 0.20% of UMIs per cell" [34], making it particularly valuable for detecting low-abundance transcripts where background signal would otherwise overwhelm true positive signals.
Experimental Validation of Probe Specificity
Post-Design Specificity Verification
Regardless of the design platform used, experimental validation of probe specificity remains essential. This is particularly critical when design parameters have been relaxed to generate sufficient probes for challenging targets. The recommended approach involves computational validation through BLAST analysis against the appropriate transcriptome.
As outlined in Stellaris design guidelines, researchers should "affix fasta headers to each oligo sequence and BLAST them against the transcriptome of the chosen organism" [33]. Probes with significant off-target complementarity should be removed from the set, with the guideline that "probes with 16 or more (assuming 20 nt probes) nucleotides complementarity to non-target RNAs are at risk of hybridizing and should be de-selected from the set" [33]. This validation step becomes "absolutely critical" when masking levels have been reduced to 2 or 1 to generate sufficient probes [33].
For the highest specificity requirements, TrueProbes implements a more comprehensive approach that "uses BLAST to enumerate off-targets, removes probes that bind to rRNA, and then calculates on-target and off-target binding energies for every oligo" [32]. This method ranks candidates by "the number of off-targets—optionally weighted by gene-expression data—and the difference of on-target to off-target plus self-hybridization energies" [32], providing a quantitative framework for probe selection.
Empirical Testing and Controls
In addition to computational validation, empirical testing using appropriate controls is essential for verifying probe specificity. Knockout cell lines or tissues lacking the target transcript provide the gold standard for assessing background signal, though researchers should be aware that "interpreting KO data can be complicated by compensatory shifts in the expression of the probes' off-target genes" [32].
The diagram below illustrates the complete workflow for probe design and validation, incorporating both computational and empirical elements:
The Scientist's Toolkit: Essential Research Reagents
Successful WISH experiments require careful selection of reagents and materials throughout the probe design, validation, and experimental processes. The following table outlines key reagents and their functions in ensuring probe specificity and reducing background staining.
Table 3: Essential Research Reagents for Specific WISH Experiments
| Reagent Category | Specific Examples | Function in Specificity Enhancement |
|---|---|---|
| Nucleic Acid Probes | Stellaris RNA FISH probes, HybriSeq split probes [34] [33] | Multiple probes per target increase signal; split probes with ligation enhance specificity |
| Hybridization Buffers | Formamide-containing buffers [9] | Control stringency of hybridization to reduce off-target binding |
| Bleaching Agents | Hydrogen peroxide [9] | Reduce tissue autofluorescence that can mask specific signal |
| Blocking Agents | Cot-1 DNA, yeast tRNA, poly-dIdC [35] [36] | Competitively inhibit non-specific binding of probes to repetitive elements or proteins |
| Enzymes | SplintR ligase [34], Proteinase K [10] | Ligase enables split-probe assembly; Proteinase K increases tissue permeability |
| Wash Buffers | Saline-sodium citrate (SSC) with varying stringency [9] | Remove non-specifically bound probes through controlled stringency |
| Clearing Agents | LIMPID solution (iohexol/urea) [9] | Reduce light scattering in thick samples to improve signal detection |
| Detection Reagents | BM Purple, fluorescent tyramides [10] | Generate visible signal specifically from hybridized probes |
| BI 653048 | BI 653048, CAS:1198784-72-3, MF:C23H25F4N3O4S, MW:515.5 g/mol | Chemical Reagent |
| PSB-0963 | PSB-0963, MF:C28H17N2O5S-, MW:493.5 g/mol | Chemical Reagent |
Effective probe design and purification represent foundational elements in reducing background staining and ensuring reliable results in whole mount in situ hybridization. By addressing the core principles of thermodynamic optimization, repetitive sequence management, and rigorous validation—both computational and empirical—researchers can significantly enhance the specificity of their probes and the quality of their experimental outcomes. As probe design technologies continue to evolve, with emerging platforms offering more sophisticated genome-wide specificity assessment and thermodynamic modeling, the scientific community can look forward to even greater capabilities in spatial gene expression analysis. For researchers in both basic science and drug development, mastery of these probe design principles enables more accurate interpretation of gene expression patterns and more confident conclusions about gene function in development, disease, and regeneration.
In whole-mount in situ hybridization (WISH), background staining represents a significant impediment to accurate data interpretation, particularly in complex tissues prone to non-specific probe interactions. This technical challenge is especially pronounced in regenerating tissue samples, such as Xenopus laevis tadpole tails, where loose mesenchymal tissues and pigment granules can trap reagents and obscure specific signals [10]. Background staining primarily arises from two fundamental molecular interactions: electrostatic attractions between charged molecules and hydrophobic associations between non-polar surfaces. Electrostatic interactions occur between the negatively charged nucleic acid backbone of the probe and positively charged components in the tissue or membrane, while hydrophobic interactions facilitate non-specific binding to lipid-rich cellular components [37]. Effective reduction of these non-specific interactions requires precisely formulated wash and hybridization buffers containing specific chemical modifiers that target each interaction type without compromising the specific hybridization signal essential for accurate gene expression visualization.
Buffer Components and Their Mechanisms of Action
Chemical Modifiers Targeting Electrostatic Interactions
Electrostatic interactions represent a primary source of non-specific binding in hybridization experiments. These occur between the negatively charged phosphate backbone of nucleic acid probes and positively charged molecules within biological samples. The strategic inclusion of specific ionic compounds in buffers can effectively mitigate these interactions:
Salts at High Concentration: Sodium chloride (NaCl) is routinely incorporated at concentrations ranging from 150 mM to 1 M to shield negative charges on the phosphate backbone of nucleic acids and reduce non-specific binding to positively charged surfaces [37]. The sodium ions (Naâº) neutralize the repulsive forces between the probe and target, while also competing for binding sites on tissue components.
Chaotropic Agents: Compounds like urea at 2-4 M concentrations disrupt hydrogen bonding and stabilize nucleic acids in solution, reducing their propensity for non-specific electrostatic interactions with sample components [37]. Guanidinium chloride represents another potent chaotrope that unfolds proteins and disrupts organized water structures, thereby minimizing non-specific adherence.
Cationic Salts: Tris buffer, commonly used in the 10-50 mM range, provides buffering capacity while its primary amine can help moderate electrostatic interactions [37]. Various ammonium, calcium, and magnesium salts can also be employed to compete for binding sites and reduce non-specific probe retention [37].
Chemical Modifiers Targeting Hydrophobic Interactions
Hydrophobic interactions drive non-specific binding through associations between non-polar regions of molecules, particularly problematic in lipid-rich cellular environments. Several classes of additives specifically address this challenge:
Detergents: Non-ionic detergents such as polysorbate 80 (Tween 80) are highly effective at disrupting hydrophobic interactions. These amphipathic molecules incorporate at hydrophobic interfaces, preventing non-specific adsorption of probes. Typical usage concentrations range from 0.1% to 1% [37]. Polysorbates and similar detergents solubilize lipid components without denaturing nucleic acid hybrids.
Organic Solvents: Isopropanol (10-30%) and ethanol (10-20%) reduce hydrophobic interactions by altering the dielectric constant of the solution, thereby diminishing the hydrophobic effect that drives non-specific associations [37]. These solvents must be carefully titrated to avoid compromising tissue integrity or specific hybridization.
Chaotropic Salts: In addition to their effects on electrostatic interactions, chaotropic agents like urea and guanidinium chloride also disrupt hydrophobic interactions by strengthening hydrogen bonding with water molecules, thereby reducing the hydrophobic effect that drives non-specific probe aggregation [37].
Hydrophilic Polymers: Polyethylene glycol and related compounds can be included to occupy hydrophobic pockets and create a more hydrophilic environment less conducive to non-specific binding through hydrophobic association [37].
Commercial Hybridization Buffer Systems
Several commercial hybridization buffers incorporate proprietary blends of accelerators and blocking agents to enhance specificity. For instance, ULTRAhyb Ultrasensitive Hybridization Buffer contains a specialized mixture that can increase sensitivity up to 100-fold for DNA probes and 20-fold for RNA probes while significantly reducing hybridization time to just 2 hours [38]. Similarly, the xGen Hybridization and Wash v3 Kit employs an optimized buffer system that enables hybridization times as short as one hour while maintaining high specificity, even with low input amounts (as little as 100 ng) [39]. These commercial systems typically incorporate specialized blocking agents that prevent common non-specific interactions.
Table 1: Buffer Components for Reducing Non-Specific Interactions
| Component | Concentration Range | Primary Mechanism | Interaction Targeted |
|---|---|---|---|
| Sodium Chloride | 150 mM - 1 M | Charge shielding | Electrostatic |
| Urea | 2 M - 4 M | Disruption of H-bonding | Both |
| Guanidinium Chloride | 1 M - 2 M | Protein denaturation/chaotropic | Both |
| Tris-HCl | 10 mM - 50 mM | Buffering/charge modulation | Electrostatic |
| Polysorbate 80 (Tween 80) | 0.1% - 1% | Surfactant action | Hydrophobic |
| Isopropanol | 10% - 30% | Alters dielectric constant | Hydrophobic |
| Ethylene Glycol | 5% - 15% | Reduces hydrophobic effect | Hydrophobic |
Quantitative Data on Buffer Efficacy
Impact on Experimental Outcomes
Rigorous testing of specialized wash buffers has demonstrated significant improvements in hybridization specificity and signal-to-noise ratios. Research on the xGen Hybridization and Wash v3 system revealed that optimized buffers maintain high performance metrics even with dramatically reduced hybridization times. Specifically, when compared to overnight hybridization, 1-hour and 2-hour hybridization periods with optimized buffers produced equivalent flanked-on target percentages and fold-80 base penalty metrics, demonstrating that proper buffer formulation can accelerate workflows without sacrificing data quality [39].
The critical importance of blocker compounds is quantitatively demonstrated in experiments showing that the inclusion of xGen Universal Blockers can substantially improve on-target rates. In one experiment using the xGen AML Cancer Hyb Panel, the use of appropriate blockers increased on-target rates by a statistically significant margin compared to reactions performed without blockers [39]. This highlights how specialized additives that prevent adapter cross-hybridization directly combat a specific source of background in hybridization capture experiments.
Table 2: Performance Metrics of Optimized vs. Standard Hybridization Buffers
| Performance Metric | Standard Buffer | Optimized Buffer (1-hr hyb) | Optimized Buffer (O/N hyb) |
|---|---|---|---|
| Flanked On-Target Percentage | 85% | 95% | 96% |
| Fold-80 Base Penalty | 1.5 | 1.2 | 1.1 |
| GC Skew Variation | High | Moderate | Low |
| Minimum Input DNA | 500 ng | 100 ng | 100 ng |
| Hybridization Time | 16-24 hours | 1-2 hours | 16-24 hours |
| On-Target Rate with Blockers | 60-70% | 85-95% | 85-95% |
Case Study: Enhanced Visualization in Regenerating Tadpole Tails
In WISH experiments on regenerating Xenopus laevis tadpole tails, implementation of optimized wash protocols yielded dramatic improvements in signal-to-noise ratios. The challenges were particularly pronounced due to melanosome migration to amputation sites and the loose fin tissue architecture that trapped staining reagents [10]. Through systematic optimization of both wash stringency and sample preparation, researchers achieved high-contrast visualization of mmp9+ cells with minimal background interference.
The most effective protocol variant combined early photo-bleaching (after MEMPFA fixation and dehydration) with strategic notching of the caudal fin before hybridization. This approach resulted in clear, specific detection of mmp9-expressing cells without the non-specific staining that had previously obscured results in earlier protocol iterations [10]. This case exemplifies how combining specialized wash buffers with appropriate sample preparation techniques can overcome even the most challenging background staining scenarios.
Experimental Protocols for Background Reduction
Optimized WISH Protocol for Challenging Tissues
The following protocol has been specifically optimized for regenerating Xenopus laevis tadpole tails, incorporating specialized washes to minimize electrostatic and hydrophobic interactions:
Sample Preparation:
- Fix samples in MEMPFA for 2 hours at room temperature.
- Dehydrate through methanol series (25%, 50%, 75%, 100%) with 10-minute incubations at each step.
- Bleach samples after rehydration to remove pigment interference [10].
- Create strategic incisions in fin tissue in a fringe-like pattern at a distance from the area of interest to improve reagent penetration and washing efficiency [10].
Proteinase K Treatment:
- Incubate with 10 μg/mL proteinase K in PBS for 15-20 minutes (duration optimized for tissue permeability without excessive degradation).
- Rinse briefly with PBS containing 0.1% Tween 20 to remove enzymes and cellular debris.
Pre-hybridization:
- Pre-hybridize for 1-4 hours at 65-70°C in hybridization buffer containing:
- 50% formamide
- 5× SSC
- 1% SDS
- 0.1% Tween 20
- 100 μg/mL heparin
- 100 μg/mL yeast tRNA
Hybridization and Washes:
- Hybridize with labeled antisense RNA probe in fresh hybridization buffer overnight at 65-70°C.
- Perform post-hybridization stringency washes:
- Wash 1: 50% formamide, 2× SSC, 0.1% Tween 20 at 65°C for 30 minutes
- Wash 2: 2× SSC, 0.1% Tween 20 at 65°C for 20 minutes
- Wash 3: 0.2× SSC, 0.1% Tween 20 at 65°C for 30 minutes (increased stringency)
- Wash 4: TBST (Tris-buffered saline with 0.1% Tween 20) at room temperature for 15 minutes
Detection:
- Block with 10% fetal bovine serum in TBST for 2-4 hours.
- Incubate with anti-digoxigenin antibody conjugated to alkaline phosphatase (1:5000 dilution) overnight at 4°C.
- Wash extensively with TBST (6× 20 minutes) to remove unbound antibody.
- Develop with BM Purple substrate, monitoring staining progression.
- Stop reaction with multiple changes of TBST and fix in 4% paraformaldehyde.
Troubleshooting High Background Staining
Despite optimized protocols, background staining may persist. The following troubleshooting guide addresses common issues:
High Uniform Background:
- Cause: Inadequate pre-hybridization blocking or insufficient stringency washes.
- Solution: Increase hybridization temperature by 3-10°C [38]. Extend pre-hybridization time to 1 hour [38]. Add high salt wash (5X SSC or SSPE, 0.5% SDS) for 15 minutes at appropriate temperature [38].
Speckled Background Pattern:
- Cause: Precipitates in hybridization or wash buffers.
- Solution: Pre-heat hybridization buffer thoroughly and ensure complete solubilization before use [38]. Filter buffers through 0.22μm membrane if precipitation persists.
Specific Tissue Background:
- Cause: Hydrophobic or electrostatic interactions with particular tissue components.
- Solution: Increase detergent concentration (up to 0.5% Tween 20) or include 1-2% isopropanol in wash buffers to disrupt hydrophobic interactions [37]. For electrostatic interactions, increase salt concentration or include 10-20 mM Tris buffer [37].
Visualization of Experimental Workflows
Diagram 1: Optimized WISH Experimental Workflow. This workflow highlights critical steps for reducing background, including fin notching to improve wash efficiency and specialized stringency washes to minimize non-specific interactions [10].
Diagram 2: Background Staining Sources and Mitigation Strategies. This diagram illustrates the primary sources of background staining in WISH experiments and the corresponding mechanisms through which specialized buffer components address each challenge [37] [10].
The Scientist's Toolkit: Essential Reagents for Background Reduction
Table 3: Research Reagent Solutions for Optimal Hybridization Specificity
| Reagent | Function | Application Notes |
|---|---|---|
| ULTRAhyb Ultrasensitive Hybridization Buffer | Proprietary blend of accelerators and blocking agents that enhance specific hybridization | Increases sensitivity up to 100x for DNA probes; enables 2-hour hybridization; contains 50% formamide [38] |
| xGen Universal Blockers | Single-stranded oligonucleotides that block adapter sequences | Prevents "daisy-chain" cross-hybridization; significantly improves on-target rates [39] |
| Proteinase K | Serine protease that increases tissue permeability | Digests proteins masking targets; concentration and time must be optimized for each tissue type [10] |
| Formamide | Denaturant that reduces hybridization temperature | Standard component at 50% concentration; enables specific hybridization at manageable temperatures |
| Polysorbate 80 (Tween 80) | Non-ionic detergent disrupting hydrophobic interactions | Use at 0.1-1% to reduce non-specific adsorption; compatible with enzymatic detection steps [37] |
| Sodium Chloride (NaCl) | Ionic strength modifier for electrostatic interactions | 150 mM - 1 M concentrations shield negative charges on nucleic acid backbones [37] |
| Urea | Chaotropic agent disrupting multiple interactions | 2-4 M concentrations disrupt hydrogen bonding and hydrophobic effects [37] |
| Heparin | Sulfated glycosaminoglycan used as blocking agent | Effective anionic polymer blocker at 100 μg/mL; competes for non-specific binding sites |
| Yeast tRNA | Nucleic acid competitor | Blocks non-specific probe binding to ribosomal and transfer RNA in samples |
| RBPJ Inhibitor-1 | RBPJ Inhibitor-1, MF:C17H14FN3O2, MW:311.31 g/mol | Chemical Reagent |
| VBIT-4 | VBIT-4, CAS:2086257-77-2, MF:C21H23ClF3N3O3, MW:457.9 g/mol | Chemical Reagent |
Specialized wash and hybridization buffers containing targeted components to reduce electrostatic and hydrophobic interactions represent essential tools for minimizing background staining in whole-mount in situ hybridization experiments. The strategic application of salts, chaotropic agents, detergents, and organic modifiers—when combined with appropriate sample preparation techniques and optimized hybridization conditions—enables researchers to achieve the high signal-to-noise ratios necessary for accurate visualization of gene expression patterns, even in challenging tissues like regenerating tadpole tails. As hybridization technologies continue to advance, further refinement of these biochemical solutions will undoubtedly expand the frontiers of detectable gene expression in complex biological systems.
Diagnosing and Resolving: A Systematic Troubleshooting Guide for Common Background Issues
In whole mount in situ hybridization (WMISH), a high uniform background is more than a simple nuisance; it is a significant technical barrier that can obscure true signal, lead to erroneous interpretation of gene expression patterns, and compromise experimental validity. Within the broader thesis of understanding background staining origins, inadequate washing and blocking procedures emerge as predominant, yet correctable, contributors to this problem. Background staining occurs when detection reagents bind non-specifically to tissues rather than exclusively to the probe-target hybrid [23]. This challenge is particularly pronounced in whole mount samples, where the three-dimensional nature of the tissue creates diffusion barriers and trapping sites for reagents that are difficult to eliminate through standard washing protocols [10]. The complex architecture of whole mount specimens means that loose connective tissues, such as the tail fins of Xenopus laevis tadpoles, can readily trap reagents, leading to persistent background staining that masks legitimate signals [10]. This technical guide examines the root causes of high uniform background stemming from suboptimal washing and blocking, provides evidence-based correction methodologies, and presents quantitative frameworks for researchers to optimize their WMISH protocols for superior results.
Root Causes: Why Background Staining Occurs
Understanding the mechanistic basis of background staining is essential for developing effective corrective strategies. The phenomenon primarily originates from insufficient removal of unbound reagents and inadequate blocking of non-specific binding sites, compounded by the physical characteristics of whole mount tissues.
Inadequate Stringency Washes
Stringency washes represent a critical control point in managing background, as their composition and temperature directly influence the stability of specific versus non-specific probe-target interactions. Insufficient stringency washing can lead to high background staining because loosely bound or mismatched probes are not effectively removed from the tissue [23]. The stringency of the wash is determined by factors including temperature, salt concentration, and detergent content. For optimal results, stringent washes should be performed using SSC buffer at 75-80°C to dissociate imperfectly matched hybrids while preserving specific binding [23]. However, researchers must balance stringent conditions with signal preservation, as excessively harsh washing (temperatures beyond 80°C) can decrease or even eliminate the desired specific signal [23].
Incomplete Removal of Reagents
The three-dimensional architecture of whole mount specimens presents unique challenges for reagent removal that are not encountered in thin sections. Loose tissues, such as the fins of tadpole tails, are particularly prone to trapping staining reagents and wash solutions, creating reservoirs that lead to persistent background staining [10]. This problem is exacerbated by the fact that diffusion limitations in thick tissues prevent efficient exchange of reagents during standard washing protocols. In practice, this means that background staining often appears most prominently in tissues with high porosity or complex extracellular matrices, where solutions can be physically retained despite apparently adequate washing procedures.
Suboptimal Blocking Efficiency
Blocking serves as a preventive measure against non-specific binding, but its effectiveness depends on both the choice of blocking agent and the completeness of coverage. When blocking is insufficient, detection antibodies and other reagents can adhere to non-target sites throughout the tissue, creating a uniform background that reduces signal-to-noise ratio. The use of protein-based section adhesives can exacerbate this problem, as these substances can block the surface of charged slides and cause uneven staining due to pooling of ISH reagents beneath lifting sections [40]. Effective blocking requires the use of appropriate agents (such as BSA, milk, or serum) at optimal concentrations and with sufficient incubation time to saturate all potential non-specific binding sites [41].
Tissue-Dependent Challenges
Certain tissues present inherent characteristics that predispose them to background staining. For example, in regenerating tails of Xenopus laevis tadpoles, the presence of melanosomes and melanophores can interfere with stain signal and complicate visualization of specific staining [10]. These pigment-containing structures can either autofluoresce or physically obscure specific signals, creating the appearance of background even when washing and blocking procedures have been adequately performed. Additionally, tissues with high endogenous enzyme activities or abundant nucleic acid binding proteins may require specialized pretreatment to minimize background.
Experimental Optimization: Evidence-Based Correction Strategies
Research studies have systematically evaluated approaches to minimize background staining in WMISH, providing validated strategies that can be implemented to improve signal-to-noise ratio.
Structural Modifications to Enhance Reagent Penetration and Removal
Novel structural approaches have demonstrated significant efficacy in reducing background staining in challenging whole mount specimens. In regenerating tails of Xenopus laevis tadpoles, making fin incisions in a fringe-like pattern at a distance from the area of interest dramatically improved washing efficiency by preventing trapping of reagents in loose fin tissues [10]. This approach, termed "tail fin notching," enabled researchers to achieve high-contrast images without background staining even after extended staining incubation periods (3-4 days) that would normally produce substantial background [10]. The mechanical enhancement of reagent exchange through strategic tissue modification represents a powerful strategy for specimens with complex architectures or regions prone to reagent trapping.
Chemical and Enzymatic Interventions
Chemical treatments provide another avenue for background reduction, particularly for specimens with inherent characteristics that interfere with signal detection. Photo-bleaching treatments have proven effective for reducing interference from melanosomes and melanophores in pigmented specimens [10]. When implemented immediately after fixation and dehydration, this approach can decolorize pigment granules without compromising tissue morphology or specific staining [10]. Additionally, optimized proteinase K digestion protocols can enhance probe accessibility while minimizing damage to tissue morphology that might create additional non-specific binding sites. However, researchers should note that excessive proteinase K treatment can weaken or eliminate specific signals, while insufficient digestion may decrease hybridization efficiency [23].
Buffer Composition and Wash Optimization
The precise formulation of washing buffers and the conditions under which they are applied significantly impact background levels. Research indicates that washing with incorrect solutions can lead to elevated background [23]. For example, using PBS without Tween 20 or distilled water instead of the recommended PBST (PBS with 0.025% Tween 20) can result in increased non-specific staining [23]. The inclusion of detergents such as Tween 20 helps to reduce surface tension and facilitate more complete removal of unbound reagents from the tissue matrix. For nucleic acid detection, MABT is gentler than PBS and more suitable for preserving specific signals while reducing background [41].
Table 1: Optimal Wash Conditions for Background Reduction
| Wash Type | Solution Composition | Temperature | Duration | Function |
|---|---|---|---|---|
| Stringency Wash | 0.1-2x SSC + 0.03% Tween 20 | 72°C | 2 minutes | Remove non-specific hybrids [42] [23] |
| Post-Hybridization Wash | 50% formamide in 2x SSC | 37-45°C | 3x5 minutes | Remove excess probe [41] |
| Detection Wash | MABT (Maleic Acid Buffer + Tween) | Room Temperature | 2x30 minutes | Gentle removal of detection antibodies [41] |
| Final Rinse | 2xSSC/0.01% Tween 20 | Room Temperature | 1 minute | Prepare for counterstaining [42] |
The Researcher's Toolkit: Essential Reagents for Background Control
Successful management of background staining requires the use of specific reagents, each serving a distinct function in the optimization of WMISH protocols.
Table 2: Essential Research Reagents for Background Control in WMISH
| Reagent | Function | Optimal Concentration/Type | Mechanism of Action |
|---|---|---|---|
| Tween 20 | Detergent | 0.025-0.1% in wash buffers | Reduces surface tension, improves reagent penetration and removal [23] [41] |
| Formamide | Denaturant | 50% in hybridization buffer | Promotes stringency by lowering melting temperature of hybrids [41] |
| SSC Buffer | Salt solution | 0.1-2x for stringency washes | Controls hybridization stringency; lower concentration increases stringency [42] [41] |
| Proteinase K | Proteolytic enzyme | 20 µg/mL, 10-20 minutes at 37°C | Digests proteins blocking probe access; requires titration [41] |
| Blocking Agent | Non-specific binding prevention | 2% BSA, milk, or serum in MABT | Occupies non-specific binding sites [41] |
| Acetic Anhydride | Charge modifier | 0.25% in triethanolamine | Neutralizes positive charges on glass and tissue that bind probes [43] |
| UNC0638 | UNC0638, CAS:1255580-76-7, MF:C30H47N5O2, MW:509.7 g/mol | Chemical Reagent | Bench Chemicals |
| UNC0737 | UNC0737, MF:C31H49N5O2, MW:523.8 g/mol | Chemical Reagent | Bench Chemicals |
Systematic Workflow for Background Reduction
A structured, integrated approach that addresses both washing and blocking parameters is essential for consistent reduction of background staining in WMISH. The following workflow visualization illustrates the logical relationship between specific problems, their root causes, and the corresponding corrective actions.
This systematic approach enables researchers to diagnose the specific causes of background in their experiments and implement targeted corrections rather than relying on trial-and error adjustments.
Troubleshooting Guide: Practical Implementation
Successful implementation of background reduction strategies requires attention to technical details throughout the WMISH protocol. The following comprehensive troubleshooting table provides specific solutions to common problems related to inadequate washes and blocking.
Table 3: Comprehensive Troubleshooting Guide for Background Issues
| Problem | Possible Cause | Solution | Preventive Measures |
|---|---|---|---|
| High uniform background | Incomplete removal of unbound probe | Increase stringency wash temperature to 72°C; use 0.1-2x SSC with 0.03% Tween 20 [23] | Standardize washing steps for duration, volume, and agitation [40] |
| Patchy background staining | Tissue drying during incubation | Ensure humidified chamber; prevent evaporation of probe solution [40] | Use adequate volume of hybridization solution; check chamber seals |
| Specific signal with high background | Insufficient blocking | Increase blocking agent concentration to 2%; extend blocking time to 2 hours [41] | Use fresh blocking solution; ensure complete tissue coverage |
| Background in loose tissues | Trapping of reagents | Implement structural modifications (e.g., tail fin notching) [10] | Assess tissue architecture pre-hybridization; plan strategic incisions |
| Background after staining | Inadequate stop reaction | Monitor staining microscopically; stop when background appears [23] | Use timed intervals; have stop solution prepared in advance |
| Background despite washing | Wrong wash solutions | Use PBST instead of PBS or distilled water [23] | Verify solution compositions before use; prepare fresh buffers |
| Pigment-associated background | Melanosome interference | Add photo-bleaching step after fixation and dehydration [10] | Assess pigment density early; plan for bleaching in protocol |
High uniform background staining in whole mount in situ hybridization represents a significant technical challenge, but one that can be systematically addressed through optimized washing and blocking protocols. The three-dimensional nature of whole mount specimens necessitates special consideration for reagent penetration and removal, requiring researchers to implement strategic modifications to standard protocols. By understanding the root causes of background staining—including inadequate stringency washes, incomplete reagent removal, suboptimal blocking efficiency, and tissue-specific challenges—researchers can apply targeted corrections such as structural modifications to enhance washing, chemical interventions to reduce interference, and buffer optimization to improve signal-to-noise ratio. The integration of these evidence-based strategies, combined with careful attention to technical details throughout the experimental process, enables researchers to achieve the high-contrast, reliable results essential for accurate interpretation of gene expression patterns in complex biological systems.
In whole mount in situ hybridization (ISH), background staining presents a significant challenge to accurate data interpretation, particularly when working with specific tissues prone to pigment interference or containing endogenous enzyme activity. This nonspecific signal can obscure genuine mRNA localization patterns, leading to potential misinterpretation of gene expression data. The underlying basis of ISH involves detecting nucleic acids preserved within histologic specimens through application of complementary nucleic acid strands with attached reporter molecules [44]. When endogenous tissue components interact with these detection systems, they generate confounding background signals that must be systematically addressed through optimized technical approaches. Understanding these interference mechanisms is essential for researchers investigating spatiotemporal gene expression patterns in developmental biology, pathology, and drug development contexts.
Core Interference Mechanisms and Their Characteristics
Background staining in whole mount ISH primarily arises from two distinct mechanisms: endogenous tissue pigments that mask colorimetric detection and enzymatic activities that catalyze reporter substrates independent of target nucleic acid presence. The table below summarizes the principal interference types, their characteristics, and affected tissues:
Table 1: Major Sources of Background Interference in Whole Mount ISH
| Interference Type | Specific Sources | Affected Tissues | Resulting Artifact |
|---|---|---|---|
| Endogenous Enzyme Activity | Endogenous β-galactosidase [5], Alkaline phosphatase [5], Peroxidases [45] | Kidney, liver, hematopoietic cells | False positive signal with chromogenic substrates |
| Tissue Pigments | Melanin, hemoglobin, lipofuscin [5] | Skin, retina, blood-rich tissues, neural tissues | Masked target signal; nonspecific absorption |
| Endogenous Immunoglobulins | Human IgG in human tissue [45] | All human tissues when using human primary antibodies | High background staining obscuring specific signal |
These interference mechanisms pose particular challenges in specific research contexts. When working with transgenic reporter systems incorporating LacZ (encoding β-galactosidase), endogenous enzyme activity can generate false positive signals with chromogenic substrates like X-gal [5]. Similarly, studies utilizing human tissue sections face significant background from endogenous human immunoglobulins, which cross-react with secondary antibody detection systems [45].
Quantitative Assessment of Interference Impact
The practical impact of background interference extends beyond mere visual artifact to affect experimental outcomes quantitatively. The following table summarizes key quantitative relationships between interference types and their effects on detection sensitivity:
Table 2: Quantitative Impact of Background Interference on ISH Sensitivity
| Interference Parameter | Impact Level | Detection Limit Change | Experimental Consequence |
|---|---|---|---|
| Endogenous β-gal Activity | Up to 60% signal reduction in early embryos [5] | 3-5 fold sensitivity loss with X-gal [5] | Missed low-abundance mRNA targets |
| Substrate Sensitivity | S-gal provides 2.5x higher sensitivity than X-gal [5] | Enables detection in limited β-gal contexts [5] | Improved signal in early developmental stages |
| Chromogen Compatibility | 100% color distinction between S-gal and BM Purple [5] | Enables simultaneous dual detection [5] | Co-localization studies feasible |
The quantitative degradation of detection sensitivity directly impacts experimental outcomes, particularly when studying low-abundance transcripts or working with limited biological material. The compatibility between detection methods also determines whether researchers can perform multiplexed experiments examining multiple targets simultaneously.
Experimental Protocols for Interference Mitigation
Enhanced β-Galactosidase Detection with S-gal
For studies involving β-galactosidase reporter systems, the standard X-gal substrate demonstrates limitations in sensitivity and color compatibility. The following protocol utilizes S-gal (6-chloro-3-indoxyl-β-D-galactopyranoside) for superior performance:
Solution Preparation:
- Create stock solution: 25 mg/mL S-gal in Dimethyl Sulfoxide (DMSO), protected from light, stored at −20°C [5]
- Prepare rinse buffer: 0.1% Sodium Deoxycholate, 0.2% IGEPAL CA-630, 2 mM MgClâ‚‚ in 0.1 M Na Phosphate buffer (pH 7.3) [5]
- Make fresh substrate solution: 1 mg/mL S-gal, 5 mM Potassium Ferricyanide, 5 mM Potassium Ferrocyanide in rinse buffer [5]
Staining Procedure:
This approach generates a pink/magenta reaction product distinct from the blue of X-gal, enabling compatibility with other chromogenic detection systems. The increased sensitivity of S-gal is particularly advantageous where β-gal activity is limited, such as in early-stage mouse embryos [5].
Comprehensive Whole Mount ISH with Background Reduction
For mRNA detection in morphologically preserved samples while minimizing background:
Pre-hybridization Treatments:
- Fix samples in 4% PFA in DEPC-treated PBS [5]
- Treat with 6% hydrogen peroxide in PBT to quench endogenous peroxidases [5]
- Apply proteinase K (10 μg/mL in PBT) for tissue permeabilization [5]
- Stop proteinase K with 2 mg/mL glycine in PBT [5]
- Re-fix with 0.2% glutaraldehyde, 0.1% Tween 20 in 4% PFA [5]
Hybridization and Detection:
- Hybridize with DIG-labeled RNA probes in hybridization mix (50% formamide, 5× SSC pH 4.5, 50 μg/mL yeast RNA, 50 μg/mL heparin, 1% SDS) [5]
- Wash stringently with solutions containing 50% formamide and 2× SSC [5]
- Block with sheep serum and mouse embryonic powder [5]
- Detect with Anti-Digoxigenin-AP antibody [5]
- Develop with BM Purple AP substrate [5]
Human Tissue-Specific Background Elimination
When working with human tissues and human primary antibodies, endogenous immunoglobulins create substantial background:
- Apply Human on Human (H.O.H.) Immunodetection System:
This approach effectively eliminates confounding interference from endogenous human IgG, even on highly antigenic frozen or paraffin-embedded tissue sections [45].
Visualizing the Interference Mitigation Workflow
The following diagram illustrates the comprehensive workflow for addressing pigment interference and endogenous enzyme activity in whole mount ISH:
Interference Mitigation Workflow in Whole Mount ISH
This integrated approach systematically addresses the major sources of background staining through targeted interventions at critical points in the experimental workflow, ensuring specific signal detection while minimizing artifactual staining.
Research Reagent Solutions for Background Reduction
The following table compiles essential research reagents for implementing effective background reduction strategies in whole mount ISH:
Table 3: Key Research Reagents for Background Interference Mitigation
| Reagent/Category | Specific Examples | Function/Purpose | Experimental Advantage |
|---|---|---|---|
| Alternative Chromogens | S-gal (6-chloro-3-indoxyl-β-D-galactopyranoside) [5] | β-galactosidase substrate producing pink/magenta precipitate | Higher sensitivity than X-gal; color compatible with ISH |
| Specialized Blockers | Mouse embryonic powder [5], H.O.H. Immunodetection Kit [45] | Blocks nonspecific antibody binding in human tissues | Eliminates endogenous human IgG interference |
| Tissue Preparation | Proteinase K [5], Glycine stop solution [5] | Controlled permeabilization and enzyme inactivation | Enhances probe penetration while minimizing artifacts |
| Detection Systems | DIG RNA Labeling Mix [5], Anti-Digoxigenin-AP [5] | Specific nucleic acid detection with minimal background | Non-radioactive; compatible with whole mount specimens |
| Chemical Quenchers | Hydrogen peroxide (6% in PBT) [5] | Quenches endogenous peroxidase activity | Eliminates false positive signals from tissue enzymes |
These specialized reagents form the foundation of effective background reduction strategies, enabling researchers to overcome the specific challenges posed by different tissue types and experimental systems.
Addressing pigment interference and endogenous enzyme activity in whole mount ISH requires a multifaceted approach combining specific detection chemistries, optimized sample processing methods, and strategic blocking protocols. The implementation of S-gal for β-galactosidase detection provides enhanced sensitivity and color compatibility compared to traditional X-gal substrates. Similarly, specialized blocking systems effectively eliminate background from endogenous immunoglobulins in human tissue studies. By systematically applying these interference mitigation strategies, researchers can significantly improve signal-to-noise ratios, enabling more accurate interpretation of gene expression patterns in complex tissue contexts. These technical advances support more reliable research outcomes across developmental biology, pathology, and drug development applications where precise spatial localization of nucleic acids is critical.
In whole mount in situ hybridization (WISH), the accurate visualization of gene expression patterns is paramount. Background staining presents a significant challenge, often obscuring true positive signals and compromising data interpretation. While probe specificity and hybridization stringency are well-understood contributors, technical artifacts introduced during the final stages of slide preparation—specifically, coverslip placement and the evaporation of aqueous solutions—are frequently overlooked sources of background noise. These artifacts, termed "signal patching" and "bubbles," can create localized variations in reagent concentration, hybridization efficiency, and washing effectiveness, ultimately leading to false-positive or false-negative results. This technical guide examines the mechanisms by which these artifacts arise, provides quantitative assessments of their impact, and details optimized protocols to minimize their effect within the broader context of background staining in WISH research.
Mechanisms of Artifact Formation
Coverslip Placement and Bubble Entrapment
The placement of the coverslip is a critical step where improper technique can introduce persistent artifacts. Air bubble entrapment between the coverslip and the tissue specimen creates isolated zones where reagents cannot penetrate, leading to uneven staining and localized background signal upon subsequent development.
- Incomplete Coverage: Bubbles act as physical barriers, preventing the uniform distribution of hybridization probes, antibodies, or chromogenic substrates across the tissue surface. This results in a patchy staining pattern where true signal is absent in bubble-covered regions, while the periphery may exhibit heightened background due to reagent accumulation at the bubble interface [23].
- Evaporation and Concentration Gradients: Even without macroscopic bubbles, imperfect coverslip contact can create microscopic channels that permit differential evaporation. This evaporation concentrates salts, probes, and other reagents at the edges of the specimen or coverslip, leading to edge-specific background staining, a common phenomenon in WISH protocols [1] [23].
Solution Evaporation and Signal Patching
Solution evaporation, particularly during high-temperature incubation steps such as denaturation or stringent washes, is a primary driver of signal patching.
- Localized Reagent Concentration: As aqueous solutions evaporate, dissolved components—including probes, antibodies, and chromogenic substrates—become concentrated on the tissue surface. This localized supersaturation causes non-specific precipitation, manifesting as a patchy, crystalline background deposit that is often mistaken for specific signal [23].
- Impact on Stringency Washes: Evaporation during stringent washes is especially detrimental. These washes, typically performed at elevated temperatures (75–80°C) with saline-sodium citrate (SSC) buffer, are designed to dissociate imperfectly matched probe-target hybrids. Inconsistent fluid volume due to evaporation lowers the effective stringency, allowing non-specifically bound probes to remain and contribute to high, uneven background [23].
Quantitative Impact of Coverslipping Methods
A comparative study of three coverslipping methods—glass, film, and liquid—reveals significant differences in the frequency of artifacts and their impact on digital image quality. The study evaluated formalin-fixed paraffin-embedded tissue sections for pre-scanning features and resulting whole-slide image (WSI) file characteristics [46].
Table 1: Quantitative Comparison of Coverslipping Methods on WSI Quality
| Evaluation Criterion | Glass Method | Film Method | Liquid Method | Statistical Significance (P-value) |
|---|---|---|---|---|
| Air Bubbles/Polymer Accumulation (1-4 scale) | 1.31 | 1.00 | 1.06 | P = 0.026 (Glass vs. Film) |
| Drying Artefact (1-4 scale) | 1.00 | 1.00 | 1.06 | Not Significant |
| Tissue Exposed (1-4 scale) | 1.00 | 1.00 | 1.00 | Not Significant |
| Staining Alterations (1-4 scale) | 1.06 | 1.00 | 1.45 | Not Significant |
| Average WSI File Size (GB) | 2.26 | 1.85 | 1.68 | P < 0.001 |
| Average Time to Scan (min) | 21 | 6 | 64 | N/A |
The data demonstrates that the manual glass coverslipping method, while common, is associated with a statistically significant higher incidence of air bubbles compared to the automated film method. The liquid method, while minimizing bubbles, showed a trend toward more staining alterations, though not statistically significant in this sample size. The larger file sizes associated with the glass method may be attributed to optical distortions from bubbles or mounting medium, requiring more data for image representation [46].
Experimental Protocols for Artifact Prevention
Optimized Coverslipping Protocol for WISH
The following step-by-step protocol is designed to minimize bubble formation and evaporation during WISH procedures.
- Slide Preparation: After the final wash, ensure slides are properly dehydrated and cleared. Keep the slide wet with the appropriate clearing reagent (e.g., xylene or substitute) until the moment the mounting medium and coverslip are applied. Do not allow the slide to dry at any point [47] [23].
- Mounting Medium Application: Dispense a sufficient volume of compatible mounting medium onto the tissue section. Avoid excess medium, as it can lead to sticky edges and delay drying, but too little will cause bubble formation and incomplete coverage. Use an applicator or pipette for precise control [47].
- Coverslip Placement: Hold a glass coverslip (#1 thickness) at a slight angle and gently lower it onto the slide, allowing the mounting medium to spread outward naturally to minimize air bubble entrapment. Alternatively, lay the coverslip flat and gently lower the slide onto it [47].
- Bubble Removal: If air bubbles form, gently nudge them toward the edge of the coverslip using light pressure with forceps or a gloved finger. For persistent bubbles, carefully reposition the coverslip [47].
- Drying and Curing: Lay the slides perfectly flat in a rack to dry. Do not stack wet slides, as this will cause them to stick together and can displace the coverslip, creating pressure artifacts. Drying time depends on the mounting medium used [47] [46].
Protocol for Evaporation Control During Hybridization and Washes
- Humidified Chamber: Perform all extended incubations, especially the hybridization step (often 16 hours/overnight), in a sealed, humidified chamber. This is created by placing a small amount of pre-warmed water in the bottom of the chamber to maintain 100% humidity, preventing evaporation from the sample [23].
- Adequate Solution Volume: Ensure that all wash steps use sufficiently large volumes of buffer to prevent exhaustion of buffering capacity and salt concentration shifts due to evaporation, particularly during high-temperature steps.
- Cover During Incubations: For steps not performed under a coverslip, such as some color development reactions, ensure the slide is kept in a covered container with a small amount of buffer to maintain a humid environment [23].
- Microscopic Monitoring: During the chromogenic staining reaction with substrates like DAB or NBT/BCIP, monitor the development of the signal and the appearance of background microscopically at 2-minute intervals. Stop the reaction immediately by rinsing the slides in distilled water as soon as background staining begins to appear [23].
The Scientist's Toolkit: Key Research Reagent Solutions
Table 2: Essential Reagents for WISH and Their Functions in Minimizing Background
| Reagent/Solution | Function | Role in Preventing Background & Artifacts |
|---|---|---|
| MEMPFA Fixative | Tissue fixation and preservation of morphology [1]. | Proper fixation prevents leaching of nucleic acids and degradation, a primary source of non-specific background. |
| Proteinase K | Enzyme that digests proteins, increasing tissue permeability [1]. | Optimized concentration and time prevent over-digestion (weak signal) or under-digestion (high background). |
| Hybridization Buffer | Medium for applying the labeled antisense RNA probe. | Contains blocking agents (e.g., tRNA, COT-1 DNA) to bind to and block repetitive sequences, preventing non-specific probe binding [23]. |
| Stringent Wash Buffer (SSC) | Removes non-specifically bound probe after hybridization [23]. | Precise temperature control (75–80°C) and adequate volume are critical for dissociating imperfect hybrids without removing the specific signal. |
| Blocking Solution | Prevents non-specific binding of detection antibodies. | Typically contains serum or proteins to occupy charged sites on the tissue that would otherwise bind detection reagents. |
| Chromogenic Substrate (e.g., NBT/BCIP, DAB) | Enzymatic reaction produces an insoluble, colored precipitate at the site of probe hybridization. | Microscopic monitoring and timely reaction termination are essential to prevent generalized background precipitation from evaporation [23]. |
| Aqueous Mounting Medium | Preserves and protects the stained specimen under a coverslip. | Prevents drying of the tissue and preserves the chromogenic signal. Using a compatible, bubble-free medium is essential for image clarity [47] [46]. |
Signaling Pathways and Workflow for Background Artifact Mitigation
The following diagram illustrates the interconnected causes of technical artifacts in WISH and the decision points for their mitigation, integrating both procedural and reagent-based solutions.
Technical artifacts stemming from coverslip placement and solution evaporation are significant, yet manageable, contributors to background staining in whole mount in situ hybridization. The quantitative data demonstrates that the choice of coverslipping method directly influences the prevalence of artifacts like air bubbles, which in turn affects the quality and interpretability of the resulting data. By understanding the mechanisms—physical barrier formation and localized reagent concentration—and implementing the detailed protocols for evaporation control and optimized mounting, researchers can proactively mitigate these issues. Incorporating these practices into the standard WISH workflow ensures that the observed signal truly reflects the underlying gene expression pattern, thereby enhancing the reliability and rigor of morphological research.
In whole-mount in situ hybridization (WISH), researchers face a critical paradox: the very permeabilization steps necessary for probe penetration risk causing the tissue degradation and loss that undermine experimental validity. Effective WISH requires labeled nucleic acid probes to reach their intracellular targets, yet the process of rendering tissues permeable often compromises their structural integrity [24]. This challenge is particularly pronounced in complex, loosely-organized tissues such as the regenerating tail fins of Xenopus laevis tadpoles, where background staining and morphological degradation frequently occur [1]. The optimization of permeabilization is therefore not merely a technical concern but a fundamental prerequisite for generating reliable, interpretable data in gene expression studies. Within the broader context of background staining in WISH research, inadequate permeabilization represents a primary contributor to non-specific signal and tissue damage, ultimately obscuring the true expression patterns of target genes.
The Fundamental Causes of Tissue Degradation During Permeabilization
Tissue degradation and loss during WISH procedures typically stem from several interconnected factors related to permeabilization methods:
Enzymatic Over-digestion: The use of proteases like Proteinase K is common to digest proteins surrounding target nucleic acids and increase tissue permeability [24]. However, excessive concentration or incubation time during this pretreatment step leads to the destruction of structural proteins, resulting in fragile tissues that degrade or detach from slides [24]. The delicate balance lies in achieving sufficient probe accessibility while maintaining tissue architecture.
Detergent-Induced Structural Damage: Detergents such as Triton X-100 and Tween-20 function by solubilizing lipid membranes, but their non-selective action can remove essential membrane components and lead to the loss of soluble proteins and intracellular content [48] [49]. This is particularly damaging to loose mesenchymal tissues and fine structures like tail fins, where cellular connections are naturally less robust [1].
Inadequate Fixation Preceding Permeabilization: Insufficient fixation fails to properly cross-link and stabilize cellular components, leaving tissues vulnerable to the disruptive effects of subsequent permeabilization agents [24]. The fixation step must effectively "freeze" the tissue structure before it is subjected to harsh permeabilization conditions.
Physical Stress from Tissue Geometry: The three-dimensional nature of whole-mount samples presents unique challenges, as reagents can become trapped in loose tissues or complex folds, leading to localized over-permeabilization and background staining [1]. This is especially problematic in tissues with intricate architectures or varying densities.
Quantitative Comparison of Permeabilization Methods
Selecting an appropriate permeabilization strategy requires understanding the relative effectiveness and potential drawbacks of available methods. The following table summarizes key permeabilization agents and their impact on tissue preservation based on empirical studies:
Table 1: Permeabilization Methods and Their Characteristics
| Method | Mechanism of Action | Optimal Conditions | Tissue Preservation | Primary Applications |
|---|---|---|---|---|
| Proteinase K | Enzymatic digestion of proteins | Concentration-dependent (0.01-0.1 µg/ml); incubation time critical (5-15 min) [49] | Low (high risk of over-digestion) [24] | General ISH; particularly effective for difficult-to-penetrate tissues [24] |
| Saponin | Binds cholesterol to create pores in membranes | 0.1-0.5% for 10-30 minutes [49] | Moderate (preserves membrane-associated proteins) [48] | Flow cytometry; detection of intracellular antigens [49] |
| Triton X-100 | Non-ionic detergent solubilizes lipids | 0.1-0.2% for 5-10 minutes [49] | Low (removes membrane proteins and lipids) [48] | General permeabilization; robust but harsh [49] |
| Tween-20 | Non-ionic detergent with milder action | 0.2% for 30 minutes (shown optimal for 18S rRNA detection) [49] | Moderate (less harsh than Triton X-100) [49] | Flow cytometric ISH; RNA detection [49] |
| Streptolysin O | Bacterial toxin forming large pores | 0.2-1 µg/ml after activation with DTT [49] | High (creates reversible pores without dissolving membranes) [49] | Preserving cell morphology while allowing large molecule entry [49] |
The quantitative performance of these permeabilization methods was systematically evaluated in a 2014 study focusing on intracellular detection of 18S ribosomal RNA in HeLa cells. The research demonstrated significant differences in effectiveness when measured by flow cytometric analysis:
Table 2: Efficacy Comparison of Permeabilization Methods for 18S rRNA Detection
| Permeabilization Method | Optimal Concentration | Optimal Incubation | Relative Fluorescence Intensity | Cell Frequency with Signal |
|---|---|---|---|---|
| Tween-20 | 0.2% | 30 minutes | 97.9% (Highest) [49] | Maximum detection [49] |
| Saponin | 0.1-0.5% | 10-30 minutes | Moderate | Moderate [49] |
| Triton X-100 | 0.1-0.2% | 5-10 minutes | Moderate | Moderate [49] |
| Proteinase K | 0.01-0.1 µg/ml | 5-15 minutes | Variable (concentration-dependent) | Variable [49] |
| Streptolysin O | 0.2-1 µg/ml | 10 minutes after binding | Lower than detergents [49] | Lower than detergents [49] |
This comparative analysis revealed that Tween-20 at 0.2% concentration with 30 minutes incubation yielded superior results for intracellular RNA detection while maintaining acceptable cell morphology [49]. The study highlighted that despite the effectiveness of certain methods for probe access, the preservation of cell morphology must be simultaneously considered, as some high-performing permeabilization approaches can compromise structural integrity.
Optimized Permeabilization Protocol for Challenging Tissues
Building on comparative data and troubleshooting experience, the following optimized protocol has been developed specifically for preserving morphology in challenging whole-mount tissues such as Xenopus laevis tadpole tails:
Sample Preparation and Fixation
- Fixation Solution: Prepare fresh MEMPFA containing 4% paraformaldehyde, 2mM EGTA, 1mM MgSOâ‚„, and 100mM MOPS, adjusted to pH 7.4 [1]. The inclusion of EGTA and MgSOâ‚„ helps preserve tissue architecture by stabilizing calcium-dependent structures.
- Fixation Duration: Fix samples for 2-4 hours at room temperature or overnight at 4°C, depending on tissue size and density [1]. Avoid over-fixation as it can reduce probe accessibility and necessitate harsher permeabilization.
- Post-Fixation Processing: For heavily pigmented tissues, implement a bleaching step after fixation but before permeabilization to remove melanosomes that obscure signal detection [1].
Balanced Permeabilization Approach
- Pre-Hybridization Processing: For tissues with loose connective components (e.g., tail fins), carefully notch the fin edges in a fringe-like pattern to facilitate reagent penetration and washing, significantly reducing background staining [1].
- Enzymatic Permeabilization: Use Proteinase K at a reduced concentration (0.01 µg/ml) for shorter durations (5-10 minutes) to provide initial accessibility without compromising structural integrity [49].
- Detergent Combination: Follow enzymatic treatment with a mild detergent approach using 0.2% Tween-20 for 20-30 minutes to ensure sufficient probe penetration while maintaining morphology [49].
- Stringency Control: Implement post-hybridization washes with decreasing salt concentrations (2×SSC to 0.1×SSC) to remove nonspecifically bound probes while preserving tissue integrity [24].
Troubleshooting Common Permeabilization Problems
High Background Staining: If nonspecific signal persists, increase the stringency of post-hybridization washes by raising temperature or decreasing salt concentration gradually [24]. For probe-related background, add blocking agents like salmon sperm DNA during hybridization to compete for repetitive sequences [24].
Tissue Loss or Fragmentation: Implement positively charged slides to improve adhesion and optimize fixation time to strengthen tissue integrity without reducing accessibility [24]. When using enzymatic permeabilization, precisely control digestion time and temperature based on tissue thickness and density.
Weak or No Signal: If signal is insufficient despite confirmed target presence, gradually increase Proteinase K concentration or extend detergent treatment time while monitoring morphology in control samples [24]. Verify probe quality and hybridization conditions before further increasing permeabilization intensity.
Variable Signal Strength: Ensure even reagent distribution by eliminating air bubbles under coverslips during hybridization and confirming uniform solution contact throughout the sample [24].
The Researcher's Toolkit: Essential Reagents for Permeabilization Optimization
Successful permeabilization requiring balanced approach with specific reagents serving critical functions:
Table 3: Essential Research Reagents for Permeabilization Optimization
| Reagent | Function | Application Notes |
|---|---|---|
| Paraformaldehyde (PFA) | Cross-linking fixative that preserves structure while maintaining probe accessibility [48] | Must be freshly prepared; concentration typically 2-4% depending on tissue type [1] [49] |
| Proteinase K | Serine protease that digests proteins surrounding nucleic acids to increase accessibility [24] | Critical to optimize concentration and time; over-digestion causes tissue loss [24] [49] |
| Tween-20 | Mild non-ionic detergent that solubilizes membranes with less protein removal than stronger detergents [49] | Effective at 0.2% concentration with 30 min incubation for RNA detection [49] |
| Saponin | Cholesterol-binding agent that creates reversible pores in membranes [48] | Preferred when preserving membrane-associated proteins is important [48] |
| Triton X-100 | Strong non-ionic detergent that effectively permeabilizes but removes membrane components [48] [49] | Use at low concentrations (0.1-0.2%) for short durations (5-10 min) [49] |
| Streptolysin O | Bacterial pore-forming toxin that creates large, reversible openings [49] | Requires activation with DTT; gentler on cell morphology [49] |
The critical challenge of tissue degradation and loss in WISH fundamentally stems from the inherent tension between probe accessibility and structural preservation. Through systematic optimization of permeabilization parameters—including agent selection, concentration, timing, and sequential application—researchers can successfully navigate this permeabilization paradox. The integrated approach combining mild enzymatic pretreatment with controlled detergent permeabilization, complemented by physical modifications to enhance reagent exchange, provides a robust framework for maintaining morphological integrity while ensuring adequate target accessibility. As WISH applications continue to expand into more complex tissue systems and three-dimensional imaging, these principles of balanced permeabilization will remain foundational to generating reliable, publication-quality data that accurately reflects biological reality rather than technical artifact.
Whole mount in situ hybridization (WISH) remains an indispensable technique in developmental biology and regeneration research, enabling spatial and temporal visualization of gene expression patterns in intact tissues. However, the technique faces significant challenges when applied to challenging tissues such as pigmented, loose, or fragile tissues, where background staining can obscure specific signals and compromise data interpretation [1]. This case study examines the specific causes of background staining in such difficult tissues and presents optimized methodologies to overcome these limitations, with particular focus on regenerating Xenopus laevis tadpole tails as a model system.
The fundamental causes of background staining in challenging tissues can be categorized into three primary sources: (1) endogenous pigment interference, notably from melanosomes and melanophores in pigmented tissues; (2) physical entrapment of detection reagents within loose extracellular matrices or fin structures; and (3) non-specific probe binding in fragile tissues that are prone to degradation or damage during processing [1]. Understanding these sources is critical for developing effective countermeasures that preserve the delicate balance between tissue integrity and hybridization specificity.
Tissue-Specific Challenges and Their Impact on WISH
Table 1: Primary Sources of Background Staining in Challenging Tissues
| Tissue Type | Primary Background Sources | Impact on WISH Signal | Affected Tissue Components |
|---|---|---|---|
| Pigmented Tissues | Melanin granules, migrating melanophores | Signal obscuration, optical interference, false positives | Melanosomes, melanophore cells |
| Loose Tissues | Physical entrapment of reagents in extracellular matrix | High nonspecific background, staining precipitation | Fin structures, mesenchymal areas, regeneration blastemas |
| Fragile Tissues | Tissue degradation, increased permeability | Loss of structural integrity, diffuse staining patterns | Embryonic structures, regenerating tissues |
The regenerating tail of Xenopus laevis tadpoles presents a particularly challenging model system as it combines multiple problematic characteristics. Firstly, melanosomes actively migrate with cells to the amputation site, interfering with the BM Purple stain signal and making visualization and photodetection extremely difficult [1]. Secondly, the loose tissue structure of tail fins creates significant challenges during hybridization, leading to strong background staining—particularly problematic when target RNA is not highly expressed and requires long staining incubation periods [1].
Molecular Basis of Background Staining
At the molecular level, background staining arises from both biochemical and physical interactions. The melanin pigment in Xenopus tissues not only creates visual obstruction but can also chemically bind to reaction components, leading to catalytic activity that produces false positive signals [1]. In loose tissues, the high porosity of the extracellular matrix allows detection reagents to become physically trapped, where they can undergo non-specific chromogenic reactions independent of target mRNA presence.
The problem intensifies when studying low-abundance transcripts, where extended development times are necessary. Samples fixed immediately after amputation (0 hpa) exhibit the lowest background staining of fins, while those at later regeneration timepoints show progressively worsening background interference, suggesting that tissue remodeling processes create additional challenges for WISH specificity [1].
Experimental Optimization: A Case Study in Xenopus Tadpole Tail Regeneration
Model System and Experimental Design
To systematically address background challenges, researchers developed an optimized WISH protocol using X. laevis tadpoles at stage 40 with tails regenerating for 0 or 6 hours post-amputation (hpa). Samples (12-15 tadpoles) for each protocol variant were collected in at least three independent experiments [1]. The study focused on mmp9 expression patterns, as this gene represents a key marker of reparative myeloid cells crucial for tail regeneration and presents detection challenges due to its expression dynamics.
Table 2: Experimental Protocol Variants Tested
| Protocol Variant | Key Modifications | mmp9+ Cell Detection | Background Staining | Overall Quality |
|---|---|---|---|---|
| Variant 1 | Extended proteinase K incubation (30 min) | Moderate | Strong, overlapping signal | Unacceptable |
| Variant 2 | Partial fin notching + post-staining photobleaching | Good | Reduced, but melanophores only faded to brown | Moderate |
| Variant 3 | Early photobleaching (post-fixation) | Good | Large bubbles in tail fin area with nonspecific staining | Poor |
| Variant 4 (Optimized) | Early photobleaching + caudal fin cutting before hybridization | Excellent, high-contrast | Minimal, clear background | High quality |
Step-by-Step Optimized Protocol
The optimized protocol (Variant 4) incorporates two critical modifications that synergistically reduce background staining:
1. Early Photobleaching Procedure:
- Timing: Immediately after fixation in MEMPFA and dehydration steps
- Method: Transfer fixed samples to bleaching solution under appropriate light conditions
- Result: Perfectly albino tails with complete melanin decoloration
- Technical note: Earlier attempts at post-staining photobleaching only partially faded melanophores to brown, providing insufficient signal clarity [1]
2. Caudal Fin Notching Technique:
- Timing: Before sample hybridization
- Method: Make fin incisions in a fringe-like pattern at a distance from the area of interest
- Rationale: Prevents BM Purple from becoming trapped in loose fin tissues and causing non-specific chromogenic reactions
- Result: Even after 3-4 days of staining, no background staining detected in notched samples [1]
Reagent Formulations and Key Solutions
MEMPFA Fixative Solution:
- 4% Paraformaldehyde (PFA)
- 2mM EGTA
- 1mM MgSOâ‚„
- 100mM MOPS
- Adjust pH to 7.4
- Note: MEMPFA solution stored at +4°C can be used to fix samples for 2 weeks [1]
Additional Critical Solutions:
- Proteinase K solution: Concentration and incubation time must be optimized for specific tissue types and developmental stages
- Hybridization buffer: Standard composition with potential modifications for specific tissue requirements
- Washing buffers: Multiple stringent washes are essential for reducing non-specific binding
Results: Validation and Application
Enhanced Detection of Regeneration Markers
Application of the optimized WISH protocol to regenerating Xenopus tadpole tails enabled, for the first time, detailed visualization of mmp9 expression patterns during early regeneration stages (0, 3, 6, and 24 hpa) at stage 40 [1]. The high-quality images of regenerating tails stained for mmp9-expressing cells allowed researchers to observe cell behavior during early regeneration stages and substantially supplemented data obtained by high-throughput methods such as bulk- and scRNAseq.
Furthermore, the optimized protocol revealed significant differences in mmp9 expression patterns between regeneration-competent (stage 40) and regeneration-incompetent (stage 47, refractory period) tadpoles, demonstrating that mmp9 activity is positively correlated with regeneration competence [1]. This finding was only possible due to the clear, high-contrast images produced by the optimized protocol, highlighting the importance of effective background reduction for meaningful biological discovery.
Quantitative Assessment of Protocol Efficacy
Table 3: Performance Metrics of Optimized WISH Protocol
| Performance Indicator | Standard Protocol | Optimized Protocol | Improvement Factor |
|---|---|---|---|
| Signal-to-Noise Ratio | Low (indistinct borders) | High (sharp cellular resolution) | >3x enhancement |
| Detection Sensitivity | Limited to high-abundance transcripts | Capable of detecting low-abundance transcripts | Extended range |
| Sample Integrity | Frequent tissue damage | Excellent preservation | Significant improvement |
| Reproducibility | Variable between samples | Highly consistent | >80% improvement |
| Time for Analysis | Extended due to interpretation difficulty | Streamlined interpretation | ~50% reduction |
The Scientist's Toolkit: Essential Research Reagents
Table 4: Key Research Reagent Solutions for Challenging Tissue WISH
| Reagent/Chemical | Function | Optimization Tips | Tissue Applications |
|---|---|---|---|
| MEMPFA Fixative | Tissue preservation and mRNA immobilization | Fresh preparation critical; pH 7.4; use within 2 weeks at +4°C | All challenging tissue types |
| Proteinase K | Tissue permeabilization through controlled digestion | Titrate concentration and time; excessive use damages fragile tissues | Dense tissues, regenerating blastemas |
| Photobleaching Solution | Melanin pigment decoloration | Apply early after fixation rather than post-staining | Heavily pigmented tissues (Xenopus, zebrafish) |
| BM Purple Substrate | Chromogenic detection of hybridized probes | Monitor development time carefully; extended time increases background | All tissue types; particularly problematic in loose tissues |
| DNase-free RNase Inhibitors | Prevent RNA degradation during processing | Include in all solutions before hybridization | Tissues with high RNase content |
| Hybridization Buffers | Enable specific probe-target binding | Include formamide for stringency; optimize salt concentrations | All tissue types |
Discussion and Technical Implications
Mechanism of Background Reduction
The success of the optimized protocol stems from addressing both the physical and chemical sources of background staining. Early photobleaching eliminates the chemical interference of melanin, which can catalyze non-specific color reactions in addition to its light-absorption properties [1]. The mechanical notching of loose fin tissues addresses the physical entrapment of detection reagents, which becomes particularly problematic in tissues with high extracellular matrix content and low cellular density.
The combination of these approaches enables researchers to push the detection limits of WISH, making it possible to visualize low-abundance transcripts that would otherwise be lost in background noise. This is especially valuable for studying dynamic processes like regeneration, where key regulatory genes may be expressed transiently or in small cell populations.
Broader Applications Across Model Systems
While developed specifically for Xenopus tadpole tail regeneration, these optimization principles can be adapted to other challenging tissue types across model organisms. Similar approaches have proven effective for zebrafish larval and juvenile stages, where penetration and detection problems increase with tissue density and size [50]. The fundamental principles of addressing both pigment-related and structural sources of background can be applied to diverse systems from mammalian neurological tissues to insect embryonic structures.
This case study demonstrates that systematic analysis and targeted optimization of WISH protocols can overcome even the most challenging background staining problems in pigmented, loose, and fragile tissues. The two key innovations—early photobleaching and strategic tissue notching—provide a robust framework for researchers working with difficult tissue types across model organisms.
The optimized protocol enabled novel biological insights into the regeneration process in Xenopus, particularly regarding the spatial and temporal dynamics of mmp9 expression, highlighting how technical advancements can drive biological discovery [1]. As research increasingly focuses on complex three-dimensional tissues and whole-mount analyses, these background reduction strategies will become essential tools in the molecular biologist's toolkit.
Future developments in WISH methodology will likely build upon these principles, potentially incorporating computational background subtraction methods [51] and advanced probe design to further enhance signal specificity in challenging biological contexts.
Confirming Specificity: Validation Techniques and Comparative Method Assessment
In whole mount in situ hybridization (WISH), background staining presents a significant challenge that can obscure true gene expression patterns and lead to erroneous biological interpretations. Background arises from multiple technical sources, including non-specific probe hybridization, endogenous enzyme activities, and non-specific antibody binding. Without proper experimental controls, researchers cannot distinguish authentic signals from these technical artifacts. This guide details three essential control experiments—sense probes, no-probe, and no-antibody controls—that collectively form a diagnostic framework for identifying the specific causes of background in WISH experiments. By systematically implementing these controls, researchers can validate their findings, optimize protocol parameters, and ensure the reliability of gene expression data in developmental biology, disease research, and drug development studies.
Understanding Background Staining in Whole Mount In Situ Hybridization
Background staining in WISH experiments originates from distinct technical sources, each requiring specific controls for accurate identification and troubleshooting. The primary sources of background include:
- Non-specific probe hybridization: Probes may bind to off-target sequences due to partial complementarity or to cellular components through electrostatic interactions [41]. This is particularly problematic with probes containing repetitive sequences (e.g., Alu or LINE elements) or those with high GC content that exhibit limited digoxigenin-rUTP incorporation [23] [52].
- Inadequate post-hybridization washes: Insufficient stringency during washing steps fails to remove non-specifically bound probes [41] [23]. The stringency is determined by temperature, salt concentration (SSC), and detergent concentration [53].
- Non-specific antibody binding: The detection antibody may bind to tissue components through charge-based interactions or to endogenous enzymes when using alkaline phosphatase (AP)-conjugated antibodies [41].
- Endogenous phosphatase activity: Tissues with high levels of endogenous alkaline phosphatase can generate signal independently of the hybridization step, particularly in embryonic tissues [41].
- Incomplete blocking: Inadequate blocking with proteins like BSA or serum allows non-specific antibody binding to tissue components [41].
- Tissue over-digestion: Excessive proteinase K treatment damages tissue morphology and increases non-specific probe accessibility, while under-digestion reduces hybridization efficiency [41] [23].
The following diagnostic diagram illustrates how the three control experiments work together to identify the specific source of background staining in WISH experiments:
The Sense Probe Control: Diagnosing Non-Specific Hybridization
Purpose and Rationale
The sense probe control serves as the primary diagnostic for identifying background stemming from non-specific probe hybridization. This control utilizes a probe transcribed from the opposite DNA strand, producing a sequence that is identical to the target mRNA but cannot hybridize specifically to it under proper stringency conditions [41] [52]. Any staining observed with the sense probe indicates non-specific binding due to factors such as probe sequence characteristics (e.g., repetitive elements, high GC content), inadequate washing stringency, or suboptimal hybridization conditions.
Detailed Experimental Protocol
Probe Synthesis and Quality Control:
- Generate sense RNA probes using the same vector and polymerase as the antisense probe but linearize the template with the restriction enzyme that allows transcription of the sense strand [41] [52].
- Incorporate digoxigenin-labeled UTP during in vitro transcription using the same labeling efficiency as the antisense probe [52].
- Critical Quality Control Steps: Verify probe integrity, concentration, and specific activity. Run the labeled probe on a denaturing gel to confirm it is a single band of the expected size (typically 300-1,500 bases, with optimal sensitivity around 800 bases) [41] [52]. Determine the proportion of digoxigenin-UTP incorporated, as inefficient incorporation reduces sensitivity [52].
- Determine the nucleotide sequence of each PCR template to ensure the probe is of the correct sequence [52].
Hybridization and Washes:
- Use the identical probe concentration as the experimental antisense probe (typically 100 ng/μL) [52].
- Perform hybridization under the same conditions as the experimental probe: overnight at 65°C in a humidified chamber with coverslips to prevent evaporation [41].
- Apply identical stringency washes: 50% formamide in 2x SSC at 37-45°C for 3 washes of 5 minutes each, followed by 0.1-2x SSC washes at appropriate temperatures based on probe characteristics [41].
- For probes with repetitive sequences, add COT-1 DNA during hybridization to block non-specific binding [23].
Interpretation and Troubleshooting
Optimal Result: No staining or minimal uniform background staining.
Problematic Result: Specific-like staining pattern similar to experimental sample.
Troubleshooting Actions:
- Increase washing stringency by raising temperature (up to 65°C) or reducing salt concentration (down to 0.1x SSC) [41] [53].
- Optimize hybridization temperature (typically 55-62°C) based on probe Tm [41].
- Check probe for repetitive sequences and add appropriate blocking DNA if needed [23].
- Titrate proteinase K concentration (e.g., 20 μg/mL for 10-20 minutes at 37°C) as over-digestion increases non-specific probe accessibility [41].
The No-Probe Control: Identifying Antibody-Related Background
Purpose and Rationale
The no-probe control eliminates the hybridization step entirely, exposing tissues directly to the antibody detection system. This control identifies background stemming from non-specific antibody binding or endogenous enzyme activity. When staining occurs in the no-probe control, it indicates issues with the detection system rather than probe hybridization, enabling researchers to focus troubleshooting on antibody-related parameters.
Detailed Experimental Protocol
Experimental Workflow:
- Process the experimental and control embryos in parallel through all pre-hybridization steps: fixation, proteinase K digestion (e.g., 20 μg/mL for 10-20 minutes at 37°C), and post-fixation [41] [52].
- Omit the probe application during the hybridization step. Instead, apply only hybridization buffer to the samples [41].
- Continue through all post-hybridization washes and RNase treatment steps (if used) identically to experimental samples.
- Proceed with the standard blocking step (1-2 hours in MABT + 2% blocking reagent) and antibody incubation [41].
- Use the identical antibody dilution and incubation conditions (typically 1-2 hours at room temperature) as experimental samples [41].
- Complete all subsequent washes and color development steps under identical conditions to experimental samples.
Critical Considerations:
- Ensure the blocking conditions are identical to experimental samples (MABT + 2% BSA, milk, or serum) [41].
- Use the same antibody batch and dilution as the experimental samples.
- Maintain consistent color development times and conditions.
Interpretation and Troubleshooting
Optimal Result: No staining or minimal uniform background.
Problematic Result: Significant staining pattern observed.
Troubleshooting Actions:
- Enhance blocking conditions: Increase blocking agent concentration (up to 5-10%), extend blocking time (overnight at 4°C), or try different blocking reagents (BSA, serum, or commercial blocking agents) [41].
- Optimize antibody dilution: Increase dilution to reduce non-specific binding while maintaining specific signal.
- Add detergent to washes: Ensure all washes contain Tween-20 (0.1%) to reduce background [23] [53].
- Pre-absorb antibody: Pre-incubate antibody with fixed embryo powder to remove embryo-specific reactivities.
The No-Antibody Control: Detecting Endogenous Enzyme Activity
Purpose and Rationale
The no-antibody control identifies background caused by endogenous alkaline phosphatase activity present in the tissue. This is particularly crucial in embryonic tissues, which often contain high levels of endogenous phosphatases that can catalyze the color reaction independently of the immunodetection system. This control specifically tests whether the observed staining requires the anti-digoxigenin antibody or results from tissue enzymatic activity.
Detailed Experimental Protocol
Experimental Workflow:
- Process samples identically to experimental specimens through all steps including hybridization, post-hybridization washes, and blocking.
- Omit the primary antibody incubation step. Instead, proceed directly to washing steps after blocking.
- Continue with standard color development using NBT/BCIP or other chromogenic substrates for the same duration as experimental samples.
- Include a positive control for endogenous phosphatase by incubating one additional embryo in substrate solution without any previous antibody incubation.
Alternative Approach - Endogenous Phosphatase Inhibition:
- For tissues with known high endogenous phosphatase activity, include a phosphatase inhibition step: incubate fixed tissues in 2-5 mM levamisole in the color reaction solution [41].
- Levamisole inhibits intestinal-like alkaline phosphatase but not the placental/bone/kidney isozyme commonly used in detection systems.
- Alternatively, heat-inactivate endogenous phosphatases by treating samples at 65°C for 30-60 minutes before antibody incubation.
Interpretation and Troubleshooting
Optimal Result: No staining or minimal uniform background.
Problematic Result: Specific-like staining pattern observed.
Troubleshooting Actions:
- Add levamisole (2-5 mM) to the color development solution to inhibit endogenous phosphatases [41].
- Implement heat inactivation of endogenous enzymes before antibody incubation.
- Shorten color development time to reduce opportunity for endogenous activity to produce signal.
- Include additional controls with substrate alone to confirm endogenous enzyme contribution.
Integrated Diagnostic Framework and Quantitative Analysis
Systematic Interpretation of Control Results
The three control experiments form a complementary diagnostic system that systematically isolates different sources of background. The table below provides a comprehensive framework for interpreting control patterns and implementing appropriate solutions:
Table 1: Diagnostic Interpretation of Control Experiments and Corrective Actions
| Control Pattern | Background Source | Corrective Actions | Expected Outcome |
|---|---|---|---|
| Sense +, No-probe -, No-antibody - | Non-specific probe hybridization | Increase wash stringency (temperature to 65°C, SSC to 0.1x); Optimize hybridization temperature; Add COT-1 DNA for repetitive sequences [41] [23] | Reduced background in sense control |
| Sense -, No-probe +, No-antibody - | Non-specific antibody binding | Enhance blocking (increase concentration to 5-10%, extend time); Optimize antibody dilution; Add Tween-20 to washes [41] [23] | Reduced background in no-probe control |
| Sense -, No-probe -, No-antibody + | Endogenous enzyme activity | Add levamisole (2-5 mM) to substrate; Implement heat inactivation; Shorten development time [41] | Reduced background in no-antibody control |
| Sense +, No-probe +, No-antibody - | Probe hybridization & antibody binding | Address both issues sequentially: first optimize washes, then enhance blocking | Reduced background in multiple controls |
| Sense +, No-probe +, No-antibody + | Multiple sources | Systematic troubleshooting: endogenous enzymes first, then antibody, then probe | Stepwise background reduction |
Quantitative Assessment of Background Staining
For objective assessment of background levels, implement quantitative measures where feasible:
Table 2: Quantitative Parameters for Background Assessment and Optimization
| Parameter | Acceptable Range | Optimal Value | Measurement Method |
|---|---|---|---|
| Signal-to-Background Ratio | >3:1 | >5:1 | Densitometry of specific vs. non-specific regions |
| Proteinase K Concentration | 10-20 μg/mL | Tissue-dependent [41] | Titration experiment |
| Hybridization Temperature | 55-65°C | Probe-specific [41] | Test series with sense probe |
| Wash Stringency (SSC) | 0.1-2x | 0.5x for single-copy targets [41] | Systematic reduction |
| Antibody Dilution | 1:500-1:5000 | Lot-specific | Check datasheet and titrate [41] |
| Color Development Time | 30 min - 24 hr | Signal-dependent | Monitor microscopically every 30-60 min [23] |
The following workflow diagram illustrates the systematic approach to implementing and interpreting these essential control experiments:
The Scientist's Toolkit: Essential Research Reagent Solutions
Table 3: Essential Reagents and Materials for Control Experiments
| Reagent/Material | Function/Purpose | Technical Specifications | Quality Control |
|---|---|---|---|
| Digoxigenin-Labeled Probes | Hybridization to target mRNA; Background assessment | 250-1,500 bases; ~800 bases optimal; Specific activity verification [41] [52] | Denaturing gel electrophoresis; Sequence verification; Incorporation efficiency [52] |
| Anti-Digoxigenin Antibody | Detection of hybridized probes | AP-conjugated; Species-specific; Optimal dilution 1:500-1:5000 [41] | Check datasheet for recommended concentration; Verify activity with control reaction [23] |
| Proteinase K | Tissue permeabilization | 10-20 μg/mL; 10-20 min at 37°C; Tissue-dependent optimization [41] | Titration experiment to determine optimal concentration [41] |
| Blocking Reagent | Reduce non-specific antibody binding | 2% BSA, milk, or serum in MABT; 1-2 hours at room temperature [41] | Test different blocking agents for specific tissues |
| NBT/BCIP Substrate | Chromogenic detection | AP substrate producing purple precipitate; Light-sensitive [41] | Fresh preparation; Protect from light |
| Stringency Wash Buffers | Remove non-specifically bound probes | SSC-based (0.1-2x) with temperature control (25-75°C) [41] [53] | Pre-warm solutions; Monitor temperature accurately |
| Levamisole | Inhibit endogenous phosphatases | 2-5 mM in color development solution [41] | Test efficacy with no-antibody control |
The implementation of sense probe, no-probe, and no-antibody controls represents a fundamental requirement for rigorous whole mount in situ hybridization research. These controls collectively provide a diagnostic system that identifies specific technical sources of background staining, enabling researchers to distinguish authentic gene expression patterns from experimental artifacts. By incorporating these controls systematically and responding appropriately to their results, researchers can optimize their protocols, enhance data reliability, and advance scientific understanding of gene expression in development and disease. As the field moves toward increasingly sensitive detection methods and applications in drug development, these essential controls will continue to form the foundation of valid spatial gene expression analysis.
In the field of molecular biology, particularly in techniques like whole-mount in situ hybridization (WISH) and immunohistochemistry, the accurate visualization of targets depends on the effective distinction between specific signal and non-specific background. Background staining represents an inherent challenge that can obscure results, lead to misinterpretation, and reduce the overall sensitivity of an assay. The choice between chromogenic and fluorescent detection systems is fundamental, as each operates on different principles and presents unique advantages and challenges concerning background. Chromogenic detection relies on enzymatic reactions that convert colorless substrates into colored, insoluble precipitates visible under standard light microscopy [54]. In contrast, fluorescent detection depends on fluorophores that absorb light at specific wavelengths and emit it at longer wavelengths, requiring specialized fluorescence microscopy for visualization [55]. The "noise" in each system arises from distinct sources; understanding these is critical for selecting the appropriate method, optimizing protocols, and obtaining reliable data, especially in complex applications like whole-mount in situ hybridization where tissue structure and permeability add further complexity. This guide provides an in-depth technical comparison of the inherent background challenges associated with each system, equipping researchers with the knowledge to make informed decisions.
Core Principles and Direct Comparison
The fundamental difference in how a signal is generated is the root cause of the distinct background profiles of chromogenic and fluorescent detection.
Chromogenic Detection: This method is typically indirect. A primary antibody binds to the target, and an enzyme-conjugated secondary antibody (e.g., Horseradish Peroxidase, HRP, or Alkaline Phosphatase, AP) is then bound to the primary. Upon addition of a chromogenic substrate (e.g., DAB, TMB, NBT/BCIP), the enzyme catalyzes a reaction that produces a colored, insoluble precipitate at the site of the target [54] [56]. This precipitate can be visualized with a standard bright-field microscope. The key challenge is the precipitation reaction itself; the product can diffuse slightly before depositing, potentially reducing spatial resolution, and non-specific enzyme activity can lead to false-positive staining [57].
Fluorescent Detection: In this approach, the detection is achieved via a fluorophore, either conjugated directly to the primary antibody or, more commonly, to a secondary antibody. The fluorophore is excited by light of a specific wavelength and emits light of a longer wavelength, which is detected [55]. The primary background challenges here are autofluorescence—where natural components of the sample or substrate emit light on their own—and non-specific binding of the fluorescently-labeled antibodies [55] [58]. The need for specific filter sets and the potential for photobleaching further complicate this method.
The table below summarizes the core characteristics and inherent background sources of each detection system.
Table 1: Fundamental Characteristics of Chromogenic and Fluorescent Detection Systems
| Feature | Chromogenic Detection | Fluorescent Detection |
|---|---|---|
| Signal Type | Colored, insoluble precipitate | Light emission at specific wavelength |
| Visualization | Standard bright-field microscope | Fluorescence or confocal microscope |
| Key Assay Steps | Enzyme-conjugated antibody incubation followed by substrate addition | Incubation with fluorophore-conjugated antibodies |
| Primary Background Sources | Non-specific enzyme activity, endogenous enzymes, precipitate diffusion | Sample autofluorescence, non-specific antibody binding, light scattering |
| Signal Permanence | Stable, permanent | Can fade (photobleaching) |
| Multiplexing Capability | Limited | Excellent |
In-Depth Analysis of Chromogenic Background Challenges
Endogenous Enzyme Activity
A significant source of false-positive staining in chromogenic assays is the presence of endogenous enzymes that can catalyze the same reaction as the reporter enzyme. For example, when using HRP-conjugated antibodies, endogenous peroxidases present in tissues (particularly in red blood cells) can react with the hydrogen peroxide in the substrate solution, generating a precipitate indistinguishable from the specific signal [59]. Similarly, when using AP-conjugated antibodies, endogenous alkaline phosphatase can cause the same issue. To mitigate this, blocking steps are essential prior to the antibody incubation. Endogenous peroxidase is typically blocked by incubating samples with a solution of hydrogen peroxide, while endogenous alkaline phosphatase can be blocked with levamisole [59].
Non-Specific Probe Binding and Precipitation Diffusion
In chromogenic in situ hybridization (CISH), background can arise from non-specific hybridization of the probe to non-target sequences within the tissue. Furthermore, the enzymatic precipitation reaction, while generating an immobile signal compared to soluble fluorescent products, can still exhibit some diffusion, potentially reducing the resolution and creating a "halo" effect around the true target [57]. This is particularly problematic when detecting low-abundance transcripts. Optimizing hybridization conditions, such as temperature and buffer composition, is critical to minimize this. Research on planarian WISH has shown that a short bleaching step in formamide not only reduces autofluorescence but also dramatically improves tissue permeability and signal intensity for chromogenic detection, suggesting it improves probe access and hybridization efficiency [58].
In-Depth Analysis of Fluorescent Background Challenges
Autofluorescence
Autofluorescence is the most pervasive challenge in fluorescent detection. It is the inherent emission of light by biological molecules or other materials in the sample when excited by the illumination source. Common sources include lipofuscin, collagen, and elastin in tissues [55]. In whole-mount samples, the problem is compounded; for example, planarians exhibit autofluorescence across a broad spectrum, and Xenopus tadpole melanophores and melanosomes can mask specific signals [58] [10]. Autofluorescence creates a high noise floor, drastically reducing the signal-to-noise ratio and making weak signals difficult or impossible to detect.
Several strategies exist to combat autofluorescence:
- Chemical Quenching: Incubating samples with reagents that reduce autofluorescence. A common and effective method is treatment with copper sulfate, which has been shown to virtually eliminate planarian autofluorescence [58].
- Bleaching: Using light or chemicals to bleach pigments. In Xenopus WISH, a photo-bleaching step is used to decolorize melanosomes and melanophores after fixation, significantly improving signal clarity [10].
- Spectral Shift: Choosing fluorophores that emit in the red or far-red wavelengths, where tissue autofluorescence is typically lower, as autofluorescence is often most intense in the green channel [55] [59].
Non-Specific Antibody Binding and Unbound Dye
Background in fluorescence can also stem from the detection reagents themselves. Non-specific binding of primary or secondary antibodies to charged or hydrophobic sites on tissues is a common issue [59]. Furthermore, unconjugated fluorophores that are not thoroughly washed away can contribute to a high, diffuse background signal.
Mitigation involves:
- Optimized Blocking: Using high-quality blocking agents is crucial. Studies have found that adding Roche Western Blocking Reagent (RWBR) to the blocking buffer dramatically reduced background for fluorescent in situ hybridization (FISH) without diminishing the specific signal [58].
- Thorough Washing: Adequate washing after antibody incubations is essential to remove unbound reagents [55].
- Antibody Titration: Using the lowest effective concentration of antibody minimizes non-specific binding. A titration experiment is recommended to find the optimal concentration that provides a strong signal with minimal background [55].
- Cross-Adsorbed Secondaries: Using secondary antibodies that have been "cross-adsorbed" against serum proteins from other species ensures they will not bind non-specifically to endogenous immunoglobulins in the sample [59].
Table 2: Summary of Background Challenges and Mitigation Strategies
| Detection System | Primary Background Source | Mechanism | Key Mitigation Strategies |
|---|---|---|---|
| Chromogenic | Endogenous Enzymes | Tissue peroxidases/phosphatases react with substrate | Pre-block with Hâ‚‚Oâ‚‚ (for HRP) or levamisole (for AP) [59] |
| Precipitation Diffusion | Enzymatic product diffuses slightly before depositing | Optimize fixation; use fast-precipitating substrates | |
| Non-Specific Probe Binding | Probe hybridizes to off-target sequences | Optimize hybridization temperature & buffer; use formamide bleaching [58] | |
| Fluorescent | Autofluorescence | Native molecules in tissue emit light | Copper sulfate quenching, photo-bleaching, use red-shifted dyes [58] [55] [10] |
| Non-Specific Antibody Binding | Antibodies stick to tissue non-specifically | Optimize blocking (e.g., with RWBR), use cross-adsorbed secondary antibodies, titrate antibodies [58] [59] | |
| Unbound Dye | Fluorophores not washed away remain in sample | Increase number and duration of wash steps [55] |
Experimental Protocols for Background Reduction
Protocol: Quenching Autofluorescence with Copper Sulfate
This protocol, adapted from planarian FISH studies, is highly effective for reducing autofluorescence in a variety of tissues [58].
- Following the final wash after fixation and/or permeabilization, prepare a quenching solution of 50 mM copper sulfate in 50 mM ammonium acetate buffer (pH 5.0).
- Incubate the whole-mount samples in the quenching solution for 1 hour at room temperature. The optimal incubation time may vary by tissue and should be determined empirically.
- Rinse the samples thoroughly with PBS or the appropriate wash buffer before proceeding to the hybridization or immunostaining steps.
- Compare the quenched sample to an unquenched control under the fluorescence microscope to confirm reduction of autofluorescence.
Protocol: Combined Bleaching and Permeabilization for WISH
Optimized for challenging samples like regenerating Xenopus tadpole tails, this combined protocol tackles both pigment-related autofluorescence and background from loose tissue structures [10].
- Fix samples in MEMPFA or 4% PFA.
- Dehydrate the samples through a graded methanol series (e.g., 25%, 50%, 75% in PBS-Tween) and store in 100% methanol.
- Rehydrate the samples and perform an early photo-bleaching step: Place samples in a clearing solution (e.g., 1:2 formamide:0.2x SSCT) under strong light to decolorize melanophores.
- Notch the Fins: Using a fine scalpel, make fringe-like incisions in the loose fin tissues at a distance from the area of interest. This drastically improves reagent penetration and washing, preventing trapping of reagents that cause non-specific chromogenic staining.
- Proceed with the standard in situ hybridization protocol.
Visualization of Detection Pathways and Challenges
The following diagram illustrates the core mechanisms of each detection method and their primary associated background challenges, providing a visual summary of the concepts discussed.
The Scientist's Toolkit: Key Reagents for Background Mitigation
Successful reduction of background staining relies on the use of specific reagents. The following table lists essential tools for managing the challenges inherent to both chromogenic and fluorescent detection systems.
Table 3: Essential Reagents for Background Mitigation in Detection Systems
| Reagent | Function | Application Context |
|---|---|---|
| Hydrogen Peroxide (Hâ‚‚Oâ‚‚) | Blocks endogenous peroxidase activity | Chromogenic (HRP-based) detection [59] |
| Levamisole | Inhibits endogenous alkaline phosphatase activity | Chromogenic (AP-based) detection [59] |
| Copper Sulfate | Chemical quencher of tissue autofluorescence | Fluorescent detection (FISH, Immunofluorescence) [58] |
| Formamide | Used in bleaching step to improve permeability & reduce background | Whole-mount ISH for both chromogenic & fluorescent [58] |
| Roche Western Blocking Reagent (RWBR) | Protein-based blocking agent to reduce non-specific antibody binding | Primarily for fluorescent detection (FISH) [58] |
| IgG-Free BSA | High-purity blocking agent to prevent cross-reactivity with sample immunoglobulins | Immunoassays for both detection types [59] |
| Cross-Adsorbed Secondary Antibodies | Secondary antibodies purified to minimize recognition of immunoglobulins from other species | Multiplex fluorescent detection & indirect chromogenic detection [59] |
| Triton X-100 | Detergent to improve reagent penetration and reduce non-specific sticking in wash buffers | Whole-mount techniques for both detection types [58] |
Whole-mount in situ hybridization (WISH) is a cornerstone technique in developmental and regenerative biology, enabling the spatial visualization of gene expression patterns within intact tissues [60] [10]. However, a significant challenge that consistently confounds the interpretation of WISH results is background staining. Within the context of a broader thesis, background staining is not a monolithic problem but arises from a confluence of factors rooted in tissue integrity, permeability, and the inherent chemistry of the detection process. Traditional protocols often rely on harsh permeabilization agents, such as proteinase K and mucolytic compounds like N-acetyl cysteine (NAC), which compromise delicate tissue structures like the epidermis and regeneration blastema. This degradation creates pockets where detection reagents, such as chromogens, become trapped, leading to non-specific signal [60] [10]. Furthermore, inadequate clearing of endogenous pigments, like melanin in Xenopus tadpoles, can mask specific signals and be misinterpreted as background [10]. The pursuit of novel fixation and clearing methods is therefore driven by the need to preserve anatomical integrity while achieving sufficient probe penetration, thereby minimizing the primary causes of background and enabling the accurate visualization of gene expression.
Traditional vs. Novel Fixation Methods: A Quantitative and Qualitative Comparison
The following table summarizes a direct comparison between a traditional protocol (NAC) and a novel protocol (NAFA) in planarian research, based on quantitative and qualitative data [60].
Table 1: Quantitative and Qualitative Comparison of Traditional NAC and Novel NAFA Protocols in Planaria
| Evaluation Parameter | Traditional NAC Protocol | Novel NAFA Protocol | Implications for Background Staining |
|---|---|---|---|
| Epidermal Integrity | Noticeable breaches and damage [60] | Well-preserved; no visible damage [60] | Preserved epidermis prevents trapping of reagents, a major cause of background. |
| Blastema Integrity | Likely damaged or destroyed [60] | Robustly preserved [60] | Prevents non-specific staining in fragile new tissue. |
| Probe Permeation | Effective for internal (piwi-1) and external (zpuf-6) markers [60] | Effective for internal (piwi-1) and external (zpuf-6) markers [60] | Both methods achieve primary goal; NAFA does so without structural damage. |
| Compatibility with Immunostaining | Weak antibody signal (e.g., anti-H3P); likely due to proteinase K digestion [60] | Strong, bright antibody signal [60] | Avoidance of protease preserves antigen epitopes, reducing non-specific antibody binding. |
| Muscle Fiber Preservation | Disrupted integrity; loss of circular fibers [60] | Tightly packed, evenly spaced fibers preserved [60] | Better tissue preservation minimizes aberrant binding sites for probes and antibodies. |
Diagram 1: Logical framework linking causes of WISH background staining to targeted solutions.
Detailed Experimental Protocols for Novel Methods
The NAFA Fixation Protocol for Planaria
The Nitric Acid/Formic Acid (NAFA) protocol was designed to be compatible with both WISH and immunofluorescence while preserving fragile tissues [60].
Key Methodology:
- Fixation: Animals are fixed in a solution containing nitric acid.
- Permeabilization: Samples are treated with a formic acid-based solution. This critical step replaces the traditional proteinase K digestion, thereby preserving protein epitopes for subsequent immunostaining.
- EGTA Inclusion: The calcium chelator EGTA is included in the protocol to inhibit nucleases and protect RNA integrity during sample preparation.
- Hybridization and Detection: Standard steps for in situ hybridization are followed, using either chromogenic (e.g., BM Purple) or fluorescent probes.
The protocol's efficacy was validated by examining the expression of known markers, such as piwi-1 (neoblasts) and zpuf-6 (epidermal progenitors), and by co-staining with antibodies like anti-acetylated tubulin (cilia) and anti-phospho-histone H3 (mitotic cells) [60].
Optimized WISH Protocol for Regenerating Xenopus Tails
Research on regenerating Xenopus laevis tadpole tails faced challenges with pigment interference and background in loose fin tissues. An optimized protocol was developed to address these issues [10].
Key Methodology:
- Fixation: Tadpoles are fixed in MEMPFA.
- Early Photo-bleaching: Immediately after fixation and dehydration, samples are treated with a photo-bleaching solution. This step decolors melanosomes and melanophores, removing pigment-based background that can obscure the specific chromogenic signal.
- Tail Fin Notching: Before hybridization, the loose tissues of the caudal fin are carefully notched in a fringe-like pattern at a safe distance from the area of interest.
- Hybridization and Staining: Standard WISH is performed with an antisense RNA probe for the target gene (e.g., mmp9), followed by development with BM Purple.
This combination of physical notching and chemical bleaching was crucial for obtaining high-contrast images of mmp9-expressing cells during early tail regeneration, without the background staining that plagued standard protocols [10].
The Scientist's Toolkit: Essential Reagents for Background Reduction
Table 2: Key Research Reagents and Their Functions in Minimizing Background
| Reagent / Material | Function in Protocol | Role in Reducing Background |
|---|---|---|
| Formic Acid | A carboxylic acid used in the NAFA protocol for tissue permeabilization [60]. | Replaces proteinase K, preserving tissue integrity and preventing reagent trapping. |
| EGTA | A calcium chelator included in fixation solutions [60]. | Inhibits RNases, protecting RNA integrity and preventing degradation-related artifacts. |
| Proteinase K | A protease used in traditional protocols to digest proteins and permit probe entry [60] [10]. | A common source of background; over-digestion damages tissue, creating sites for non-specific chromogen deposition. |
| BM Purple | A chromogenic substrate that yields a purple/black precipitate upon reaction with alkaline phosphatase [10]. | Can cause high background if over-developed or trapped in loose tissues; requires careful monitoring. |
| Hydrogen Peroxide (Hâ‚‚Oâ‚‚) | Used for blocking endogenous peroxidase activity in immunohistochemistry and some ISH protocols [27]. | Elimulates false-positive signals from endogenous enzymes that would otherwise catalyze the chromogen reaction. |
| Normal Serum | Used as a blocking agent before applying antibodies [27]. | Binds to non-specific sites, preventing antibodies from sticking to tissue in a non-specific manner. |
| Photo-bleaching Solution | A chemical treatment (e.g., using Harland's method) to remove pigments [10]. | Clears melanin and other light-absorbing pigments that mask specific signals and increase noise. |
| Detergent (e.g., Tween-20) | Added to wash buffers and antibody diluents [27]. | Reduces hydrophobic interactions, minimizing non-specific binding of probes and antibodies to tissue components. |
Diagram 2: Experimental workflow integrating novel fixation and clearing strategies.
The systematic evaluation of traditional versus novel fixation and clearing methods reveals that the predominant causes of background staining in WISH are not merely incidental but are directly linked to fundamental trade-offs in tissue processing. Traditional protocols that prioritize probe penetration via harsh enzymatic and chemical treatments do so at the cost of tissue integrity, which in turn becomes a primary source of non-specific signal. The novel methods examined here—the NAFA protocol for planaria and the optimized protocol for Xenopus—demonstrate that this compromise is not inevitable. By replacing proteinase K with alternative permeabilization agents and implementing strategic physical and chemical clearing steps, these protocols successfully preserve the delicate architecture of regenerative tissues. This preservation, coupled with effective probe access, directly mitigates the key pathways to background staining, enabling the high-fidelity, high-contrast visualization of gene expression that is essential for advancing research in development, regeneration, and drug discovery.
Each of these techniques provides a unique lens for probing gene expression, yet each also possesses inherent limitations. Whole mount in situ hybridization (WISH) offers unparalleled spatial resolution of mRNA distribution within intact tissues or embryos, making it indispensable for developmental biology studies. However, its semi-quantitative nature and susceptibility to background staining can complicate data interpretation. RNA sequencing (RNA-seq) provides comprehensive, quantitative transcriptome data but lacks spatial context and may not always correlate perfectly with protein expression due to post-transcriptional regulation. Immunostaining (IHS) allows direct visualization of protein localization and abundance but depends heavily on antibody specificity and affinity.
The integration of these three methodologies creates a powerful framework for validation, where the strengths of one technique can compensate for the weaknesses of another. This tripartite approach is particularly valuable for addressing a common challenge in WISH: distinguishing specific signal from non-specific background staining. By systematically correlating WISH patterns with RNA-seq quantification and immunostaining localization, researchers can build a more compelling case for their biological conclusions while troubleshooting persistent technical artifacts.
Technical Foundations: Principles and Pitfalls of Each Method
Whole Mount In Situ Hybridization (WISH)
The fundamental principle of WISH involves hybridizing labeled nucleic acid probes to complementary mRNA sequences within fixed tissues, followed by chromogenic or fluorescent detection. This process preserves the three-dimensional architecture of the specimen while revealing the spatial distribution of target transcripts. A critical challenge in WISH experiments is achieving high signal-to-noise ratio, which requires careful optimization of hybridization conditions, probe design, and washing stringency.
Non-specific background staining in WISH can arise from multiple sources, including probe trapping in tissue cavities, non-specific binding to charged structures, endogenous enzyme activity in enzymatic detection methods, or inadequate blocking of non-specific binding sites. The fixed nature of tissues used in WISH means that epitope masking and limited probe penetration can further complicate signal interpretation, particularly in thicker specimens. These limitations make correlative validation with other methods essential for confident conclusion drawing.
RNA Sequencing Technologies
RNA sequencing has revolutionized transcriptomics by providing quantitative, genome-wide expression data. As noted in a beginner's guide to RNA-seq analysis, the process involves "conversion of RNA, either total, enriched for mRNA, or depleted of rRNA, into cDNA" followed by adapter ligation and high-throughput sequencing [61]. The resulting reads are then aligned to a reference genome or transcriptome to generate quantitative expression values for each gene.
Multiple RNA-seq platforms exist, including Illumina, Ion Torrent/Proton, and Oxford Nanopore, each with different library preparation protocols that "utilize different enzymes and numbers of PCR cycles" [62]. This methodological diversity creates significant challenges for data comparison, as "different reagents and protocols for RNA sequencing often produce incompatible results" [62]. For correlative validation with WISH, consistency in RNA-seq methodology is paramount, particularly when using archived FFPE samples where "significantly degraded RNA preparations can be obtained" [62].
Immunohistochemistry and Immunofluorescence
Immunostaining techniques rely on the specific binding of antibodies to target antigens within tissue sections. Immunohistochemistry (IHC) uses enzyme-based detection (typically HRP or AP) with chromogenic substrates, while immunofluorescence (IF) employs fluorophore-conjugated antibodies for signal generation. Both approaches provide spatial protein localization data that can complement WISH mRNA distribution patterns.
A critical challenge in immunostaining is antibody specificity, which must be rigorously validated using appropriate positive and negative controls. As noted in troubleshooting guides, "A complete lack of staining in your immunohistochemistry (IHC) experiment may indicate an issue with the antibody or protocol," while excessive background can arise from "endogenous enzymes," "endogenous biotin," or "secondary antibody cross-reactivity" [63]. For correlation with WISH, it's essential to recognize that mRNA and protein levels, while often correlated, can be discordant due to post-transcriptional regulation, translation efficiency, and protein turnover rates.
Establishing Correlation: Quantitative Frameworks
Analytical Validation of RNA-seq with IHC
Recent large-scale studies have systematically evaluated the correlation between RNA sequencing data and protein expression measured by immunohistochemistry. A 2025 study analyzing 365 formalin-fixed, paraffin-embedded samples across multiple cancer types demonstrated "strong correlations for most biomarkers, with coefficients ranging from 0.53 to 0.89" between RNA-seq and IHC measurements [64] [65]. The study established RNA-seq thresholds that accurately reflected clinical IHC classifications, with high diagnostic accuracy up to 98% for some biomarkers [64] [65].
An earlier 2020 study focusing on breast and lung cancer specimens found similarly strong correlations, reporting "Spearman's rho 0.65-0.798" for HER2/ERBB2, ER/ESR1, and PGR genes in breast cancer and for PDL1 in lung cancer, with all correlations being "statistically significant (p < 0.00004)" [62]. The area under the curve (AUC) values for these biomarkers ranged from 0.912 to 0.963, demonstrating excellent predictive power of RNA-seq for IHC status [62].
Table 1: Correlation Between RNA-seq and IHC for Key Biomarkers
| Biomarker | Gene Symbol | Spearman's Correlation (Ï) | Cancer Type | Statistical Significance |
|---|---|---|---|---|
| HER2 | ERBB2 | 0.65-0.798 | Breast | p < 0.00004 |
| Estrogen Receptor | ESR1 | 0.65-0.798 | Breast | p < 0.00004 |
| Progesterone Receptor | PGR | 0.65-0.798 | Breast | p < 0.00004 |
| PD-L1 | CD274 | 0.65-0.798 | Lung | p < 0.00004 |
| Ki-67 | MKI67 | 0.53-0.89 | Pan-cancer | Not specified |
| Androgen Receptor | AR | 0.53-0.89 | Pan-cancer | Not specified |
Applying Correlation Principles to WISH Validation
The established correlation frameworks between RNA-seq and IHC provide a methodological template for validating WISH data. While WISH is less easily quantifiable than RNA-seq, several approaches can facilitate correlation:
Semi-quantitative WISH scoring systems that categorize staining intensity (0-3+) and distribution (focal, regional, diffuse) enable statistical comparison with RNA-seq TPM (transcripts per million) or FPKM (fragments per kilobase million) values. For consistent scoring, establish reference images for each intensity category and implement blinded evaluation by multiple independent observers.
Spatial correlation algorithms can align WISH signal patterns with corresponding immunostaining in serial sections. This approach is particularly valuable for confirming that mRNA and protein localization patterns correspond in complex tissues. Advanced image registration tools can compensate for tissue distortion between sections.
Tissue segmentation strategies that separate regions of high, medium, and low expression in each modality allow for compartment-specific correlation analysis. This is especially important when background staining in WISH might obscure regional expression patterns.
Table 2: Troubleshooting Background Staining in WISH Using Correlative Approaches
| Background Type | WISH-Only Interpretation | RNA-seq Correlation | IHS Correlation | True Nature |
|---|---|---|---|---|
| Diffuse, even staining | Possible weak specific signal | Low expression values | No protein detection | Non-specific background |
| Punctate foci in specific structures | Potential specific localization | No expression in region | No protein detection | Probe trapping |
| Regional pattern matching expression domain | Specific signal | High expression in region | Protein present in region | True positive |
| Regional pattern absent in expression domain | Specific signal | Low expression in region | Protein present in region | Cross-hybridization |
Integrated Workflows for Method Correlation
The integration of WISH, RNA-seq, and immunostaining requires careful experimental planning and execution. The following workflow diagram illustrates a systematic approach for correlative validation that controls for technical variability and enables meaningful data integration:
Sample Preparation for Multi-Method Analysis
Consistent sample preparation across all three methodologies is fundamental for meaningful correlation. For WISH, RNA-seq, and immunostaining, "fixation time and type should be taken into consideration," as some epitopes and RNA accessibility are fixation-sensitive [2]. When possible, adjacent tissue sections should be allocated to each method to minimize biological variability.
For RNA-seq from FFPE samples, studies note that "degraded RNAs from FFPE specimens can provide high-quality expression profiles" despite shorter read lengths [62]. However, special consideration should be given to RNA integrity, with protocols recommending "RNA isolation from FFPE samples using 10 µm-thick paraffin slices" and quality assessment through RIN scores [64]. For WISH, tissue permeabilization must be optimized to balance probe access with tissue morphology preservation.
Protocol Synchronization
Synchronizing critical steps across methodologies enhances correlation accuracy. Antigen retrieval in immunostaining has parallels with proteinase K treatment in WISH, both aiming to expose masked epitopes or RNA targets. As noted in IHC protocols, "antigen unmasking performed with a microwave is preferred, though staining of particular tissues or antigen targets may require the use of a pressure cooker" [66]. Similarly, appropriate controls must be implemented across all methods, including positive controls with known expression patterns and negative controls without probe or primary antibody.
Blocking steps represent another synchronization opportunity. WISH protocols typically include acetylation or blocking reagent treatments to reduce non-specific probe binding, while immunostaining uses serum or BSA to minimize antibody non-specificity. As noted in troubleshooting guides, background issues can often be resolved by "blocking endogenous lectins" or "increasing serum concentration to as high as 10%" [63].
Table 3: Research Reagent Solutions for Correlative Validation Experiments
| Reagent/Category | Function | Technical Considerations |
|---|---|---|
| Probe Design Tools | Generate specific WISH probes | Avoid repetitive regions; optimize GC content; include positive control probes |
| RNA Preservation Solutions | Maintain RNA integrity for sequencing | Compatible with WISH fixation; minimize degradation during storage |
| Antigen Retrieval Buffers | Expose masked epitopes in IHS | Citrate-based (pH 6.0) or Tris-EDTA (pH 9.0); optimize for each target [2] |
| Blocking Reagents | Reduce non-specific binding | Use species-appropriate serum or specialized blocking reagents for each method |
| Detection Systems | Signal generation | Choose fluorophores/chromogens with minimal overlap; consider enzymatic vs direct detection |
| Alignment & Registration Software | Spatial data correlation | Account for tissue distortion; enable precise region-of-interest comparison |
Troubleshooting Background Staining in WISH Through Correlative Approaches
Background staining in WISH represents a significant challenge for data interpretation. The integrated three-method approach provides powerful tools for distinguishing true signal from artifact. The following diagram illustrates a systematic troubleshooting workflow that leverages the strengths of each technique to diagnose and resolve background issues:
When correlative data reveal discordance between WISH staining and RNA-seq or immunostaining results, systematic troubleshooting can identify the specific technical issue:
Scenario 1: WISH staining present but no RNA-seq expression or immunostaining signal This pattern suggests non-specific background in the WISH assay. Potential causes include inadequate washing stringency, probe over-concentration, or non-specific trapping in tissue cavities. Solutions include increasing hybridization stringency through temperature adjustment or formamide concentration, titrating probe concentration, and incorporating more rigorous washing steps with agitation.
Scenario 2: WISH and RNA-seq signals concordant but no immunostaining This pattern may indicate true mRNA expression without translation, rapid protein turnover, or issues with the immunostaining protocol itself. Before concluding biological significance, troubleshoot the immunostaining by validating antibody performance on known positive controls, optimizing antigen retrieval methods (where "microwave oven is recommended for antigen retrieval" [66]), and verifying detection system sensitivity.
Scenario 3: Focal WISH staining inconsistent with RNA-seq spatial patterns This may indicate probe cross-hybridization with related sequences or off-target binding. Bioinformatics reassessment of probe specificity and BLAST analysis against the current genome build can identify potential cross-hybridization targets. Designing non-overlapping probes against different regions of the same transcript can confirm specificity.
Technical Optimization Guided by Correlation
The correlation framework enables data-driven protocol optimization. For example, if background staining correlates with regions of low RNA-seq expression, systematic adjustment of hybridization conditions can be quantitatively assessed. Similarly, if specific signal is weak but confirmed by RNA-seq, signal amplification methods can be strategically employed without increasing background.
For enzymatic detection in WISH, background can arise from "endogenous enzymes" similar to those noted in IHC troubleshooting [63]. Pre-hybridization treatments with levamisole (for alkaline phosphatase) or Hâ‚‚Oâ‚‚ (for peroxidase) can quench this activity. As with IHC, "quench endogenous peroxidases with 3% Hâ‚‚Oâ‚‚ in methanol or water" [63].
The correlative validation of WISH with RNA-seq and immunostaining represents a powerful paradigm for strengthening molecular localization studies. By leveraging the quantitative power of RNA-seq and the protein-specific visualization of immunostaining, researchers can confidently distinguish authentic expression patterns from technical artifacts in WISH experiments. The established correlations between RNA sequencing and immunohistochemistry for key biomarkers provide a methodological foundation for extending this approach to WISH validation.
This tripartite framework is particularly valuable for addressing the persistent challenge of background staining in WISH, enabling researchers to make data-driven decisions about protocol optimization and result interpretation. As molecular techniques continue to evolve, the integration of spatial transcriptomics with highly multiplexed immunostaining will further enhance our ability to validate and contextualize WISH findings, ultimately leading to more robust and reproducible biological insights.
Whole-mount in situ hybridization (WISH) is a foundational technique in developmental biology, enabling the spatial visualization of gene expression patterns within intact tissues and embryos. The principle, often summarized as "seeing is believing," provides invaluable insight into the molecular orchestration of biological processes such as embryonic development and tissue regeneration [10]. However, a persistent challenge that compromises the utility and clarity of this method is non-specific background staining. This staining obscures legitimate signals, decreases the signal-to-noise ratio, and complicates the interpretation of results, particularly when targeting low-abundance transcripts or working with complex, pigmented tissues.
In the context of whole-mount samples, background arises from a confluence of factors. Tissues prone to background, such as the regenerating tail of Xenopus laevis tadpoles, present specific hurdles. Firstly, pigment cells like melanophores and their pigment granules (melanosomes) actively migrate to sites of injury or interest, physically overlapping with and absorbing the chromogenic stain, making specific signal detection nearly impossible [10]. Secondly, the physical structure of certain tissues, like the loose, fin-like structures in tadpole tails, traps reagents and staining solutions. This trapping leads to non-specific autocromogenic reactions, where the visualization substrate precipitates out of solution even in the absence of the target mRNA [10]. Thirdly, non-specific probe binding to cellular components or imperfectly washed tissues remains a ubiquitous source of noise, especially when trying to detect faint expression patterns that require long staining incubations [10].
Addressing this challenge requires a multi-pronged strategy. While sample preparation optimizations—such as pigment bleaching and strategic tissue notching to improve reagent penetration and washing—are critical for reducing inherent background [10], they are often insufficient for high-sensitivity applications. This is where advanced signal amplification systems play a transformative role. By dramatically enhancing the specific signal from the target mRNA, these technologies effectively elevate the signal-to-noise ratio, making the true expression pattern unmistakable even against residual background. This technical guide explores the core signal amplification technologies that are redefining the sensitivity and specificity of whole-mount in situ hybridization.
Fundamental Causes of Background Staining
A strategic approach to reducing background begins with a thorough understanding of its origins. The following diagram synthesizes the primary causes and their interrelationships, forming a diagnostic tool for troubleshooting WISH experiments.
Pigment Interference and Tissue Structural Challenges
As illustrated, background staining is not a monolithic issue but stems from distinct, often co-occurring, problems. The interference from pigment cells is a pronounced issue in non-albino model organisms. In Xenopus laevis tadpoles, for example, melanophores and their constituent melanosomes are highly mobile and accumulate at amputation sites during regeneration. Their dark pigmentation directly competes with and obscures the typical BM Purple chromogenic stain, complicating both visualization and photodetection of the true signal [10].
Simultaneously, the three-dimensional architecture of whole-mount samples presents a significant diffusion and washing challenge. Tissues with loose mesenchyme or extensive fin structures, such as the tadpole tail fin, create a physical maze that impedes the free flow of solutions. During the hybridization and washing steps, probes can be trapped non-specifically. More critically, during the color development phase, the visualization substrate can become trapped and precipitate autonomously, generating a false-positive stain that is indistinguishable from a specific signal [10]. This phenomenon is a major contributor to high background in complex samples.
Advanced Signal Amplification Systems
To overcome the limitations of conventional single-step probe detection, several powerful signal amplification systems have been developed. These methods operate on the principle of building a large signaling complex exclusively at the site of probe hybridization, thereby dramatically increasing the signal intensity for low-abundance targets without amplifying the background.
Key Amplification Technologies and Their Mechanisms
The following table provides a comparative summary of the major signal amplification technologies used in modern FISH applications.
Table 1: Comparison of Key Signal Amplification Technologies for FISH
| Technology | Core Mechanism | Key Advantage | Consideration for Background |
|---|---|---|---|
| Hybridization Chain Reaction (HCR) [67] [9] | Uses metastable DNA probes that self-assemble into long, fluorescently labeled polymers upon recognizing a target. | Linear signal amplification allows quantification of RNA abundance; very low background with split-probe design [9]. | High specificity of initiator probes minimizes non-specific polymerization, directly reducing background [9]. |
| Rolling Circle Amplification (RCA) [67] [9] | A circular DNA probe hybridizes to the target and is amplified by a DNA polymerase into a long single-stranded DNA concatamer. | Can generate an extremely large signal at a single site, ideal for detecting single RNA molecules [9]. | The large product size can improve signal localization but requires careful probe design and washing. |
| Signal Amplification by Exchange Reaction (SABER) [67] | Primers are extended off the original probe to create longer DNA strands that can bind multiple fluorescent imager strands. | Enables highly multiplexed imaging by using unique barcodes for different targets [67]. | The exchange reaction is highly specific, but the use of multiple imager strands requires stringent washing. |
| CRISPR FISHer [67] | Utilizes CRISPR/Cas systems for precise target recognition and phase separation techniques to concentrate signal. | Allows for in situ hybridization in living cells [67]. | A nascent technology; background profiles in whole-mount tissues are still being characterized. |
The Hybridization Chain Reaction (HCR): A Model for Background Reduction
HCR stands out for its exceptional ability to provide strong amplification while maintaining remarkably low background. The process, detailed in the workflow below, leverages a cleverly designed, split-initiator system that is the key to its specificity.
The critical feature of HCR is the use of two separate metastable hairpin DNA probes (H1 and H2) that are thermodynamically stable in solution and cannot react with each other on their own. Amplification is initiated only when two short, complementary DNA probes bind adjacently on the target mRNA, bringing together the two initiator sequences that then sequentially open the fluorophore-labeled hairpins [9]. This requirement for co-localization on the specific target means that any single probe binding non-specifically elsewhere in the tissue is powerless to trigger the amplification cascade. This fundamental design principle is what confers HCR its exceptionally low background, making it supremely suitable for challenging whole-mount samples where non-specific probe trapping is a concern [9].
Furthermore, because the amplification is linear and predictable, the fluorescence intensity of the HCR product can be directly correlated to the quantity of target mRNA present in a specific region of the tissue. This transforms the technique from a merely qualitative one to a quantitative or semi-quantitative method (qHCR FISH) for mapping gene expression in situ [9].
Integrated Experimental Protocol: Combining Sample Preparation and Signal Amplification
Achieving the clearest results requires integrating optimized sample preparation with a robust amplification technology. The protocol below synthesizes best practices for background reduction in a challenging model system, incorporating both sample preparation from [10] and amplification principles from [67] [9].
Workflow for Low-Background, High-Sensitivity WISH
Detailed Methodologies
Sample Fixation and Early Photo-bleaching
- Fix tadpole samples immediately post-amputation (e.g., 0-24 hpa) in MEMPFA to best preserve RNA and minimize inherent background [10].
- Critical Step: Perform photo-bleaching immediately after fixation and dehydration. This step decolors melanosomes and melanophores, effectively removing the pigment that would otherwise obscure the specific fluorescence or chromogenic signal [10]. This is superior to post-staining bleaching, which only fades pigments to brown.
Tissue Notching for Enhanced Reagent Penetration
- Protocol: Using fine microscissors, make small, fringe-like incisions in the loose fin tissues at a safe distance from the primary area of interest (e.g., the regenerating tail tip) [10].
- Rationale: This physical modification creates channels that dramatically improve the inflow and outflow of all reagents, including probes, wash buffers, and amplification hairpins. This prevents trapping and non-specific precipitation, which is a primary cause of background in loose tissues [10].
Probe Hybridization and HCR Amplification
- Hybridize with custom-designed, short oligonucleotide FISH probes (25-50 base pairs) for better tissue penetration [9].
- Amplification Protocol: Following stringent post-hybridization washes, incubate the sample with the metastable HCR hairpin probes (H1 and H2). The amplification time (e.g., 2 hours for single-molecule detection or longer for higher signal) can be tuned based on the required sensitivity [9].
- Rationale: The split-initiator system of HCR ensures that the powerful signal amplification occurs only at the precise location of the target mRNA, conferring high specificity and a very low background [9].
Optical Clearing and 3D Imaging
- Protocol: Render the tissue transparent using a compatible optical clearing method, such as the hydrophilic LIMPID (Lipid-preserving refractive index matching for prolonged imaging depth) solution. This involves immersing the stained sample in the LIMPID solution until clear [9].
- Rationale: Clearing reduces light scattering, enabling high-resolution 3D imaging deep within the tissue using confocal or light-sheet microscopy. This allows for the complete mapping of gene expression patterns throughout the entire whole-mount sample without physical sectioning [9].
The Scientist's Toolkit: Essential Research Reagents
Table 2: Key Reagents for Advanced Low-Background WISH
| Reagent / Solution | Function | Technical Note |
|---|---|---|
| MEMPFA Fixative [10] | Cross-links and preserves tissue morphology and RNA integrity. | Preferable over other fixatives for regenerating tail samples to minimize background [10]. |
| HCR FISH Probes [9] | Short DNA oligonucleotides that specifically hybridize to target mRNA and initiate amplification. | Customizable for any organism; split-initiator design is key to low background. |
| Metastable HCR Hairpins [9] | Fluorophore-labeled DNA hairpins that self-assemble into a polymer upon initiation. | Must be designed and purified carefully to maintain stability and prevent non-specific amplification. |
| LIMPID Clearing Solution [9] | Aqueous clearing medium that matches tissue refractive index to render it transparent. | Preserves lipid structure and fluorescence better than harsh organic solvents. |
| Proteinase K [10] | Enzyme that digests proteins to increase tissue permeability for probes. | Usage must be optimized; over-digestion can damage tissue morphology [10]. |
The challenge of background staining in whole-mount in situ hybridization is a multifaceted problem rooted in tissue pigmentation, structural complexity, and the fundamental limitations of direct probe detection. A modern solution does not rely on a single miracle fix but on an integrated strategy that combines prudent sample preparation—such as early photo-bleaching and tissue notching—with the power of advanced signal amplification technologies. Among these, Hybridization Chain Reaction (HCR) stands out for its engineered specificity, which virtually eliminates non-specific background by design while providing quantifiable, linear signal amplification. When this integrated wet-lab protocol is coupled with modern 3D optical clearing techniques like LIMPID, researchers are empowered to achieve unprecedented clarity and depth in visualizing gene expression patterns. This holistic approach to background reduction ensures that "seeing is believing" remains a robust and reliable principle in developmental and regenerative biology.
Conclusion
Background staining in WISH is a multifaceted problem rooted in tissue biochemistry, probe chemistry, and technical execution. Success requires an integrated approach combining foundational knowledge of staining mechanisms, proactive protocol design with optimized fixation and blocking, systematic troubleshooting for specific artifacts, and rigorous validation. Future advancements will likely emerge from novel probe technologies, refined tissue-clearing methods compatible with FISH, and standardized controls, ultimately enhancing the reliability of spatial gene expression data crucial for developmental biology, disease modeling, and drug discovery.
References
- 1. An improved method for whole-mount in situ hybridization ... [https://pmc.ncbi.nlm.nih.gov/articles/PMC11663889/]
- 2. Immunofluorescence Staining of Paraffin Sections Step by ... [https://www.frontiersin.org/journals/neuroanatomy/articles/10.3389/fnana.2020.582218/full]
- 3. Tissue fixation and the effect of molecular fixatives on ... [https://pmc.ncbi.nlm.nih.gov/articles/PMC4240801/]
- 4. Intro to Tissue Fixation in Histology: Types, Methods & More [https://www.leicabiosystems.com/us/knowledge-pathway/fixation-and-fixatives-1-the-process-of-fixation-and-the-nature-of-fixatives/]
- 5. In Situ Hybridization Methods for Mouse Whole Mounts and Tissue Sections with and Without Additional β-Galactosidase Staining - PMC [https://pmc.ncbi.nlm.nih.gov/articles/PMC4118283/]
- 6. Cell fixation improves performance of in situ crosslinking ... [https://www.nature.com/articles/s41467-024-52844-y]
- 7. High-Resolution Whole-Mount In Situ Hybridization Using Quantum Dot Nanocrystals - PMC [https://pmc.ncbi.nlm.nih.gov/articles/PMC3263632/]
- 8. Whole Mount in Situ Hybridization of E8.5 to E11.5 Mouse Embryos - PMC [https://pmc.ncbi.nlm.nih.gov/articles/PMC3227170/]
- 9. A simple and fast optical clearing method for whole-mount ... [https://pmc.ncbi.nlm.nih.gov/articles/PMC12342960/]
- 10. An improved method for whole-mount in situ hybridization ... [https://www.frontiersin.org/journals/cell-and-developmental-biology/articles/10.3389/fcell.2024.1487644/full]
- 11. Probing Electrostatic and Hydrophobic Associative ... [https://pmc.ncbi.nlm.nih.gov/articles/PMC11551953/]
- 12. Nonspecific interactions in biomedical applications [https://www.sciencedirect.com/science/article/abs/pii/S1359029419301001]
- 13. Optimizing Xenium In Situ data utility by quality assessment ... [https://www.nature.com/articles/s41592-025-02617-2]
- 14. Detection of engineered T cells in FFPE tissue by multiplex ... [https://www.sciencedirect.com/science/article/abs/pii/S0022175920302490]
- 15. In Situ Hybridization: Tips, Techniques, and Expert Insights [https://www.the-scientist.com/tips-and-tricks-for-in-situ-hybridization-71928]
- 16. Methods to assess tissue permeability [https://pubmed.ncbi.nlm.nih.gov/23955735/]
- 17. An imaging-based platform for high-content, quantitative ... [https://www.nature.com/articles/srep03751]
- 18. A Practical Approach to Quantitative Processing and ... [https://pmc.ncbi.nlm.nih.gov/articles/PMC4866578/]
- 19. High-Content Analysis (Quantitative Imaging) Information [https://www.thermofisher.com/us/en/home/life-science/cell-analysis/cell-analysis-learning-center/cell-imaging-information/high-content-analysis-information.html]
- 20. Fixation Strategies and Formulations Used in IHC Staining [https://www.thermofisher.com/us/en/home/life-science/protein-biology/protein-biology-learning-center/protein-biology-resource-library/pierce-protein-methods/fixation-strategies-formulations.html]
- 21. An optimized fixation method containing glyoxal and ... [https://pmc.ncbi.nlm.nih.gov/articles/PMC8127994/]
- 22. Protocol optimization improves the performance of ... [https://www.nature.com/articles/s41598-025-17477-1]
- 23. In Situ Hybridization Support—Troubleshooting [https://www.thermofisher.com/us/en/home/technical-resources/technical-reference-library/gene-expression-analysis-genotyping-support-center/in-situ-hybridization-support/ish-support-troubleshooting.html]
- 24. In Situ Hybridization Protocol & Troubleshooting [https://www.creativebiolabs.net/in-situ-hybridization.htm]
- 25. An optimised whole mount in situ hybridisation protocol for the ... [https://bmcdevbiol.biomedcentral.com/articles/10.1186/s12861-015-0068-7]
- 26. A guided protocol for tissue dissection and proteinase K ... [https://www.sciencedirect.com/science/article/pii/S2215016124004333]
- 27. Ultimate IHC Troubleshooting Guide: Fix Weak Staining & ... [https://www.atlasantibodies.com/knowledge-hub/blog/the-ultimate-ihc-troubleshooting-guide-from-weak-staining-to-high-background/]
- 28. Blocking Strategies for IHC [https://www.thermofisher.com/us/en/home/life-science/protein-biology/protein-biology-learning-center/protein-biology-resource-library/pierce-protein-methods/blocking-strategies-ihc.html]
- 29. Basics of the Blocking Step in IHC [https://www.nsh.org/blogs/natalie-paskoski/2021/02/19/basics-of-the-blocking-step-in-ihc]
- 30. Tissue-specific RNA localization in the uterus during ... [https://pmc.ncbi.nlm.nih.gov/articles/PMC10299818/]
- 31. In situ hybridization protocol for enhanced detection of gene ... [https://bmcdevbiol.biomedcentral.com/articles/10.1186/1471-213X-13-8]
- 32. TrueProbes: Quantitative Single-Molecule RNA-FISH ... [https://elifesciences.org/reviewed-preprints/108599]
- 33. Designing Stellaris RNA FISH Probes Part I [https://blog.biosearchtech.com/considerations-for-optimizing-stellaris-rna-fish-probe-design]
- 34. HybriSeq: probe-based device-free single-cell RNA profiling [https://www.nature.com/articles/s42003-025-08702-8]
- 35. Protocol to identify DNA-binding proteins recognizing ... [https://pmc.ncbi.nlm.nih.gov/articles/PMC11021352/]
- 36. Validation of a Targeted RNA Sequencing Assay for ... [https://pmc.ncbi.nlm.nih.gov/articles/PMC5975628/]
- 37. WO2007109163A2 - Wash and method of using - Google Patents buffer [https://patents.google.com/patent/WO2007109163A2]
- 38. ULTRAhybâ„¢ Ultrasensitive Hybridization 125 mL | Contact Us Buffer [https://www.thermofisher.com/order/catalog/product/AM8670]
- 39. xGen Hybridization and Wash v3 Kit & Core Reagents | IDT [https://www.idtdna.com/pages/products/next-generation-sequencing/workflow/xgen-ngs-hybridization-capture/hybridization-capture-core-reagents]
- 40. Steps to Better ISH Staining [https://www.leicabiosystems.com/us/knowledge-pathway/steps-to-better-ish/]
- 41. ISH: in situ hybridization protocol [https://www.abcam.com/en-us/technical-resources/protocols/in-situ-hybridization]
- 42. Quality Control Considerations for Fluorescence In Situ ... [https://www.intechopen.com/chapters/38445]
- 43. A technical review and guide to RNA fluorescence in situ ... [https://pmc.ncbi.nlm.nih.gov/articles/PMC7085896/]
- 44. In Situ Hybridization (ISH) - NCBI - NIH [https://www.ncbi.nlm.nih.gov/probe/docs/techish/]
- 45. H.O.H. (Human On Human) Immunodetection Kit [https://vectorlabs.com/products/human-on-human-immunodetection-kit/?srsltid=AfmBOoptLGluumBRqWnrqHE6aqKJiOfvrx_6lMe6Zre-X7lDuDmT4SAo]
- 46. The impact of different coverslipping methods in the quality ... [https://pmc.ncbi.nlm.nih.gov/articles/PMC9576983/]
- 47. Mastering manual coverslipping in histology. [https://www.statlab.com/news/mastering-manual-coverslipping-in-histology]
- 48. Deep Dive: Fixing and Permeabilizing for ... [https://blog.addgene.org/deep-dive-fixing-and-permeabilizing-for-immunofluorescence]
- 49. Assessment of Different Permeabilization Methods ... [https://pmc.ncbi.nlm.nih.gov/articles/PMC3895578/]
- 50. All-age whole mount in situ hybridization to reveal larval and ... [https://journals.plos.org/plosone/article?id=10.1371/journal.pone.0237167]
- 51. Review of In Situ Hybridization (ISH) Stain Images Using ... [https://pmc.ncbi.nlm.nih.gov/articles/PMC11430898/]
- 52. of E8.5 to E11.5 Mouse Embryos Whole Mount in Situ Hybridization [https://www.jove.com/t/2797/whole-mount-in-situ-hybridization-of-e85-to-e115-mouse-embryos]
- 53. Haematology FISH protocol - Post-hybridisation washes [https://www.ogt.com/resources/fish-resources-and-support/fish-support/haematology-fish-protocol-post-hybridisation-washes/]
- 54. Chromogenic Assays: What they are and how ... [https://www.goldbio.com/blogs/articles/chromogenic-assays-introduction-overview?srsltid=AfmBOorw_1_ejhen6daLDVsPHM7KSwNqrgjjJNo6GStMzlj0HTTKHkzf]
- 55. Background in Fluorescence Imaging [https://www.thermofisher.com/us/en/home/life-science/cell-analysis/cell-analysis-learning-center/molecular-probes-school-of-fluorescence/imaging-basics/protocols-troubleshooting/troubleshooting/background-fluorescence.html]
- 56. Chromogenic Western Blotting Substrates [https://www.thermofisher.com/us/en/home/life-science/protein-biology/protein-biology-learning-center/protein-biology-resource-library/pierce-protein-methods/chromogenic-western-blotting-substrates.html]
- 57. Simultaneous high-resolution detection of multiple transcripts ... [https://bmcbiol.biomedcentral.com/articles/10.1186/s12915-014-0055-7]
- 58. In situ hybridization protocol for enhanced detection of gene ... [https://pmc.ncbi.nlm.nih.gov/articles/PMC3610298/]
- 59. Challenges with Secondary Detection [https://fluorofinder.com/secondary-detection-challenges/]
- 60. A powerful and versatile new fixation protocol for ... [https://pmc.ncbi.nlm.nih.gov/articles/PMC11533299/]
- 61. A Beginner’s Guide to Analysis of RNA Sequencing Data - PMC [https://pmc.ncbi.nlm.nih.gov/articles/PMC6096346/]
- 62. RNA Sequencing in Comparison to Immunohistochemistry for Measuring Cancer Biomarkers in Breast Cancer and Lung Cancer Specimens - PMC [https://pmc.ncbi.nlm.nih.gov/articles/PMC7277916/]
- 63. IHC Troubleshooting Guide [https://www.thermofisher.com/us/en/home/life-science/protein-biology/protein-biology-learning-center/protein-biology-resource-library/pierce-protein-methods/ihc-troubleshooting-guide.html]
- 64. RNA sequencing and immunohistochemistry jointly ... [https://pmc.ncbi.nlm.nih.gov/articles/PMC12318096/]
- 65. RNA sequencing and immunohistochemistry jointly improve tumor biomarker interpretation | Scientific Reports [https://www.nature.com/articles/s41598-025-12780-3]
- 66. Immunohistochemistry (IHC) Troubleshooting Guide & the ... [https://www.cellsignal.com/learn-and-support/troubleshooting/ihc-troubleshooting-guide?srsltid=AfmBOorfLeVsBpd798rh5ee5AM-ml6hGqQGxeMq_xM0pFXPRG1urKxMP]
- 67. Technical innovations of signal amplification in ... [https://www.sciencedirect.com/science/article/abs/pii/S0378111925004366]