A Complete Guide to Mounting Embryos for Confocal Microscopy After Immunofluorescence
This guide provides researchers and drug development professionals with a comprehensive framework for mounting embryos for high-resolution confocal imaging post-immunofluorescence.
A Complete Guide to Mounting Embryos for Confocal Microscopy After Immunofluorescence
Abstract
This guide provides researchers and drug development professionals with a comprehensive framework for mounting embryos for high-resolution confocal imaging post-immunofluorescence. It covers foundational principles of confocal microscopy for 3D reconstruction, detailed protocols for whole-mount immunofluorescence and custom mounting techniques, essential troubleshooting for common issues like poor penetration and photobleaching, and validation strategies through comparative imaging and cell cycle analysis. By integrating established methods with recent innovations in labeling and mounting, this article serves as a vital resource for obtaining publication-quality, three-dimensional data from embryonic specimens.
Core Principles and Advantages of Confocal Microscopy for Embryo Imaging
How Confocal Microscopy Eliminates Out-of-Focus Light for Sharper Images
In light microscopy, particularly when imaging thicker specimens such as embryos, a significant challenge is the presence of out-of-focus light. During illumination, light passes through the entire sample, and fluorescence is emitted from dye molecules at all depths. Light from sample planes above and below the focal plane is also detected, adding a haze or blur that obscures fine detail and reduces image resolution [1]. Confocal microscopy addresses this fundamental limitation. By incorporating spatial filtering at a conjugate image plane, it rejects this out-of-focus light, thereby providing high-resolution imaging and the ability to optically section thick tissues [1] [2]. For researchers mounting embryos for immunofluorescence, this capability is transformative, allowing for precise three-dimensional profiling of protein expression patterns within the intact, complex architecture of embryonic tissues [3] [4]. This application note details the principles of confocal microscopy and provides a targeted protocol for imaging immunolabeled embryos.
The Core Principle of Optical Sectioning
The defining feature of a confocal microscope is its use of pinhole apertures placed in front of both the illumination source and the detector. These pinholes are positioned in optically conjugate planes (confocal) with the focal point in the specimen [1].
- Point Illumination and Detection: In a confocal system, the illumination and detection optics are focused on the same, single, diffraction-limited spot within the sample. A laser beam is focused by the objective lens onto this small spot [1].
- Spatial Filtering: Fluorescent light emitted from this illuminated spot is collected by the objective and focused onto the detection pinhole. Light originating precisely from the focal plane passes efficiently through this pinhole to reach the detector. In contrast, out-of-focus light, which does not come to a tight focus at the pinhole plane, is largely physically blocked [1] [2]. This "double focusing" system is the key mechanism for rejecting blur.
- Image Construction: As only one spot is imaged at a time, a complete two-dimensional image is built by scanning this illumination spot across the sample in a raster pattern, point-by-point. By sequentially imaging multiple focal planes (a z-stack), a high-resolution three-dimensional representation of the sample can be reconstructed [1].
The following diagram illustrates the optical pathway and the principle of out-of-focus light rejection.
Figure 1: Confocal microscope optical path. Out-of-focus emission light (red) is blocked by the detection pinhole.
Quantitative Performance Advantages
The confocal principle provides measurable improvements in resolution over conventional widefield fluorescence microscopy. The theoretical limits are determined by the numerical aperture (NA) of the objective lens, the wavelength of light (λ), and the refractive index (η) of the mounting medium [1].
Table 1: Theoretical Resolution Limits in Confocal Microscopy
| Resolution Type | Formula | Example Calculation (λ=500 nm, η=1.33, NA=1.4) |
|---|---|---|
| Lateral Resolution (x, y) | R~lateral~ = 0.4λ / NA | (0.4 × 500) / 1.4 ≈ 143 nm |
| Axial Resolution (z) | R~axial~ = 1.4λη / NA² | (1.4 × 500 × 1.33) / (1.4)² ≈ 476 nm |
Note: Resolution is improved by closing the pinhole to a minimum size, but this trades off signal-to-noise, which is critical for dim samples [1].
Compared to widefield microscopy, the most significant advantage is not just a marginal resolution improvement, but optical sectioning. This capability eliminates the haze from out-of-focus planes, which is particularly debilitating in thick, scattering samples like embryos [2]. The result is a clear image where fine details from the focal plane are preserved, enabling accurate 3D reconstruction.
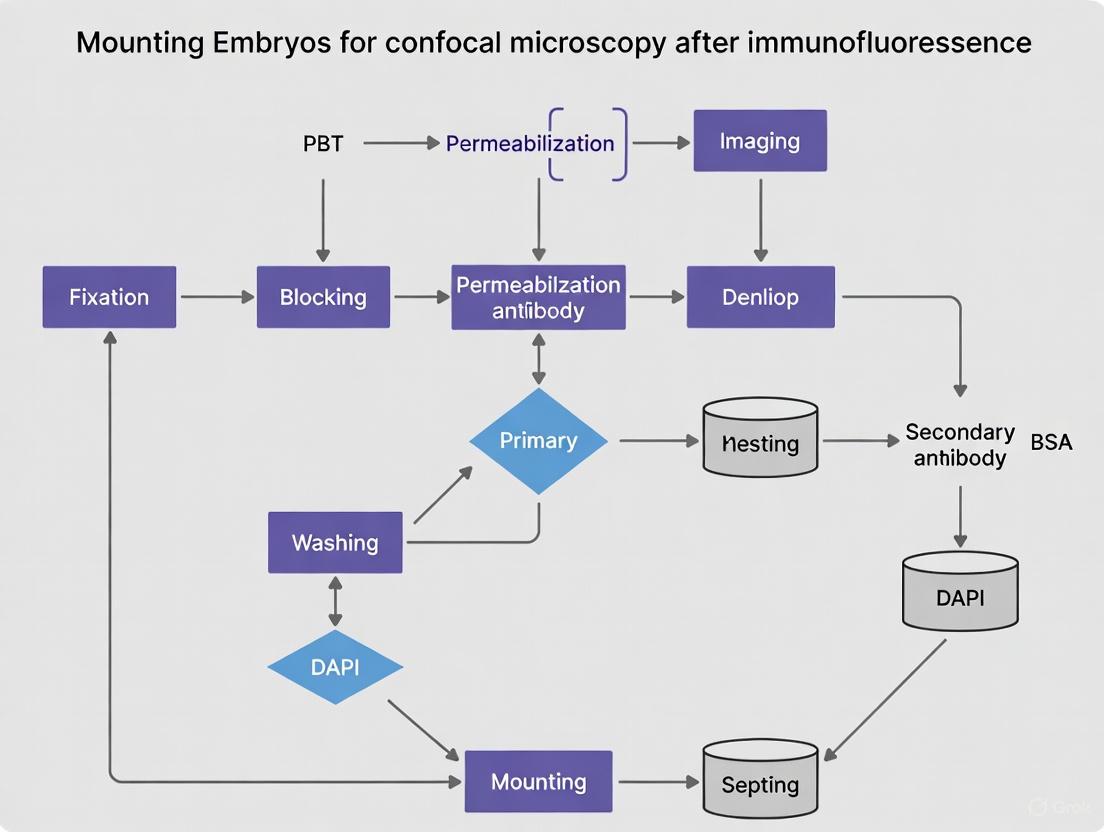
Protocol: Mounting and Imaging Immunolabeled Embryos by Confocal Microscopy
This protocol integrates whole-mount immunofluorescence with confocal imaging, tailored for embryonic samples such as Drosophila, zebrafish, or mouse embryos [3] [4] [5]. The workflow ensures optimal specimen preservation, staining, and imaging for 3D analysis.
Figure 2: Experimental workflow for embryo preparation and imaging.
Stage 1: Fixation and Preparation
The goal is to preserve tissue architecture and antigenicity while allowing antibody penetration.
- Fixative Selection: The most common fixative is 4% Paraformaldehyde (PFA). However, PFA causes protein cross-linking which can mask some epitopes. If an antibody is known to be PFA-sensitive, methanol is a suitable alternative [4].
- Procedure:
- Fix dissected embryos in 4% PFA. Incubation times must be extended for whole-mount samples to ensure complete penetration. This can range from 30 minutes at room temperature to overnight at 4°C [4].
- For zebrafish embryos: Remove the chorion (egg membrane) via manual dechorionation with fine forceps or enzymatic treatment with pronase (1-2 mg/mL for 5-10 minutes) to permit fixative and antibody entry [4].
- Wash fixed samples thoroughly in PBS to remove residual fixative before proceeding.
Critical Consideration: Antigen retrieval techniques common in sectioned IHC are generally not feasible for fragile whole-mount embryos, as the heat treatment would destroy the sample. Therefore, fixative optimization is crucial [4].
Stage 2: Immunofluorescence Staining
- Permeabilization and Blocking: Incubate embryos in a blocking buffer (e.g., containing serum and a detergent like Triton X-100 or Tween-20) for several hours to permeabilize membranes and reduce non-specific antibody binding. The duration depends on embryo size and stage [4] [5].
- Antibody Incubation:
- Primary Antibody: Incubate with the primary antiserum diluted in blocking buffer. Incubation times can range from overnight to several days at 4°C to ensure deep penetration [4] [5].
- Washing: Perform extensive washes with a wash buffer (e.g., PBS with detergent) over several hours to remove unbound antibody.
- Secondary Antibody: Incubate with fluorochrome-conjugated secondary antibodies, again with extended incubation times. Protect from light from this step onward [5].
- Multicolor Imaging: The protocol allows for simultaneous labeling with up to three different primary antisera, provided they are raised in different host species and paired with species-specific secondary antibodies conjugated to distinct fluorophores [5].
Stage 3: Mounting and Image Acquisition
- Mounting: For imaging, embryos can be mounted in a glycerol-based mounting medium on a depression slide or dish. To prevent crushing, use grease to create a supportive chamber for the cover slip [4]. Alternatively, embryos can be set in gelatin for stability.
- Confocal Settings:
- Pinhole Diameter: For the highest resolution, set the pinhole to 1 Airy Unit. For dimmer samples, opening the pinhole will collect more light at the cost of slightly thicker optical sections [1].
- Z-Stack Acquisition: Define the top and bottom of the region of interest and acquire sequential optical sections (z-stack) with a step size appropriate for your axial resolution (e.g., 0.5 μm). This stack is the raw data for 3D reconstruction [1].
- Laser Power and Detector Gain: Balance these settings to obtain a strong signal while minimizing photobleaching and background noise.
The Scientist's Toolkit: Essential Materials
Table 2: Key Reagents and Equipment for Embryo Confocal Imaging
| Item | Function | Application Notes |
|---|---|---|
| Paraformaldehyde (PFA) | Cross-linking fixative | Preserves tissue structure; 4% is standard. May mask some epitopes [4]. |
| Methanol | Precipitating fixative | Alternative to PFA for epitope-sensitive targets [4]. |
| Triton X-100/Tween-20 | Detergent | Permeabilizes cell membranes to allow antibody penetration [4]. |
| Normal Serum | Blocking agent | Reduces non-specific background from secondary antibody binding [4]. |
| Fluorophore-conjugated Secondary Antibodies | Signal generation | Amplifies primary antibody signal; enables multiplexing [5]. |
| DAPI | Nuclear counterstain | Fluorescent DNA dye that labels all nuclei, defining cellular architecture [4]. |
| Laser Scanning Confocal Microscope (LSCM) | Imaging system | Provides point-scanning, optical sectioning, and high-resolution z-stack acquisition [1]. |
| High-NA Objective Lens | Image capture | Critical for resolution and light collection; oil or water immersion objectives are often used [1]. |
Confocal microscopy, through its fundamental principle of point illumination and spatial filtering via pinholes, effectively eliminates the degrading effects of out-of-focus light. This provides the sharpness and optical sectioning capability necessary to resolve the intricate, three-dimensional details of immunolabeled embryonic tissues. By following the detailed protocol for whole-mount staining and imaging outlined herein, researchers can reliably generate high-quality data that preserves the native spatial context of protein expression, driving discovery in developmental biology and beyond.
The Critical Role of Optical Sectioning and 3D Volume Reconstruction
In modern biological research, the transition from two-dimensional analysis to three-dimensional (3D) reconstruction has revolutionized our understanding of complex structures, particularly in developmental biology. Optical sectioning serves as the foundational technique for this transition, enabling researchers to acquire high-resolution images at different focal planes within a thick sample without physical sectioning. This non-destructive approach preserves sample integrity while allowing for the reconstruction of 3D models that provide superior analysis of phenotypic differences, especially crucial when comparing wild-type and mutant specimens [6].
The core challenge in conventional wide-field microscopy is the presence of intense out-of-focus fluorescent background, which compromises image quality by obscuring in-focus details. This issue is particularly pronounced in embryo imaging, where complex 3D structures and dynamic developmental processes require precise visualization. Optical sectioning techniques address this limitation by selectively capturing light from the focal plane while rejecting out-of-focus light, thereby producing crisp, clear images suitable for accurate 3D reconstruction [7] [8]. For researchers mounting embryos for confocal microscopy after immunofluorescence, mastering these techniques is essential for generating reliable, high-quality 3D data.
Principles and Comparative Analysis of Optical Sectioning Techniques
Fundamental Principles
Optical sectioning methods operate on the principle of spatially restricting either illumination or detection to isolate signals from the focal plane. In conventional wide-field microscopy with epi-illumination, both in-focus and out-of-focus regions are excited simultaneously, and the detector collects all emitted light, resulting in a blurred image with significant background noise. Optical sectioning techniques overcome this limitation through various physical and computational approaches that minimize out-of-focus light collection [7].
Confocal microscopy, one of the most established optical sectioning methods, employs a point-scanning approach where a small spot of light illuminates the sample, and a pinhole in front of the detector blocks light from out-of-focus regions. This focal plane conjugation method ensures that only light from the focal plane reaches the detector, dramatically improving image contrast and axial resolution [7] [8]. The effectiveness of this approach can be quantitatively described by the system's axial response, which decays rapidly with defocusing distance, indicating strong optical sectioning capability [7].
Classification of Optical Sectioning Methods
Optical sectioning methods can be categorized based on the spatial relationship between illumination and detection axes:
- Coaxial imaging: Illumination and detection axes coincide, requiring physical or computational strategies to separate in-focus from out-of-focus light. This category includes confocal microscopy, two-photon microscopy, and structured illumination microscopy (SIM) [7].
- Off-axis imaging: Illumination and detection axes have a specific offset or angle, physically separating in-focus and out-of-focus information. Light sheet fluorescence microscopy (LSFM) represents the prime example of this category, offering inherent optical sectioning capability through orthogonal illumination and detection [7].
Table 1: Comparison of Major Optical Sectioning Microscopy Techniques
| Technique | Working Principle | Optical Sectioning Strength | Advantages | Limitations | Ideal Application Scenarios |
|---|---|---|---|---|---|
| Confocal Microscopy | Point scanning with pinhole detection | High | High resolution, commercial availability | Phototoxicity, limited penetration | Fixed cells, superficial tissue layers |
| Two-Photon Microscopy | Nonlinear excitation with long wavelengths | Moderate-High | Deep tissue penetration, low phototoxicity | Expensive equipment, lower resolution | Live tissue, brain imaging |
| Structured Illumination Microscopy (SIM) | Patterned illumination with computational processing | Moderate | High resolution, relatively fast | Multiple acquisitions needed | Dynamic processes in cultured cells |
| Light Sheet Microscopy (LSFM) | Orthogonal illumination with camera detection | High | Very low phototoxicity, high speed | Sample mounting challenges, scattering in dense tissues | Long-term live imaging, developmental biology |
Advanced Techniques: FO-3DSIM
Recent advancements in optical sectioning include techniques like F0-3DSIM, which integrates spatial-domain reconstruction with optical-sectioning SIM. This novel approach enhances reconstruction speed by up to 855.7 times compared to traditional 3D structured illumination microscopy while maintaining high-fidelity, low-photon reconstruction capabilities. FO-3DSIM demonstrates superior performance with limited z-layers and under high defocused backgrounds, making it particularly suitable for live imaging applications where photodamage must be minimized [9].
This method addresses a significant gap between single-layer 2DSIM and traditional 6-layer 3DSIM, allowing observation of delicate structures like endoplasmic reticulum tubes with just three layers. The dramatic reduction in reconstruction time—from hours to minutes—enables near real-time observation of dynamic biological processes, opening new possibilities for high-throughput, large field-of-view 3D super-resolution imaging [9].
Experimental Protocols for Embryo Mounting and Imaging
Tissue Preparation for 3D Reconstruction
Proper tissue preparation is paramount for successful optical sectioning and 3D reconstruction, especially for complex structures like the vertebrate inner ear or developing embryos. The following protocol has been adapted from established methods for 3D reconstruction of mouse inner ear specimens and can be modified for various tissue types [6]:
Dissection and Fixation: Dissect previously fixed tissue in 0.4% paraformaldehyde (PFA) at room temperature. Maintain tissue integrity by avoiding puncture of critical structures. Proper fixation with crosslinking between proteins is essential for withstanding subsequent dehydration steps. Tissue can be stored indefinitely in 4% PFA before proceeding [6].
Decalcification (for older specimens): For tissues containing bone, such as postnatal inner ears, decalcify with 10% EDTA dissolved in 4% PFA (pH 7.4) in 0.1M phosphate buffer. Decalcify at room temperature on a shaker for at least 3 days with daily solution changes. Incomplete decalcification will prevent proper laser penetration. After decalcification, wash samples three times with 1× PBS for at least 1 hour [6].
Immunohistochemistry (if applicable): Without disrupting structural integrity, remove a small amount of surrounding tissue to allow antibody penetration. Perform standard immunochemistry protocols with extended incubation times and additional washes to ensure proper penetration without compromising 3D structure [6].
Dehydration: Dehydrate tissues through a graded ascending ethanol series:
- 50% ethanol overnight at room temperature on shaker
- 75% ethanol twice for at least 2 hours at room temperature on shaker
- 100% ethanol overnight at room temperature on shaker Proper dehydration is essential for subsequent clearing steps, as incomplete dehydration will cause distortion during imaging [6].
Staining with Rhodamine B Isothiocyanate: Stain with 0.0005 mg Rhodamine diluted in one milliliter of 100% ethanol solution until tissue appears very light pink (approximately 1-2 days). This concentration is critical—over-staining will create unequal intensities from top to bottom of the z-stack, while under-staining reduces imaging clarity. A properly stained specimen should show consistent intensity throughout the tissue depth [6].
Layered Mounting Method for Live Embryo Imaging
For time-lapse imaging of developing embryos, traditional mounting in agarose can restrict growth and cause distortions. The following layered mounting method for zebrafish embryos addresses these challenges while providing sufficient immobilization for confocal microscopy [10]:
Workflow for Layered Mounting of Embryos
Optimization of Agarose Concentration
The critical parameter in this protocol is identifying the optimal concentration of agarose for Layer 1, which must minimize both embryo motility and growth restriction:
- Initial screening: Mount embryos in increasing concentrations of agarose ranging from 0.01% to 1%, followed by time-lapse imaging to assess growth restriction and motility.
- Fine-tuning: Based on initial results, test a finer range of concentrations (e.g., 0.025% to 0.040%) to identify the optimal concentration where both distortion and motility are minimized.
- Validation: For zebrafish embryos, the optimal concentration typically falls around 0.03%, but this should be determined empirically for different specimen types and developmental stages [10].
Image Acquisition and 3D Reconstruction
The process of 3D reconstruction from optical sections involves systematic image acquisition followed by computational processing:
Z-stack acquisition: Using a confocal microscope, acquire images at sequential focal planes through the sample thickness. The number of slices and step size between slices should be optimized based on the objective lens numerical aperture and expected structure dimensions [8].
Optical sectioning parameters: For confocal microscopy, adjust pinhole size, laser power, and detector gain to maximize signal-to-noise ratio while minimizing photodamage. Smaller pinholes provide better optical sectioning but reduce signal intensity [8].
3D reconstruction: Import the z-stack into specialized software (e.g., Amira, Imaris) for 3D visualization and analysis. The software computationally assembles the individual optical sections into a volumetric representation that can be rotated, sectioned virtually, and quantitatively analyzed [6] [8].
Table 2: Troubleshooting Guide for Optical Sectioning and 3D Reconstruction
| Problem | Potential Causes | Solutions | Preventive Measures |
|---|---|---|---|
| Poor image quality in deeper layers | Incomplete decalcification, insufficient antibody penetration, over-staining | Increase EDTA concentration, extend decalcification time, remove more surrounding tissue for antibody access | Verify decalcification by checking tissue transparency, optimize staining concentration |
| Uneven intensity through z-stack | Uneven staining, improper clearing | Wash out and restain specimen, ensure complete dehydration before clearing | Standardize staining protocol, verify staining intensity before mounting |
| Sample movement during acquisition | Inadequate immobilization, temperature fluctuations | Optimize agarose concentration, ensure stable temperature control | Use layered mounting method, verify stability before starting time-lapse |
| Distorted morphology | Growth restriction by mounting medium, physical pressure | Use optimized low-concentration agarose in Layer 1, minimize physical constraints | Implement layered mounting method allowing natural growth |
| Photobleaching | Excessive laser power, insufficient signal-to-noise ratio | Optimize laser power and detector gain, use antifade reagents | Establish imaging parameters on control samples first |
The Scientist's Toolkit: Essential Research Reagents and Materials
Successful optical sectioning and 3D reconstruction requires specific reagents and materials optimized for preserving sample integrity while facilitating high-quality imaging. The following table details essential components for embryo mounting and processing based on protocols from the search results:
Table 3: Essential Research Reagents and Materials for Embryo Mounting and Imaging
| Reagent/Material | Specifications/Concentrations | Primary Function | Protocol Notes |
|---|---|---|---|
| Paraformaldehyde (PFA) | 0.4%-4% in phosphate buffer | Tissue fixation and preservation | Crosslinks proteins; essential for structural integrity during processing |
| EDTA | 10% in 4% PFA, pH 7.4 | Decalcification of bony tissues | Removes calcium; critical for laser penetration in calcified tissues |
| Low-melt Agarose | 0.03%-1% in embryo media | Sample immobilization for imaging | Layer 1 (0.03%) minimizes restriction; Layer 2 (1%) provides stability |
| Tricaine (MS-222) | 0.016%-0.020% in embryo media | Anesthesia for live specimens | Prevents movement during imaging; concentration critical for viability |
| N-phenylthiourea (PTU) | 200 μM in embryo media | Inhibition of pigment formation | Enhances optical clarity by reducing light scattering from pigments |
| Rhodamine B Isothiocyanate | 0.0005 mg/mL in 100% ethanol | Non-specific cellular staining | Critical concentration; over-staining causes uneven z-stack intensity |
| Phosphate Buffered Saline (PBS) | 1×, pH 7.4 | Washing and solution preparation | Isotonic buffer maintains tissue structure during processing |
Optical sectioning and 3D volume reconstruction represent indispensable methodologies in modern developmental biology and drug discovery research. The techniques and protocols outlined in this application note provide researchers with a comprehensive framework for obtaining high-quality 3D data from embryo specimens, particularly following immunofluorescence studies. By selecting appropriate optical sectioning methods, optimizing sample preparation protocols, and implementing specialized mounting techniques that balance immobilization with natural growth requirements, scientists can uncover biological insights that would remain inaccessible through conventional 2D imaging approaches. As these technologies continue to evolve, with advancements such as FO-3DSIM offering dramatically improved reconstruction speeds and reduced phototoxicity, the potential for new discoveries in embryonic development and disease mechanisms continues to expand.
When mounting embryos for confocal microscopy after immunofluorescence, researchers confront three persistent challenges that can compromise image quality and data integrity. The fundamental advantage of confocal microscopy—its ability to provide high-resolution optical sections by rejecting out-of-focus light—also imposes specific demands on specimen preparation [1]. Specimen size directly determines the number of optical sections required to image the entire sample, affecting imaging time and potential photodamage. Penetration barriers limit antibody and dye access to internal structures, while autofluorescence creates background noise that obscures specific signal detection.
These challenges become particularly critical when working with embryos, where preserving three-dimensional architecture while achieving specific labeling throughout the tissue requires optimized protocols. The confocal microscope itself undersamples fluorescence in thick specimens compared to conventional widefield microscopy, often necessitating increased staining times or concentrations for confocal analysis [11]. Understanding and addressing these interconnected challenges forms the foundation for successful high-quality imaging of mounted embryos.
Quantitative Analysis of Specimen Challenges
The following tables summarize key quantitative relationships between specimen characteristics and imaging parameters, providing researchers with essential data for experimental planning.
Table 1: Relationship Between Objective Lens Parameters and Optical Section Thickness [11]
| Objective Magnification | Numerical Aperture (NA) | Optical Section Thickness (μm) Pinhole Closed (1 mm) | Optical Section Thickness (μm) Pinhole Open (7 mm) |
|---|---|---|---|
| 60x | 1.40 | 0.4 | 1.9 |
| 40x | 1.30 | 0.6 | 3.3 |
| 40x | 0.55 | 1.4 | 4.3 |
| 25x | 0.80 | 1.4 | 7.8 |
| 4x | 0.20 | 20.0 | 100.0 |
Table 2: Resolution Calculations in Confocal Microscopy [1]
| Resolution Type | Formula | Key Parameters |
|---|---|---|
| Lateral Resolution | R_lateral = 0.4λ/NA | λ = emission wavelength, NA = numerical aperture |
| Axial Resolution | R_axial = 1.4λη/(NA)² | η = refractive index of mounting medium |
Table 3: Autofluorescence Sources and Solutions
| Autofluorescence Source | Affected Specimens | Mitigation Strategies |
|---|---|---|
| NADH, Flavins, Lipofuscins | Biological tissues broadly | Chemical treatments (Sudan black, sodium borohydride) |
| Collagen, Elastin | Connective tissues | Spectral unmixing, far-red dyes |
| Aldehyde Fixatives | Chemically fixed specimens | Reduction with BH4 or NH3Cl |
| Phenol Red in Media | Live-cell imaging | Switch to phenol red-free medium |
| Chlorophyll, Lignin | Plant tissues | Photobleaching prior to staining |
Specimen Size and Optical Sectioning Considerations
Size Limitations and Practical Constraints
Specimen size directly influences multiple imaging parameters in confocal microscopy. The physical constraints require that specimens must fit on the microscope stage, with the area of interest positioned within the working distance of the objective lens [11]. Working distance becomes a critical factor when imaging larger embryos, as high-resolution lenses with numerical apertures (e.g., 60x/NA 1.4) may have working distances as limited as 170 micrometers, while lower magnification lenses (e.g., 20x/NA 0.75) might offer working distances of 660 micrometers [11].
For embryo mounting, this necessitates careful consideration of orientation and mounting technique to ensure regions of interest remain accessible. Large specimens may require sequential imaging of multiple fields with subsequent digital montaging, a process that can be automated with motorized stages [11]. The number of optical sections needed to image an entire embryo follows the simple relationship: Number of sections = Specimen thickness / Optical section thickness. This calculation directly affects imaging time, data storage requirements, and photon exposure to the specimen.
Optimizing Imaging Parameters for Different Specimen Sizes
The choice of objective lens represents a compromise between resolution and field of view. While zoom capabilities can electronically increase magnification, resolution fundamentally depends on numerical aperture rather than digital zoom [11]. For embryo imaging, a multi-scale approach often proves most effective:
- 4x objective: Locating specimens and overall orientation
- 16x-25x objective: Imaging whole embryos or large structures
- 40x-60x objective: Resolving individual cells and subcellular structures
The pinhole diameter provides another adjustable parameter for managing specimen size challenges. As shown in Table 1, opening the pinhole increases optical section thickness, which can be beneficial for surveying larger areas or when working with dim samples, though at the cost of reduced resolution [1] [11]. For thick embryos where complete imaging is impractical, strategic sectioning using microtomes or vibratomes may be necessary, though this sacrifices the intact three-dimensional context [11].
Penetration Barriers and Solutions
Fundamental Penetration Challenges
Penetration barriers in embryo imaging manifest in two interrelated forms: light penetration limitations and reagent delivery constraints. Unfixed, unstained corneal epithelium permits laser penetration to approximately 200 micrometers, while unfixed skin scatters light strongly, limiting penetration to about 10 micrometers [11]. This penetration depth directly constrains the useful imaging volume within embryo specimens.
Reagent penetration presents equally significant challenges. Antibodies and dyes must traverse multiple cellular barriers to reach their internal targets, with delivery efficiency decreasing dramatically with depth. The hydrodynamic radius of antibody complexes, particularly when conjugated to fluorophores, can limit penetration through dense embryonic tissues. This effect is compounded by nonspecific binding during diffusion, which depletes reagents before they reach internal targets.
Protocols for Enhanced Penetration
Protocol 4.2.1: Tissue Permeabilization for Embryo Specimens
- Fixation: Apply appropriate fixative (e.g., 4% formaldehyde for 10 minutes for mammalian cells) [12].
- Permeabilization Solution: Prepare PBS containing 0.1-0.5% Triton X-100, NP-40, or Saponin.
- Incubation: Treat specimens with permeabilization solution for 15-30 minutes at room temperature.
- Washing: Rinse 3 times with PBS to remove residual detergent.
- Validation: Test permeability with nuclear stains (e.g., DAPI) to confirm access to internal compartments.
Note: The optimal permeabilization agent and concentration requires empirical determination for specific embryo types. Over-permeabilization can damage membrane-associated antigens, while under-permeabilization limits internal access [12].
Protocol 4.2.2: Strategic Fluorophore Selection for Deep Imaging
- Evaluate Emission Spectra: Select fluorophores with emissions above 600 nm to minimize scatter.
- Prioritize Brightness: Choose modern synthetic dyes (Alexa Fluor, DyLight, Atto) over traditional proteins.
- Consider Conjugate Size: Directly conjugate primary antibodies with smaller fluorophores when penetration is severely limited.
- Validate Performance: Test penetration efficiency using longitudinal sections of embedded specimens.
The use of longer wavelength illumination (red and far-red) provides superior penetration through scattering specimens, though with a slight reduction in maximum theoretical resolution [11]. Additionally, clearing agents incorporated into mounting media can significantly improve both light and reagent penetration in thick embryo specimens.
Understanding and Managing Autofluorescence
Autofluorescence originates from both endogenous biological molecules and exogenous sources introduced during specimen preparation. Endogenous fluorophores include NADH, flavins, lipofuscins, collagen, and elastin, which are intrinsic to biological systems and challenging to eliminate completely [13]. In plant specimens, chlorophyll and lignin contribute substantial autofluorescence. Exogenous sources include aldehyde fixatives (particularly glutaraldehyde), culture media components like phenol red, and certain laboratory plastics [13] [12].
Identifying autofluorescence sources requires systematic investigation. Researchers should image unstained control specimens across the entire emission spectrum to create an autofluorescence profile. Spectral lambda scanning proves particularly valuable for characterizing these profiles, enabling strategic selection of fluorophores with minimal spectral overlap with autofluorescence [13]. This approach is more effective than attempting to eliminate established autofluorescence.
Protocols for Autofluorescence Reduction
Protocol 5.2.1: Chemical Treatment for Autofluorescence Reduction
- Prepare Reducing Solution: 10 mM sodium borohydride (NaBH4) in PBS or 10 mM ammonium ethanol [13].
- Post-fixation Treatment: Incubate fixed specimens for 10-30 minutes with reducing solution.
- Washing: Rinse thoroughly with PBS (3 times for 5 minutes each).
- Alternative Chemical Treatment: 0.1-1.0% Sudan black B in 70% ethanol for 10-30 minutes.
- Final Rinsing: Remove all chemical treatments before antibody labeling.
Application Notes: Chemical treatments work primarily on aldehyde-induced autofluorescence. Sodium borohydride can damage delicate structures, requiring concentration and duration optimization [12].
Protocol 5.2.2: Photobleaching for Background Reduction
- Pre-staining Preparation: Mount specimens in PBS without antifade reagents.
- Broad-spectrum Illumination: Expose to high-intensity LED or mercury arc lamp light.
- Duration Optimization: Treat for 15-60 minutes, monitoring autofluorescence reduction.
- Post-bleaching Processing: Proceed with standard immunofluorescence staining.
Application Notes: Photobleaching works best for fluorophores with rapid photobleaching kinetics compared to modern synthetic dyes used for immunolabeling. This method preserves antigenicity better than harsh chemical treatments [13].
Integrated Workflow for Embryo Mounting and Imaging
The following diagram illustrates the complete workflow for mounting embryos for confocal microscopy after immunofluorescence, integrating solutions to size, penetration, and autofluorescence challenges:
The Scientist's Toolkit: Essential Research Reagents
Table 4: Key Research Reagent Solutions for Embryo Confocal Microscopy
| Reagent Category | Specific Examples | Function in Protocol |
|---|---|---|
| Fixatives | 4% Formaldehyde, Methanol/Acetone (-20°C) | Preserve cellular structure while maintaining antigenicity [12] |
| Permeabilization Agents | Triton X-100, Saponin, Tween-20 | Enable antibody penetration through membranes |
| Blocking Reagents | Normal Serum, BSA | Reduce nonspecific antibody binding |
| Fluorophores | Alexa Fluor series, Cy dyes | Provide specific signal detection with high brightness |
| Mounting Media | ProLong Gold, Fluoromount-G | Preserve specimens and optimize refractive index |
| Autofluorescence Reducers | Sodium borohydride, Sudan black B | Chemical reduction of background fluorescence |
| Cleaning Agents | Poly-lysine, Collagen | Enhance cell adhesion to coverslips |
| Antifade Reagents | Commercial scavengers | Reduce photobleaching during imaging |
Advanced Techniques and Future Directions
Optical Sectioning Alternatives
While laser scanning confocal microscopy (LSCM) represents the most common implementation, several alternative technologies offer advantages for specific embryo imaging applications. Spinning disk confocal microscopy provides significantly faster acquisition speeds through parallel point scanning, making it valuable for live embryo imaging [1] [14]. Resonant scanning confocal systems bridge the gap between traditional LSCM and spinning disk technologies, offering improved speed while maintaining the optical sectioning capabilities of point-scanning systems [14].
For embryos requiring exceptionally deep imaging, multiphoton microscopy provides superior penetration by using longer wavelength excitation that scatters less in tissue [11]. This technique also minimizes photodamage in regions outside the focal plane, making it particularly suitable for live embryo imaging. The emerging technology of light-sheet fluorescence microscopy represents another promising approach for large embryo imaging, providing rapid optical sectioning with minimal phototoxicity.
Computational Approaches for Challenge Mitigation
Advanced computational methods complement optical improvements in addressing specimen challenges. Deconvolution algorithms can enhance effective resolution by mathematically reassigning out-of-focus light, though they work best with thinner specimens [14]. Spectral unmixing techniques allow separation of overlapping fluorophores and identification of autofluorescence signatures based on their characteristic emission spectra [13].
For penetration limitations, computational fusion of multiple partial penetrations can reconstruct complete specimens when neither antibodies nor light fully penetrate the entire embryo. These computational approaches increasingly integrate with machine learning methods to distinguish specific signal from noise and autofluorescence, potentially overcoming fundamental physical limitations in embryo imaging.
Successfully mounting embryos for confocal microscopy after immunofluorescence requires integrated consideration of size, penetration, and autofluorescence challenges. The protocols and solutions presented here provide a systematic approach to optimizing specimen preparation and imaging parameters. By applying these methods strategically—selecting appropriate objective lenses based on working distance requirements, implementing permeabilization strategies that balance structure preservation with reagent access, and employing autofluorescence reduction techniques matched to specific noise sources—researchers can significantly improve image quality and data reliability from confocal imaging of embryo specimens.
Advanced fluorescence imaging is indispensable for modern biological research, particularly in developmental biology studies involving embryos. The choice between conventional fluorescence microscopy and confocal microscopy profoundly impacts the quality and interpretability of acquired data. For researchers mounting embryos after immunofluorescence, this decision hinges on a clear understanding of each technique's capabilities, limitations, and specific protocol requirements. This application note provides a detailed comparison to guide scientists in selecting the optimal imaging path for their experimental needs, with a specific focus on embryo imaging protocols.
Technical Comparison: Confocal vs. Conventional Fluorescence Microscopy
The fundamental difference between these techniques lies in their approach to out-of-focus light. Conventional (widefield) fluorescence microscopy illuminates the entire sample volume simultaneously, capturing emitted light from both in-focus and out-of-focus planes. Confocal microscopy employs spatial filtering with a pinhole aperture to eliminate out-of-focus light, capturing crisp optical sections from a specific focal plane [15] [16].
Table 1: Core Technical Characteristics and Capabilities
| Characteristic | Conventional Fluorescence Microscopy | Confocal Microscopy |
|---|---|---|
| Optical Sectioning | Limited or none; out-of-focus light causes blurring [15] [14] | Excellent; pinhole blocks out-of-focus light for sharp optical slices [15] [16] |
| Resolution | Moderate; degraded by out-of-focus flare in thick samples [16] | High; superior resolution and contrast, especially in thicker specimens [15] |
| Suitable Sample Thickness | Thin samples (e.g., < 20 µm monolayer cell cultures) [15] [14] | Thick samples (e.g., 30 µm to several hundred µm; whole embryos, tissues) [15] [17] |
| 3D Reconstruction | Difficult due to lack of clean optical sections [15] | Excellent; sequential Z-stacks can be reconstructed into 3D models [15] [18] |
| Primary Applications | Routine imaging of thin samples, rapid live-cell imaging, preliminary screening [15] [18] | High-resolution imaging of thick samples, 3D structural analysis, co-localization studies [15] [17] |
| Relative Cost | Lower ($10,000 - $50,000) [15] | Higher ($100,000 - $500,000+) [15] |
Optimized Protocols for Embryo Mounting and Imaging
The following protocols are optimized for preserving fluorescence signal and achieving high-quality imaging of embryos, integrating strategies from recent literature.
Protocol 1: Whole-Mount Embryo Processing for Confocal Microscopy
This protocol is designed for optimal fluorescence preservation and depth penetration in embryo imaging [17] [19].
Key Reagent Solutions:
- Fixative: 4% Formaldehyde (PFA) in 0.1 M phosphate buffer, pH 7.4. This cross-linking fixative preserves structure while maintaining fluorescence better than alternatives like glutaraldehyde [20].
- Permeabilization Solution: PBS with 0.1% Triton X-100. Triton X-100 is a non-ionic detergent that permeabilizes cell membranes for antibody entry [21] [19].
- Blocking Solution: PBS with 0.1% Tween 20 and 2-5% serum (species-matched to secondary antibody). Reduces non-specific antibody binding.
- Signal Preservation: 1X TrueBlack or similar solution can be used to quench autofluorescence, a common issue in fixed tissues [17].
- Mounting Medium: Use an anti-fade mounting medium to retard photobleaching. For 3D imaging, mount in a medium that maintains sample geometry.
Procedure:
- Fixation: Immerse embryos in 4% PFA for 2-4 hours at 4°C. Longer fixation may quench fluorescence.
- Permeabilization: Wash embryos in PBS, then incubate in permeabilization solution for 1-2 hours at room temperature.
- Blocking: Incubate embryos in blocking solution for 4-6 hours at 4°C to minimize non-specific binding.
- Immunostaining: Incubate with primary antibody (diluted in blocking solution) for 24-48 hours at 4°C. After washing, incubate with fluorophore-conjugated secondary antibody for 24 hours at 4°C. Protect from light.
- Post-staining Treatment: Treat with TrueBlack solution if needed, following manufacturer's instructions [17].
- Mounting: For conventional slides, embed in an anti-fade medium under a coverslip sealed with nail polish. For advanced 3D imaging or light-sheet microscopy, embed embryos in 1% low-melting-point agarose in a suitable imaging chamber [22].
Protocol 2: Enhancing Dynamic Range for Quantitative Imaging
For accurate quantification of fluorescence intensity, such as evaluating biomarker expression levels, the limited dynamic range of microscope detectors can be a constraint. This can be overcome with a High Dynamic Range (HDR) algorithm [17].
Workflow:
- Image Acquisition: Capture the same field of view at multiple exposure times (e.g., 6.5 ms, 25 ms, and 55 ms) without changing laser power or gain [17].
- HDR Processing: Use a specialized HDR algorithm to merge the multi-exposure image set. The algorithm reconstructs a response curve and generates a single image with a more accurate representation of fluorescence expression levels [17].
- Image Analysis: Proceed with quantitative analysis on the HDR-processed image, which provides improved diagnostic accuracy and more reliable intensity measurements [17].
The workflow for the complete embryo processing and imaging pipeline is summarized below.
Workflow for Embryo Processing and Imaging Path Selection
Advanced Applications and Emerging Techniques
3D Pathology and Spatial Biology
The combination of immunofluorescence, tissue optical clearing, and confocal microscopy enables 3D pathology assessment. This approach can reveal heterogeneous biomarker distribution (e.g., PD-L1 in tumor tissues) at various depths within a sample, a feat not achievable with traditional 2D histology [17]. This provides a more precise evaluation for immunotherapy prediction.
Integrated Light and Electron Microscopy (CLEM)
For ultrastructural context, fluorescence can be preserved in resin-embedded samples (in-resin fluorescence) for correlative light and electron microscopy (CLEM). This involves high-pressure freezing, freeze-substitution, and embedding in acrylic resins like Lowicryl or LR White, allowing imaging of the same thin section with both fluorescence and electron microscopy [20].
Tissue Expansion Microscopy
Tissue expansion microscopy (TissUExM) is a powerful super-resolution technique that physically enlarges biological samples. Embryos are embedded in a swellable polymer gel, leading to a 4-fold physical expansion. This allows for enhanced resolution of subcellular structures, such as centrioles and cilia, using a standard confocal microscope [21].
The choice between conventional and confocal fluorescence microscopy is dictated by experimental objectives and sample characteristics. For rapid 2D imaging of thin embryo sections, widefield microscopy offers a cost-effective and efficient solution. However, for high-resolution 3D reconstruction of thick specimens, accurate spatial co-localization studies, and quantitative analysis of biomarker distribution throughout an embryo, confocal microscopy is the unequivocal superior choice. By adhering to optimized protocols for sample preparation, mounting, and advanced imaging techniques, researchers can maximize the information yield from precious embryo samples.
Step-by-Step Protocols for Whole-Mount Staining and Mounting
Optimized Fixation and Permeabilization for Different Embryo Types
The success of confocal microscopy following immunofluorescence in embryonic research hinges overwhelmingly on the initial steps of fixation and permeabilization. These processes preserve tissue architecture and provide antibody access to intracellular targets, yet they present a unique challenge when working with whole-mount embryos due to the variable tissue density, yolk content, and extracellular barriers across different model organisms. The choice of fixative and permeabilization method must be carefully tailored to both the embryo type and the subcellular localization of the target protein to ensure optimal signal detection while preserving morphology. This application note provides a standardized yet flexible framework for optimizing these critical steps across zebrafish, chick, and mouse embryos, enabling researchers to generate high-quality, reproducible data for their confocal imaging workflows.
Fixation Agent Selection and Optimization
Fixation is the foundation of successful immunofluorescence. The ideal fixative preserves the native cellular architecture and antigenicity of the target protein while enabling sufficient antibody penetration throughout the whole-mount specimen. The two most common fixatives—paraformaldehyde (PFA) and trichloroacetic acid (TCA)—operate through distinct mechanisms and are suited to different applications.
Fixative Mechanisms and Applications
Paraformaldehyde (PFA) is an aldehyde fixative that creates covalent cross-links between protein molecules, primarily between lysine residues. This cross-linking action stabilizes protein structures and provides excellent preservation of cellular ultrastructure, making it the most widely used general-purpose fixative for embryonic studies [23]. It is particularly effective for preserving membrane structures and the spatial organization within the cytoplasm.
Trichloroacetic Acid (TCA) functions as a precipitating fixative by denaturing proteins through acid-induced coagulation. This non-cross-linking mechanism can sometimes expose epitopes that are masked by PFA cross-linking, making it valuable for certain antibody targets [23]. However, its denaturing nature can alter subcellular morphology more significantly than PFA.
Comparative Analysis of Fixative Performance
The table below summarizes key findings from a systematic comparison of PFA and TCA fixation in chicken embryos, highlighting their differential effects on various protein types and cellular structures [23].
Table 1: Comparative Analysis of PFA vs. TCA Fixation for Different Protein Localizations
| Parameter | PFA Fixation (4%) | TCA Fixation (2%) |
|---|---|---|
| Mechanism of Action | Protein cross-linking | Protein precipitation/denaturation |
| Nuclear Morphology | Preserves native nuclear size and shape | Results in larger, more circular nuclei |
| Transcription Factors | Optimal: Strong signal for nuclear targets (e.g., SOX9, PAX7) | Suboptimal: Reduced signal intensity |
| Cytoskeletal Proteins | Adequate signal (e.g., Tubulin) | Enhanced: Improved visualization of microtubule structures |
| Membrane Proteins | Adequate signal (e.g., Cadherins) | Optimal: Superior for certain membrane epitopes |
| Typical Fixation Time | 20 minutes - 2 hours | 1 - 3 hours |
Organism-Specific Protocols
Zebrafish Embryos
Zebrafish embryos present unique challenges due to their chorion membrane and large, light-obscuring yolk. The following protocol includes an optimized deyolking procedure for imaging deep tissues [24].
Table 2: Key Reagents for Zebrafish Embryo Processing
| Reagent | Function | Application Note |
|---|---|---|
| Pronase | Enzymatic dechorionation | 1-2 mg/mL for 5-10 min at RT; gentler than manual removal [25]. |
| 1% PFA (Light Fixation) | Initial tissue stabilization | 2 hrs at RT or overnight at 4°C; prevents yolk over-fixation [24]. |
| 4% PFA (Final Fixation) | Complete structural preservation | After deyolking; ensures optimal tissue architecture for imaging [24]. |
| Phosphate Buffered Saline (PBS) | Washing and dilution | Base solution for fixatives and washes; maintains physiological pH. |
| Triton X-100 | Permeabilization agent | 0.1-0.5% in PBS (PBST); concentration depends on embryo age [23]. |
Step-by-Step Protocol:
Dechorionation: Transfer embryos to a pronase solution (1-2 mg/mL in embryo medium) for 5-10 minutes at room temperature until the chorions soften. Thoroughly rinse with embryo medium to remove enzyme residue [25]. Alternatively, manually remove the chorion using two pairs of fine forceps under a dissecting microscope. [24]
Light Fixation: Fix dechorionated embryos in 1% PFA for 2 hours at room temperature or overnight at 4°C. This mild fixation is critical—over-fixation with 4% PFA causes the yolk to become dark and tightly adhered to tissues, making subsequent removal impossible [24].
Deyolking: Under a dissecting microscope, gently transfer the lightly fixed embryos to a dish of PBS. Using fine forceps or a hair tool, carefully tease the embryo away from the yolk sac. The properly fixed yolk will have a golden-grey color and separate cleanly [24].
Refixation: Transfer the deyolked embryos to 4% PFA for a final, stronger fixation, typically for 2-4 hours at room temperature. This step ensures structural integrity for imaging [24].
Permeabilization and Staining: Wash embryos 3x in PBS, then permeabilize in PBST (0.1-0.5% Triton X-100 in PBS) for 30-60 minutes. The embryo is now ready for standard immunofluorescence staining protocols [25] [23].
Chick Embryos
Chick embryos are a classic model for studying vertebrate development. The choice between PFA and TCA fixation should be guided by the target protein.
Standard PFA Fixation Protocol:
- Dissect embryos in Ringer's solution onto filter paper.
- Fix in 4% PFA in 0.2M phosphate buffer for 20 minutes at room temperature.
- Wash 3x with TBST + Ca²⁺ or PBST to remove all fixative before staining [23].
TCA Fixation Protocol (for membrane/cytoskeletal targets):
- Prepare a 2% TCA solution in PBS from a 20% stock.
- Fix embryos for 1-3 hours at room temperature.
- Wash thoroughly with TBST + Ca²⁺ or PBST before proceeding to immunostaining [23].
Mouse Embryos
Mouse embryos require careful handling and longer incubation times due to their larger size and internal development.
Protocol:
- Dissect embryos in PBS, carefully removing decidua, yolk sac, and amnion [26].
- Fix in 4% PFA for 30 minutes at room temperature or overnight at 4°C. The duration depends on embryo size; E12.5 and younger typically require 2 hours, while E15.5 embryos may need overnight fixation [26] [25].
- Wash 3x in PBS.
- Permeabilize by incubating in PBST (0.1-0.5% Triton X-100) for several hours or overnight at 4°C. For enhanced penetration, the tissue can be gently agitated during this step [25].
Workflow Visualization and Experimental Design
The following diagram synthesizes the key decision points and procedures for optimizing fixation and permeabilization covered in this guide.
The Scientist's Toolkit: Essential Research Reagents
Table 3: Core Reagent Solutions for Embryo Fixation and Permeabilization
| Reagent Category | Specific Example | Primary Function |
|---|---|---|
| Fixatives | 4% Paraformaldehyde (PFA) | Cross-linking fixative for general use and nuclear antigen preservation [25] [23]. |
| 2% Trichloroacetic Acid (TCA) | Precipitating fixative for membrane and cytoskeletal targets [23]. | |
| Permeabilization Agents | Triton X-100 | Non-ionic detergent for dissolving membranes; use at 0.1-0.5% in PBS (PBST) [23]. |
| Buffers | Phosphate Buffered Saline (PBS) | Isotonic washing and dilution buffer [24] [23]. |
| Tris-Buffered Saline (TBS) | Alternative buffer, sometimes preferred for specific antibody applications [23]. | |
| Blocking Agents | Donkey Serum (10%) | Standard blocking agent to prevent non-specific antibody binding [23]. |
| Enzymatic Aids | Pronase | Enzyme for gentle dechorionation of zebrafish embryos [25]. |
| Acidic Tyrode's Solution | Chemical method for removing the Zona Pellucida from mouse blastocysts [27]. |
Optimizing fixation and permeabilization is not a one-size-fits-all process but a strategic decision that must account for the embryo type, target protein localization, and desired morphological preservation. As demonstrated, PFA remains the gold standard for most applications, particularly for nuclear proteins, while TCA offers a powerful alternative for recalcitrant membrane and cytoskeletal targets. The organism-specific protocols outlined here—incorporating critical steps such as the deyolking of zebrafish embryos—provide a robust starting point for researchers aiming to achieve high-quality, publication-ready confocal images from their embryonic samples. By systematically applying these principles, scientists can significantly enhance the reliability and clarity of their immunofluorescence data within the broader context of developmental biology research.
In the context of mounting embryos for confocal microscopy after immunofluorescence, achieving effective antibody penetration throughout thick, intact samples is a fundamental challenge. Whole-mount immunohistochemistry preserves the three-dimensional architecture of embryonic tissues, providing a holistic view of protein localization and expression patterns that is crucial for developmental biology, neurobiology, and drug development research [25]. However, the thickness of these samples presents a significant barrier, as reagents must permeate deeply to reach internal structures without compromising tissue integrity or antigenicity. This application note details optimized strategies and protocols to overcome these hurdles, ensuring robust and reproducible staining for high-resolution confocal microscopy.
The primary obstacles in whole-mount staining include limited diffusion of antibodies into the core of the tissue, non-specific binding that leads to high background, and epitope masking caused by fixation [25]. The strategies outlined herein are designed to address these issues systematically through careful selection of fixatives, extensive permeabilization, optimized blocking, and prolonged, staged incubation protocols. The following workflow summarizes the core strategic pathway to achieving deep antibody penetration.
The Scientist's Toolkit: Essential Reagents and Materials
Successful whole-mount staining relies on a carefully selected set of reagents and tools. The table below catalogues the essential components for the procedures outlined in this document.
Table 1: Key Research Reagent Solutions for Whole-Mount Staining
| Item | Function/Application | Examples & Notes |
|---|---|---|
| Fixatives | Preserves tissue architecture and antigenicity. | 4% Paraformaldehyde (PFA): Most common; can cause epitope masking [25]. Methanol: Alternative fixative if PFA is unsuitable [25]. |
| Permeabilization Agents | Disrupts membranes to allow antibody entry. | Triton X-100 (0.1-0.5%) [28], Tween-20, Saponin, Digitonin. Concentration and time require optimization [25]. |
| Blocking Buffers | Reduces non-specific antibody binding to minimize background. | Serum (Goat, Donkey): 2-10% in PBT [29]. BSA (1-4%) in PBS [28]. Heat-inactivated serum is recommended [29]. |
| Antibody Diluents | Medium for diluting primary and secondary antibodies. | PBS or TBS containing 0.1% Triton X-100 and 1-5% BSA or blocking serum. |
| Wash Buffers | Removes unbound reagents between steps. | PBT: Phosphate-Buffered Saline (PBS) with 0.1-0.2% Triton X-100 [29]. |
| Nuclear Counterstains | Labels cell nuclei for spatial orientation. | DAPI, To-Pro-3 (1:3,000 dilution) [29], SYTO-16 [17], Propidium Iodide (PI) [30]. |
| Mounting Media | Preserves samples for microscopy. | Prolong Gold (anti-fade) [29] [28], Glycerol-based media [25]. |
Optimized Experimental Protocol for Embryonic Tissues
This protocol is adapted for mouse embryonic tissues (e.g., E13.5-E17.5 limb skin and heart) but can be modified for other model organisms [29].
Stage 1: Tissue Preparation and Fixation
- Collecting Specimen: Dissect embryos and harvest the desired tissues (e.g., forelimbs, heart) in ice-cold Hanks' Balanced Salt Solution (HBSS) [29].
- Fixation: Transfer tissues to freshly prepared 4% Paraformaldehyde (PFA) in PBS. Fix with gentle mixing on a nutator or rocker at 4°C overnight. Critical Consideration: For some antigens, PFA-induced cross-linking can mask epitopes; in such cases, test cold methanol fixation as an alternative [25].
- Dehydration and Storage: Remove PFA and wash tissues 3 times for 5 minutes in PBS. Transfer tissues to 100% Methanol and store at -20°C. This step enhances permeabilization and permits long-term storage [29].
Stage 2: Permeabilization and Blocking
- Rehydration: Rehydrate the tissues in a graded series of Methanol/PBT (75%, 50%, 25%) for 5 minutes each. Wash twice for 5 minutes in PBT (PBS + 0.2% Triton X-100) at room temperature with gentle agitation [29].
- Permeabilization Enhancement: Incubate tissues in PBT for 1-2 hours. For particularly dense tissues, consider testing alternative permeabilization agents like Saponin or Digitonin.
- Blocking: Incubate tissues in an appropriate blocking buffer for 2 hours at room temperature with gentle agitation. For goat secondary antibodies, use 10% Heat-Inactivated Goat Serum (HIGS) in PBT. For donkey secondary antibodies, use 10% Donkey Serum in PBT [29].
Stage 3: Antibody Incubation and Washes
This stage is critical for achieving deep and specific staining. The strategy involves extended incubation times and the use of detergents throughout the process to facilitate diffusion.
- Primary Antibody Incubation:
- Prepare the primary antibody in the appropriate washing buffer (e.g., 2% HIGS/PBT for goat secondaries) [29].
- Incubate tissues with the primary antibody for 48-72 hours at 4°C with gentle agitation. For very thick samples, a staged incubation—starting at 4°C and moving to room temperature—can be beneficial.
- Washing Post-Primary Antibody:
- Remove the primary antibody solution.
- Wash the tissues extensively with washing buffer (e.g., 2% serum/PBT) 6-8 times over 24 hours at 4°C with agitation to ensure complete removal of unbound antibody [29].
- Secondary Antibody Incubation:
- Prepare fluorophore-conjugated secondary antibodies in the appropriate washing buffer. Include 0.1% Tween-20 or Triton X-100 to maintain permeabilization.
- Incubate tissues with the secondary antibody for 24-48 hours at 4°C in the dark with gentle agitation.
- Washing and Nuclear Staining:
- Remove the secondary antibody and perform another series of extensive washes with PBT 6-8 times over 24 hours in the dark.
- (Optional) Incubate with a nuclear counterstain like To-Pro-3 (1:3,000 dilution) for 1 hour at room temperature [29].
- Perform a final wash in PBS before mounting.
The following diagram illustrates the two main antibody detection methods used in whole-mount studies, highlighting the signal amplification achieved by the Tyramide Signal Amplification (TSA) system.
Stage 4: Mounting and Imaging for Confocal Microscopy
- Mounting: For confocal microscopy, mount tissues in an anti-fade mounting medium like Prolong Gold. Use secure-seal spacers to prevent crushing the sample and to define a consistent imaging volume [29]. Embryos can also be temporarily mounted in glycerol for initial inspection [25].
- Imaging: Acquire images using a laser scanning confocal microscope. For large samples, tile scanning and z-stack acquisition are necessary to reconstruct the 3D structure. Set laser power and detector gain using control samples to avoid signal saturation and minimize photobleaching.
Advanced Strategy: High Dynamic Range (HDR) Imaging
A recent advancement in immunofluorescence involves using a High Dynamic Range (HDR) algorithm to overcome the limited dynamic range of fluorescence microscope detection systems. This method involves capturing the same field of view at multiple exposure times and computationally merging them into a single image with restored expression patterns [17]. This technique has been shown to improve diagnostic accuracy and is particularly valuable for quantifying heterogeneous biomarker expression, such as PD-L1, in 3D tissue volumes [17].
Data Presentation: Key Parameters and Reagents
Table 2: Quantitative Data for Antibody Incubation and Imaging
| Parameter | Typical Range / Example | Protocol Specification / Rationale |
|---|---|---|
| Primary Antibody Incubation | 48 - 72 hours [29] | Ensures sufficient time for diffusion into deep tissue layers. |
| Secondary Antibody Incubation | 24 - 48 hours [29] | Allows thorough binding for a strong, specific signal. |
| Wash Duration & Frequency | 6-8 washes over 24 hours [29] | Critical for reducing background by removing unbound antibodies. |
| Triton X-100 Concentration | 0.1% - 0.5% | Balances effective permeabilization with tissue integrity. |
| Serum Concentration (Blocking) | 2% - 10% | Effectively blocks non-specific sites to minimize background. |
| HDR Exposure Times (Example) | 6.5 ms, 25 ms, 55 ms [17] | Multiple exposures are merged to create a final image with optimal detail in both dim and bright regions. |
| Mouse Embryo Age Limit | Up to 12 days [25] | Older, larger embryos require dissection for effective reagent penetration. |
Nuclear Counterstaining with DAPI or Hoechst for Structural Context
In confocal microscopy of mounted embryos following immunofluorescence, nuclear counterstains provide the essential architectural context for interpreting protein localization and cellular organization. By delineating every nucleus, these stains create a spatial map within the tissue, allowing researchers to precisely locate targets of interest and analyze cellular relationships and morphology. This application note details the use of the two most common fluorescent nuclear counterstains, DAPI and Hoechst, within the specific context of whole-mount embryo preparation, providing detailed protocols and a comparative guide to inform reagent selection.
DAPI vs. Hoechst: A Comparative Guide
The choice between DAPI and Hoechst is critical and depends on experimental parameters, particularly whether the sample is live or fixed. The following table summarizes the key characteristics of these dyes to guide appropriate selection [31] [32].
Table 1: Comparison of DAPI and Hoechst Stains for Nuclear Counterstaining
| Characteristic | DAPI | Hoechst 33342 | Hoechst 33258 |
|---|---|---|---|
| Excitation/Emission (nm) | ~358 / ~461 [31] | ~350 / ~461 [31] | ~352 / ~461 [31] |
| Binding Specificity | AT-rich DNA regions, minor groove [32] | AT-rich DNA regions, minor groove [32] | AT-rich DNA regions, minor groove [32] |
| Cell Permeability | Moderate; lower than Hoechst [32] | High [32] | High, but slightly less than Hoechst 33342 [31] |
| Live-Cell Compatibility | Poor; more toxic, requires higher concentration (≈10 µg/mL) [31] | Good; lower toxicity, standard for live imaging (≈1 µg/mL) [31] [32] | Suitable; but less cell-permeant than 33342 [31] |
| Fixed-Cell Preference | Preferred; stable in mounting medium [31] | Suitable [31] | Suitable [31] |
| Recommended Staining Concentration | Fixed cells: 1 µg/mL [31] | 1 µg/mL (live and fixed) [31] | 1 µg/mL (live and fixed) [31] |
| Primary Application Context | Fixed tissue and cells [31] | Live-cell imaging, cell cycle analysis [31] [32] | Live or fixed cells [31] |
Experimental Protocols
Whole-Mount Immunofluorescence and Staining Protocol
The following protocol integrates nuclear counterstaining into a comprehensive whole-mount immunofluorescence procedure for embryo specimens, adapted for confocal microscopy analysis [33].
- Fixation: Place the embryo in 4% paraformaldehyde in PBS. Fix at 4°C for a duration that requires optimization; begin with 2 hours to overnight [33].
- Permeabilization & Washing: Wash the embryo three times in PBS containing 0.5-1% Triton X-100, for 30 minutes each time, to permeabilize membranes [33].
- Blocking: Incubate embryos twice for 1 hour in blocking buffer (PBS, 1% Triton X-100, 10% Fetal Calf Serum, 0.2% sodium azide) at room temperature to reduce non-specific antibody binding [33].
- Primary Antibody Incubation:
- Transfer embryos to a tube containing the primary antibody diluted in blocking buffer with 0.02% sodium azide.
- Incubate on a gentle rotation device for 1 to 4 days at 4°C [33].
- Washing: Perform extensive washing to remove unbound antibody:
- Wash 3 times for 1 hour in PBS, 1% Triton X-100, 10% FCS.
- Wash 3 times for 10 minutes in PBS, 1% Triton X-100.
- Repeat the cycle of 3x1 hour washes and 3x10 minute washes with the same buffers [33].
- Secondary Antibody Incubation:
- Add the fluorescently-labeled secondary antibody diluted in blocking buffer.
- Incubate with gentle rotation for 2 to 4 days at 4°C, protected from light [33].
- Final Washing: Wash embryos 3 times for 10 minutes in PBS with 1% Triton X-100 [33].
- Nuclear Counterstaining (DAPI or Hoechst):
- Mounting for Confocal Microscopy:
- Equilibrate the stained embryo in a series of glycerol solutions (e.g., 50%, 75%) until the sample sinks, which indicates proper perfusion.
- Mount the whole embryo in 75% glycerol on a slide, using grease to seal the coverslip edges. The specimen is now ready for imaging [33].
Workflow Diagram
The following diagram illustrates the key steps of the integrated protocol, highlighting stages where critical choices between DAPI and Hoechst are made.
The Scientist's Toolkit: Essential Research Reagents
Successful staining and mounting of embryos requires a suite of specific reagents, each with a critical function. The following table lists these key materials [31] [33].
Table 2: Essential Reagents for Whole-Mount Immunofluorescence and Nuclear Staining
| Reagent / Solution | Function / Purpose |
|---|---|
| Paraformaldehyde (4% in PBS) | Fixative that cross-links proteins to preserve tissue and cellular morphology [33]. |
| Triton X-100 (0.5-1% in PBS) | Detergent that permeabilizes cell and nuclear membranes, allowing antibodies and dyes to access their intracellular targets [33]. |
| Blocking Buffer (e.g., with FCS/BSA) | Reduces non-specific binding of antibodies to the tissue, thereby lowering background fluorescence [33]. |
| DAPI Stock Solution (e.g., 10 mg/mL) | Blue-fluorescent nuclear counterstain for fixed cells; stable in mounting media [31]. |
| Hoechst 33342 or 33258 Stock Solution | Blue-fluorescent nuclear counterstains with high cell permeability, making them suitable for live-cell imaging [31]. |
| Antifade Mounting Medium (e.g., EverBrite) | Preserves fluorescence during microscopy by reducing photobleaching; some formulations can include DAPI for convenience [31]. |
| Glycerol (e.g., 50%, 75%) | A mounting medium that also acts as a clearing agent, improving light penetration for high-quality confocal imaging of whole mounts [33]. |
Critical Technical Considerations
- Stain Selection: The core choice hinges on sample viability. For fixed embryo preparations, DAPI is the recommended and robust choice due to its stability in mounting medium and lower cost [31]. For experiments requiring viability, such as live imaging of embryonic development, Hoechst 33342 is the superior stain due to its lower toxicity and better permeability [31] [32].
- Photoconversion Artifact: A significant technical pitfall with both DAPI and Hoechst is photoconversion, where UV exposure can cause the dyes to fluoresce in channels typically used for green fluorophores (e.g., FITC). To mitigate this, image the green channel before switching to the DAPI/UV channel, or use mounting media specifically designed to reduce this effect [31].
- Stain Penetration in Whole Mounts: The dense nature of whole-mount embryo specimens can impede stain penetration. Sufficient incubation time in the stain is critical. Furthermore, the use of glycerol as a clearing agent after staining is essential to reduce light scattering and ensure high-quality z-stack acquisition during confocal microscopy [33].
Creating Custom Agarose Wells with 3D-Printed Molds for Reproducible Orientation
Within the context of mounting embryos for confocal microscopy after immunofluorescence research, a significant challenge is the inconsistent and non-reproducible orientation of specimens. This inconsistency can severely impact image quantification, comparative analysis, and the reliability of high-content screening data. Traditional mounting methods often fail to provide the necessary standardization for precise three-dimensional imaging. This application note details a protocol utilizing custom 3D-printed molds to fabricate agarose wells that enable the reproducible orientation of embryos, specifically tailored for confocal microscopy applications. This method significantly improves data quality and workflow efficiency for researchers and drug development professionals.
The Scientist's Toolkit: Research Reagent Solutions
The following table catalogues the essential materials required for fabricating custom agarose wells using 3D-printed molds.
Table 1: Essential materials and reagents for protocol implementation.
| Item | Function/Description | Example Source/Note |
|---|---|---|
| 3D Printer | Fabricates the primary master mold with high resolution and smooth surface finish. | High-resolution printer (e.g., Form 2 SLA printer) using a biocompatible resin is recommended [34] [35]. |
| 3D Printing Resin | Material for the master mold; requires stability at curing temperatures and a glossy finish. | Clear v4 resin (Formlabs) or similar; must be thoroughly washed and post-cured to prevent cytotoxicity [34] [35]. |
| Silicone Elastomer | Used to create a reusable negative mold from the 3D-printed master, facilitating easy demolding. | Polydimethylsiloxane (PDMS) (e.g., Ecoflex 00-45) [34]. |
| Agarose | The hydrogel used to cast the final cell/embryo-compatible wells; it is non-adhesive and biocompatible. | Low-melting-point agarose (LMPA) is often used for live specimens [10] [35]. |
| Cell Culture Medium | The solution in which agarose is dissolved and used to equilibrate the wells prior to cell seeding. | e.g., Dulbecco's Modified Eagle Medium (DMEM) [36] [37]. |
| Phosphate Buffered Saline (PBS) | A balanced salt solution used for preparing agarose solutions and washing steps. | Used without calcium or magnesium (DPBS-/-) for hydrogel preparation [34]. |
| Detergent & Distilled Water | For thorough washing of 3D-printed and PDMS molds to remove residues that could affect cell health. | Critical step to ensure biocompatibility and successful self-assembly or embryo development [36] [37]. |
The following diagram illustrates the complete experimental workflow for creating and using custom agarose wells, from digital design to final imaging.
Diagram 1: Experimental workflow for creating custom agarose wells.
Detailed Experimental Protocols
CAD-Based Mold Design and 3D Printing
The process begins with the digital design of the mold, which dictates the final geometry of the agarose wells.
- Define Experimental Requirements: Determine the well specifications based on the embryo or cell type. Key parameters include well diameter, depth, and the overall array layout (e.g., 44-wells for a 35 mm dish [35] or 96-well plate compatibility [38]).
- CAD Design: Using computer-aided design (CAD) software (e.g., Fusion360, OpenSCAD), create a model of the mold. The design should incorporate features such as:
- Tapered Walls: To facilitate easier removal of cast agarose [36].
- Microwell Dimensions: Optimized for the specific specimen size. For example, wells of 500 µm x 700 µm x 700 µm have been used for mouse follicle culture [34].
- Precise Spacing: Ensures embryos are mounted at equidistant positions for automated microscopy [35].
- 3D Printing: Send the CAD file to a high-resolution 3D printer. Select a printing material that is stable at least at 50 °C and produces a glossy surface finish to ensure fine feature resolution and easy release [36] [37]. Stereolithography (SLA) printers are often used for this purpose [34].
Mold Preparation and Casting of PDMS Negatives
This section describes the creation of a reusable PDMS negative mold from the 3D-printed master.
- Post-Processing: Thoroughly wash the printed mold with a brush, detergent, and distilled water to remove any residual printing material. Air-dry completely. Further post-cure according to the resin manufacturer's instructions is critical for biocompatibility [37] [34].
- Prepare PDMS Mixture: Measure out PDMS base and add the curing agent at a 1:10 (w/w) ratio. Stir vigorously until the components are thoroughly combined to ensure complete curing [36] [37].
- Assemble Mold and Pour PDMS: Fix laboratory tape around the border of the 3D-printed mold to form a wall, creating a reservoir. Pour the PDMS mixture into the mold.
- Degas and Cure: Place the filled mold into a vacuum chamber to de-gas until all bubbles are released. Cure the PDMS at 50 °C for 2–4 hours, or until solidified [36] [37].
- Final Curing and Washing: Carefully remove the PDMS negative from the master mold. Incubate the PDMS at 60 °C for an additional hour to ensure full curing. Wash thoroughly with detergent and water, then autoclave prior to use [36] [37].
Fabrication and Preparation of Agarose Wells
The PDMS negative is used to cast the final agarose wells.
- Prepare Agarose Solution: Prepare a solution of low-melting-point agarose (e.g., 1-2% w/v) in a suitable buffer such as PBS or culture medium (e.g., DMEM). Autoclave the solution to sterilize and ensure complete dissolution [36] [34].
- Cast Agarose Wells: Pipette molten agarose into the autoclaved PDMS negative. Ensure the agarose is pipetted directly into the post cavities and that any air bubbles are removed with a pipette tip. Do not overfill the mold [36] [37].
- Solidify and Remove: Allow the agarose to cool and solidify for approximately 10-20 minutes. Larger molds may require longer cooling times. Once set, carefully separate the agarose wells from the PDMS negative using blunt forceps [36] [37].
- Equilibrate: Transfer the agarose wells into a culture plate (e.g., a well of a 6-well plate). Submerge the wells in complete culture medium and equilibrate overnight in a 37 °C incubator prior to cell seeding or embryo mounting [36] [37].
Seeding and Mounting for Reproducible Orientation
The prepared agarose wells are now ready for use.
- For Cell Seeding (e.g., for tissue rings):
- Prepare a concentrated cell suspension (e.g., 10 million cells/mL for vascular smooth muscle cells) [36].
- Aspirate all medium from the agarose wells, ensuring not to puncture the bottoms.
- Pipette the desired volume of cell suspension (e.g., 50 µL) into each well.
- Carefully add fresh medium around the outside of the agarose mold without disturbing the cell suspension within the wells. Incubate overnight to allow cells to aggregate [36] [37].
- For Embryo Mounting (e.g., for confocal microscopy):
- Anesthetize and dechorionate zebrafish embryos using standard methods [10].
- Place a dechorionated embryo into each stamped well of the agarose cast using a glass pipette or a micropipette with a widened tip.
- Manually orient the embryo under a stereomicroscope to achieve the desired consistent lateral or dorsal view [35] [38].
- Once all embryos are positioned, carefully add a low-concentration agarose solution (e.g., 0.3% LMPA) to lightly cover and immobilize them [35]. Subsequently, the dish can be filled with embryo medium containing an anesthetic for long-term imaging [10].
Quantitative Data and Performance
The performance of this method can be evaluated based on key metrics of standardization and practicality. The following table summarizes quantitative data associated with this protocol.
Table 2: Performance metrics of 3D-printed mold-based agarose wells.
| Metric | Outcome/Value | Application Context |
|---|---|---|
| Throughput | Up to 44 embryos simultaneously in a single focal plane [35]. | High-content imaging of zebrafish embryos. |
| Orientation Precision | Standardized and reproducible positions of organs (e.g., pLLP, eye) with minimal XYZ offset [35]. | Semi-automated confocal imaging of zebrafish. |
| Agarose Concentration (Mounting) | Layer 1: ~0.03% LMPA; Layer 2: 1% LMPA [10]. | Layered mounting for extended time-lapse of zebrafish. |
| Agarose Concentration (Well Fabrication) | 1.5% - 2.0% in PBS or culture medium [36] [34]. | Creating rigid, non-adhesive wells for cell seeding. |
| Post Diameter (Customization) | 2 mm, 4 mm, and 12 mm demonstrated [37]. | Fabrication of self-assembled tissue rings of various dimensions. |
| Culture Duration | Up to 55 hours of continuous time-lapse imaging [10]. | Monitoring whole-embryo zebrafish development. |
Within the context of confocal microscopy for developmental biology, the selection of an appropriate mounting medium is a critical final step that directly impacts image quality, resolution, and structural preservation. For researchers mounting embryos after immunofluorescence, the choice often lies between aqueous-based buffers, which preserve surface topography for pseudo-SEM imaging, and glycerol-based media, which provide optical clearing for deeper visualization. Aqueous media maintain the sample in a hydrated state, favoring the preservation of surface structures and antigens, while glycerol-based media significantly reduce light scattering by refractive index matching, thereby enhancing fluorescence signal and enabling deeper imaging within thick specimens like embryos. This application note details the properties, applications, and protocols for these two mounting strategies, providing a clear framework for researchers to optimize their imaging outcomes.
Media Properties and Quantitative Comparison
The core difference between aqueous and glycerol-based mounting media lies in their refractive index (RI) and how this property affects light propagation through the sample. A higher RI that more closely matches that of glass (∼1.52) and biological tissues (∼1.38-1.48) minimizes light scattering, yielding brighter signals and greater imaging depth.
Table 1: Quantitative Comparison of Mounting Media Properties
| Property | Aqueous Buffers (e.g., PBS) | Glycerol-Based Media | Commercial ProLong Gold | Homemade Glycerol Media |
|---|---|---|---|---|
| Refractive Index (RI) | ~1.33 | Varies with concentration (e.g., 80% Glycerol: ~1.44) [39] | High RI | 50-90% Glycerol [40] |
| Primary Function | Hydration, buffer pH | Refractive index matching, anti-fading | Refractive index matching, anti-fading, hardening | Refractive index matching, anti-fading |
| Best For | Surface detail preservation, pseudo-SEM | Deep tissue imaging, fluorescence brightness | High-performance fluorescence, convenience | Cost-effective, high-quality fluorescence |
| Impact on Signal Intensity | Baseline | 3-fold reduction in intensity decay at 100µm depth vs. PBS [39] | Good performance | High concentration (90%) recommended for fluorescence-only [40] |
| Impact on Cell Detection | Baseline | 4x more cells detected at 200µm depth vs. PBS [39] | N/A | N/A |
| DIC Compatibility | Good | Reduced contrast at high concentrations [40] | N/A | Use 50% glycerol for DIC [40] |
Beyond RI, the chemical composition of the medium is crucial for preserving fluorescence. A well-formulated medium includes a buffer to maintain a stable pH and anti-fading agents to retard photobleaching. A homemade glycerol medium can be composed of 20mM Tris pH 8.0, 0.5% N-propyl gallate, and 50-90% glycerol [40]. The high pH is beneficial as many fluorophores are brighter at alkaline pH, and N-propyl gallate is an effective anti-fading compound [40]. Commercial options like ProLong Gold and ProLong Diamond also provide excellent results, with the latter being particularly effective for fixed fluorescent proteins [40].
Detailed Experimental Protocols
Protocol 1: Homemade Glycerol-Based Mounting Medium for Optimal Clearing
This protocol is adapted from established laboratory practices for creating a high-performance, cost-effective mounting medium [40].
Research Reagent Solutions:
- Tris Buffer (20mM, pH 8.0): Provides a stable, alkaline environment that enhances fluorescence intensity.
- N-propyl gallate (0.5%): An anti-fading agent that scavenges free radicals to reduce photobleaching during observation.
- Glycerol (50-90%): The primary clearing agent; its high refractive index reduces light scattering and improves signal and resolution.
Methodology:
- Preparation: Combine 20mM Tris-HCl (pH 8.0), 0.5% N-propyl gallate, and 50-90% glycerol in a solution. The higher the glycerol concentration, the better the fluorescence image, but the worse the DIC (Nomarski) contrast.
- Solubilization: Warm the solution to 37°C and vortex thoroughly until all components, particularly the N-propyl gallate, are fully dissolved.
- Application: Use a minimal volume of 6-8 µL of mounting media per an 18mm coverslip. The solution should slowly spread to the edges after placing the coverslip.
- Sealing: Carefully seal the coverslip edges with nail polish to prevent the medium from drying out, as this homemade medium does not harden.
- Storage: Store the prepared mounting media at 4°C and protected from light.
Protocol 2: Glycerol Clearing and Mounting for Deep Confocal Imaging
This protocol is derived from a pipeline developed for whole-mount imaging of gastruloids, which are dense, embryo-like organoids [39].
Research Reagent Solutions:
- 80% Glycerol: Identified as the mounting medium with the best clearing performance for thick samples, significantly reducing intensity decay with depth.
- Immunostained Samples: Fixed and stained samples ready for final mounting.
- Microscope Slides and Coverslips: Used with spacers to accommodate the sample thickness without compression.
Methodology:
- Sample Clearing: After immunofluorescence staining and final washes, mount the sample directly in an 80% glycerol solution.
- Mounting Chamber: Mount the sample between two glass coverslips using spacers of a defined thickness (e.g., 250-500 µm) that match the sample size to prevent compression.
- Imaging: Image the sample iteratively from two opposing sides if using a dual-view system for reconstruction. For standard confocal, proceed with imaging from one side.
- Validation: The efficacy of this protocol is quantified by a 3-fold and 8-fold reduction in intensity decay at 100 µm and 200 µm depth, respectively, compared to PBS mounting. Furthermore, cell detection rates at 200 µm depth are four times higher than in PBS [39].
Diagram 1: Media selection is based on the primary imaging goal, guiding the choice between two specialized protocols.
The Scientist's Toolkit
Table 2: Essential Research Reagent Solutions for Mounting
| Reagent/Material | Function | Application Notes |
|---|---|---|
| Glycerol | A high-refractive index (RI) agent that reduces light scattering for brighter signals and deeper image penetration. | Concentration is key; use 80-90% for fluorescence, 50% if DIC is required [39] [40]. |
| N-propyl gallate | An anti-fading agent that scavenges free radicals, reducing photobleaching of fluorophores during microscopy. | A critical, low-cost additive for homemade media; requires warming and vortexing to dissolve [40]. |
| Tris Buffer (pH 8.0) | Provides a stable alkaline environment, enhancing the brightness of many common fluorophores. | Use a stock solution at pH 8.0; no need to re-adjust pH after adding other components [40]. |
| ProLong Gold/Diamond | Commercial high-performance mounting media offering high RI, anti-fade properties, and a hard-setting formula. | A reliable, convenient option. ProLong Diamond is noted for better performance with fixed fluorescent proteins [40]. |
| Nail Polish | Creates a physical seal to prevent the non-hardening mounting medium from evaporating and drying out. | Essential for homemade aqueous or glycerol media; apply carefully to the coverslip edges [40]. |
Workflow Integration and Decision Pathway
Integrating the mounting step into the overall sample preparation workflow is essential for success. The decision between an aqueous buffer and a glycerol-based medium should be made early, as it can influence prior steps like buffer washes.
Diagram 2: The final mounting step is the culmination of a preparation workflow directed by the primary imaging goal.
The strategic selection of mounting media is paramount for successful confocal microscopy of embryos. Aqueous buffers are the preferred choice for applications where surface topography is critical and for generating pseudo-SEM images, as they preserve hydrated surface structures. In contrast, glycerol-based mounting media, with their superior refractive index matching capabilities, are unequivocally recommended for imaging deep internal structures within thick samples, significantly enhancing signal intensity and cell detection rates at depth. By following the detailed protocols and decision pathways outlined in this application note, researchers can make informed choices that align with their experimental objectives, ensuring optimal data quality and reliability in their developmental biology research.
Solving Common Problems in Embryo Mounting and Imaging
Overcoming Poor Antibection Penetration in Large or Dense Embryos
A central challenge in developmental biology research is achieving high-quality confocal imaging of whole-mount embryos after immunofluorescence. The inherent size and density of embryonic tissues create a significant barrier, limiting the penetration of antibodies and resulting in uneven labeling, high background, and ultimately, non-quantifiable or misleading data. This application note addresses this critical bottleneck by detailing validated protocols that combine advanced tissue processing techniques—specifically tissue expansion microscopy (ExM) and tissue optical clearing—to overcome these physical limitations. Framed within the context of mounting embryos for confocal microscopy, this guide provides step-by-step methodologies, key reagent solutions, and visual workflows to enable researchers to achieve uniform antibody distribution and high-resolution imaging throughout large or dense embryonic specimens.
Core Methodologies
Two primary, and potentially complementary, strategies are employed to overcome antibody penetration barriers: physically expanding the sample to create more space between antigens, and rendering the tissue transparent to facilitate light and reagent penetration.
Tissue Expansion Microscopy (TissUExM) for Embryos
Tissue Expansion Microscopy (TissUExM) is a powerful technique that physically enlarges a biological sample by 4-5 times its original size in a homogeneous manner. This process effectively increases the distance between macromolecules, easing the access for antibody probes and enabling superior resolution on a standard confocal microscope [21].
The following workflow outlines the key stages of the TissUExM protocol, adapted for large embryos:
Detailed Protocol: TissUExM forXenopusEmbryos
This protocol, based on a established method for Xenopus laevis embryos, can be adapted for other large model organisms [21].
Before You Begin:
- Institutional Permissions: Ensure all animal experimentation is approved by the relevant institutional animal care and use committee.
- Sample Size: For beginners, 6 embryos per condition is recommended. Experienced handlers can use 2 embryos per condition.
- Solution Preparation: Prepare all solutions in advance according to safety guidelines (wear PPE, work under a fume hood). The monomer solution must be prepared at least 24 hours prior to gelation [21].
Materials and Equipment:
- Chemicals: Paraformaldehyde (PFA), Formaldehyde (FA), Acrylamide (AA), N,N'-Methylbisacrylamide (bis-AA), Sodium acrylate (SA), 4-hydroxy-TEMPO, Ammonium persulfate (APS), Tetramethylethylenediamine (TEMED), Sodium dodecyl sulfate (SDS), Triton X-100, Tween 20, Phosphate-buffered saline (PBS) [21].
- Antibodies: Primary and secondary antibodies of choice (e.g., Anti-α-tubulin, Centrin).
- Equipment: Confocal microscope, gelation chamber (prepared from a tip box, tissue paper, and parafilm), 12 mm diameter coverslips, 35 mm glass-bottom dishes [21].
Step-by-Step Procedure:
- Fixation and Cross-linking:
- Fix embryos in 4% PFA in 1X PBS at room temperature for 4 hours. Critical: This stabilizes the tissue's ultrastructure.
- Quench free aldehyde groups with 100 mM ammonium chloride in PBS for 30 minutes.
- Permeabilize embryos with 0.1% Triton X-100 in PBS for 1 hour [21].
Fluorescence Labeling (Pre-Expansion - Optional):
- Incubate embryos with primary antibodies diluted in PBS containing 0.1% Tween 20 (PBT) overnight at 4°C.
- Wash 3x 30 minutes with PBT.
- Incubate with fluorescently conjugated secondary antibodies diluted in PBT overnight at 4°C.
- Perform a final round of washing (3x 30 minutes with PBT) [21].
Gel Embedding and Polymerization:
- Prepare the gelation chamber on a pre-cooled surface.
- Incubate embryos in the monomer solution (iMS) for 1 hour on ice. Composition: 21% Sodium Acrylate, 10% Acrylamide, 0.1% Bis-Acrylamide, 0.1% Triton, 1X PBS.
- Transfer individual embryos onto the chilled gelation chamber. Remove excess monomer solution.
- Prepare the gelation mix by adding 1 µl of 10% TEMED and 1 µl of 10% APS to every 90 µl of iMS. Vortex gently.
- Quickly overlay each embryo with 90 µl of the gelation mix.
- Allow polymerization to proceed for 2 hours at 37°C [21].
Protein Digestion and Denaturation:
- Carefully extract the gels containing the embryos and transfer them to a 5 cm Petri dish.
- Add 8 mL of digestion buffer (200 mM SDS, 50 mM Tris pH 9.0) supplemented with 8 µl of proteinase K. Incubate at 37°C overnight with gentle agitation. This step digests proteins and homogenizes the gel, allowing for uniform expansion. [21]
Homogeneous Expansion:
- Carefully transfer the gels to a large volume of deionized water (at least 100x the gel volume). The water should be changed 3-4 times at 30-minute intervals. The gels will expand isotropically approximately 4-fold in linear dimension [21].
Mounting and Imaging:
- Place the expanded gel in a glass-bottom dish with a thin layer of Poly-D-lysine to help the gel adhere.
- Image using a confocal microscope. Remember to adjust the scale bar for the expansion factor during image analysis [21].
Tissue Optical Clearing for Enhanced Penetration
Tissue optical clearing reduces light scattering in biological tissues by minimizing refractive index (RI) mismatches among different tissue components. This not only makes the sample transparent for deeper imaging but also often involves delipidation and dehydration steps that can enhance antibody penetration [41].
The underlying principle and strategy for selecting a clearing method can be visualized as follows:
Comparison of Tissue Clearing Methods
The choice of clearing method depends on the need for fluorescence preservation, tissue size, and compatibility with immunolabeling. The table below summarizes the key characteristics of the three main approaches.
Table 1: Quantitative Comparison of Tissue Optical Clearing Methodologies
| Method Type | Example Methods | Key Mechanism | Tissue Size Change | Endogenous Fluorescence Preservation | Key Advantages | Key Limitations |
|---|---|---|---|---|---|---|
| Organic Solvent-Based | 3DISCO, uDISCO, iDISCO+ [41] | Gradient dehydration & delipidation; RI matching with organic solvents | High shrinkage (~40-60%) | Poor (quenches fluorescence); Improved in FDISCO [41] | Rapid clearing; Good for large samples | High tissue shrinkage; Fluorescence quenching; Requires stringent safety measures |
| Aqueous-Based | CUBIC, SeeDB, MACS [41] | Delipidation & decolorization; RI matching with high-index aqueous solutions | Swelling (~10-30%) | Good to Excellent [41] | Better fluorescence preservation; Simpler safety | Longer processing time (days to weeks); Potential tissue swelling |
| Hydrogel-Embedding | CLARITY, SWITCH, SHIELD [41] | Hydrogel hybridization for structural support; Electrophoretic/active delipidation | Minimal change (if controlled) | Excellent (if not using strong denaturants) [41] | Superior structural preservation; Compatible with multiple staining rounds | Technically complex; Can be time-consuming; Requires specialized equipment (e.g., electrophoresis) |
The Scientist's Toolkit: Key Reagents and Materials
Successful implementation of these protocols relies on a core set of reagents. The following table details essential items, their functions, and protocol-specific considerations.
Table 2: Essential Research Reagents for Embryo Mounting and Penetration
| Reagent / Material | Function / Purpose | Protocol Application | Critical Considerations |
|---|---|---|---|
| Paraformaldehyde (PFA) | Primary fixative; crosslinks proteins to preserve cellular ultrastructure. | Universal first step in TissUExM and clearing protocols [21] [42]. | Concentration (typically 4%) and fixation time must be optimized to balance structure preservation and antigenicity [42]. |
| Sodium Acrylate | Ionic monomer that drives gel swelling via osmotic pressure in expansion microscopy. | Critical component of the monomer solution in TissUExM [21]. | Purity is critical; impure batches (strong yellow color) can hinder polymerization and expansion. |
| Acrylamide / Bis-Acrylamide | Forms the polyacrylamide gel meshwork that supports the expanded sample. | Key component of the monomer solution in TissUExM and hydrogel-based clearing (e.g., CLARITY) [21] [41]. | Ratio determines gel porosity. Handle as a neurotoxin (use PPE). |
| SDS (Sodium Dodecyl Sulfate) | Ionic denaturant and detergent. Denatures proteins and solubilizes lipids. | Used in post-polymerization digestion buffer for TissUExM and in delipidation for aqueous/hydrogel clearing [21] [41]. | Requires careful handling and warming to 37°C if crystals form. |
| Triton X-100 / Tween 20 | Non-ionic detergents for permeabilizing lipid membranes. | Used in washing and antibody incubation buffers across all protocols [21]. | Allows antibodies and other reagents to access the interior of the tissue. |
| Refractive Index Matching Solution | Homogenizes the RI of the tissue with its surroundings to render it transparent. | Final step in all tissue optical clearing protocols (e.g., CUBIC-1&2, TDE) [41]. | Specific solution depends on the clearing method (e.g., sorbitol-based for SeeDB, urea-based for CUBIC). |
| Enzymatic Digestion Reagents | Break down the extracellular matrix to facilitate antibody penetration. | Can be used prior to immunolabeling in dense tissues (e.g., collagenase). Proteinase K is used post-gelation in TissUExM [21]. | Concentration and time must be tightly controlled to avoid destroying antigen epitopes and tissue architecture. |
Expected Outcomes and Applications
Employing these protocols enables researchers to overcome fundamental barriers in developmental biology imaging. The application of TissUExM to Xenopus embryos has been demonstrated to provide the resolution necessary to study subcellular structures like centrioles and cilia in fine detail [21]. Similarly, effective tissue clearing permits the 3D reconstruction of entire embryonic structures or organ systems, such as the zebrafish lymphatic network or neural circuits in mouse embryos, at single-cell resolution [43] [41].
When imaging expanded or cleared samples on a confocal microscope, users can expect significantly reduced background signal, deeper light penetration, and the ability to resolve structures that were previously indistinguishable due to antibody inaccessibility or light scattering. This allows for more accurate quantitative analysis of protein localization and expression levels throughout the entire embryo.
Reducing Background Autofluorescence in Fixed Tissues
Autofluorescence in fixed tissues presents a significant challenge in immunofluorescence research, particularly when imaging embryos for confocal microscopy. This background signal, which originates from endogenous biomolecules or fixation artifacts, can severely obscure specific fluorescence signals, leading to compromised data interpretation and quantification [44]. Within the specific context of mounting embryos for confocal imaging, managing autofluorescence is crucial for achieving the high signal-to-noise ratios required to visualize fine subcellular structures and weak epitopes. This document outlines validated protocols and application notes to effectively reduce autofluorescence, thereby enhancing the clarity and reliability of your imaging data.
Autofluorescence in fixed tissues arises from multiple sources. Cross-linking fixatives like formalin and paraformaldehyde create fluorescent Schiff bases by reacting with amines, resulting in a broad-spectrum autofluorescence [45]. Endogenous pigments are another major contributor; these include lipofuscin (a lipophilic pigment that accumulates with age and fluoresces across the spectrum, most strongly between 500-695 nm), collagen (emitting in the blue region, 300-450 nm), NADH (emitting around 450 nm), and the heme group in red blood cells [45]. In plant-derived scaffolds, lignin and chlorophyll are significant sources [46].
The strategies to combat autofluorescence can be broadly categorized into three areas, which should be considered during experimental design:
- Chemical and Enzymatic Treatments: Using chemical quenchers or enzymes to reduce the autofluorescence signal.
- Sample Preparation and Mounting: Optimizing fixation, embedding, and mounting protocols to minimize background.
- Advanced Imaging and Computational Techniques: Employing specialized microscopy or post-processing to separate the signal from noise.
Selecting a fluorophore with an emission spectrum far from the dominant autofluorescence of your sample is a fundamental first step. For tissues with high collagen or NADH, fluorophores emitting in the far-red (e.g., CoraLite 647) are recommended [45].
Established Protocols for Autofluorescence Reduction
Chemical Quenching Methods
Chemical quenchers work by altering the electronic states of autofluorescent compounds. The optimal agent depends on the tissue type and the primary source of autofluorescence.
Table 1: Comparison of Chemical Autofluorescence Quenchers
| Quenching Agent | Recommended Concentration | Incubation Time | Primary Use Case | Key Considerations |
|---|---|---|---|---|
| Sudan Black B [45] | 0.1% - 0.3% in 70% ethanol | 10 - 30 minutes | Lipofuscin and formalin-induced autofluorescence | Fluoresces in the far-red channel; avoid if using far-red fluorophores. |
| Copper Sulfate (CuSO₄) [46] | 0.01 M - 0.1 M in dH₂O | 10 - 20 minutes | General autofluorescence, lipofuscin, plant scaffolds (lignin, chlorophyll) | Effective for post-fixation imaging; can affect cell viability in live-cell applications [46]. |
| Sodium Borohydride (NaBH₄) [45] | 0.1% - 1% in PBS | 10 - 30 minutes | Aldehyde-induced autofluorescence from fixation | Must be prepared fresh; can have variable effects on tissue and specific fluorescence [45]. |
| Ammonium Chloride (NH₄Cl) [46] | 0.02 M - 0.2 M in dH₂O | 10 - 20 minutes | Aldehyde-induced autofluorescence | Milder alternative; may be preferable when preserving cell viability is a priority [46]. |
Workflow: Application of Chemical Quenchers The following diagram outlines the general steps for applying chemical quenchers during sample preparation for immunofluorescence.
Enzymatic Pretreatment with Elastase
For specific tissues like lung, which exhibit high intrinsic autofluorescence, a novel enzymatic pretreatment with elastase has proven highly effective. This method preserves nuclear morphology while significantly reducing background, as demonstrated in non-small cell lung cancer (NSCLC) samples for ALK FISH detection [47].
Protocol: Elastase-Based Pretreatment for Lung Tissues [47]
- Sample Preparation: Cut formalin-fixed, paraffin-embedded (FFPE) tissue sections to a standard thickness (e.g., 4-5 µm) and mount on slides. Deparaffinize and rehydrate the sections using xylene and a graded ethanol series.
- Antigen Retrieval: Perform standard heat-induced epitope retrieval appropriate for your target antigens.
- Elastase Treatment:
- Prepare an elastase solution in PBS or an appropriate buffer. The optimal concentration should be determined empirically; the cited study used a range of concentrations to establish efficacy [47].
- Apply the solution to cover the tissue section completely.
- Incubate the slides at 37°C for a defined period (e.g., 30-60 minutes).
- Washing: Rinse the slides gently but thoroughly with PBS to stop the enzymatic reaction and remove residual elastase.
- Downstream Processing: Proceed immediately with your standard immunofluorescence or FISH protocol, including antibody incubations and mounting.
This protocol reduced the FISH retest rate from 86.7% to 0% and enabled the detection of two additional ALK translocated cases that were indeterminate with standard pepsin pretreatment [47].
Immersion-Based Tissue Clearing and Quenching
For 3D imaging of thick specimens like whole-mount embryos, tissue clearing improves light penetration. When combined with autofluorescence quenching, it enables deeper imaging.
Protocol: Immersion-Based Clearing with CUBIC for Myocardial Tissues [48] This protocol, optimized for rat and pig myocardial tissues, can be adapted for other tissue types.
- Tissue Fixation and Sectioning: Fix tissues with 4% PFA and section to a thickness of 300 µm.
- Vascular Labeling (Optional): Immerse tissues in FITC-conjugated tomato lectin (e.g., 50 µg/mL) in PBS for several hours to label the microvasculature.
- Delipidation and Clearing:
- Immerse tissues in CUBIC Reagent 1 ( ScaleCUBIC solution). The study found that a 24-hour incubation provided optimal image quality [48].
- Agitate the samples gently at room temperature.
- Autofluorescence Quenching (Optional): Incubate tissues in a quenching agent. The study evaluated TrueVIEW, Glycine, Trypan Blue, TrueBlack, and Sudan Black B. Note that TrueBlack and Sudan Black B showed trends of reduced imaging depth [48].
- Refractive Index Matching: Transfer tissues to CUBIC Reagent 2 for final clearing and refractive index matching before imaging.
- Mounting and Imaging: Mount the cleared tissues on a coverslip-bottom dish and image using a confocal microscope. This protocol has been successful for imaging depths of up to 150 µm [48].
Table 2: Reagent Kit Solutions for Autofluorescence Reduction
| Reagent / Kit Name | Primary Function | Mechanism of Action | Considerations |
|---|---|---|---|
| TrueVIEW Autofluorescence Quenching Kit [48] [45] | Reduces autofluorescence from multiple causes | Not specified in detail; commercially available as a ready-to-use solution. | Easy-to-use alternative to home-made solutions. |
| CUBIC Reagents [48] | Tissue clearing | Delipidation and refractive index matching to reduce light scattering. | Requires optimization of incubation times; effective for immersion-based clearing. |
Advanced Imaging: Fluorescence Lifetime Imaging Microscopy (FLIM)
When chemical and enzymatic methods are insufficient or risk compromising the specific signal, digital approaches like Fluorescence Lifetime Imaging Microscopy (FLIM) offer a powerful alternative. FLIM separates signals based on the distinct fluorescence lifetime decay profiles of fluorophores, rather than their emission spectra alone [44].
Principle: The fluorescence lifetime of a fluorophore is the average time it remains in the excited state before emitting a photon. Autofluorescence typically has a shorter, broader lifetime distribution compared to the well-defined, longer lifetimes of common immunofluorescence dyes like CF450 (~3.5 ns) [44].
High-Speed FLIM Protocol using Phasor Analysis [44]
- Sample Preparation: Perform standard immunofluorescence staining on fixed tissues.
- Reference Acquisition:
- Image an unstained tissue sample to obtain the phasor cluster for autofluorescence.
- Image the fluorophore in solution or in a control sample to obtain its reference phasor.
- Data Acquisition: Image the stained sample using a high-speed FLIM system equipped with a picosecond pulsed laser and time-resolved detectors. The analog mean delay method allows for high-speed acquisition compatible with clinical workflows [44].
- Phasor Analysis:
- The fluorescence decay curve of each pixel is transformed into a coordinate (G, S) in a 2D phasor plot via a Fourier-like transformation, accelerated by GPU parallel computing.
- The phasors of autofluorescence and specific immunofluorescence will occupy distinct regions in this plot.
- Signal Separation:
- For each pixel with a mixed signal, its phasor will lie on the line connecting the reference phasors of autofluorescence and immunofluorescence.
- The fractional contribution of immunofluorescence is calculated as:
Fraction_IF = d_a / (d_a + d_i), whered_ais the distance to the autofluorescence reference andd_iis the distance to the immunofluorescence reference [44]. - This calculation generates a new, autofluorescence-free image representing only the specific immunofluorescence signal.
This method has been shown to enhance the correlation of immunofluorescence images with immunohistochemistry data, outperforming chemically-assisted photobleaching [44]. The following diagram illustrates the core principle of signal separation using FLIM and phasor analysis.
Mounting Embryos for Optimal Confocal Microscopy
Proper mounting is the final critical step to minimize light scattering and preserve sample integrity during imaging. The following methods are particularly suited for embryo imaging.
Expansion Microscopy for Super-Resolution
Expansion Microscopy (ExM) physically enlarges the sample, effectively increasing resolution without the need for a super-resolution microscope. This process also dilutes autofluorescent molecules, potentially reducing background signal per voxel.
Protocol Summary for Drosophila Embryos [49]
- Fixation and Staining: Fix and immunostain embryos following standard protocols.
- Gel Embedding: Embed the stained embryos in a swellable polyelectrolyte hydrogel gel (monomer solution).
- Digestion: Incubate the polymerized gel in a digestion buffer (e.g., 30 mL for 1 hour at 37°C) to homogenize the tissue and allow for uniform expansion.
- Expansion: Transfer the gel to deionized water. The hydrogel will expand linearly by approximately 4 to 4.9-fold, physically enlarging the embryo and its fluorescent labels [49].
- Mounting: Mount the expanded hydrogel on a cover slip for imaging on a standard confocal microscope. This technique has resolved subcellular details, such as parallel lines of myosin II at cell junctions, which appeared as a single line in unexpanded controls [49].
Custom 3D-Printed Molds for Reproducible Orientation
Consistent embryo orientation is vital for reproducible imaging. Using custom 3D-printed molds to create agarose wells provides a reliable and high-throughput solution.
Protocol: Creating and Using Agarose Wells with 3D-Printed Molds [50]
- Design and Print Mold:
- Using CAD software (e.g., TinkerCAD), design a base with pegs that approximate the shape and size of your embryo. Taper the pegs to help orient the tissue of interest towards the objective.
- Print the mold using a stereolithography (SLA) 3D printer with a water-washable resin. Wash and cure the mold thoroughly after printing.
- Create Agarose Wells:
- Place the mold in a coverslip-bottom dish.
- Pipette 1.5 mL of molten 2% agarose (in E3 media for zebrafish) around the mold and let it solidify for 5-7 minutes.
- Place an outer ring over the assembly and gently remove the inner mold, leaving behind agarose wells with the inverse shape of the pegs.
- Mount Embryos:
- Transfer the staged embryos into the agarose wells using a pipette, orienting them correctly with a fine tool.
- Once oriented, carefully add a small amount of low-melting-point agarose or mounting medium to immobilize the embryos.
- Cover with a coverslip for imaging. This method ensures multiple embryos are mounted in identical orientations, facilitating high-throughput and reproducible data acquisition [50].
Confocal microscopy is an advanced fluorescence imaging technique that enables the construction of high-resolution, three-dimensional images by collecting thin optical sections along the vertical z-axis. Unlike conventional wide-field fluorescence microscopy, which captures light from all focal planes resulting in blurred images, confocal microscopy employs a pinhole aperture to physically eliminate out-of-focus light. This fundamental difference allows researchers to examine fixed and live samples with greater precision and clarity, making it particularly valuable for imaging complex biological structures such as embryos [51].
The core principle of confocal microscopy involves focusing both the illumination source and detector on a single diffraction-limited spot within the sample. A complete image is generated by scanning this focused spot across the sample in a point-by-point manner and sequentially building the image from photons that pass through the confocal pinhole to the detector. This optical sectioning capability is crucial for examining intricate three-dimensional architectures in developmental biology research, particularly when studying subcellular structures within embryo samples [51].
Theoretical Framework for Parameter Optimization
The Role of the Pinhole in Optical Sectioning
The pinhole is a critical spatial filter placed in front of the detector in a confocal microscope. Its primary function is to block fluorescence emitted from regions outside the focal plane, thereby significantly improving image contrast and effective resolution. The size of the pinhole is typically measured in Airy units (AU), where 1 Airy Unit corresponds to the diameter of the first minimum of the Airy disk pattern formed by a point source in the detector plane. The relationship between pinhole size and image quality follows these principles [51]:
- Small pinhole sizes (below 1 AU) provide the thinnest possible optical sections and highest resolution but significantly reduce signal intensity, potentially requiring increased laser power that may cause photobleaching or phototoxicity.
- Large pinhole sizes (above 1 AU) allow more signal to reach the detector but compromise axial resolution and optical sectioning capability by permitting more out-of-focus light to contribute to the image.
- Optimal balance is typically achieved at approximately 1 AU, where the best compromise between signal strength and resolution is obtained for most applications.
For embryo imaging, where samples often contain multiple layers and complex structures, careful adjustment of the pinhole size is essential to maximize information content while minimizing damage to viable specimens.
Z-stack Acquisition and Section Overlap
Three-dimensional reconstruction in confocal microscopy requires the acquisition of a series of images at different focal planes, known as a z-stack. The quality of subsequent 3D reconstructions and analyses depends critically on proper sampling along the z-axis, governed by the Nyquist-Shannon sampling theorem. Two key parameters must be considered [52]:
- Step size (the distance between consecutive optical sections) should be small enough to adequately sample structures in three dimensions.
- Overlap between adjacent sections ensures that no information is lost between optical planes.
For high-resolution imaging of subcellular structures in embryos, smaller step sizes are necessary to capture fine details, whereas for overview images of larger areas, larger step sizes may be sufficient. Insufficient z-sampling can lead to missed structures and artifacts in 3D reconstructions, while excessive sampling increases acquisition time and photodamage risk without providing additional information.
Laser Power and Signal-to-Noise Optimization
Laser power directly influences signal intensity and potential sample damage through two primary mechanisms [51]:
- Photobleaching: The irreversible destruction of fluorophores upon excitation, reducing signal over time.
- Phototoxicity: The generation of reactive oxygen species and other damaging byproducts that can compromise sample viability, particularly critical in live embryo imaging.
The relationship between laser power and image quality follows a diminishing returns pattern, where initial increases provide substantial improvements in signal-to-noise ratio, but further increases yield minimal benefits while dramatically increasing photodamage. Optimal laser power settings must therefore balance sufficient signal intensity for detection and quantification against minimal exposure to preserve sample integrity and fluorescence signal.
Table 1: Quantitative Guidelines for Confocal Parameter Optimization in Embryo Imaging
| Parameter | Recommended Setting | Biological Consideration | Impact on Image Quality |
|---|---|---|---|
| Pinhole Size | 1 Airy Unit (AU) | Balance between resolution and signal intensity for embryo sections | ±30% change from 1 AU significantly affects axial resolution |
| Z-step Size | 0.3-0.5 μm | Adequate sampling of subcellular structures in embryos | Smaller steps improve 3D reconstruction but increase acquisition time |
| Laser Power | 1-10% of maximum | Minimize phototoxicity while maintaining detectable signal | Doubling power increases signal linearly but increases photobleaching quadratically |
| Digital Zoom | 2-4× | Balance between spatial resolution and field of view | Higher zoom reduces imaged area, potentially increasing pixel dwell time |
| Scanning Speed | 400-800 Hz | Balance between image quality and acquisition time | Slower speeds improve signal-to-noise ratio but increase photodamage risk |
Practical Protocol for Embryo Imaging
Sample Preparation Considerations
Proper sample preparation is foundational to successful confocal imaging of embryos. Based on established protocols for Xenopus embryos, the following steps ensure optimal preservation of structure and antigenicity [21]:
- Fixation: Use 4% paraformaldehyde (PFA) in phosphate-buffered saline (PBS) for 2 hours at room temperature or overnight at 4°C. This cross-links proteins while preserving cellular structures.
- Permeabilization: Treat with 0.1% Triton X-100 in PBS for 30 minutes to allow antibody penetration.
- Blocking: Incubate in blocking solution (1-5% bovine serum albumin or normal goat serum in PBS) for 2 hours to reduce nonspecific antibody binding.
- Immunolabeling: Apply primary antibodies diluted in blocking solution overnight at 4°C, followed by appropriate fluorescent secondary antibodies for 4-6 hours at room temperature.
- Mounting: For expanded samples, mount in optimal cutting temperature (O.C.T.) compound or similar mounting media matched to the objective lens refractive index [21] [52].
Step-by-Step Confocal Optimization Procedure
The following protocol provides a systematic approach to optimizing confocal settings for embryo imaging, with specific reference to tissue expansion microscopy (TissUExM) applications [21]:
Step 1: Initial Setup
- Select an appropriate objective lens with high numerical aperture (NA ≥ 1.4) and correct immersion medium (oil, water, or glycerol).
- Place the mounted embryo sample on the stage and bring it into focus using transmitted light or low fluorescence illumination.
Step 2: Laser Power Calibration
- Begin with the lowest possible laser power (typically 1-2% of maximum).
- Gradually increase power until the signal from the brightest channel is detectable but not saturated.
- For multi-color imaging, repeat this process for each fluorophore separately.
Step 3: Pinhole Adjustment
- Set the pinhole to 1 AU for the first imaging session.
- For specific applications, adjust based on requirements:
- Use smaller pinholes (0.7-0.8 AU) when maximum resolution is critical and signal is strong.
- Use larger pinholes (1.2-1.5 AU) when imaging faint signals or when photobleaching is a concern.
Step 4: Z-stack Configuration
- Define the top and bottom limits of the region of interest using the focus controls.
- Set the z-step size to 0.3-0.5 μm for most embryo imaging applications to ensure adequate sampling.
- For high-resolution imaging of subcellular structures, use smaller step sizes (0.1-0.3 μm).
Step 5: Acquisition and Quality Assessment
- Acquire a test stack and inspect for:
- Uniform signal intensity throughout the z-series
- Adequate signal-to-noise ratio without background saturation
- No visible signs of photobleaching during acquisition
- Adjust parameters iteratively until optimal image quality is achieved.
Table 2: Research Reagent Solutions for Embryo Confocal Microscopy
| Reagent/Category | Specific Examples | Function in Protocol |
|---|---|---|
| Fixatives | 4% Paraformaldehyde (PFA), Formaldehyde (FA) | Preserves tissue architecture and antigen accessibility |
| Permeabilization Agents | Triton X-100, Tween-20 | Creates pores in membranes for antibody penetration |
| Mounting Media | SlowFade Diamond, O.C.T. Compound | Preserves fluorescence, matches refractive index |
| Blocking Agents | Bovine Serum Albumin (BSA), Normal Goat Serum | Reduces nonspecific antibody binding |
| Primary Antibodies | Anti-α-tubulin, Anti-laminin, Anti-myosin heavy chain | Binds specifically to target antigens |
| Secondary Antibodies | Alexa Fluor 488, 546, 647, 750 conjugates | Fluorescently labels primary antibodies for detection |
| Embedding Compounds | Acrylamide, Sodium Acrylate, Bis-Acrylamide | Forms polymer matrix for tissue expansion microscopy |
Advanced Applications in Embryo Imaging
Integration with Expansion Microscopy
Tissue expansion microscopy (TissUExM) represents a powerful approach to achieve super-resolution imaging by physically expanding biological samples. When combined with confocal microscopy, this technique enables enhanced resolution for studying subcellular structures in embryos. The protocol involves [21]:
- Fixation and Cross-linking: Treatment with formaldehyde and acrylamide to form a polyelectrolyte gel.
- Gelation: Polymerization of the gel within the tissue using ammonium persulfate (APS) and tetramethylethylenediamine (TEMED).
- Expansion: Digestion of proteins and homogenization of the gel in water, resulting in physical expansion of the specimen.
- Immunolabeling and Imaging: Staining of expanded samples followed by confocal imaging.
This method achieves approximately 4-fold linear expansion of whole Xenopus embryos, enabling detailed analysis of subcellular structures such as centrioles and cilia in epidermal multiciliated cells with enhanced resolution [21].
Quantitative Imaging and Analysis
Modern confocal microscopy enables not only qualitative observation but also quantitative analysis of fluorescence signals. For accurate quantification of protein expression in embryo sections, the following considerations are essential [53]:
- Linearity of Detection: Ensure the detection system operates in its linear range, where measured intensity is directly proportional to fluorophore concentration.
- Background Subtraction: Implement consistent background subtraction methods across all samples.
- Normalization: Normalize signals to internal controls or reference standards when comparing between samples.
- Segmentation: Use appropriate nuclear or cellular segmentation algorithms (e.g., StarDist, CellProfiler) for precise quantification of signal intensity within defined regions of interest [54].
These quantitative approaches are particularly valuable for investigating signaling activity in developmental systems, such as TGF-β superfamily signaling in pre-implantation human embryos through detection of phosphorylated SMAD proteins [54].
Workflow Visualization
The following diagram illustrates the logical relationship and optimization workflow for the key confocal parameters discussed in this protocol:
Confocal Parameter Optimization Workflow
Optimizing confocal settings for embryo imaging requires careful consideration of the interconnected relationships between pinhole size, z-stack parameters, and laser power. By following the systematic approach outlined in this protocol, researchers can achieve high-quality, reproducible images while minimizing photodamage to valuable embryo samples. The integration of these optimization strategies with advanced techniques such as expansion microscopy and quantitative image analysis provides powerful tools for investigating developmental processes at multiple scales, from whole embryos to subcellular structures. As confocal technology continues to evolve with improvements in resolution, speed, and sensitivity, these fundamental principles of parameter optimization will remain essential for extracting maximum biological insight from fluorescence imaging experiments.
Preventing Physical Damage and Crushing During the Mounting Process
Within the context of a broader thesis on mounting embryos for confocal microscopy, the mounting process represents a critical final stage where invaluable research specimens are particularly vulnerable. For pre-implantation human embryos and other delicate three-dimensional structures, the physical transfer from culture dishes to microscope slides introduces significant risks of crushing, deformation, or shear stress that can compromise structural integrity and imaging quality [55]. This application note details standardized protocols designed to minimize these risks during the handling of sensitive biological samples, specifically within the framework of confocal microscopy after immunofluorescence procedures. The methodologies presented here integrate specialized equipment, precise technical execution, and rigorous quality control to ensure the preservation of structural information essential for accurate scientific interpretation in developmental biology and drug discovery research.
Experimental Protocols
Critical Reagents and Equipment
The following reagents and equipment are essential for executing the embryo mounting protocol while minimizing physical damage. Specific product citations are included where available in the search results, with alternatives provided for general components.
Table 1: Research Reagent Solutions for Embryo Mounting
| Item | Function/Description | Specific Examples/Properties |
|---|---|---|
| Glass Capillaries | Manual handling of embryos; smooth edges prevent tearing | Custom-pulled from Pasteur pipettes [55] |
| DAPI-containing Mounting Medium | Preserves specimen integrity and counterstains nuclei | Vectashield mounting medium [55] |
| Global Medium | Maintenance medium during transfer steps | LifeGlobal Global Medium [55] |
| Phosphate-Buffered Saline (PBS) | Washing and dilution buffer | With or without Ca²⁺/Mg²⁺ [55] |
| 4% Paraformaldehyde (PFA) | Fixation for structural preservation | Prepared fresh and stored at 4°C [55] |
| Confocal Microscope | High-resolution 3D imaging with minimal optical distortion | Leica SP8 with 63x glycerol objective [55] |
Detailed Mounting Protocol for Pre-implantation Embryos
This protocol is adapted from established methods for handling human blastocysts and is designed to prevent physical damage throughout the mounting process [55]. The workflow involves specialized equipment preparation, a careful transfer process, and appropriate imaging setup.
2.2.1 Preparation of Glass Handling Capillaries
Timing: 10 minutes
- Heating: Heat a standard glass Pasteur pipette in a Bunsen burner flame until the glass becomes malleable.
- Pulling: While the glass is hot, gently pull the pipette outward to form a thin, elongated capillary.
- Breaking: Break the tip at a diameter sufficient to accommodate an expanded human blastocyst (>300 μm) without applying excessive pressure [55].
- Fire-Polishing: Critically, briefly pass the newly formed opening through the Bunsen burner flame to soften any sharp edges that could lacerate the embryo during handling.
- Quality Control: Under a stereo microscope, inspect the capillary opening to ensure it has smooth edges, a perfectly round shape, and adequate diameter. Capillaries meeting these specifications can be reused if cleaned appropriately by sequential rinsing with deionized water, 70% ethanol, and acetone.
2.2.2 Embryo Transfer and Mounting Procedure
- Pre-Mounting Setup: Place a small drop of appropriate mounting medium (e.g., DAPI-containing Vectashield) onto a clean glass coverslip. For making stable glass capillaries for handling embryos, ensure all washing and equilibration steps are performed in 4-well dishes on a rocking platform at standard laboratory room temperature (15°C to 25°C) to maintain environmental consistency [55].
- Embryo Transfer:
- Using a fire-polished glass capillary attached to a manual pipette bulb, gently aspirate the embryo in a minimal volume of medium.
- Carefully expel the embryo into the center of the mounting medium droplet. Avoid introducing air bubbles.
- The embryo should settle to the bottom of the medium droplet without requiring physical manipulation.
- Coverslip Lowering: Gently lower a glass slide onto the coverslip, allowing the mounting medium to spread evenly without applying pressure. If using a spacer, ensure it is positioned to prevent compression of the embryo.
- Sealing: Apply a small amount of clear nail polish or a commercial sealant around the edges of the coverslip to secure it and prevent medium evaporation during imaging. Avoid rapid movements that could shift the specimen.
Confocal Imaging Setup for 3D Reconstruction
To complement the careful physical mounting, the confocal microscope must be configured to collect high-quality 3D data without the need for excessive laser power that could cause photodamage.
- Objective Selection: Use a high-numerical-aperture (NA) immersion objective, such as a 63x glycerol objective, which provides excellent resolution and is less prone to crushing samples compared to high-magnification oil objectives that require closer working distances [55].
- Z-Stack Acquisition: Configure the software to acquire a Z-stack that extends beyond the apparent top and bottom of the embryo. This "extended Z-length" practice accounts for potential variations in tissue flatness and ensures the entire structure is captured, which is a key advantage of confocal microscopy for 3D analysis [56].
- Spectral Unmixing: If multiple fluorophores are used, leverage the white light laser (WLL) and spectral detection capabilities of modern confocal systems (e.g., Leica Stellaris 5) to perform linear unmixing. This minimizes signal bleed-through and allows for the use of optimal fluorophore combinations without compromising image quality due to physical filter constraints [56].
Post-Processing and Quantitative Analysis
Following image acquisition, specialized software is used to extract quantitative data from the carefully preserved 3D structure.
- Nuclear Segmentation: Use the StarDist plugin in Fiji/ImageJ for accurate segmentation of individual nuclei within the blastocyst, which is a common requirement in developmental studies [55].
- 3D Reconstruction and Quantification: Import the Z-stack image series into CellProfiler 4.2.1 or similar software. This enables 3D reconstruction, tracking of nuclei through the Z-stack, and quantification of fluorescence intensity, providing data on protein localization and expression levels [55].
Table 2: Quantitative Analysis Parameters for Embryo Imaging
| Analysis Parameter | Measurement Purpose | Software Tool | Technical Benefit |
|---|---|---|---|
| Fluorescence Intensity | Quantify protein expression/phosphorylation (e.g., p-SMAD) | CellProfiler [55] | Assesses signaling activity in 3D context |
| Nuclear Count & Position | Determine cell number and spatial distribution | StarDist (Fiji) [55] | Maps lineage specification and viability |
| Cross-Sectional Area | Measure fiber or cellular morphology | CellProfiler/Custom Scripts [56] | Evaluates structural preservation post-mounting |
| 3D Co-localization | Analyze spatial relationship of multiple proteins | Imaris/Volocity | Confirms molecular interactions |
Discussion
The protocols outlined herein provide a comprehensive framework for safeguarding delicate embryonic structures during the critical mounting process for confocal microscopy. The emphasis on custom-fabricated, fire-polished glass capillaries addresses the most common point of physical failure, while the optimized confocal settings ensure that the structural data is captured with maximum fidelity and minimal post-acquisition manipulation [55] [56].
For researchers in drug development, the reproducibility of this protocol is paramount. Consistent mounting prevents artifacts that could lead to misinterpretation of drug effects on embryonic development or cellular morphology. The ability to reliably generate 3D reconstructions of intact embryos provides a robust platform for high-content screening and mechanistic studies. Adherence to these detailed methodologies ensures that the substantial investment in specimen preparation and immunofluorescence is fully realized in the final imaging output, delivering reliable, publication-quality data while maintaining the integrity of precious research materials.
Addressing Pigmentation in Zebrafish and Frog Embryos with PTU or Bleaching
In immunofluorescence research utilizing zebrafish and frog embryos, natural pigmentation, primarily from melanocytes, presents a significant challenge for high-resolution confocal microscopy. Pigment granules can obscure fluorescent signals, cause light scattering, and complicate the imaging of deep tissues, ultimately compromising data quality [24]. Within the broader context of mounting embryos for confocal microscopy, addressing this pigmentation is a critical preparatory step. This application note details two primary strategies—chemical inhibition with 1-Phenyl-2-thiourea (PTU) and physical bleaching—to produce clear, unambiguous images essential for scientific and drug development research.
The Scientist's Toolkit: Essential Reagents for Depigmentation
The following table lists key reagents used in the processes of chemical and physical depigmentation of embryos.
Table 1: Key Research Reagent Solutions for Embryo Depigmentation
| Reagent Name | Function/Brief Explanation |
|---|---|
| 1-Phenyl-2-thiourea (PTU) | A tyrosinase inhibitor that prevents the formation of melanin pigment by disrupting its synthetic pathway, resulting in embryos that never develop pigment [24]. |
| Paraformaldehyde (PFA) | A fixative used to preserve embryonic structures. Light fixation (e.g., 1% PFA) is crucial for successful subsequent physical bleaching, as over-fixation darkens and hardens the yolk, making it difficult to remove [24]. |
| Potassium Permanganate | An oxidizing agent used in the bleaching solution to break down existing melanin pigments. |
| Hydrogen Peroxide | Used in conjunction with potassium permanganate in the bleaching protocol to fully oxidize and clear the pigmentation. |
| Dimethyl Sulfoxide (DMSO) | A common solvent for stock solutions of compounds like PTU, ensuring their proper dissolution and bioavailability in embryo medium. |
| Egg Water | The standard medium for raising zebrafish embryos; used as the base for preparing PTU-working solutions. |
Methodologies and Protocols
Protocol 1: Chemical Inhibition of Pigmentation with PTU
PTU is the preferred method for live studies where embryos need to be raised beyond the imaging period, as it prevents pigment from forming in the first place.
Procedure:
- Solution Preparation: Prepare a 0.003% (w/v) PTU stock solution in standard egg water. A 10 mM stock solution in DMSO can be made for easier dilution.
- Treatment Timing: Transfer dechorionated embryos to the PTU solution before the onset of pigmentation, typically by 24 hours post-fertilization (hpf) for zebrafish.
- Incubation: Incubate the embryos in the PTU solution at 28.5°C until they reach the desired developmental stage. Protect the solution from light by wrapping the petri dish in foil, as PTU is light-sensitive.
- Solution Refreshment: Replace the PTU solution every 24 hours to maintain efficacy.
- Fixation: After the treatment period, proceed with standard fixation protocols (e.g., using 4% PFA) for immunofluorescence.
Protocol 2: Physical Bleaching of Fixed Embryos
Bleaching is a post-fixation method used to remove pre-existing pigment and is ideal for fixed samples destined for whole-mount immunofluorescence.
Procedure:
- Light Fixation: To facilitate later bleaching and yolk removal, fix dechorionated embryos in 1% PFA for 2 hours at room temperature or overnight at 4°C. Avoid higher concentrations or longer durations at this stage, as over-fixation will cause the yolk to turn dark grey and adhere tightly to tissues [24].
- Bleaching Solution: Prepare a bleaching solution consisting of 1% potassium permanganate and 1% hydrogen peroxide in distilled water. Alternative concentrations (e.g., 3% H₂O₂ and 0.5% KOH) can also be effective.
- Bleaching Process: Transfer the lightly fixed embryos to the bleaching solution and incubate at room temperature. Monitor the embryos closely until the pigment is visibly cleared, which usually takes 10-30 minutes.
- Rinsing: Thoroughly rinse the bleached embryos with phosphate-buffered saline (PBS) to stop the bleaching reaction.
- Refixation: For structural integrity during immunostaining and mounting, post-fix the bleached embryos in 4% PFA for 2-4 hours at room temperature or overnight at 4°C [24].
Workflow Integration for Confocal Microscopy
The depigmentation step is integrated into a larger workflow designed to produce high-quality confocal images. The following diagram illustrates the logical relationship and sequential steps from embryo preparation to final imaging, highlighting where depigmentation occurs.
Data Presentation and Comparison
Choosing between PTU treatment and physical bleaching depends on the experimental goals. The table below summarizes the key characteristics of each method to guide researchers in their selection.
Table 2: Comparative Analysis of PTU Treatment vs. Physical Bleaching
| Parameter | PTU Treatment | Physical Bleaching |
|---|---|---|
| Principle | Chemical inhibition of tyrosinase | Chemical oxidation of melanin |
| Application Stage | Live embryos | Fixed embryos |
| Optimal Timing | Before pigment formation (e.g., <24 hpf) | After fixation |
| Impact on Development | Non-toxic at correct concentration; allows normal development | Not applicable (post-fixation) |
| Effect on Yolk | No direct effect | Light fixation (1% PFA) is critical to prevent yolk darkening/hardening [24] |
| Primary Advantage | Prevents pigment formation entirely; ideal for long-term live studies | Rapidly clears existing pigment in fixed samples |
| Main Limitation | Requires prolonged incubation; light-sensitive | Requires careful control of fixation to be effective [24] |
| Compatibility with Immunostaining | High, after fixation | High, after refixation in 4% PFA [24] |
Troubleshooting and Best Practices
- Preventing Yolk Adhesion: If the yolk becomes difficult to remove after bleaching, it is likely due to over-fixation in the initial step. Ensure fixation is performed with 1% PFA and not a higher concentration [24].
- Incomplete Bleaching: If pigment remains after bleaching, ensure the bleaching solution is fresh and properly concentrated. Gently agitating the tube during bleaching can improve solution contact.
- PTU Toxicity: If embryos show developmental delays or malformations in PTU, verify the concentration and ensure the stock solution was prepared correctly and stored in the dark.
- Mounting for Deep Tissue Imaging: For imaging tissues obscured by the yolk or other layers, consider a deyolking protocol after bleaching and refixation. This involves physically removing the yolk on lightly fixed embryos using sharp forceps, followed by refixation and mounting on bridged slides to prevent sample crushing [24].
Ensuring Data Integrity and Exploring Advanced Applications
Validating Staining Specificity with Controls and Alternative Fixatives
Within the context of mounting embryos for confocal microscopy after immunofluorescence (IF), validating staining specificity is paramount to generating reliable, publication-quality data. The choice of tissue fixation and processing protocols directly impacts antigen preservation and the specificity of antibody binding. Non-specific staining or high background fluorescence can lead to erroneous interpretation of spatial protein localization, a critical factor in developmental studies. This document outlines a rigorous framework, integrating essential experimental controls and data on alternative fixatives, to ensure the highest standard of staining specificity for embryonic confocal imaging.
The Critical Role of Experimental Controls
Incorporating the correct controls is the first and most crucial step in validating any immunofluorescence experiment. These controls act as internal checks to differentiate a true specific signal from artefacts caused by non-specific antibody binding, endogenous fluorescence, or protocol-specific errors [57] [58].
Types of Essential Controls and Their Interpretation
The following controls are considered essential for a robust IF protocol. Their results directly inform troubleshooting and data validation.
Table 1: Essential Controls for Validating Immunofluorescence Staining
| Control Type | Protocol | What It Validates | Interpretation of Result |
|---|---|---|---|
| Positive Control [57] [58] | Tissue/cells known to express the target antigen. | That the entire staining protocol is functioning correctly. | Lack of signal indicates a fundamental protocol failure. |
| No Primary Antibody Control [57] [58] | Omit the primary antibody; incubate with buffer and secondary antibody only. | Specificity of the secondary antibody and level of non-specific binding. | Signal indicates non-specific binding of the secondary antibody. |
| Isotype Control [57] [58] | Use a non-immune antibody of the same isotype and host species as the primary. | That observed staining is due to specific antigen binding, not non-specific Fc receptor or protein interactions. | Signal matching the test sample indicates non-specific primary antibody binding. |
| Absorption Control [57] [58] | Pre-adsorb the primary antibody with an excess of its immunogen before application. | Specificity of the primary antibody for its intended target. | Significant reduction or loss of signal confirms antibody specificity. |
| Endogenous Background / No Secondary Control [57] [58] | Omit the secondary antibody from the protocol. | Level of tissue autofluorescence. | Signal reveals inherent tissue fluorescence that must be accounted for. |
Logic Flow for Control Selection and Troubleshooting
The following diagram outlines a decision-making workflow for selecting the appropriate controls and troubleshooting common issues based on the control results. This structured approach is vital for confirming staining specificity.
Impact of Fixation on Staining Specificity
The fixation process is a critical pre-analytical variable that profoundly affects epitope preservation. Suboptimal fixation can mask antigen binding sites or increase non-specific background, directly compromising staining specificity [59] [60].
Quantitative Comparison of Fixative Performance
A 2025 pilot study directly compared common fixation and decalcification protocols for bone marrow trephine biopsies, using immunohistochemical (IHC) yield as a key metric for antigen preservation. While focused on bone marrow, the findings are highly relevant to the challenges of preserving antigenicity in dense embryonic tissues. The study quantified the number of inadequate IHC stains for 25 biomarkers across different protocols [59].
Table 2: Fixative and Decalcification Protocol Performance on IHC Staining Quality [59]
| Fixative Reagent | Decalcifying Reagent | Total Inadequate IHC Stains (out of 25 biomarkers) | Key Findings |
|---|---|---|---|
| Commercial B5-based | EDTA-based | 5 | Best performing combination; optimal balance of morphology and antigen preservation. |
| Buffered Formalin | None (Reference) | Not specified (Used as reference) | Standard for most tissues, but not suitable for calcified structures. |
| "In-house" B5-based | EDTA-based | 8 | Worst performing combination; highlights variability of in-house formulations. |
| Acetic acid–Zinc–Formalin (AZF) | EDTA-based | 7 | Lower performance, more inadequate stains. |
| Commercial B5-based | Mielodec B (EDTA) | Data extrapolated | Commercially standardized kits can improve reproducibility. |
| Buffered Formalin | Mielodec B (EDTA) | Data extrapolated | Allows decalcification of formalin-fixed tissue with commercial reagents. |
The study concluded that the overall IHC quality is mainly related to the fixative rather than the decalcifying phase, underscoring the paramount importance of fixation choice [59].
Alternative Fixatives for Improved Molecular Preservation
While 10% Neutral Buffered Formalin (NBF) is the historical standard, alternative fixatives have been developed to mitigate its drawbacks, such as protein cross-linking that masks epitopes and the generation of sequencing artefacts [60].
Research on colorectal cancers has demonstrated that acid-deprived fixatives significantly improve the quality of biomolecules available for downstream analysis. Compared to NBF, Glyoxal Acid Free (GAF) and Acid-Deprived Formalins (ADF, coldADF) showed:
- Reduced FFPE-artefact mutational signatures (Signature 1 was 37% in NBF vs. 17% in coldADF) [60].
- Higher DNA quality and improved sequencing performance, with longer library reads and better data uniformity [60].
- Fewer discordant mutation calls, with most discrepancies involving NBF samples [60].
These findings are critical for researchers in developmental biology who may need to perform subsequent genomic or proteomic analyses on the same embryonic samples used for IF.
The Scientist's Toolkit: Key Research Reagent Solutions
Selecting the right reagents is fundamental to success. The following table details essential materials and their functions for setting up controlled and validated immunofluorescence experiments.
Table 3: Essential Reagents for Immunofluorescence Validation
| Reagent / Solution | Function / Purpose |
|---|---|
| Pre-adsorbed Secondary Antibodies [57] | Secondary antibodies processed to reduce cross-reactivity with serum proteins of non-target species, minimizing non-specific background. |
| Isotype Control Antibodies [57] [58] | Negative control antibodies matching the host species, isotype, and conjugation of the primary antibody but lacking target specificity. |
| Positive Control Tissue/Slides [57] [58] | A validated tissue or cell preparation known to express the protein of interest, essential for confirming protocol functionality. |
| Knockout (KO) or Knockdown (KD) Samples [58] | Genetically modified tissues or cells lacking the target antigen, providing a powerful biological negative control. |
| EDTA-based Decalcifying Solution [59] | A milder decalcifying agent compared to strong acids; better preserves tissue antigenicity for IHC/IF staining of mineralized tissues. |
| Acid-Deprived Fixatives (e.g., GAF, ADF) [60] | Alternative fixatives that reduce acid-induced biomolecule degradation, improving the quality of nucleic acids and proteins for downstream analysis. |
| Antibody Dilution Buffer [57] | The solution used to dilute and store antibodies; used in the "No Primary" control to confirm staining specificity. |
Detailed Experimental Protocols
Purpose: To confirm that the observed staining is due to the antigen-specific Fab region of the primary antibody and not the result of non-specific interactions of the antibody's Fc region or other parts of the immunoglobulin molecule with tissue components.
Materials:
- Isotype control antibody (same species, isotype, clonality, and conjugation as the primary antibody)
- Standard IF staining reagents and equipment
Procedure:
- Sample Preparation: Prepare two parallel samples (e.g., serial sections of the mounted embryo) simultaneously.
- Staining:
- Test Sample: Apply the specific primary antibody at the optimized concentration.
- Control Sample: Apply the isotype control antibody at the exact same concentration as the primary antibody.
- Incubation: Incubate both samples with their respective antibodies for the same duration and under identical conditions (temperature, humidity).
- Secondary Detection: Process both samples identically through all subsequent steps, including washing, application of fluorescent secondary antibody, counterstaining (e.g., DAPI), and mounting.
- Imaging and Analysis: Acquire images of both samples using identical microscope and camera settings. The staining in the test sample should be distinctly brighter than any background signal present in the isotype control sample to be considered specific.
Purpose: To demonstrate the specificity of the primary antibody by competitively inhibiting its binding to the tissue antigen using the purified immunogen.
Materials:
- Purified immunogen (peptide or protein) used to generate the primary antibody
- Primary antibody
- Appropriate buffer for antibody dilution
Procedure:
- Preparation of Immune-Depleted Antibody:
- Incubate the primary antibody at its working concentration with a 5- to 10-fold molar excess of the purified immunogen.
- Gently agitate this mixture overnight at 4°C.
- Centrifugation: The following day, centrifuge the mixture at a high speed (e.g., 10,000-14,000 x g) for 10 minutes to pellet any potential immune complexes. Use the supernatant as the "absorbed" primary antibody solution.
- Staining:
- Test Sample: Apply the untreated primary antibody.
- Control Sample: Apply the absorbed primary antibody supernatant.
- Incubation and Detection: Process both samples identically through the remainder of the IF protocol.
- Interpretation: A significant reduction or complete absence of staining in the control sample compared to the test sample confirms the specificity of the primary antibody. This control works best when the immunogen is a purified peptide.
Correlative imaging approaches bridge functional data with high-resolution structural analysis. This application note details the methodology and advantages of nuclear stain 'Pseudo-SEM' imaging, a fluorescence-based technique for visualizing embryonic morphology, and contrasts it with traditional Scanning Electron Microscopy (SEM). Framed within the context of mounting embryos for confocal microscopy after immunofluorescence research, we provide validated protocols for researchers in developmental biology and drug development. The data demonstrate that Pseudo-SEM rivals traditional SEM in topological clarity while preserving specimen viability for subsequent assays.
In developmental biology research, particularly following immunofluorescence studies, high-resolution imaging of embryonic morphology is crucial. Traditional Scanning Electron Microscopy (SEM) has been the benchmark for high-resolution topological imaging but presents significant limitations in cost, accessibility, and specimen preservation [26]. The development of 'Pseudo-SEM'—a method combining whole-mount nuclear fluorescent staining with confocal microscopy—offers a compelling alternative that integrates seamlessly with workflows after immunofluorescence analysis [26]. This correlative approach allows researchers to extract maximal data from single, often precious, embryonic specimens by combining functional protein localization data with detailed morphological analysis. This note provides a direct comparison of these techniques and detailed protocols for their application.
Technical Comparison: Pseudo-SEM vs. Traditional SEM
The choice between Pseudo-SEM and traditional SEM involves trade-offs between resolution, specimen impact, cost, and technical requirements.
Table 1: Quantitative and Qualitative Comparison of Pseudo-SEM and Traditional SEM
| Feature | Nuclear Stain 'Pseudo-SEM' | Traditional SEM |
|---|---|---|
| Core Principle | Confocal microscopy of nuclear-stained whole-mount specimens [26] | Electron beam scanning of coated, dehydrated specimens [26] [61] |
| Best Resolution | Rivals SEM clarity [26] | High, sub-nanometer resolution [61] |
| Specimen Preparation | Aqueous physiological buffer; minimal processing [26] | Dehydration, metal coating; extensive processing [26] [61] |
| Specimen Viability Post-Imaging | High; suitable for subsequent histological or molecular assays [26] | None; specimens are non-viable [26] |
| Key Equipment | Confocal or standard fluorescent microscope [26] | Specialized SEM with vacuum chamber [61] |
| Relative Cost | Relatively inexpensive [26] | Expensive [26] |
| Ideal Application | Documenting overall morphology of embryos and organs; correlative studies [26] | Ultra-high-resolution surface topography of cellular and sub-cellular structures [61] |
| Limitations | Unsuitable for a-cellular structures (e.g., cilia, filopodia) [26] | Potential for morphological artifacts from processing [26] |
Table 2: Nuclear Stain Options for Pseudo-SEM Imaging
| Nuclear Stain / Dye | Compatible Microscopy Systems |
|---|---|
| DAPI / Hoechst | Conventional fluorescent microscope with UV filter; Confocal with 405 nm laser [26] |
| Red Dot 1 (Biotium) | Confocal microscope with 647 nm laser (optimal) [26] |
| Draq5 (Biostatus) | Confocal microscope with 488, 514, 568, or 633 nm lasers [26] |
Experimental Protocols
Protocol A: Whole-Mount Nuclear Staining and Pseudo-SEM Imaging
This protocol is optimized for an intact E9.0 mouse embryo stained with DAPI and imaged on an upright confocal microscope [26]. It can be performed after standard immunofluorescence procedures [62].
Reagents and Materials
- Isolated embryos in Phosphate Buffered Saline (PBS)
- Cell-permeant nuclear dye (e.g., DAPI, Hoechst, Red Dot 1)
- 4% Paraformaldehyde (PFA) in PBS
- 0.1% Triton X-100 in PBS
- Physiological buffer (e.g., PBS)
- Blocking serum (e.g., Normal Goat Serum)
- Bovine Serum Albumin (BSA)
- Confocal or conventional fluorescent microscope
Step-by-Step Procedure
- Specimen Isolation and Fixation: Dissect embryos in PBS. Remove decidua, yolk sac, and amnion. Rinse in PBS to eliminate debris. Fix specimens with 4% PFA [26]. If performing after immunofluorescence, use the already fixed and stained specimens [62].
- Permeabilization and Blocking: Permeabilize embryos with 0.1% Triton X-100 in PBS for 30 minutes. Incubate with a blocking solution (e.g., 10% goat serum) for 1 hour to reduce non-specific binding [62].
- Nuclear Staining: Incubate embryos with a cell-permeant nuclear dye (e.g., DAPI at 1:1000 dilution [62]) in PBS for 20 minutes at room temperature, protected from light.
- Washing: Wash the stained embryos three times in PBS to remove excess, unbound dye.
- Mounting for Microscopy: Mount the embryo in physiological buffer (e.g., PBS) for imaging. Do not use clearing agents if an SEM-like appearance is desired, as uncleared specimens produce the most similar images [26].
- Confocal Microscopy Imaging:
- Use a 10x objective or lower power (e.g., 5x) for larger specimens.
- Define the Z-stack parameters to ensure the top and bottom optical slices capture the full extent of nuclear staining to avoid cropping the specimen.
- Set the distance between optical sections to ensure sufficient overlap. Insufficient overlap can result in a final image with an uneven, layered appearance [26].
- Collect the Z-stack and generate a 2D maximum intensity projection image. This projection reveals the morphological details with exceptional clarity and contrast, creating the "Pseudo-SEM" effect [26].
Protocol B: Traditional SEM for Embryonic Tissues
This protocol outlines the standard preparation of biological tissues, such as embryonic samples, for imaging with a Variable Pressure-SEM (VP-SEM) [61].
Reagents and Materials
- Primary fixative (e.g., Glutaraldehyde)
- Secondary fixative (e.g., Osmium Tetroxide)
- Ethanol or acetone for dehydration
- Critical point dryer
- Sputter coater (for high-vacuum SEM)
- VP-SEM or tabletop SEM
Step-by-Step Procedure
- Primary Fixation: Fix the embryo or tissue in a buffered aldehyde solution (e.g., 2.5% glutaraldehyde) for several hours to preserve ultrastructure.
- Secondary Fixation: Post-fix with 1% Osmium Tetroxide for 1-2 hours to stabilize lipids and enhance conductivity.
- Dehydration: Dehydrate the specimen through a graded series of ethanol or acetone (e.g., 30%, 50%, 70%, 90%, 100%) to remove all water.
- Critical Point Drying: Transition the specimen to a critical point dryer using a transition fluid (e.g., liquid CO2). This process prevents the collapse of delicate structures that occurs with air drying.
- Mounting and Coating: Mount the dried specimen on an SEM stub using conductive adhesive. For high-vacuum SEM, coat the specimen with a thin layer of conductive metal (e.g., gold, platinum) using a sputter coater to prevent charging artefacts. For VP-SEM, coating may be omitted [61].
- SEM Imaging:
- For cell outline imaging with a VP-SEM, use the Backscattered Electron (BSE) detector.
- Optimize parameters: an accelerating voltage of 20 kV and a chamber pressure of 10 Pa often yield high-contrast images of cell walls in uncoated tissues [61].
- Adjust the working distance and spot size to maximize the signal-to-noise ratio.
Visualizing the Workflow and Connectivity
The following diagram illustrates the decision-making workflow and procedural steps for selecting and executing the appropriate imaging technique within a correlative study, beginning after initial immunofluorescence analysis.
Diagram 1: Imaging workflow from immunofluorescence to final output.
The Scientist's Toolkit: Essential Research Reagents
This table catalogs key reagents and materials essential for successfully implementing the Pseudo-SEM protocol following immunofluorescence studies.
Table 3: Research Reagent Solutions for Pseudo-SEM
| Reagent / Material | Function / Application | Example Usage |
|---|---|---|
| Cell-Permeant Nuclear Dyes (e.g., DAPI, Hoechst, Red Dot 1, Draq5) | Fluorescently label nuclear DNA in whole-mount specimens to reveal cellular topology [26]. | DAPI used at 1:1000 dilution for 20 min after immunofluorescence staining [62]. |
| Permeabilization Agent (e.g., Triton X-100) | Creates pores in cell membranes to allow penetration of dyes and antibodies into the specimen [62]. | 0.1% Triton X-100 in PBS for 30 min after fixation. |
| Blocking Serum (e.g., Normal Goat Serum) | Reduces non-specific binding of antibodies and dyes to the specimen, lowering background noise [62]. | Incubation with 10% serum for 1 hour before application of primary antibody or dye. |
| Mounting Medium | Preserves the specimen under a coverslip for microscopy. Can be aqueous or hardening [63]. | A drop of mounting medium is used to secure the specimen on a microscope slide post-staining [63]. |
| Alvetex Scaffold | A porous polystyrene scaffold for 3D cell culture that is compatible with confocal microscopy and produces low autofluorescence [63]. | Growing and imaging complex 3D culture models that more accurately mimic in vivo conditions. |
Live-cell imaging has revolutionized developmental biology by providing direct observation of dynamic processes such as cell division and lineage progression with high spatiotemporal resolution. This approach captures biological complexity from molecular to organismal scales, revealing dynamic behaviors, spatial patterns, and regulatory changes fundamental to understanding development [64]. When investigating cell division and lineage specification, researchers can decode how individual stem cells differentiate and modulate their behavior in response to their local microenvironment, ultimately leading to tissue formation and organogenesis [65].
A significant technical challenge in these studies is mounting specimens effectively for long-term imaging while maintaining viability and developmental competence. This application note details standardized protocols for mounting embryos and organoids for confocal microscopy, with specific applications for tracking cell division and lineage commitment. We present optimized mounting techniques, quantitative imaging parameters, and specialized reagent solutions that enable researchers to capture complete genealogies and molecular signatures during development and regeneration.
Technical Approaches and Mounting Methodologies
3D-Printed Stamp Mounting for High-Content Imaging
For high-content screening of multiple embryos, a standardized mounting method using a 3D-printed stamp significantly improves imaging efficiency and data quality. This approach creates a two-dimensional coordinate system of micro-wells (μ-wells) in an agarose cast that models the negative of average zebrafish embryo morphology between 22 and 96 hours post-fertilization [35].
Protocol Steps:
- Stamp Preparation: Design and 3D-print a stamp containing 44 equally spaced μ-wells arranged in rows and columns. The stamp creates imprints with a diameter of 20mm on the cover glass of a 35mm μ-dish.
- Agarose Cast Preparation: Pour 1% agarose into the dish and use the stamp to create μ-wells before the agarose fully solidifies. Carefully detach the stamp to avoid air inclusions between the cover glass and agarose.
- Specimen Mounting: Embed embryos in 0.3% low-melting-point agarose (LMPA) and carefully position each embryo in a individual μ-well. The slow polymerization of LMPA provides extended time for precise orientation.
- Sealing: Apply 0.5% LMPA carefully over the embryos embedded in 0.3% LMPA to secure them without displacing the specimens.
- Imaging: Utilize the predefined coordinate system for semi-automated imaging on inverted confocal microscopes.
This method standardizes embryo positioning in X, Y, and Z orientations, enabling simultaneous imaging of up to 44 embryos with consistent alignment of specific organs such as the posterior lateral line primordium, eye, and otic vesicle [35]. The standardized arrangement reduces post-processing time and improves comparability of volumetric data while minimizing light exposure and improving signal-to-noise ratio.
Long-Term Immobilization for Regeneration Studies
For long-term imaging of regeneration processes lasting up to 10 days, specialized immobilization techniques are required. Research on the crustacean Parhyale hawaiensis has demonstrated an effective method for continuous live imaging of regenerating legs at cellular resolution [66] [67].
Protocol Steps:
- Animal Preparation: Use transgenic animals expressing histone-bound fluorescent proteins (e.g., H2B-mRFPruby) under a heat-shock promoter. Apply heat shock (45min at 37°C) 12-18 hours before amputation to induce fluorescence.
- Immobilization: Fix the chitinous exoskeleton of the amputated leg onto a microscope coverslip using surgical glue. The transparent cuticle acts as both a straitjacket to immobilize the leg and a window for visualization.
- Imaging Parameters: Set confocal microscopy with 20x objective (e.g., Zeiss Plan-Apochromat 20x/0.8), pixel size of 0.31×0.31μm, z-step of 2.48μm, and time interval of 20 minutes between stacks.
- Photodamage Control: Use lowest laser power setting with scanning speed of 2.06μs per pixel and image averaging (2 frames). Maintain fluorescence with occasional heat shocks using the microscope's temperature-controlled stage.
- Post-Processing: Correct for slight image displacement caused by temperature changes during heat shock.
This immobilization approach enables continuous imaging throughout the 5-10 day regeneration process without anesthesia, capturing wound closure, cell proliferation, and morphogenesis at single-cell resolution [66] [67].
Whole-Mount Imaging for 3D Organoid Analysis
For multilayered organoids and gastruloids, which can reach diameters of 300-500μm, a specialized whole-mount imaging pipeline enables deep-tissue visualization at cellular resolution [65].
Protocol Steps:
- Sample Clearing: Immunostain organoids and clear using 80% glycerol as a refractive index matching mounting medium, which provides superior performance compared to PBS, gold antifade, or optiprep mediums.
- Dual-View Mounting: Mount cleared organoids between two glass coverslips using spacers of defined thickness (250-500μm) adapted to organoid size without compression.
- Two-Photon Imaging: Perform sequential opposite-view multi-channel imaging using a commercial two-photon microscope to overcome light scattering in dense tissues.
- Computational Processing: Apply spectral unmixing to remove signal cross-talk, perform dual-view registration and fusion for in toto reconstruction, and segment individual cell nuclei.
This pipeline facilitates 3D quantification of gene expression patterns, nuclear morphology, and tissue-scale organization in developing organoids, capturing the relationship between cell fate and local tissue architecture [65].
Quantitative Imaging Parameters
Table 1: Optimized Imaging Parameters for Different Live-Cell Applications
| Application | Microscope Type | Objective | Spatial Resolution | Temporal Resolution | Duration | Key Optimization |
|---|---|---|---|---|---|---|
| Zebrafish embryogenesis [35] | Confocal | 10x-40x | Pixel: 0.31-0.5μmZ-step: 2-5μm | 5-10 min intervals | Up to 20+ hours | Standardized μ-wells, LMPA embedding |
| Leg regeneration [66] [67] | Confocal | 20x/0.8 | Pixel: 0.31×0.31μmZ-step: 2.48μm | 20 min intervals | 5-10 days | Surgical glue immobilization, minimal laser power |
| Organoid development [65] | Two-photon | 20x-40x | Varies with depth | N/A (fixed samples) | N/A | 80% glycerol clearing, dual-view fusion |
| Cell cycle & fate [68] | Live-cell imaging | 20x-63x | Varies with assay | 5-15 min intervals | 24-72 hours | Biosensors, environmental control |
Table 2: Comparison of Microscopy Modalities for Lineage Tracing
| Parameter | Confocal Microscopy | Light-Sheet Microscopy | Two-Photon Microscopy | Epifluorescence |
|---|---|---|---|---|
| Resolution | High XYZ resolution | High, but may vary with depth | Excellent deep tissue penetration | Limited axial resolution |
| Phototoxicity | Moderate | Low | Low for deep imaging | High with prolonged exposure |
| Imaging Depth | Moderate (~100μm) | Good for transparent samples | Excellent (200+ μm) | Shallow |
| Speed | Moderate | Fast | Moderate | Fast |
| Sample Compatibility | Fixed and live | Mostly transparent samples | Large, dense organoids | Thin samples |
| Best Applications | Cellular tracking, division events | Long-term live imaging, rapid development | Large organoids, gastruloids | Screening, endpoint analysis |
Research Reagent Solutions
Table 3: Essential Research Reagents for Live-Cell Lineage Tracing
| Reagent / Tool | Function | Application Examples |
|---|---|---|
| H2B-mRFPruby [66] [67] | Histone-bound fluorescent protein for nuclear labeling | Tracking cell divisions and migrations in Parhyale leg regeneration |
| Brainbow/Confetti reporters [69] | Multicolor fluorescent reporters for clonal analysis | Intravital imaging to trace macrophage origin and proliferation; distinguishing clonal populations |
| Cre-loxP & Dre-rox systems [69] | Site-specific recombinase systems for genetic labeling | Sparse labeling for clonal analysis; lineage restriction studies |
| Low-melting-point agarose (LMPA) [35] | Embedding medium for specimen mounting | Zebrafish embryo immobilization for long-term imaging |
| 80% Glycerol [65] | Refractive index matching mounting medium | Clearing agent for deep imaging of organoids and gastruloids |
| Cell cycle biosensors [68] | Fluorescent reporters of cell cycle phase | Live imaging of cell cycle remodeling during stem cell differentiation |
Visualization of Experimental Workflows
Workflow for Lineage Tracing Experiments
Cell Division and Lineage Commitment Pathways
Applications in Developmental Biology
Decoding Cell Lineage Hierarchies
Live-cell imaging of cell division and lineage progression enables researchers to establish hierarchical relationships between cells during development. Modern lineage tracing studies incorporate advanced microscopy, state-of-the-art sequencing technologies, and multiple biological models to validate hypotheses through multiple methods [69]. The resolution and methodological approach define the limits of analysis, balancing specificity and generalizability.
Advanced genetic tools enable sophisticated lineage tracing:
- Dual recombinase systems (Cre-loxP/Dre-rox) allow complex genetic targeting to distinguish contributions of multiple cell populations simultaneously [69].
- Multicolor reporters (Brainbow, Confetti) enable clonal analysis at single-cell resolution through stochastic expression of different fluorescent proteins [69].
- Mosaic analysis techniques permit tracking of individually labeled cells within tissues to follow their progeny over time.
Integrating Cell Cycle and Fate Decisions
The interplay between cell cycle regulation and fate specification represents a crucial frontier in developmental biology. Embryonic and somatic cell cycles differ significantly - embryonic divisions are clocklike, fast, and synchronous with no checkpoints, while somatic cycles have checkpoint control and long gap phases [68]. Understanding how the same core cell cycle regulators self-organize to drive these different division cycles provides fundamental insights into development and disease.
Live-cell imaging of embryonic stem cells expressing cell cycle and fate biosensors reveals how cell division patterns bias cell fate decisions in early development [68]. These studies have profound implications for understanding normal development, reprogramming, and disease states like cancer, where both cell identity and cell cycle regulation are disrupted.
Live-cell imaging for tracking cell division and lineage specification provides powerful insights into developmental processes from embryonic development to organogenesis. The mounting protocols and imaging parameters detailed in this application note enable researchers to capture dynamic cellular behaviors over relevant timescales while maintaining specimen viability. Standardized mounting approaches, such as 3D-printed stamp methods for embryos and immobilization techniques for regeneration studies, significantly enhance data quality, reproducibility, and throughput.
As imaging technologies continue to advance, combining these approaches with cell cycle biosensors, multicolor lineage tracing tools, and computational analysis pipelines will further decode the complex relationship between cell division patterns and fate decisions. These integrated approaches promise to advance our understanding of both normal development and disease pathogenesis, ultimately contributing to improved regenerative medicine strategies and therapeutic interventions.
Integrating RNA FISH with Protein Immunofluorescence in Whole Mounts
The simultaneous detection of ribonucleic acid (RNA) and protein within intact biological specimens provides a powerful means to understand gene expression regulation and protein function in their native spatial context. While single-molecule RNA fluorescence in situ hybridization (smFISH) enables the precise localization and quantification of individual messenger RNA (mRNA) molecules, and immunofluorescence (IF) allows for protein visualization, combining these techniques in whole-mount tissues presents significant technical challenges. These challenges include high tissue autofluorescence, probe penetration barriers in intact samples, and protocol incompatibility [70]. This application note details a robust, optimized protocol for integrating smFISH with protein immunofluorescence in whole-mount embryos and tissues, framed within the context of mounting specimens for confocal microscopy after immunofluorescence research. This methodology enables researchers to obtain absolute quantitative data on both mRNA copy number and protein abundance at single-cell and subcellular resolution, directly within the three-dimensional architecture of the sample [70] [71].
Technical Comparison of Integrated Detection Methods
The table below summarizes key methodological approaches for combining RNA and protein detection, highlighting their primary applications and performance characteristics.
Table 1: Comparison of Integrated RNA-Protein Detection Techniques
| Method Name | Key Technical Features | Recommended Application Context | Reported Performance |
|---|---|---|---|
| Whole-mount smFISH + IF [70] | Uses hydrogel embedding, ClearSee-based tissue clearing, and RNase-free immunofluorescence. | Whole-mount plant and animal tissues; requires subcellular resolution and mRNA quantification. | Enabled precise mRNA and protein co-quantification in Arabidopsis roots, shoot apical meristems, and ovules. |
| Immunofluorescence-combined smRNA FISH [71] | RNase-free modification of IF protocol followed by smFISH; GFP-compatible. | Cultured single cells; analysis of direct RNA-protein interactions and cell heterogeneity. | Successfully demonstrated direct interaction of RNase MCPIP1 with IL-6 mRNA in single cells. |
| smiFISH & Immunofluorescence [72] | Employs cost-effective smiFISH probes with flap sequences; immunofluorescence performed after smiFISH. | Arthropod embryos and tissues; high-throughput, multi-gene expression studies. | Achieved simultaneous detection of 8 Hox genes at single-molecule resolution in Drosophila embryos, combined with membrane protein IF. |
Experimental Protocol: Whole-Mount smFISH and Immunofluorescence
This protocol is adapted from established methods for plant and animal tissues [70] [72] and is designed to preserve RNA integrity, protein antigenicity, and tissue morphology.
Reagent and Solution Setup
- smFISH Probes: Design a minimum of 48 twenty-mer oligonucleotide probes per target mRNA using dedicated software (e.g., Stellaris Probe Designer). Probes should be labeled with fluorophores such as Quasar 570 or Quasar 670 [73] [70]. For cost-effective multi-gene experiments, consider single-molecule inexpensive FISH (smiFISH) with flap-labeled probes [72].
- Hybridization Buffer: A standard buffer contains deionized formamide, SSC, and dextran sulfate. The specific formamide concentration can be optimized for probe stringency.
- Wash Buffers: Prepare buffers containing SSC and Triton X-100 to remove unbound probes while maintaining tissue integrity.
- Blocking Solution for IF: Use a solution containing RNase-free BSA or serum to block non-specific binding prior to antibody incubation.
- Mounting Medium: Use an anti-fade mounting medium compatible with your fluorophores. ProLong Gold Antifade Mountant with DAPI is a suitable option for preserving fluorescence and staining nuclei [73].
Integrated Step-by-Step Procedure
The following workflow integrates the key steps for successful combined detection. A corresponding diagram is provided for visual guidance.
Figure 1. Experimental workflow for integrating whole-mount smFISH with immunofluorescence. The process begins with tissue preparation, followed sequentially by immunofluorescence and then smFISH, concluding with mounting for microscopy.
Sample Fixation and Permeabilization
- Fix tissues promptly with 4% Paraformaldehyde (PFA) to preserve morphology and immobilize nucleic acids and proteins.
- Permeabilize fixed tissues using a suitable detergent (e.g., Triton X-100) or, for plant tissues, with enzymatic digestion (e.g., lyticase for yeast [73]). Optimization is critical to balance probe/antibody access with tissue preservation.
Immunofluorescence (IF) Staining
- Blocking: Incubate tissues in an RNase-free blocking solution for 1-2 hours at room temperature to minimize non-specific antibody binding.
- Primary Antibody: Apply the primary antibody diluted in blocking solution. Incubate overnight at 4°C.
- Secondary Antibody: After thorough washing, apply the fluorophore-conjugated secondary antibody (RNase-free) for 2-4 hours at room temperature, protected from light.
- Post-IF Fixation: Perform a mild fixation step (e.g., with 2-4% PFA for 30-60 minutes) after IF to cross-link the antibodies and prevent their dissociation or degradation during subsequent smFISH procedures [71] [72].
Single-Molecule FISH (smFISH)
- Hybridization: Apply the FISH probe set diluted in hybridization buffer to the tissue. Incubate in a dark, humidified chamber at 37°C overnight [73] [70].
- Stringency Washes: The next day, perform a series of stringent washes to remove unbound and non-specifically bound probes. A typical wash involves SSC buffer with formamide.
Tissue Clearing (Optional but Recommended)
- For tissues with high autofluorescence (e.g., plants), a clearing step can dramatically improve the signal-to-noise ratio. Incubate samples in ClearSee solution or a similar clearing agent for several days to reduce background [70].
Mounting for Confocal Microscopy
- Mount the stained and cleared tissues on glass slides using an anti-fade mounting medium.
- Gently press the coverslip to ensure the sample is flat, and seal the edges with nail polish or a commercial sealant to prevent drying and movement during imaging.
The Scientist's Toolkit: Essential Research Reagents
Successful implementation of this integrated protocol relies on a set of key reagents and tools, as summarized below.
Table 2: Key Research Reagent Solutions for Integrated RNA-Protein Detection
| Reagent / Tool | Function / Purpose | Example Products / Notes |
|---|---|---|
| smFISH Probe Sets | Target-specific detection and visualization of individual mRNA molecules. | Stellaris RNA FISH Probes (Biosearch Technologies); smiFISH probes for cost-effective multi-gene studies [73] [72]. |
| Tissue Clearing Agent | Reduces light scattering and autofluorescence in thick samples. | ClearSee [70]; enables imaging of deeper structures in plant and animal tissues. |
| RNase-Free Antibodies | Specific detection of target proteins without degrading RNA signals. | Ensure secondary antibodies are certified RNase-free. |
| Cell Segmentation Marker | Defines cellular boundaries for single-cell quantification. | Antibodies against membrane proteins (e.g., alpha-Spectrin [72]) or cell wall stains (e.g., Renaissance 2200 for plants [70]). |
| Automated Image Analysis Software | Automated, unbiased quantification of single-molecule spots and protein intensity in 3D. | TrueSpot (for 3D spot detection [74]), FISH-quant, CellProfiler [70]. |
Image Acquisition, Analysis, and Data Quantification
Confocal Imaging
Acquire high-resolution z-stacks using a confocal microscope with a laser line or white light laser capable of exciting all fluorophores used. Use sequential scanning to minimize bleed-through between channels. For multi-gene smFISH (up to 8 genes), spectral unmixing may be necessary to separate signals with overlapping emission spectra [72].
Computational Analysis Workflow
The quantification of single-molecule data requires a robust computational pipeline, as illustrated below.
Figure 2. Computational workflow for single-cell RNA and protein quantification. The pipeline processes raw 3D image stacks through pre-processing, parallel cell segmentation and spot detection, and final data integration to produce a quantitative single-cell data table.
- Cell Segmentation: Use the cell boundary signal (from IF or cell wall stain) to segment individual cells in 3D. Tools like Cellpose are highly effective for this task [70].
- RNA Spot Detection: Identify and count individual mRNA molecules within the segmented cells. Tools like TrueSpot, which uses an automated 3D spot detection algorithm and an adaptive threshold selection module, are robust for this purpose and outperform many 2D-based algorithms [74].
- Protein Signal Quantification: Measure the mean or integrated fluorescence intensity of the protein signal within each segmented cell.
- Data Integration and Visualization: Combine the RNA count and protein intensity data with spatial coordinates for each cell. Generate spatial heatmaps to visualize expression patterns and correlations across the tissue [70].
The integration of whole-mount smFISH with immunofluorescence provides an unparalleled quantitative view of gene expression at the single-cell level within the native tissue environment. The protocols and tools detailed herein address the primary technical hurdles, enabling researchers to move beyond qualitative assessment to absolute quantification of RNA and protein. This powerful approach is poised to reveal new insights into cell-to-cell heterogeneity, transcriptional dynamics, and post-transcriptional regulation in developmental biology, disease research, and drug development.
The intricate processes of embryonic development are orchestrated by complex intracellular dynamics, where the cytoskeleton and accurate chromosome segregation play pivotal roles. Cytoskeletal components, including actin filaments and microtubules, generate mechanical forces, determine cellular architecture, and facilitate key events like cell migration and division [75] [76]. Simultaneously, mitotic errors during chromosome segregation can lead to aneuploidy and mosaicism, which are significant causes of miscarriage and infertility [22]. Understanding these fundamental processes requires imaging techniques that preserve three-dimensional embryonic architecture while providing high-resolution spatial and temporal data.
This application note details a comprehensive methodology for investigating cytoskeletal organization and mitotic dynamics within intact embryos. We focus on optimizing whole-mount immunofluorescence and advanced live-imaging techniques to visualize these critical structures and events. The protocols are framed within the context of preparing embryos for high-resolution confocal microscopy, enabling researchers to capture quantitative data on cytoskeletal architecture and chromosome behavior in their native three-dimensional context.
Background and Significance
The Cytoskeleton in Embryonic Development
The actin cytoskeleton assembles into diverse higher-order structures—bundles, meshes, and networks—each fulfilling specific functional roles [76]. For instance, in motile cells, lamellipodia composed of branched actin networks drive membrane protrusion, while contractile stress fibers facilitate cell adhesion and morphogenesis. The ability to quantify the abundance, orientation, and organization of these structures provides vital information about the physiological state of a cell and can reveal alterations associated with disease states [76].
Microtubules, another key cytoskeletal component, undergo sophisticated rearrangements to direct essential processes such as intracellular transport and cell migration. Recent studies suggest distinct polarization patterns of microtubule remodeling are associated with different migration modes, including a front-rear polarization for directed migration and a contact site-centered polarization during immune responses [75].
Mitotic Errors in Preimplantation Embryos
Chromosomal errors are a leading cause of developmental failure. Live imaging studies of late-stage human preimplantation embryos have revealed that de novo mitotic errors occur immediately before implantation [22]. These errors include:
- Multipolar spindle formation
- Lagging chromosomes during anaphase
- Chromosome misalignment
- Mitotic slippage
Notably, most lagging chromosomes are passively inherited rather than reincorporated into the main nucleus, potentially leading to mosaic aneuploidy [22]. This mosaicism is particularly critical in a clinical context, as it raises important questions regarding the uses of preimplantation genetic testing for aneuploidy (PGT-A) [22].
Materials and Methods
Whole-Mount Immunofluorescence Protocol for Embryos
This protocol is optimized for preserving the 3D architecture of embryos while enabling effective antibody penetration for cytoskeletal and nuclear labeling [33] [25].
- Table 1: Key Reagent Solutions for Whole-Mount Immunofluorescence
Reagent Solution Composition Function Fixative Solution 4% Paraformaldehyde (PFA) in PBS Preserves cellular structure and antigenicity by cross-linking proteins. Permeabilization Buffer PBS with 0.5-1.0% Triton X-100 Disrupts membranes to allow antibody penetration into the embryo. Blocking Buffer PBS, 1% Triton X-100, 10% Fetal Calf Serum (FCS), 0.2% Sodium Azide Reduces non-specific antibody binding. Primary Antibody Diluent Blocking buffer Diluent for specific antibodies (e.g., anti-actin, anti-tubulin). Secondary Antibody Diluent Blocking buffer Diluent for fluorescently-conjugated secondary antibodies. Mounting Medium 75% Glycerol in PBS Preserves fluorescence and provides a medium for microscopy.
3.1.1 Sample Preparation and Fixation
- Dissection: Carefully isolate embryos and place them in a bijou or microcentrifuge tube. For larger embryos (e.g., mouse embryos beyond E12), dissection into smaller segments may be necessary for adequate reagent penetration [25].
- Fixation: Immerse embryos in 4-5 mL of 4% PFA. Fixation time requires optimization; begin with 2 hours at 4°C or overnight at 4°C for smaller embryos. Note: Methanol can be used as an alternative fixative if PFA masks the target epitope, as antigen retrieval via heat is not feasible for whole embryos [25].
3.1.2 Permeabilization and Blocking
- Washing: Wash the fixed embryos 3 times for 30 minutes each with PBS containing 0.5-1% Triton X-100 (PBS-T) to remove the fixative.
- Blocking: Incubate embryos twice for 1 hour each in Blocking Buffer at room temperature with gentle agitation.
3.1.3 Antibody Staining
- Primary Antibody Incubation: Transfer embryos using a cut-off Pasteur pipette to a tube containing the primary antibody diluted in Blocking Buffer. Incubate for 1-4 days on a gentle rotation device at 4°C [33].
- Washing: Perform extensive washing to remove unbound antibody:
- Wash 3 times for 1 hour in PBS-T with 10% FCS.
- Wash 3 times for 10 minutes in PBS-T.
- Secondary Antibody Incubation: Incubate with fluorophore-conjugated secondary antibodies diluted in Blocking Buffer for 2-4 days with gentle rotation at 4°C [33].
- Final Washes: Wash 3 times for 10 minutes in PBS-T.
3.1.4 Mounting for Confocal Microscopy
- Equilibration: Equilibrate the stained embryo in a series of glycerol solutions (50%, 75%) until the embryo sinks, indicating full perfusion.
- Mounting: Mount the embryo in 75% glycerol on a microscope slide. Use grease around the edges to seal the coverslip [33]. The sample is now ready for imaging.
Diagram 1: Whole-mount immunofluorescence workflow for embryo staining.
Live Imaging of Cytoskeletal and Mitotic Dynamics
For visualizing dynamic processes, live-cell imaging is essential. The following method is adapted from studies of mitotic errors in human blastocysts [22].
3.2.1 Nuclear DNA Labeling via mRNA Electroporation Microinjection is often unsuitable for blastocyst-stage embryos. Instead, mRNA electroporation provides an effective labeling alternative:
- mRNA Preparation: Prepare H2B fused to a fluorescent protein (e.g., H2B-mCherry) mRNA at a concentration of 700-800 ng/µL.
- Electroporation: Introduce mRNA into blastocyst-stage embryos using optimized electroporation parameters. This method achieves an efficiency of approximately 41% in human embryos without significantly impacting development or lineage specification [22].
3.2.2 Live Imaging by Light-Sheet Microscopy Confocal microscopy can be prohibitive for long-term imaging due to phototoxicity. Light-sheet fluorescence microscopy offers a superior alternative.
- Microscope Setup: Use a light-sheet microscope with dual illumination and detection (e.g., an LS2 system) to minimize light exposure and enable long-term imaging [22].
- Image Acquisition: Culture electroporated embryos under controlled conditions and image for up to 48 hours. This allows tracking of mitotic phases (prophase, metaphase, anaphase, telophase) and identification of segregation errors like lagging chromosomes and multipolar divisions [22].
Quantitative Analysis of Cytoskeletal Organization
Quantifying cytoskeletal organization from acquired images provides objective metrics for assessing cellular states. The following table summarizes key parameters and methods.
- Table 2: Quantitative Metrics for Cytoskeletal Analysis from Optical Microscopy
Analyzed Structure Quantitative Metric Analysis Method / Algorithm Biological Significance Actin Networks (e.g., in lamellipodia) Filament Orientation Machine Learning (e.g., Cyto-LOVE [77]) Reveals branching mechanisms (e.g., ±35° orientation consistent with Arp2/3 complex activity [77]). Microtubule Networks Alignment & Dynamic Rearrangement Architecture-Driven Quantitative (ADQ) Framework, Order Index (OI) [75] Maps dynamic remodeling patterns associated with different cell migration modes. Stress Fibers Fiber Length, Width, Orientation, Abundance Stress Fiber Extractor (SFEX) [76], FSegment [76] Indicates cell contractility, adhesion, and mechanosensing; density correlates with cell spreading ability. Ventral Stress Fibers & Focal Adhesions Number of fibers per focal adhesion, Focal Adhesion Density SFALab Algorithm [76] Assesses force transmission to the extracellular matrix; adhesion density relates to cellular tension.
Diagram 2: Computational workflow for quantitative cytoskeleton analysis.
Application Notes and Discussion
Expected Results and Data Interpretation
Cytoskeletal Organization: Applying the Cyto-LOVE machine learning method to high-speed AFM or super-resolution images is expected to reconstruct F-actin networks at the individual filament level. Researchers should observe specific orientation patterns, such as F-actins at ±35° in lamellipodia, consistent with Arp2/3 complex-induced branching, and potentially novel, non-random orientations at four specific angles in the cell cortex [77]. The ADQ framework for microtubules should reveal distinct remodeling heat maps, showing front-rear polarization in directed migration [75].
Mitotic Dynamics: Live imaging of blastocyst-stage embryos should successfully capture de novo mitotic errors. Key observations will include multipolar divisions, lagging chromosomes, and mitotic slippage [22]. Tracking these events will allow for the quantification of error rates and the fate of mis-segregated chromosomes (e.g., passive inheritance into micronuclei versus reincorporation). Furthermore, significant differences in interphase duration between species (approximately 18 hours in human vs. 11 hours in mouse blastocysts) can be quantified, suggesting this as a key factor in developmental pacing [22].
Troubleshooting and Technical Considerations
- Poor Antibody Penetration: For larger embryos, this is a common issue. Ensure adequate permeabilization with Triton X-100 and consider dissecting the embryo into smaller segments. Extend incubation times for antibodies and washes accordingly [25].
- High Background Signal: This often results from insufficient blocking or washing. Increase the number and duration of washes after antibody incubations. Ensure the blocking serum is compatible with the secondary antibody.
- Fixation-Induced Epitope Masking: If staining is weak with 4% PFA, test alternative fixatives like methanol, as antigen retrieval is not an option for whole-mount embryos [25].
- Phototoxicity in Live Imaging: When using confocal microscopy, minimize laser power and scan speed. For extended live imaging (>24h), light-sheet microscopy is strongly recommended to reduce photodamage and ensure embryo viability [22].
This application note provides a validated framework for studying the intricate dynamics of the cytoskeleton and mitotic processes in intact embryos. By integrating optimized protocols for whole-mount immunofluorescence and low-phototoxicity live imaging with advanced computational analysis tools, researchers can obtain quantitative, high-resolution data crucial for understanding fundamental developmental biology and the aetiology of diseases like infertility. The methodologies outlined herein, from sample preparation through to quantitative analysis, provide a robust pipeline for generating reproducible and biologically significant results in the context of embryonic research.
Conclusion
Mastering the techniques of mounting embryos for confocal microscopy is fundamental for advancing developmental biology and biomedical research. A methodical approach that combines rigorous whole-mount immunofluorescence with tailored mounting strategies unlocks the potential for high-fidelity 3D visualization of biological structures and processes. The integration of innovative tools, such as custom 3D-printed mounts and advanced live-imaging labels, alongside robust validation, ensures data reliability. Future directions will be shaped by developments in clearing techniques, multi-modal imaging, and the application of these methods to increasingly complex questions in disease modeling and regenerative medicine, solidifying their critical role in both basic science and clinical translation.
References
- 1. Confocal Microscopy: Principles and Modern Practices - PMC [https://pmc.ncbi.nlm.nih.gov/articles/PMC6961134/]
- 2. Introduction to Confocal Microscopy [https://evidentscientific.com/en/microscope-resource/knowledge-hub/techniques/confocal/confocalintro]
- 3. A whole- mount for three-dimensional... immunofluorescence protocol [https://pubmed.ncbi.nlm.nih.gov/23649699/]
- 4. IHC staining protocol for whole mount samples | Abcam [https://www.abcam.cn/technical-resources/protocols/wholemount-staining-for-ihc]
- 5. Imaging Immunolabeled Drosophila Embryos by Confocal Microscopy [https://link.springer.com/protocol/10.1385/1-59259-722-x:167]
- 6. Three-dimensional reconstructions from optical sections of ... [https://pmc.ncbi.nlm.nih.gov/articles/PMC3625616/]
- 7. Optical sectioning methods in three-dimensional bioimaging [https://www.nature.com/articles/s41377-024-01677-x]
- 8. Optical Sectioning and Confocal Microscopy [https://www.ibiology.org/talks/confocal-microscopy/]
- 9. Report Fast reconstruction and optical-sectioning three ... [https://www.sciencedirect.com/science/article/pii/S2666675824001954]
- 10. A Layered Mounting Method for Extended Time-Lapse ... [https://pmc.ncbi.nlm.nih.gov/articles/PMC8411746/]
- 11. Specimen Preparation and Imaging - Confocal [https://www.microscopyu.com/techniques/confocal/specimen-preparation-and-imaging]
- 12. Introduction to Sample Preparation: Immunofluorescence [https://microscopy.duke.edu/guides/intro-sample-prep-immunofluorescence]
- 13. Learn how to Remove Autofluorescence from your ... [https://www.leica-microsystems.com/science-lab/life-science/learn-how-to-remove-autofluorescence-from-your-confocal-images/]
- 14. Any Way You Slice It—A Comparison of Confocal ... [https://pmc.ncbi.nlm.nih.gov/articles/PMC4365987/]
- 15. Confocal Microscopy vs. Fluorescence ... [https://www.labmanager.com/confocal-microscopy-vs-fluorescence-microscopy-a-detailed-comparison-33660]
- 16. Comparing Confocal and Widefield Fluorescence Microscopy [https://evidentscientific.com/en/microscope-resource/tutorials/confocalvswidefield]
- 17. Optimizing immunofluorescence with high-dynamic-range ... [https://www.nature.com/articles/s41598-024-65187-x]
- 18. What is the difference between confocal and fluorescence ... [https://synapse.patsnap.com/article/what-is-the-difference-between-confocal-and-fluorescence-microscopy]
- 19. Single Molecule Fluorescence In Situ Hybridization Using ... [https://en.bio-protocol.org/en/bpdetail?id=5269&type=0]
- 20. Preservation of Fluorescence Signal and Imaging ... [https://www.frontiersin.org/journals/cell-and-developmental-biology/articles/10.3389/fcell.2021.737621/full]
- 21. Protocol for tissue expansion microscopy for ultrastructure ... [https://pmc.ncbi.nlm.nih.gov/articles/PMC12305189/]
- 22. Live imaging of late-stage preimplantation human embryos ... [https://www.nature.com/articles/s41587-025-02851-1]
- 23. Effectiveness of fixation methods for wholemount ... [https://pmc.ncbi.nlm.nih.gov/articles/PMC10996528/]
- 24. Flat mount preparation for whole-mount fluorescent imaging of ... [https://pmc.ncbi.nlm.nih.gov/articles/PMC10373579/]
- 25. IHC staining protocol for whole mount samples [https://www.abcam.com/en-us/technical-resources/protocols/wholemount-staining-for-ihc]
- 26. Whole mount nuclear fluorescent imaging [https://pmc.ncbi.nlm.nih.gov/articles/PMC3504639/]
- 27. Quantitative Analysis of Protein Expression to Study ... [https://pmc.ncbi.nlm.nih.gov/articles/PMC4828170/]
- 28. 4.5. Whole-Mount Embryo Immunofluorescence [https://bio-protocol.org/exchange/minidetail?id=8733580&type=30]
- 29. Whole-Mount Confocal Microscopy for Vascular Branching ... [https://pmc.ncbi.nlm.nih.gov/articles/PMC4199634/]
- 30. Whole-Mount - Protocols - Microscopy [https://biotech.unl.edu/whole-mount-protocols-microscopy/]
- 31. Cell Staining with Hoechst or DAPI Nuclear Stains [https://biotium.com/tech-tips-protocols/protocol-staining-cells-with-hoechst-or-dapi-nuclear-stains/]
- 32. Difference Between DAPI and Hoechst [https://www.geeksforgeeks.org/biology/difference-between-dapi-and-hoechst/]
- 33. Whole-Mount Fluorescent IHC Protocol [https://www.creative-bioarray.com/support/whole-mount-fluorescent-ihc-protocol.htm]
- 34. Three-Dimensionally Printed Agarose Micromold Supports ... [https://www.mdpi.com/2306-5354/11/7/719]
- 35. Standardized mounting method of (zebrafish) embryos using a ... [https://bmcbiotechnol.biomedcentral.com/articles/10.1186/s12896-019-0558-y]
- 36. Fabrication of Custom Agarose Wells for Cell Seeding and ... [https://pmc.ncbi.nlm.nih.gov/articles/PMC5933294/]
- 37. Fabrication of Custom Agarose Wells for Cell Seeding and ... [https://www.jove.com/v/56618/fabrication-custom-agarose-wells-for-cell-seeding-tissue-ring-self]
- 38. Generation of orientation tools for automated zebrafish ... [https://bmcbiotechnol.biomedcentral.com/articles/10.1186/1472-6750-14-36]
- 39. A quantitative pipeline for whole-mount deep imaging and ... [https://elifesciences.org/reviewed-preprints/107154]
- 40. Fluorescence Mounting Mounting Media [https://cite.hms.harvard.edu/resources/media/]
- 41. Advances in tissue optical clearing for 3D imaging in large ... [https://pmc.ncbi.nlm.nih.gov/articles/PMC12361029/]
- 42. Immunoelectron microscopy: a comprehensive guide from ... [https://pmc.ncbi.nlm.nih.gov/articles/PMC12420552/]
- 43. Protocol to computationally average confocal images of ... [https://www.sciencedirect.com/science/article/pii/S2666166725000383]
- 44. A robust method for autofluorescence-free ... [https://www.nature.com/articles/s41598-025-89142-6]
- 45. How to reduce autofluorescence [https://www.ptglab.com/news/blog/how-to-reduce-autofluorescence/?srsltid=AfmBOoqgeFDNzaMh9EXTf4JsDdHMCKnc4XnQIE7LGHB8R6NnM9XaMmGp]
- 46. Autofluorescence Quenching in Decellularized Plant Scaffolds ... [https://pmc.ncbi.nlm.nih.gov/articles/PMC12399283/]
- 47. Elastase Reduces Background Autofluorescence in ALK ... [https://www.sciencedirect.com/science/article/pii/S2319417025000149]
- 48. Immersion‐Based Clearing and Autofluorescence ... [https://pmc.ncbi.nlm.nih.gov/articles/PMC12589860/]
- 49. Using Expansion Microscopy to Physically Enlarge Whole ... [https://www.jove.com/v/64662/using-expansion-microscopy-to-physically-enlarge-whole-mount]
- 50. A method for creating custom 3D-printed molds to facilitate ... [https://pmc.ncbi.nlm.nih.gov/articles/PMC12157676/]
- 51. Confocal Microscopy Provides Powerful Imaging Insights [https://www.the-scientist.com/confocal-microscopy-provides-powerful-imaging-insights-73485]
- 52. Optimizing Confocal Imaging Protocols for Muscle Fiber Typing ... [https://bio-protocol.org/pdf/Bio-protocol5267.pdf]
- 53. A simple method for quantitating confocal fluorescent images [https://www.sciencedirect.com/science/article/pii/S2405580821000108]
- 54. Protocol for immunofluorescence detection and ... [https://www.sciencedirect.com/science/article/pii/S2666166725002552]
- 55. Protocol for immunofluorescence detection and ... [https://pmc.ncbi.nlm.nih.gov/articles/PMC12156156/]
- 56. Optimizing Confocal Imaging Protocols for Muscle Fiber ... [https://pmc.ncbi.nlm.nih.gov/articles/PMC11986697/]
- 57. 5 Controls for Immunofluorescence: An Easy Guide [https://bitesizebio.com/44370/controls-for-immunofluorescence-a-beginners-guide/]
- 58. 6 Essential IHC Controls for Reliable Staining Results [https://www.bosterbio.com/blog/post/6-ihc-controls-you-should-know?srsltid=AfmBOoojIjvP-jYnBko75-4W78NaDE2yxoRqGUaVtqBftHKWjQs9lENC]
- 59. a pilot study to identify the best fixation and decalcification ... [https://pmc.ncbi.nlm.nih.gov/articles/PMC12142299/]
- 60. Alternative Tissue Fixation Protocols Dramatically Reduce ... [https://www.sciencedirect.com/science/article/pii/S0023683723002234]
- 61. Cell surface and cell outline imaging in plant tissues using the ... [https://plantmethods.biomedcentral.com/articles/10.1186/1746-4811-9-40]
- 62. Immunofluorescence staining and confocal microscopy [https://bio-protocol.org/exchange/minidetail?id=342578&type=30]
- 63. Alvetex Scaffold Protocol: Immunofluorescence Confocal ... [https://www.reprocell.com/resources/protocols/alvetex-scaffold/d053-immunofluorescence-confocal-microscopy]
- 64. To see and to know: the power of live imaging ... [https://www.sciencedirect.com/science/article/pii/S1673852725002826]
- 65. A quantitative pipeline for whole-mount deep imaging and ... [https://elifesciences.org/reviewed-preprints/107154v1]
- 66. Long-term live imaging, cell identification and cell tracking ... [https://elifesciences.org/articles/107534]
- 67. Long-term live imaging, cell identification and cell tracking ... [https://pmc.ncbi.nlm.nih.gov/articles/PMC12334163/]
- 68. Santos Lab | Cycling towards fate: Interplay between cell ... [https://www.crick.ac.uk/careers-study/vacancies/2025-09-24-santos-lab-cycling-towards-fate-interplay-between-cell-cycle-regulation-and-fate-in-early-development]
- 69. Next generation lineage tracing and its applications ... [https://www.nature.com/articles/s41540-025-00542-w]
- 70. Whole-mount smFISH allows combining RNA and protein quantification at cellular and subcellular resolution | Nature Plants [https://www.nature.com/articles/s41477-023-01442-9]
- 71. Simultaneous detection of mRNA and protein in single cells using immunofluorescence-combined single-molecule RNA FISH - PubMed [https://pubmed.ncbi.nlm.nih.gov/26458549/]
- 72. smiFISH and embryo segmentation for single-cell multi- ... [https://www.nature.com/articles/s42003-021-01803-0]
- 73. Optimized protocol for single-molecule RNA FISH to ... [https://pmc.ncbi.nlm.nih.gov/articles/PMC8264745/]
- 74. TrueSpot: a robust automated tool for quantifying signal ... [https://pmc.ncbi.nlm.nih.gov/articles/PMC12477807/]
- 75. Architecture-driven quantitative nanoscopy maps ... [https://pmc.ncbi.nlm.nih.gov/articles/PMC11494298/]
- 76. Quantifying cytoskeletal organization from optical ... [https://www.frontiersin.org/journals/cell-and-developmental-biology/articles/10.3389/fcell.2023.1327994/full]
- 77. Machine learning-guided reconstruction of cytoskeleton ... [https://www.sciencedirect.com/science/article/pii/S2589004224021321]