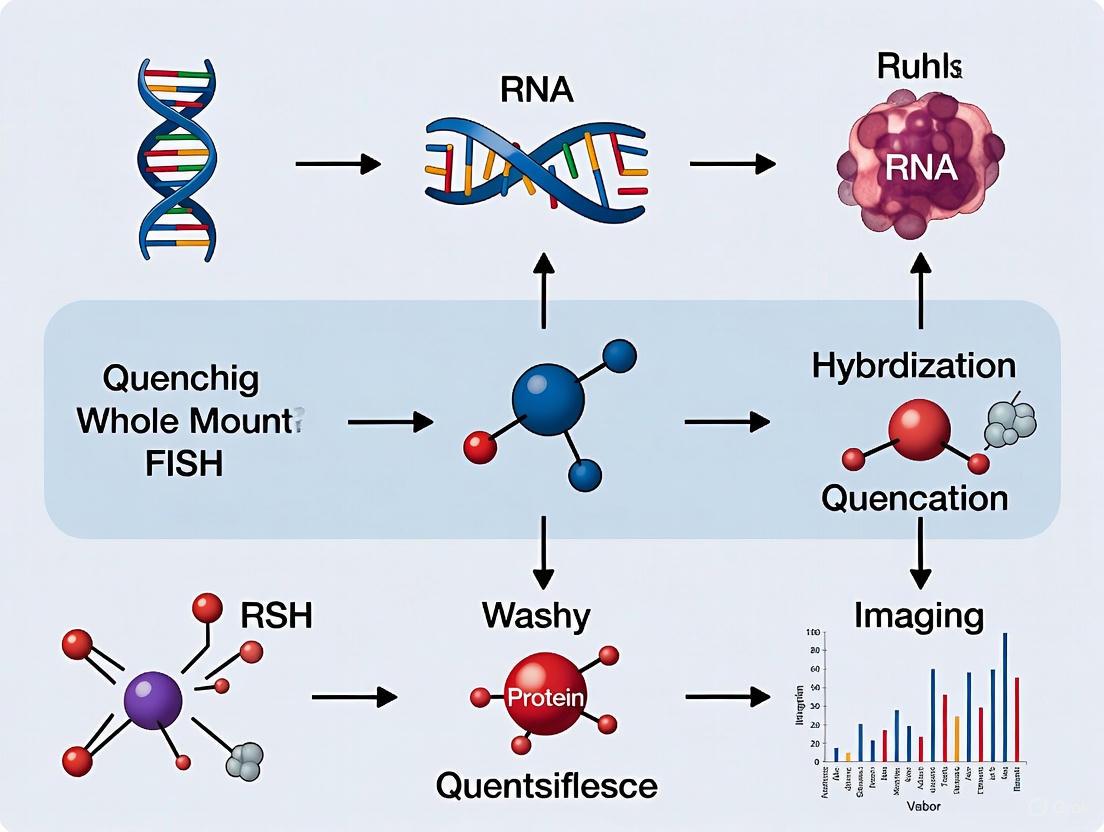
Advanced Strategies for Quenching Autofluorescence in Whole-Mount FISH: A Comprehensive Guide for Biomedical Researchers
This article provides a comprehensive guide for researchers and drug development professionals on overcoming the critical challenge of autofluorescence in whole-mount fluorescence in situ hybridization (FISH).
Advanced Strategies for Quenching Autofluorescence in Whole-Mount FISH: A Comprehensive Guide for Biomedical Researchers
Abstract
This article provides a comprehensive guide for researchers and drug development professionals on overcoming the critical challenge of autofluorescence in whole-mount fluorescence in situ hybridization (FISH). Covering foundational principles to advanced applications, we detail the sources of autofluorescence in various tissues, explore chemical quenching agents like TrueBlack Lipofuscin Autofluorescence Quencher and hydrogen peroxide bleaching, and present integrated optical clearing methods such as LIMPID that combine refractive index matching with autofluorescence reduction. The content includes systematic troubleshooting protocols for common issues like insufficient quenching and signal loss, validated through comparative studies across tissue types and model organisms. By enabling high-resolution, three-dimensional gene expression mapping with improved signal-to-noise ratios, these optimized methodologies significantly enhance the reliability of transcriptional analysis in developmental biology, neuroscience, and drug discovery applications.
Understanding Autofluorescence: Sources, Challenges, and Impact on Whole-Mount FISH Sensitivity
FAQs: Understanding Autofluorescence in Whole Mount FISH
What is autofluorescence and why is it a particular problem for whole mount FISH? Autofluorescence is the natural emission of light by biological structures when excited by specific wavelengths, a phenomenon inherent to cells and tissues [1]. It is problematic for whole mount fluorescence in situ hybridization (FISH) because the faint, omnipresent background signal can permeate the entire 3D tissue sample, obscuring the specific signals from fluorescently labeled RNA probes and significantly reducing the signal-to-noise ratio [2]. This issue is compounded in thick tissues where the total autofluorescence contribution from all layers can be substantial.
Which biological molecules are the most common sources of interfering autofluorescence? The most common endogenous fluorophores include specific metabolic co-factors, structural proteins, and age-related pigments [1] [3] [4]. Their excitation and emission spectra often overlap with those of popular fluorescent dyes, making them a primary source of interference.
Table 1: Common Sources of Biological Autofluorescence
| Endogenous Fluorophore | Primary Location | Excitation/Emission Peaks (nm) | Key Characteristics |
|---|---|---|---|
| NAD(P)H [1] | Cytoplasm, Metabolic cofactor | Ex: 340 / Em: 450 | Indicator of cellular metabolic state; only the reduced form (NAD(P)H) fluoresces. |
| Flavins (FAD) [1] | Mitochondria, Metabolic coenzyme | Ex: 380-490 / Em: 520-560 | In an opposite state to NAD(P)H; only the oxidized form (FAD) is fluorescent. |
| Lipofuscin [1] [5] | Lysosomal deposits in postmitotic cells (e.g., neurons, RPE) | Ex: 345-490 / Em: 460-670 | An "age pigment" that accumulates over time; has a very broad emission spectrum. |
| Collagen [1] | Extracellular Matrix (ECM) | Ex: 270 / Em: 390 | A key structural protein prevalent in connective tissues, dermis, and around vasculature. |
| Elastin [1] | Extracellular Matrix (ECM) | Ex: 350-450 / Em: 420-520 | Often interspersed with collagen, providing tissues with mechanical extensibility. |
| Tryptophan [1] | Proteins (amino acid residue) | Ex: 280 / Em: 350 | An essential amino acid found in most folded proteins. |
| Melanin [1] | Skin, Hair, Eyes (pigment) | Ex: 340-400 / Em: 360-560 | A natural photoprotective pigment; its concentration can vary widely. |
How does tissue fixation contribute to autofluorescence? Aldehyde fixatives like formaldehyde and glutaraldehyde, which are commonly used to preserve tissue structure, react with proteins to create fluorescent crosslinks throughout cells and tissues [1]. This chemical reaction introduces a non-biological source of autofluorescence that can be difficult to distinguish from the natural background.
Troubleshooting Guide: Quenching Autofluorescence in Whole Mount FISH
Problem: High Background from Intrinsic Tissue Autofluorescence
Solution 1: Photochemical Bleaching (OMAR) Oxidation-mediated autofluorescence reduction (OMAR) is a photochemical pre-treatment that effectively suppresses autofluorescence prior to FISH protocols [2].
Detailed Protocol:
- Sample Preparation: Following embryo collection or tissue dissection, fix samples with standard fixatives like paraformaldehyde [2].
- OMAR Treatment: Incubate fixed tissues in a solution of 2.5-4.5% hydrogen peroxide in Tris-EDTA buffer, supplemented with SDS or Tween 20 as a detergent [2] [6].
- Irradiation: Expose the sample to high-intensity cold white light (e.g., from high-power LED spotlights or panels delivering up to 20,000 lumens) for several hours. The solution should show bubbles, indicating an active oxidation reaction [2].
- Post-treatment: After bleaching, wash the tissue thoroughly with a buffer such as PBST before proceeding to the permeabilization and RNA-FISH steps [2].
Mechanism: The treatment generates reactive oxygen species that chemically modify fluorescent molecules in the tissue, breaking their conjugated double-bond systems and thereby reducing their ability to fluoresce [2].
Visual Guide: OMAR Experimental Workflow
Solution 2: Chemical Reduction with Borohydride For autofluorescence induced specifically by aldehyde fixatives, chemical reduction can be an effective solution [7] [6].
- Protocol: After fixation and before FISH, treat tissues with a solution of sodium borohydride (e.g., 0.1-1% in buffer) for 30 minutes to 1 hour. This treatment reduces the fluorescent crosslinks created by aldehydes [6].
Problem: Autofluorescence Overwhelming Weak FISH Signals
Solution: Strategic Probe Selection and Optical Clearing Choosing the right probes and combining them with optical clearing can dramatically improve the signal-to-noise ratio.
Probe Selection: Opt for fluorescent labels excited in the near-infrared (NIR) range (e.g., Cy7, Alexa Fluor 750). The excitation and emission wavelengths of these dyes fall outside the peaks of most common autofluorophores like NADH, collagen, and lipofuscin, thereby avoiding a significant portion of the background [1].
Optical Clearing: Use refractive index matching solutions like LIMPID (Lipid-preserving index matching for prolonged imaging depth) to render tissues transparent. This reduces light scattering, allowing clearer imaging deeper into the tissue and improving the detection of specific FISH signals [6].
- Application: After FISH staining, mount the tissue in a LIMPID solution containing saline-sodium citrate, urea, and iohexol. This single-step, aqueous clearing method preserves fluorescence and is compatible with FISH probes [6].
Problem: Persistent Lipofuscin Autofluorescence
Understanding the Source: Lipofuscin is an intractable autofluorescent "age pigment" that accumulates in postmitotic cells as intracellular granules from incomplete lysosomal digestion [5]. It has a very broad excitation and emission spectrum, making it particularly difficult to filter out.
- Strategy: Due to its chemical stability, lipofuscin is highly resistant to both chemical and photochemical bleaching methods [5]. The most effective strategy is avoidance.
- Imaging Modalities: If possible, use imaging techniques that are not based on fluorescence, such as bioluminescence imaging, which leaves autofluorophores unstimulated [1].
- Spectral Unmixing: Employ advanced imaging systems that can acquire the full emission spectrum at every pixel. Computational analysis can then be used to "unmix" the specific FISH signal from the characteristic spectral signature of lipofuscin after data acquisition [8] [3].
The Scientist's Toolkit: Key Reagents for Autofluorescence Management
Table 2: Essential Reagents for Quenching Autofluorescence
| Reagent | Function in Protocol | Key Benefit |
|---|---|---|
| Hydrogen Peroxide (H₂O₂) [2] | Active oxidizing agent in OMAR photochemical bleaching. | Effectively targets a wide range of endogenous fluorophores through an oxidative mechanism. |
| Sodium Borohydride (NaBH₄) [6] | Chemical reducing agent. | Specifically targets and reduces aldehyde-induced fluorescence from fixation. |
| High-Intensity LED Light Source [2] | Provides energy for the OMAR photochemical reaction. | Drives the oxidation process necessary for bleaching; cold light prevents heat damage. |
| HCR v3.0 FISH Probes [2] [9] | Amplifying RNA probes for signal detection. | Provides high signal amplification and low background, improving the signal-to-noise ratio against autofluorescence. |
| LIMPID Clearing Solution [6] | Aqueous refractive index matching medium. | Reduces light scattering, enabling deeper imaging and better signal clarity in whole mounts. |
| Phenol Red-Free Media [1] | Cell culture medium for live-cell preparations. | Eliminates background fluorescence from this common media additive before imaging. |
How Autofluorescence Compromises Signal-to-Noise Ratio in 3D Gene Expression Mapping
FAQ: Understanding the Core Problem
What is autofluorescence and how does it directly impact my 3D gene expression data?
Autofluorescence is background fluorescence emitted naturally by biological tissues or induced by fixation. It is not attributed to your specific FISH probes or antibodies. This background signal acts as a constant source of noise in your images. Because the signal-to-noise ratio (SNR) is calculated as your specific signal divided by the background noise, autofluorescence directly lowers the SNR [10]. A low SNR can mask the detection of low-abundance RNA transcripts, reduce the dynamic range of your image, and complicate the automated segmentation and analysis of cells in 3D space [11].
Why is autofluorescence a particularly severe problem for whole-mount samples and 3D mapping?
Whole-mount tissues are thick and dense, meaning there is a greater volume of autofluorescent material (e.g., mitochondria, lysosomes, collagen) contributing to background noise compared to thin sections [2] [6]. Furthermore, advanced 3D imaging techniques like confocal microscopy collect light from a very small focal volume, which inherently limits the number of photons collected from your specific probe. When this already low signal is contaminated by autofluorescence, the resulting images can be grainy and lack contrast, making it difficult to achieve high-resolution 3D reconstructions [10].
What are the main types of autofluorescence I need to worry about?
The primary sources are categorized as follows [12] [13] [14]:
- Biological Autofluorescence: Originates from endogenous fluorophores within cells and tissues, including:
- Fixative-Induced Autofluorescence: Caused by aldehyde-based fixatives like formaldehyde and paraformaldehyde. These reagents form fluorescent Schiff bases by reacting with cellular amines and proteins [12] [14].
Troubleshooting Guide: Proven Methods to Quench Autofluorescence
Chemical and Photochemical Quenching
Several chemical treatments can effectively reduce or eliminate autofluorescence prior to hybridization.
Table 1: Autofluorescence Quenching Reagents and Protocols
| Method | Mechanism | Example Protocol | Best For | Considerations |
|---|---|---|---|---|
| Hydrogen Peroxide (H₂O₂) Treatment | Oxidizes and bleaches endogenous fluorescent pigments [2] [15]. | Incubate fixed tissues in alcoholic or aqueous 6% H₂O₂ solution, often under bright light illumination (OMAR protocol) [2] [15]. | Whole-mount insect tissues, mouse embryonic limb buds, various vertebrate organs [2] [15]. | Alcoholic H₂O₂ better preserves RNA for FISH. Aqueous H₂O₂ may degrade RNA targets [15]. |
| Sudan Black B / Eriochrome Black T | Lipophilic dyes that bind to and quench lipofuscin and other autofluorescent lipids [14]. | Treat fixed and permeabilized tissues with a solution of 0.1-1% Sudan Black B in 70% ethanol for 30-60 minutes [14]. | Tissues with high lipofuscin (e.g., aged neurons, skeletal muscle) [14]. | Sudan Black B fluoresces in the far-red channel; avoid if using fluorophores in this range [14]. |
| Sodium Borohydride | Reduces aldehyde-induced fluorescent Schiff bases to non-fluorescent alcohols [12] [14]. | Treat samples with a fresh solution of 0.1% sodium borohydride in PBS for 10-30 minutes after fixation [14]. | Tissues fixed with aldehydes (formalin, PFA) [12] [14]. | Can have variable effectiveness and may damage some epitopes or tissue morphology [14]. |
| Commercial Reagents (e.g., TrueVIEW) | Ready-to-use solutions that chemically suppress a broad spectrum of autofluorescence [14]. | Follow manufacturer's instructions, typically involving incubation after fixation and permeabilization. | A general-purpose solution for various autofluorescence sources. | Cost may be a factor for large-scale studies. |
Optimized Sample Preparation and Imaging
Preventing autofluorescence is often more effective than trying to remove it later.
- Fixation: Avoid glutaraldehyde, which causes strong autofluorescence. Use paraformaldehyde instead, and for cells, consider chilled ethanol as an alternative [14]. Always use the shortest fixation time required to preserve morphology [14].
- Probe and Fluorophore Selection: If your tissue has high green autofluorescence (e.g., from collagen or NADH), choose fluorophores that emit in the far-red spectrum (e.g., Cy5, Alexa Fluor 647) to maximize separation from the noise [14].
- Optical Clearing: Methods like LIMPID (Lipid-preserving index matching for prolonged imaging depth) use aqueous solutions to render tissues transparent. This reduces light scattering, increases imaging depth, and can improve the effective SNR by allowing more signal photons to be collected [6].
- Microscope Settings: Optimize your pinhole size on a confocal microscope. A very small pinhole reduces background but also sacrifices too much signal. An optimal size maximizes the SNR by balancing signal and background rejection [10].
Experimental Protocol: OMAR for Whole-Mount RNA-FISH
The Oxidation-Mediated Autofluorescence Reduction (OMAR) protocol is a robust method for suppressing autofluorescence in whole-mount samples like embryos and tissues [2].
Workflow: OMAR Autofluorescence Quenching
Step-by-Step Methodology [2]:
Sample Collection and Fixation:
- Collect mouse embryonic limb buds (or your tissue of interest) and fix overnight in 4% paraformaldehyde (PFA) at 4°C.
- Dehydrate through a graded methanol series and store at -20°C.
OMAR Photochemical Bleaching:
- Rehydrate the samples.
- Prepare a bleaching solution of 4.5% hydrogen peroxide in a 1:1 mixture of methanol and PBS.
- Place samples in the solution and illuminate with a high-intensity cold white light source (e.g., 20,000 lumen LED panels) for 1-2 hours. The appearance of bubbles indicates an active oxidation reaction.
- Wash the samples thoroughly.
Tissue Permeabilization and Hybridization:
- Permeabilize the bleached tissues with a detergent-based solution (e.g., containing Tween-20).
- Perform whole-mount RNA-FISH using your preferred protocol, such as the sensitive Hybridization Chain Reaction (HCR) v3.0.
Clearing and Imaging:
- Optically clear the samples using a compatible method like LIMPID [6] or the protocol described in the paper.
- Proceed with 3D image acquisition using confocal or light-sheet microscopy.
Key Resources: Hydrogen peroxide, high-intensity LED light source, HCR RNA-FISH probes and amplifiers [2].
The Scientist's Toolkit: Essential Reagent Solutions
Table 2: Key Research Reagents for Autofluorescence Management
| Reagent | Function in Autofluorescence Control | Specific Example |
|---|---|---|
| Hydrogen Peroxide | Active ingredient in photochemical (OMAR) and chemical bleaching methods to oxidize fluorescent pigments [2] [15]. | 33% w/v stock, diluted to 4.5-6% in methanol/PBS or aqueous buffer [2] [15]. |
| Sudan Black B | Lipophilic dye used to quench autofluorescence from lipofuscin and other lipids [14]. | 0.1-1% solution in 70% ethanol [14]. |
| Sodium Borohydride (NaBH₄) | Reducing agent used to diminish autofluorescence induced by aldehyde fixation [12] [14]. | 0.1% solution in PBS, prepared fresh [14]. |
| TrueVIEW Autofluorescence Quenching Kit | Commercial ready-to-use solution to suppress broad-spectrum autofluorescence [14]. | Vector Laboratories product # SP-8400 [14]. |
| LIMPID Clearing Solution | Aqueous optical clearing agent that improves SNR and imaging depth via refractive index matching, compatible with FISH [6]. | Home-made solution containing saline-sodium citrate (SSC), urea, and iohexol [6]. |
| CoralLite 594/647 Fluorophores | Fluorophores emitting in the far-red spectrum, chosen to avoid overlap with common autofluorescence in the blue/green range [14]. | Proteintech antibody conjugation kits and conjugated antibodies [14]. |
Troubleshooting Guides
How do I resolve issues with deep tissue penetration and imaging depth?
A primary challenge in whole-mount FISH is achieving adequate penetration of probes and reagents into thick tissue samples, which is crucial for clear imaging.
Troubleshooting Strategies:
| Challenge | Cause | Solution |
|---|---|---|
| Poor Probe Penetration | Incomplete tissue permeabilization prevents probes from reaching targets [16]. | Optimize permeabilization by using agents like Triton X-100 or proteinase K; adjust concentration, time, and temperature to balance accessibility with morphology preservation [16]. |
| Weak Signal in Sample Core | Probe molecules cannot diffuse deeply into the tissue, or signal is attenuated/absorbed [17]. | Implement a robust permeabilization protocol combined with optical clearing techniques after hybridization to reduce light scattering and improve signal detection from deep layers [17]. |
| Uneven Signal Distribution | Patchy or uneven permeabilization and denaturation across the sample [16]. | Ensure uniform reagent distribution during processing and avoid air bubbles during mounting. Standardize sample preparation steps to improve reproducibility [16]. |
How can I reduce high background autofluorescence?
Tissue autofluorescence, which can mask specific FISH signals, is a major obstacle in fluorescence-based techniques, especially in whole-mount samples like embryonic tissue [17].
Troubleshooting Strategies:
| Challenge | Cause | Solution |
|---|---|---|
| High Background Masking Signal | Endogenous biomolecules (e.g., lipids, proteins) in the tissue emit light, creating a high noise floor [17]. | Apply Oxidation-Mediated Autofluorescence Reduction (OMAR) via photochemical bleaching. This protocol maximally suppresses autofluorescence prior to hybridization, eliminating the need for digital post-processing [17]. |
| Non-Specific Signal | Unbound or weakly bound probes are not adequately removed during washing [16]. | Increase the stringency of post-hybridization washes by adjusting temperature and salt concentration. Optimize probe concentration and hybridization time to favor specific binding [16]. |
| Unexpected Fluorescence in Channels | Autofluorescence is often broad-spectrum, appearing in multiple detection channels [17]. | Using OMAR to quench this signal before probe application drastically improves the signal-to-noise ratio, making specific signals more distinct [17]. |
How can I improve quantitative accuracy for transcript counting?
Accurate quantification of gene expression is a key application of FISH, but several factors can introduce inaccuracy.
Troubleshooting Strategies:
| Challenge | Cause | Solution |
|---|---|---|
| Faded or Variable Signal | Signal degradation due to photobleaching, over-fixation, or over-permeabilization [16]. | Use more photostable fluorophores (e.g., quantum dots, bright organic dyes) and antifade mounting media. Optimize fixation and permeabilization conditions to preserve sample integrity [16] [18]. |
| Inconsistent Results Between Runs | Inter-run and inter-operator variability in manual protocols [19]. | Transition to an automated staining platform where possible. Automation standardizes incubation times, temperatures, and washing, leading to high concordance rates and improved reproducibility [19]. |
| Ambiguous Signal Localization | Use of probes that are too long or heavily labeled, causing aggregation and poor resolution [20]. | For single-molecule FISH (smFISH), use sets of short, singly-labeled oligonucleotide probes. This provides a predictable fluorophore count per transcript, enabling semi-automated quantification and resolution of individual mRNA molecules [20]. |
Frequently Asked Questions (FAQs)
Q: What is the single most effective method to reduce autofluorescence in whole-mount mouse embryos? A: The most effective method is Oxidation-Mediated Autofluorescence Reduction (OMAR). This photochemical bleaching step is performed after fixation and before hybridization. It chemically modifies the molecules responsible for autofluorescence, leading to maximal suppression and eliminating the need for digital image post-processing, which greatly improves the signal-to-noise ratio for accurate quantification [17].
Q: My FISH signal is weak or absent, even though my positive controls work. What should I check? A: Follow this diagnostic path:
- Probe & Target: Verify probe design and labeling efficiency. Ensure the target nucleic acid (DNA/RNA) has been adequately denatured to make it single-stranded and accessible [16].
- Permeabilization: This is a very common culprit. Optimize the concentration and duration of permeabilization agents (e.g., Triton X-100, proteinase K) to allow the probe to reach its target without destroying sample morphology [16].
- Hybridization Conditions: Increase the probe concentration or hybridization time. Ensure the sample does not dry out during hybridization by using a sealed, humidified chamber [16].
Q: How does automated FISH improve quantitative accuracy compared to manual methods? A: Automated platforms significantly enhance quantitative accuracy by eliminating major sources of human error and variability. They provide:
- Consistent Timing and Temperature: Precise control over denaturation, hybridization, and wash steps, which is critical for stringent and reproducible binding [19].
- Standardized Reagent Application: Uniform application of probes and wash buffers across the sample and between runs [19].
- Reduced Inter-operator Variability: The protocol is executed identically every time, leading to highly concordant results (e.g., 98% concordance reported in one validation study) and reliable data for quantitative analysis [19].
Q: Are there specific probe types that are better for precise, single-molecule quantification? A: Yes. For single-molecule FISH (smFISH), the best results are achieved using multiple short oligonucleotide probes (e.g., 20-mers), each tagged with a single fluorophore and designed to collectively span the target mRNA. This approach yields a high and predictable number of fluorophores per transcript, enabling clear discrimination of individual mRNA molecules and semi-automated quantification with image analysis software. This is superior to using a few long, multi-labeled probes which can cause self-quenching and ambiguous signal clusters [20].
Experimental Protocol: OMAR for Whole-Mount RNA-FISH
The following detailed protocol is adapted from an optimized method for whole-mount RNA-FISH on mouse embryonic limb buds, which can be adapted for other tissues and vertebrate embryos [17].
Workflow Diagram: OMAR FISH Protocol
Materials and Reagents
| Item | Function / Role in Protocol |
|---|---|
| Paraformaldehyde | Fixative agent that preserves tissue morphology and maintains the integrity of the target nucleic acids [16]. |
| Triton X-100 | A detergent-based permeabilization agent that creates pores in cell membranes, allowing FISH probes to access the interior of the tissue [17] [16]. |
| OMAR Bleaching Reagents | Chemical solutions (e.g., hydrogen peroxide) used in the photochemical bleaching step to oxidize and silence autofluorescent molecules within the tissue [17]. |
| Oligonucleotide FISH Probes | Short, fluorescently-labeled DNA probes designed to bind complementary mRNA sequences. Using multiple probes per transcript increases signal for detection [20]. |
| Hybridization Buffer | A solution that provides the correct salt, pH, and denaturant conditions to facilitate the annealing of the FISH probes to their target mRNA sequences [20] [16]. |
| Mounting Medium with Antifade | A solution to preserve the sample for microscopy. Antifade reagents slow down photobleaching, protecting the fluorescent signal during imaging [16]. |
Step-by-Step Methodology
Embryo Collection and Fixation: Collect the target tissue (e.g., mouse embryonic limb bud) and immediately fix it in a suitable fixative like 4% paraformaldehyde. Fixation preserves the tissue architecture and immobilizes the RNA targets in situ. The fixation time should be optimized to avoid over-fixation, which can reduce probe accessibility [17] [16].
Oxidation-Mediated Autofluorescence Reduction (OMAR): This is the critical autofluorescence quenching step. Treat the fixed samples with the OMAR bleaching reagents under controlled light exposure. This photochemical reaction effectively reduces the broad-spectrum background fluorescence that plagues whole-mount samples, thereby drastically improving the signal-to-noise ratio for subsequent FISH detection [17].
Permeabilization: Treat the samples with a permeabilization agent, such as Triton X-100. This step is essential for allowing the FISH probes to penetrate deep into the tissue and access the target mRNA. The concentration and duration of this step must be carefully balanced to ensure adequate penetration while preventing morphological damage [17] [16].
Hybridization: Incubate the permeabilized samples with the fluorescently labeled oligonucleotide FISH probes in a hybridization buffer. Use a humidified chamber to prevent evaporation and sample drying, which can cause high, non-specific background. The hybridization time and temperature are key parameters that determine the specificity of probe binding [16].
Post-Hybridization Washes: Perform a series of stringent washes after hybridization. The goal is to remove any excess, unbound probes and to wash away probes that are weakly or non-specifically bound. Adjusting the temperature and salt concentration of these washes is the primary way to control stringency and minimize background [20] [16].
Optical Clearing and Mounting: Subject the samples to an optical clearing protocol. This process reduces light scattering within the tissue, making it more transparent and significantly improving imaging depth and clarity for both 2D and 3D analysis. Mount the cleared samples in an antifade mounting medium for preservation [17].
Imaging and Analysis: Image the samples using a fluorescence microscope capable of 3D image acquisition. The OMAR-treated samples will have low background, allowing for clear detection of specific FISH signals without the need for complex digital post-processing to subtract autofluorescence [17].
Research Reagent Solutions
This table lists key materials used in the featured OMAR-FISH protocol and their critical functions.
| Reagent / Material | Function in Experiment |
|---|---|
| OMAR Bleaching Kit | Critically quenches broad-spectrum tissue autofluorescence, enabling high signal-to-noise imaging without computational correction [17]. |
| Permeabilization Detergent (Triton X-100) | Creates pores in lipid membranes, allowing nucleic acid probes to penetrate deep tissue layers for target access [17] [16]. |
| Single-Molecule FISH Probe Sets | Multiple short, singly-labeled oligonucleotides provide bright, quantifiable signal by binding adjacent sites on a single mRNA molecule [20]. |
| Automated Staining Platform | Standardizes all fluidic and incubation steps, drastically reducing hands-on time and variability while ensuring consistent, high-quality results [19]. |
| Optical Clearing Reagents | Reduces light scattering within the sample, increasing imaging depth and resolution for accurate 3D analysis of whole-mount specimens [17]. |
Frequently Asked Questions (FAQs)
FAQ 1: What is the primary cause of persistent background fluorescence in aged neuronal tissues, and how can it be managed? Lipofuscin, an autofluorescent material that progressively accumulates in the brain and other tissues with age, is a primary cause of background fluorescence. This accumulation is particularly prominent in postmitotic cells like neurons. In normal aging and conditions like Neuronal Ceroid Lipofuscinosis (NCL), lipofuscin granules fill the cytosol and can confound immunofluorescence studies.
- Management Strategy: The 3D-LIMPID-FISH method is an optical clearing technique compatible with FISH that uses mild aqueous conditions to preserve tissue structure and lipids while reducing light scattering. It can be combined with bleaching the tissue in H₂O₂ to eliminate autofluorescence [6] [21].
FAQ 2: How do blood components interfere with fluorescence imaging and blood cell analysis? Lipemia, or high lipid content in the blood, can cause significant interference. In sablefish studies, even a 16-18 hour fast was insufficient to reduce blood lipids, leading to visible lipemia and frequent rupture of blood cells during analysis. This can cause artifacts in hematology and possible reagent interference in plasma biochemistry. Furthermore, the choice of anticoagulant can affect blood cell counts, morphology, and leukocyte viability [22] [23].
FAQ 3: Why is organ-specific profiling crucial in whole-mount FISH studies? Gene expression is highly heterogeneous across different tissues and cell types. Quantitative analyses have shown that the abundance of specific mRNAs can vary by orders of magnitude between different anatomical regions. Therefore, profiling specific regions of interest (ROIs) is essential to understand unique cellular functions and avoid averaging out critical, region-specific expression signals [24].
Troubleshooting Guides
Issue 1: High Background Autofluorescence from Lipofuscin
Problem: Strong, speckled autofluorescence in aged or diseased neuronal tissues obscures specific FISH signals. Background: Lipofuscin load increases linearly with age and at a dramatically accelerated rate (11x faster) in certain disease models like CLN1. It is primarily concentrated in the soma of neurons and glia, with stereotyped, layer-specific deposition in regions like the cortex [21].
Solution: Implement a combined approach of optical clearing and chemical bleaching.
- Recommended Protocol: 3D-LIMPID-FISH with Bleaching
- Sample Extraction: Collect your whole-mount tissue sample.
- Fixation: Fix the tissue to preserve morphology and antigenicity.
- Bleaching: Incubate the tissue in H₂O₂ to chemically reduce lipofuscin autofluorescence [6].
- Staining: Perform your standard FISH protocol with HCR probes for high signal-to-noise ratio and linear amplification [6].
- Clearing: Immerse the tissue in the LIMPID solution. This aqueous clearing solution contains saline-sodium citrate, urea, and iohexol. The refractive index can be fine-tuned by adjusting the iohexol percentage to match your objective lens (e.g., 1.515), thereby increasing transparency and reducing aberrations for high-resolution imaging [6].
Table 1: Neuroanatomical Vulnerability to Lipofuscin Accumulation
| Neuroanatomical Region | Lipofuscin Load in 24-month WT | Lipofuscin Load in 7-month PPT1 KO (CLN1) |
|---|---|---|
| Cortex (Layer 5/6a) | High | Very High |
| Thalamus | High | Very High |
| Cerebellar Granule Layer | High | Very High |
| Hippocampal Stratum Pyramidale | Moderate | Very High |
| Ventricular System | Low | Low |
| Fiber Tracts | Low | Low |
Source: Adapted from Lipofuscin Atlas data [21].
Issue 2: Artifacts and Interference from Blood Components
Problem: Lipemia or poor sample preparation leads to ruptured blood cells, hemolysis, and unreliable data in assays or tissue imaging. Background: Blood parameters are sensitive to intrinsic and extrinsic factors like species, diet, and handling. Lipemia can be induced by insufficient fasting, while the choice of anticoagulant can directly impact cell integrity and subsequent functional assays [22] [23].
Solution: Optimize pre-sample handling and anticoagulant selection.
- Recommended Protocol: Blood Collection for Minimized Interference
- Fasting: Prior to blood collection or tissue sampling from blood-rich organs, fast the experimental subjects for 24 to 36 hours. This has been shown to sufficiently reduce blood lipids and prevent lipemia-related artifacts in fish models [22].
- Anticoagulant Selection: Choose an anticoagulant based on your downstream application. A study in rainbow trout found:
- Li-Heparin: Best for preserving hematological count, cell morphology, and minimizing ROS production. It did not negatively affect phagocytosis ability of leukocytes and showed no hemolysis [23].
- K3EDTA: Caused lower leukocyte viability, higher levels of apoptosis, and increased ROS levels compared to other anticoagulants [23].
- ACD-A: Showed intermediate performance and is known to be effective for leukocyte functional studies in other vertebrates [23].
Table 2: Effect of Anticoagulants on Rainbow Trout Blood Parameters
| Parameter | Li-Heparin | K3EDTA | ACD-A |
|---|---|---|---|
| Erythrocyte/Thrombocyte Count | Reference | Significant differences | Significant differences |
| Hemolysis | None | Present | Present |
| Leukocyte Viability | High | Lower | Intermediate |
| ROS Production in Myeloid Cells | Low | High | Low |
| Impact on Phagocytosis | No negative effect | Not the best choice | Not the best choice |
Source: Data synthesized from [23].
Issue 3: Achieving High-Resolution, Organ-Specific Gene Expression Profiles
Problem: Low-resolution imaging of whole organisms fails to capture critical subcellular or tissue-specific expression patterns.
Background: Conventional low-magnification imaging of whole mount samples sacrifices detail. Quantitative analyses reveal that gene expression can be highly enriched in specific regions; for example, calb1 mRNA is 84 times more abundant in the mouse dentate gyrus (DG) than in the CA3 region [24].
Solution: Employ a smart imaging workflow that combines automated microscopy with feature detection.
- Recommended Protocol: Automated Smart Microscopy for Organ-Zooming
- Sample Mounting: Consistently orient specimens in agarose-filled microplates using 3D-printed orientation tools to standardize data acquisition [25].
- Pre-scan: Acquire low-resolution overview images (e.g., with a 4x objective) of the entire specimen [25].
- Feature Detection: Use algorithms (e.g., in Fiji) to automatically detect the XY-coordinates of your fluorescently labeled region of interest (ROI), such as the pronephros in zebrafish or a hippocampal subregion [25] [24].
- Re-scan: The software sends instructional feedback to the microscope to reposition the high-magnification objective (e.g., 63x oil) over the ROI and acquire a high-resolution z-stack [6] [25]. This "pre-scan/re-scan" procedure allows for the automated capturing of standardized, high-resolution datasets from specific tissues.
The Scientist's Toolkit: Essential Research Reagents
Table 3: Key Reagent Solutions for Tissue-Specific FISH
| Reagent / Material | Function | Example Use Case |
|---|---|---|
| LIMPID Solution | A hydrophilic, aqueous optical clearing agent that enables deep-tissue imaging via refractive index matching. | Clearing whole-mount tissues for 3D FISH; preserves lipids and is compatible with antibody and FISH probes [6]. |
| HCR FISH Probes | Fluorescent in situ hybridization probes that use Hybridization Chain Reaction for linear signal amplification, providing high sensitivity and quantifiability. | Detecting mRNA with single-molecule resolution; ideal for quantifying gene expression in specific ROIs [6]. |
| 3D-Printed Orientation Tools | Creates agarose cavities in microplates for consistent and automated positioning of whole-mount specimens. | Essential for high-throughput, automated imaging of zebrafish embryos or other small model organisms [25]. |
| Li-Heparin Anticoagulant | Preserves blood cell morphology and viability for functional immune assays and minimizes hemolysis. | Collecting blood samples for subsequent flow cytometry or microscopy analysis in fish and other animals with nucleated erythrocytes [23]. |
| "Carrier RNA" | A designed RNA with no sequence homology to the studied organism, used to prevent adsorption of nucleic acids to plastic surfaces. | Critical for accurate RT-qPCR from laser-microdissected samples to avoid loss of ultra-micro quantities of mRNA [24]. |
Experimental Workflows and Signaling Pathways
Workflow 1: 3D-LIMPID-FISH for Whole-Mount Tissues
Diagram Title: 3D-LIMPID-FISH Experimental Workflow
Workflow 2: Smart Imaging for Organ-Specific Profiling
Diagram Title: Automated Smart Imaging Pipeline
Pathway 1: Lipofuscin Accumulation in Aging and Disease
Diagram Title: Lipofuscin Biogenesis and Impact Pathway
Practical Quenching Protocols: Chemical Agents, Optical Clearing, and Integrated Workflows
In whole mount fluorescence in situ hybridization (FISH), autofluorescence can significantly compromise data interpretation by masking specific signals. This technical support center details the use of three primary quenching agents—TrueBlack Lipofuscin Quencher, Hydrogen Peroxide, and Sudan Black B—to mitigate this issue. The following guides and FAQs provide targeted protocols and troubleshooting advice to help researchers select and optimize the correct quenching method for their experimental context, particularly within whole mount specimens.
Research Reagent Solutions
The table below summarizes key reagents used to quench autofluorescence in fluorescence imaging.
| Reagent Name | Primary Function | Key Features & Applications |
|---|---|---|
| TrueBlack Lipofuscin AF Quencher [26] [27] | Quenches lipofuscin autofluorescence; also reduces background from collagen, elastin, and red blood cells. | Superior to Sudan Black B with less far-red background; can be used before or after immunofluorescence staining; effective on human and aged animal tissues. |
| TrueBlack Plus Lipofuscin AF Quencher [26] | Next-generation lipofuscin quencher. | Even lower far-red background than original TrueBlack; can be used in aqueous buffer, allowing longer incubations for thick tissues without shrinkage. |
| Sudan Black B [26] [28] | Traditionally used to quench lipofuscin autofluorescence. | A lipophilic dye; can introduce uniform non-specific background fluorescence in the red and far-red channels. |
| ReadyProbes Tissue Autofluorescence Quenching Kit [29] | Minimizes autofluorescence from aldehyde fixation, red blood cells, collagen, and elastin. | Does not quench natural pigments or other autofluorescent entities; components must be mixed in a specific order. |
| Hydrogen Peroxide (H₂O₂) [28] | A bleaching agent used to reduce autofluorescence from various sources, including endogenous pigments. | Often used to treat tissues with high levels of endogenous pigments; requires careful optimization of concentration and time to avoid tissue damage. |
Quantitative Data Comparison of Quenching Agents
For informed experimental design, the following table compares critical quantitative data for the featured quenching agents.
| Agent | Recommended Working Concentration / Dilution | Recommended Incubation Time | Key Stability & Safety Notes |
|---|---|---|---|
| TrueBlack (20X in DMF) [26] | 1X (diluted from 20X stock) | Not specified; described as "rapid". | Original formulation. Safety: Contains DMF, which is rapidly absorbed through skin and lungs and may harm the unborn child. Wear personal protective equipment [27]. |
| TrueBlack (30X in DMSO) [26] | 1X (diluted from 30X stock) | Not specified; described as "rapid". | More concentrated; uses DMSO, a less toxic solvent than DMF. |
| TrueBlack Plus [26] | As per manufacturer's instructions. | Can be extended for thick tissues. | Formulated for use in aqueous buffer. |
| Sudan Black B [28] | 0.1% - 0.3% (w/v) in 70% ethanol. | 10 - 30 minutes. | Stable solution can be stored at room temperature for several months. |
| Hydrogen Peroxide [28] | 1% - 3% (v/v) in PBS or distilled water. | 30 minutes to 2 hours; requires optimization. | Unstable; prepare fresh before use. Degrades rapidly in the presence of light, heat, and organic material. |
Detailed Experimental Protocols
Protocol 1: Quenching with TrueBlack Lipofuscin Autofluorescence Quencher
This protocol is adapted for use on tissue sections, including whole mount specimens, and can be performed either before or after immunofluorescence or FISH staining [26].
- Preparation of Working Solution: Dilute the TrueBlack stock solution (either 20X in DMF or 30X in DMSO) in the appropriate volume of 70% ethanol to create a 1X working solution. For example, to make 1 mL of 1X solution, use 50 µL of 20X stock with 950 µL of 70% ethanol.
- Application: Apply enough TrueBlack 1X working solution to completely cover the tissue sample.
- Incubation: Incubate at room temperature for the desired time. The process is rapid, but optimal time should be determined empirically (e.g., start with 2-5 minutes). For thick whole mount samples using TrueBlack Plus, longer incubation times are possible as it is compatible with aqueous buffers [26].
- Rinsing: Thoroughly rinse the sample several times with PBS or your chosen buffer to remove the quenching solution.
- Mounting and Imaging: Proceed with mounting the sample and imaging.
Protocol 2: Quenching with Sudan Black B
This traditional method is typically performed after immunofluorescence staining [26] [28].
- Preparation of Staining Solution: Prepare a 0.1% to 0.3% (weight/volume) solution of Sudan Black B in 70% ethanol. Filter the solution if necessary to remove any undissolved particles.
- Application: Cover the stained tissue sample with the Sudan Black B solution.
- Incubation: Incubate at room temperature for 10 to 30 minutes.
- Differentiation and Rinsing: Rinse the sample extensively with 70% ethanol followed by PBS or your chosen buffer to remove excess dye and reduce background.
- Mounting and Imaging: Proceed with mounting the sample and imaging. Be aware that Sudan Black B can introduce non-specific background fluorescence in the red and far-red channels [26].
Protocol 3: Bleaching with Hydrogen Peroxide
This method is useful for reducing autofluorescence from various endogenous pigments, such as those in red blood cells [28].
- Preparation of Working Solution: Prepare a fresh 1% to 3% solution of hydrogen peroxide in PBS or distilled water. Note: Higher concentrations may damage tissue and require extensive optimization.
- Application: Incubate the tissue sample in the hydrogen peroxide solution.
- Incubation: Incubate at room temperature, protected from light, for 30 minutes to 2 hours. Monitor the reduction of autofluorescence closely.
- Termination and Rinsing: Thoroughly rinse the sample multiple times with PBS to terminate the reaction and remove all traces of hydrogen peroxide.
- Proceed with Staining: The sample is now ready for subsequent staining procedures.
Troubleshooting Guides & FAQs
Frequently Asked Questions
Q1: Can TrueBlack be used to quench autofluorescence from sources other than lipofuscin? Yes. While TrueBlack is exceptionally effective at quenching lipofuscin, it can also reduce general background fluorescence and autofluorescence from other sources, such as collagen, elastin, and red blood cells. However, it may not be as effective for these non-lipofuscin sources as it is for lipofuscin itself [26] [27].
Q2: What is the key difference between TrueBlack and Sudan Black B? The primary difference is in the background signal. TrueBlack quenches lipofuscin fluorescence with far less increase in red and far-red background fluorescence compared to Sudan Black B. This makes TrueBlack a superior choice when using fluorescent dyes in these wavelengths [26].
Q3: I am working with thick whole mount samples. Which quenching agent is best suited for longer incubation times? TrueBlack Plus is specifically designed for this application. It is the only lipofuscin quencher that can be used in aqueous buffer instead of 70% ethanol, which allows for longer incubation times without causing tissue shrinkage [26].
Q4: My negative control (no primary antibody) still shows fluorescence after quenching. What could be the cause? The ReadyProbes Tissue Autofluorescence Quenching Kit product information clarifies that not all autofluorescence is quenched by a single reagent. Their kit, for example, minimizes autofluorescence from aldehyde fixation, red blood cells, collagen, and elastin, but will not quench natural pigments or other autofluorescent entities [29]. It is critical to identify the source of autofluorescence in your specific tissue and choose the quenching method accordingly.
Troubleshooting Common Problems
| Problem | Potential Causes | Recommended Solutions |
|---|---|---|
| High Background in Red/Far-Red Channel | Use of Sudan Black B, which fluoresces in these channels [26]. | Switch to TrueBlack or TrueBlack Plus, which offer lower far-red background. |
| Weak Specific Signal After Quenching | Over-quenching; the quenching agent may be causing a decrease in the specific antibody or FISH signal [27]. | Titrate the concentration and incubation time of the quenching agent. Ensure it is compatible with your specific antibodies and probes. |
| Ineffective Quenching | The wrong quenching agent was selected for the source of autofluorescence [29]. | Identify the primary source of autofluorescence in your tissue (e.g., lipofuscin, RBCs, aldehydes) and select a targeted reagent. |
| Tissue Damage or Shrinkage | Use of hydrogen peroxide at too high a concentration or for too long; use of alcohol-based quenchers on delicate whole mounts [26] [28]. | For H₂O₂, optimize concentration and time on test samples. For delicate samples, consider TrueBlack Plus in aqueous buffer. |
Experimental Workflow and Pathway Diagrams
The following diagram illustrates the decision-making pathway for selecting and applying an autofluorescence quenching agent in a whole mount FISH experiment.
Diagram 1: Decision pathway for selecting an autofluorescence quenching method.
The diagram below outlines the core signaling pathway involved in one of the key models used to study cell motility, which is relevant to the zebrafish WHIM syndrome model discussed in the search results [30].
Diagram 2: CXCR4-SDF1 signaling pathway in normal and WHIM mutation contexts.
This technical support guide details the LIMPID (Lipid-preserving Index Matching for Prolonged Imaging Depth) methodology, an advanced optical clearing technique. Framed within a broader thesis on quenching autofluorescence in whole-mount FISH (Fluorescence In Situ Hybridization) research, this resource provides troubleshooting and procedural support for scientists. LIMPID enables high-resolution three-dimensional imaging of thick tissues by matching refractive indices to reduce light scattering while preserving lipids and fluorescent signals [31] [6] [32]. Its compatibility with RNA FISH, immunohistochemistry, and conventional fluorescence microscopy makes it a versatile tool for researchers and drug development professionals investigating complex 3D gene and protein expression patterns [31] [6].
Research Reagent Solutions
The following table catalogues the essential reagents used in the 3D-LIMPID-FISH protocol, along with their specific functions.
| Reagent Name | Function / Purpose |
|---|---|
| Paraformaldehyde (PFA) | Tissue fixation to preserve structure and biomolecules [33]. |
| Urea | A key component of the clearing solution, it contributes to tissue transparency [6] [33]. |
| Nycodenz/Iohexol | A contrast medium that adjusts the refractive index of the LIMPID solution to match that of high-NA objective lenses (e.g., ~1.515) [6] [33]. |
| SSC Buffer | A saline-sodium citrate buffer used in hybridization and washing steps for FISH, and as a base for SSC-LIMPID solutions [33]. |
| Formamide | A component in hybridization buffers that can be added to increase fluorescence intensity in FISH protocols [6]. |
| H2O2 (Hydrogen Peroxide) | Used for chemical bleaching of the tissue to reduce inherent autofluorescence [6]. |
| HCR Probes | Fluorescent in situ hybridization probes that utilize the Hybridization Chain Reaction for signal amplification, allowing for single-molecule RNA detection [6]. |
| DAPI | A fluorescent stain that binds to DNA, used for nuclear counterstaining [33]. |
LIMPID Experimental Workflow
The following diagram outlines the core procedural steps for the 3D-LIMPID-FISH protocol, from sample preparation to final imaging.
Troubleshooting Guides
Common LIMPID-FISH Issues and Solutions
Problem: Incomplete Tissue Clearing
- Potential Causes & Solutions:
- Cause 1: Insufficient incubation time in LIMPID solution. Solution: Increase clearing time. Smaller tissues (e.g., stage 20 quail embryos) may clear in 10 minutes, while larger ones (e.g., stage 36 quail brains) may require 24 hours [32].
- Cause 2: Incorrect refractive index of the LIMPID solution. Solution: Calibrate the solution using an Abbe refractometer. Adjust the refractive index by adding Nycodenz powder to increase it (up to ~1.57) or 50% (w/w) urea solution to decrease it (down to ~1.41) to match your objective lens [6] [33].
- Cause 3: The solution has crystallized due to evaporation. Solution: Ensure the solution is stored in a sealed container and avoid heating above 40°C during preparation. If crystals form, gently warm and add a small amount of water to redissolve [33].
Problem: High Background Autofluorescence
- Potential Causes & Solutions:
- Cause 1: Inherent tissue autofluorescence from components like lipofuscin, red blood cells, or collagen. Solution: Incorporate a bleaching step with H₂O₂ during sample preparation [6]. For persistent lipofuscin, consider a specialized quencher like TrueBlack applied before or after immunostaining [34].
- Cause 2: Autofluorescence from aldehyde fixation. Solution: Ensure the concentration and fixation time are optimized. Over-fixation can increase autofluorescence and reduce FISH signals [6].
- Cause 3: Nonspecific binding of probes. Solution: Use HCR probes with split initiator designs for high specificity and low background [6]. Optimize hybridization and wash buffer stringency.
Problem: Weak or Lost FISH Signal
- Potential Causes & Solutions:
- Cause 1: RNA degradation. Solution: Ensure all equipment and surfaces are treated with RNase decontamination reagents to prevent RNA degradation [33].
- Cause 2: Over-fixation. Solution: Reduce fixation time or introduce a protease treatment step to free up cross-linked molecules for better probe access [6].
- Cause 3: Probe leakage during clearing. Solution: The protocol is designed to minimize signal loss. However, ensure that the HCR amplification step is performed correctly and that the stained tissue is imaged within a week of amplification to preserve signal integrity [6].
Problem: Bubbles in Tissue or Mounting Medium
- Potential Causes & Solutions:
- Cause: Agitation or rapid mixing of solutions. Solution: During all incubation and mounting steps, handle samples gently to avoid introducing bubbles. If bubbles form during mounting, carefully press them away from the tissue with a fine tool [6].
Detailed Experimental Protocols
Synthesis of LIMPID Clearing Solution
The LIMPID solution is a key reagent for refractive index matching. The following diagram illustrates the two primary preparation paths.
Protocol: [33]
Prepare Base Solution:
- For H₂O-LIMPID, use 200 g of deionized MilliQ water.
- For SSC-LIMPID (used in FISH-compatible protocols), prepare 200 g of 2x or 5x SSC buffer.
Add Urea: Transfer the 200 g of base solution to a glass beaker. Weigh out 200 g of urea powder and gently add it to the beaker to create a ~50% (w/w) urea solution.
- Add a magnetic stir bar.
- Heat to 60°C with stirring until the urea is fully dissolved and the solution is transparent.
- Cool the solution.
Add Iohexol (Nycodenz): Transfer 300 g of the 50% urea solution to a new beaker. Weigh out 200 g of Nycodenz powder and add it to the beaker (resulting in a 2:3 ratio of iohexol to urea solution).
- Heat to 60°C and stir gently until all powder is dissolved. Note: This can take 3-6 hours.
- To prevent evaporation, wrap the beaker with parafilm. The solution can be left to dissolve overnight at room temperature.
Calibrate Refractive Index (RI):
- Use an Abbe refractometer to measure the RI of a small sample (~50 µL).
- The target RI depends on your microscope objective (e.g., 1.515 for a typical oil immersion lens) [6].
- To increase RI: Add more Nycodenz powder.
- To decrease RI: Add more 50% (w/w) urea solution.
- Use the calibration curve in the supplementary materials of the main protocol for rough estimates [33].
Whole-Mount 3D-LIMPID-FISH Protocol
Procedure: [6]
Sample Extraction and Fixation:
- Extract fresh tissue samples and fix them in 4% Paraformaldehyde (PFA) at 4°C overnight. Note: Fixation conditions should be optimized for specific tissue sizes and types.
Bleaching (Optional but Recommended):
- To quench tissue autofluorescence, bleach samples in H₂O₂. This step is crucial for improving the signal-to-noise ratio [6].
Fluorescence In Situ Hybridization (FISH):
- Hybridization: Incubate the fixed tissue with custom-designed HCR FISH probes in a hybridization buffer containing formamide.
- Washing: Remove unbound probes with multiple washes using a dedicated wash buffer.
- Amplification: Initiate the HCR amplification reaction by adding fluorescently labeled hairpin DNA to the tissue. For single-molecule resolution, limit the amplification time (e.g., 2 hours) [6].
Immunohistochemistry (Optional Co-staining):
Optical Clearing with LIMPID:
- Immerse the stained tissue sample in excess LIMPID solution.
- Incubate until the tissue is transparent. The time varies with tissue size (minutes for small embryos to hours for larger tissues) [32].
- The tissue is now ready for imaging.
3D Microscopy:
Frequently Asked Questions (FAQs)
Q1: What makes LIMPID different from other optical clearing methods? LIMPID is a simple, single-step, aqueous clearing method that preserves lipids. Unlike methods that remove lipids (which can be time-consuming and destroy structures) or use harsh organic solvents (which can shrink tissue and quench fluorescence), LIMPID uses a mild, water-soluble solution to match refractive indices. This preserves fluorescent signals from proteins, genetic reporters, and FISH probes while maintaining tissue morphology [31] [32].
Q2: Is LIMPID compatible with whole-mount tissues from animal models other than mice? Yes. A key advantage of LIMPID-FISH is the ease of creating custom FISH probes. The protocol has been successfully demonstrated with quail embryos, proving its utility for less common animal models where commercial antibody probes may not be readily available [31] [6].
Q3: Do I need a confocal or light-sheet microscope to use LIMPID? No. While LIMPID enables excellent imaging on advanced systems like confocal microscopes, it has also been shown to produce high-quality 3D images using conventional fluorescence microscopes. This makes the technique more accessible to labs without specialized imaging equipment [31].
Q4: What are the primary methods for reducing autofluorescence in whole-mount FISH? Within the LIMPID-FISH workflow, chemical bleaching with H₂O₂ is integrated as a standard step [6]. For particularly stubborn autofluorescence, especially from lipofuscin, additional treatments with dedicated quenching reagents like TrueBlack can be highly effective [34]. Alternatively, advanced photobleaching devices using high-power LEDs have been developed for highly efficient autofluorescence quenching while minimizing tissue damage [35].
Q5: Can the LIMPID protocol be combined with immunohistochemistry? Absolutely. A significant strength of the LIMPID method is its compatibility with co-labeling using antibody-based immunohistochemistry (IHC) and FISH probes. This allows researchers to concurrently visualize protein localization and mRNA expression within the same 3D tissue sample [31] [6].
Frequently Asked Questions (FAQ)
Q1: Can HCR be combined with immunofluorescence (IF) for simultaneous RNA and protein detection? Yes, HCR provides a unified framework for multiplexed RNA and protein imaging. The amplifiers (e.g., B1, B2, B3 or X1, X2, X3) and amplification buffers are interchangeable between HCR RNA-FISH and HCR IF kits. For a multiplex experiment, you would use a distinct HCR amplifier and fluorophore for each target RNA and each target protein [36] [37] [38].
Q2: What is the key advantage of using HCR over enzyme-based amplification methods like CARD-FISH? HCR offers several key advantages: it is an enzyme-free, isothermal amplification method that provides quantitative signal, preserves subcellular resolution, and enables straightforward multiplexing. Unlike CARD-FISH, which can suffer from signal diffusion and requires lengthy serial staining for multiple targets, HCR allows for simultaneous one-step amplification of all targets without compromising resolution or requiring sample degradation [39].
Q3: How can I reduce high autofluorescence in whole-mount samples before HCR-FISH? The OMAR (Oxidation-Mediated Autofluorescence Reduction) protocol is highly effective. It involves a photochemical bleaching step using high-intensity cold white light (e.g., high-power LED spotlights) in the presence of hydrogen peroxide and a basic solution. This treatment significantly reduces or eliminates tissue autofluorescence at the source, prior to hybridization, alleviating the need for extensive digital post-processing [2].
Q4: What are the simplest ways to boost a weak HCR signal? For optimal signal strength, consider the following adjustments:
- Increase Probe Concentration: For HCR v3.0, increasing the probe concentration from 4 nM to 20 nM is recommended [40].
- Extend Incubation Times: Implementing overnight incubations for both probe hybridization and amplification can significantly improve signal, especially in thicker samples [40].
- Use a Boosted Probe: If the target sequence is long enough, ordering a probe set with more initiator pairs (e.g., 30 or more) increases the number of binding sites and enhances signal [36] [40].
Troubleshooting Guides
Common Experimental Issues and Solutions
Problem: Poor or No Signal
| Potential Cause | Recommended Solution |
|---|---|
| Low-abundance target RNA | Use a boosted probe set with more initiator pairs (e.g., 30+ for dHCR imaging) [36]. |
| Inefficient hybridization/amplification | Increase probe concentration to 20 nM (for v3.0) and extend incubation times to overnight [40]. |
| Low signal in autofluorescent samples | Switch to a longer-wavelength fluorophore (e.g., 647 nm or 750 nm) where autofluorescence is typically lower [37]. For ultimate sensitivity, consider HCR Pro [40]. |
| Inefficient sample permeabilization | Optimize permeabilization conditions (e.g., concentration of Triton X-100, time, temperature) to balance probe access with morphology preservation [16]. |
Problem: High Background or Non-Specific Signal
| Potential Cause | Recommended Solution |
|---|---|
| Sample autofluorescence | Implement the OMAR photochemical bleaching protocol prior to hybridization [2]. |
| Non-specific probe binding | Increase the stringency of post-hybridization washes (e.g., adjust temperature, salt concentration) [16]. |
| Probe adsorption to abiotic particles (in environmental samples) | Modify hybridization buffer recipes and combine with sample pre-treatment methods (e.g., detachment, extraction) developed for complex samples like sediments [41]. |
| Incomplete removal of unbound probes | Ensure stringent post-hybridization washes are performed completely. Avoid shortened wash times [16]. |
Problem: Morphological Distortion or Cell Damage
| Potential Cause | Recommended Solution |
|---|---|
| Over-fixation | Optimize fixation conditions (e.g., paraformaldehyde concentration and time) to preserve nucleic acid integrity while maintaining morphology [16]. |
| Over-permeabilization | Titrate permeabilization agents (e.g., Triton X-100, proteinase K) to prevent damage to cellular structures [16]. |
Workflow Diagram: Integrated FISH-HCR with Autofluorescence Quenching
The diagram below illustrates the integrated workflow for combining whole-mount FISH with HCR amplification and autofluorescence quenching.
The Scientist's Toolkit: Key Research Reagent Solutions
The following table details essential reagents and their functions for implementing integrated FISH-HCR protocols with autofluorescence quenching.
| Reagent / Material | Function / Role in the Protocol |
|---|---|
| HCR HiFi Probe Sets | DNA probes designed to bind target mRNA; they contain initiator sequences that trigger the HCR amplification [37]. |
| HCR Gold Amplifiers | Fluorophore-labeled DNA hairpins that self-assemble into amplification polymers upon initiation, providing the detected signal [37]. |
| OMAR Solution (H₂O₂/NaOH) | A chemical mixture used in the photochemical bleaching step to oxidize and reduce endogenous fluorophores responsible for autofluorescence [2]. |
| High-Intensity LED Light Source | A critical hardware component for the OMAR protocol, providing the light energy required to drive the oxidative bleaching reaction [2]. |
| Probe Hybridization & Wash Buffers | Formulated solutions to create optimal conditions for specific probe binding and to remove unbound/non-specifically bound probes, minimizing background [37] [40]. |
| Permeabilization Agent (e.g., Triton X-100) | A detergent that disrupts lipid membranes to allow probes and amplifiers to access intracellular targets [2] [16]. |
| Cellular Counterstains (e.g., DAPI, SR2200) | Fluorescent dyes that label nuclei (DAPI) or cell walls (SR2200) to provide anatomical context and facilitate single-cell analysis [41] [42]. |
FAQs and Troubleshooting for Whole-Mount FISH
Q1: How can I reduce high background autofluorescence in my whole-mount embryonic tissues? High background is a common issue, often caused by sample autofluorescence or non-specific probe binding. To resolve this:
- Optimize Wash Stringency: Increase the temperature or reduce the salt concentration in your post-hybridization wash buffers. Using a washing solution containing DMSO and Triton X-100 can improve stringency [43].
- Employ Quenching Techniques: For highly autofluorescent species, specific fluorescence quenching protocols using LED illumination can be effective [44].
- Verify Probe Specificity: Check for any cross-reactivity of your probe with non-target sequences [16].
- Review Fixation: Avoid over-fixation with PFA, as this can increase autofluorescence and reduce target accessibility [16].
Q2: I am getting a weak or absent signal from dense 3D organ samples. What should I do? Poor signal penetration is a key challenge in 3D samples.
- Enhance Permeabilization: Ensure adequate permeabilization by optimizing the concentration, time, and temperature for agents like Triton X-100 or Proteinase K [16].
- Use Signal Amplification: Consider using the Hybridization Chain Reaction (HCR) FISH technique, which employs fluorescently labeled DNA hairpins to amplify the signal [45] [44].
- Check Clearing Efficacy: For whole-mount samples, ensure your clearing solution (e.g., ScaleS4) has been properly prepared and applied to make the sample transparent for light penetration [43].
- Increase Hybridization Time: A longer hybridization time may be necessary for probes to fully diffuse into thick tissues [16].
Q3: My samples show morphological distortion after the FISH procedure. How can I preserve tissue integrity? This often results from harsh processing conditions.
- Gentle Handling: Use gentler methods for tissue dissection and handling [16].
- Optimize Fixation and Permeabilization: Avoid over-fixation and over-permeabilization, which can damage cell structures. Standardize the timing and concentration of these steps [16].
- Use Humidified Chambers: Prevent sample drying during hybridization and incubation steps by using a properly sealed humidified chamber [16].
Detailed Experimental Protocols
Protocol 1: Whole-Mount Immunofluorescence and Clearing for 3D Organ Imaging
This optimized protocol for adult zebrafish spinal cords can be adapted for other 3D tissues like embryonic tissues and organs [43].
Key Resources
| REAGENT or RESOURCE | SOURCE | IDENTIFIER |
|---|---|---|
| Rabbit anti-GFP | Invitrogen | Cat# A6455 |
| Alexa Fluor 488 goat anti-rabbit IgG | Invitrogen | Cat# A11008 |
| 4% Paraformaldehyde (PFA) | Sigma-Aldrich | Cat#8.18715 |
| Triton X-100 | Sigma-Aldrich | Cat#T8787 |
| Dimethyl sulfoxide (DMSO) | VWR | Cat#VWRC0231 |
| Bovine serum albumin (BSA) | NZYtech | Cat#MB04602 |
| D-Sorbitol | Sigma-Aldrich | Cat#S6021 |
| Urea | Sigma-Aldrich | Cat#U1250 |
Methodology
- Dissection and Fixation: Dissect the target tissue (e.g., spinal cord) and fix immediately in 4% PFA at room temperature [43].
- Permeabilization and Blocking: Permeabilize tissues with a washing solution (1X PBS, 1% DMSO, 0.2% Triton X-100). Block non-specific sites with a whole-mount blocking solution (washing solution supplemented with 1% BSA) [43].
- Antibody Staining: Incubate with primary antibody (e.g., Rabbit anti-GFP at 1:500) diluted in blocking solution, followed by extensive washing. Then incubate with a fluorescently-labeled secondary antibody (e.g., Alexa Fluor 488 goat anti-rabbit IgG at 1:500–1,000) [43].
- Nuclear Labeling (Optional): Counterstain nuclei with DAPI or TO-PRO-3 iodide (1:1,000) [43].
- Tissue Clearing:
- Prepare ScaleA2 solution by dissolving urea in Milli-Q water, then adding glycerol and Triton X-100 [43].
- Prepare ScaleS4 solution by separately dissolving D-sorbitol (using gentle microwave heating) and urea (below 30°C) in Milli-Q water. Cool both to room temperature before mixing, then add glycerol, Triton X-100, and DMSO. Store at 4°C [43].
- Immerse the stained samples in ScaleS4 solution until they become transparent [43].
- Mounting and Imaging: Mount the cleared samples in ScaleS4 solution and image using a light sheet or confocal microscope [43].
Protocol 2: Addressing Autofluorescence via Fluorescence Quenching
This method is applicable to autofluorescent tissue sections, including neuronal and organ samples [44].
- Sample Preparation: Prepare tissue sections using standard histological methods.
- Quenching Treatment: Apply an LED illumination-based fluorescence quenching protocol tailored to the specific tissue type. The exact parameters (wavelength, duration) should be optimized for your sample [44].
- Proceed with FISH: After the quenching step, continue with your standard FISH or HCR FISH protocol [44].
Experimental Workflow and Signaling
Whole-Mount FISH & Clearing
Autofluorescence Troubleshooting Logic
The Scientist's Toolkit: Key Research Reagent Solutions
Table: Essential Reagents for Whole-Mount FISH and Autofluorescence Quenching
| Reagent | Function/Benefit |
|---|---|
| Paraformaldehyde (PFA) | Cross-linking fixative that preserves tissue morphology and nucleic acid integrity [43]. |
| Triton X-100 | Non-ionic detergent used to permeabilize cell and tissue membranes, allowing probe access [43] [16]. |
| Dimethyl sulfoxide (DMSO) | Added to washing and clearing solutions to enhance reagent penetration into thick tissues [43]. |
| Bovine Serum Albumin (BSA) | Used in blocking solutions to adsorb to and "block" non-specific binding sites, reducing background [43]. |
| Urea & Glycerol | Key components of Scale clearing solutions; they work together to reduce light scattering and render tissues transparent [43]. |
| D-Sorbitol | A component of the ScaleS4 clearing solution that helps match the refractive index of the tissue to the imaging medium [43]. |
| Hybridization Chain Reaction (HCR) Kits | A signal amplification method that uses DNA hairpins to dramatically enhance FISH signal, improving detection [45] [44]. |
| LED Quenching Systems | Specialized systems designed to reduce inherent tissue autofluorescence through targeted illumination prior to FISH staining [44]. |
This guide provides a detailed, step-by-step protocol for whole-mount RNA Fluorescence In Situ Hybridization (FISH), with a special emphasis on quenching tissue autofluorescence—a major challenge in fluorescence-based analysis. The following workflows, timetables, and troubleshooting FAQs are designed to help researchers and drug development professionals reliably obtain high-quality results from sample collection to final imaging.
■ Frequently Asked Questions (FAQs)
Q1: What is the single most effective method to reduce tissue autofluorescence before FISH? The most effective pre-treatment method is Oxidation-Mediated Autofluorescence Reduction (OMAR). This photochemical bleaching technique uses a high-intensity cold white light source, such as high-power LED spotlights or LED daylight panels (e.g., 20,000 lumen), to oxidize and bleach autofluorescent compounds in the tissue. This protocol consistently reduces and often eliminates tissue and blood vessel autofluorescence, thereby improving the signal-to-noise ratio for both whole-mount RNA-FISH and immunofluorescence. It alleviates the need for digital post-processing to remove autofluorescence [2].
Q2: My tissue is not permeabilizing effectively for probe penetration. What should I check? Ineffective permeabilization is often related to the fixation method. First, verify that you are using a detergent-based permeabilization step after the OMAR treatment. Second, ensure your sample is not over-fixed, as this can cause excessive cross-linking that impedes probe entry. The recommended fixation in 4% Paraformaldehyde (PFA) for 24 hours at 4°C provides a good balance between tissue morphology preservation and permeability [2] [46].
Q3: What is a critical stop point where I can safely pause my experiment? A critical and safe stopping point is after the sample fixation and methanol dehydration steps. Following fixation and rinses, you can transfer your samples to 100% methanol and store them at -20°C for several weeks without degradation [2].
■ Troubleshooting Guide
The table below outlines common issues encountered during the whole-mount FISH workflow, their potential causes, and recommended solutions.
| Problem | Possible Cause | Solution |
|---|---|---|
| High Background Autofluorescence | Incomplete OMAR bleaching; endogenous fluorophores (e.g., from blood vessels) [2]. | Ensure successful oxidation reaction (appearance of bubbles during treatment); validate LED light source efficacy in a test series [2]. |
| Poor or No Target Signal | Ineffective tissue permeabilization; degraded RNA probes; over-fixation [2] [47]. | Optimize detergent-based permeabilization step; check probe integrity and hybridization conditions; avoid prolonged fixation times [2]. |
| Tissue Morphology Damage | Over-digestion during proteinase treatment; physical damage during handling [46]. | Titrate proteinase K concentration and incubation time; handle samples gently with flame-rounded Pasteur pipettes to avoid damage [46]. |
| Uneven Staining or Imaging | Incomplete optical clearing; sample not properly immobilized for imaging [2]. | Follow the optical clearing protocol after RNA-FISH; ensure proper mounting of the sample for 2D and 3D image analysis [2]. |
■ Step-by-Step Protocol & Timetable
The following table provides a complete workflow from embryo collection to imaging, with estimated durations and critical stop points [2].
| Step | Procedure | Duration | Critical Stop Points & Notes |
|---|---|---|---|
| 1. Sample Collection & Fixation | Collect tissue (e.g., mouse embryonic limb buds) and fix immediately in 4% PFA. | ~24 hours | Critical Stop Point: After fixation, samples can be dehydrated in 100% methanol and stored at -20°C for several weeks [2]. |
| 2. OMAR Treatment | Perform photochemical bleaching in a controlled environment using a high-intensity LED light source. | ~4-6 hours | Monitor for the appearance of bubbles, which indicates a successful oxidation reaction [2]. |
| 3. Permeabilization | Treat tissue with a detergent-based solution (e.g., containing Tween-20) to enable probe entry. | ~2-4 hours | Optimization may be required for different tissues. Over-permeabilization can damage morphology [2]. |
| 4. RNA-FISH (HCR) | Hybridize with RNA probes, followed by washes and signal amplification using the HCR v3.0 system. | ~2 days | The HCR system is highly sensitive and reduces the number of embryos needed, aligning with 3R principles [2]. |
| 5. Optical Clearing | Render the sample transparent to reduce light scattering for deep-tissue imaging. | ~1-2 days | This step is crucial for high-quality 2D and 3D image analysis [2]. |
| 6. Imaging & Analysis | Mount samples and perform microscopy (e.g., confocal). Analyze images with software like ImageJ/Fiji or Imaris. | ~1 day | The protocol eliminates the need for post-processing to remove autofluorescence [2]. |
| Total Estimated Time | ~6-7 days |
■ Experimental Workflow Diagram
The diagram below visualizes the key stages of the whole-mount FISH protocol.
■ The Scientist's Toolkit: Key Research Reagent Solutions
This table lists essential reagents and their functions for the successful execution of the whole-mount FISH protocol with autofluorescence quenching.
| Reagent | Function in the Protocol | Key Details |
|---|---|---|
| Paraformaldehyde (PFA) | Cross-linking fixative | Preserves tissue morphology and stabilizes RNA for detection. A 4% solution is standard [2] [46]. |
| OMAR Solutions | Photochemical autofluorescence quenching | Utilizes hydrogen peroxide under high-intensity LED light to oxidize and bleach autofluorescent compounds [2]. |
| Detergents (Tween 20, Triton X-100) | Tissue permeabilization | Creates pores in tissue membranes, allowing FISH probes and amplifiers to enter cells [2]. |
| HCR v3.0 Probes & Amplifiers | RNA target detection and signal amplification | A proprietary, multiplexable system from Molecular Instruments for highly sensitive RNA detection with low background [2]. |
| Methanol | Dehydration and storage | Used for dehydrating samples after fixation. 100% Methanol at -20°C provides a stable medium for long-term sample storage [2]. |
| Optical Clearing Reagents | Tissue transparency | Reduces light scattering for improved deep-tissue imaging, often involving fructose/glycerol-based solutions [2]. |
Troubleshooting Autofluorescence Quenching: Optimization Strategies and Problem Resolution
In whole mount fluorescence in situ hybridization (FISH) research, autofluorescence presents a significant barrier to accurate signal interpretation. This technical support guide addresses the critical challenge of diagnosing insufficient quenching, a common issue that can compromise experimental validity. Autofluorescence arises from various endogenous sources, including aldehyde fixation, red blood cells, structural elements like collagen and elastin, and lipofuscin granules [29] [34]. When quenching is inadequate, this background signal can obscure specific FISH signals, leading to imaging artifacts and erroneous data analysis. This guide provides researchers with systematic troubleshooting methodologies to identify, address, and prevent these issues, thereby ensuring the reliability of whole mount FISH experiments in drug development and basic research contexts.
Troubleshooting Guide: Common Imaging Artifacts and Solutions
Problem: Persistent Background Fluorescence After Quenching
Description: Researchers observe broad-spectrum background fluorescence that interferes with signal detection, even after standard quenching protocols.
Diagnosis:
- Identify the source of autofluorescence by examining emission spectra.
- Aldehyde-induced fluorescence from fixation typically appears in blue-green wavelengths [34].
- Lipofuscin displays broad emission from green to far-red [34].
- Red blood cells and collagen/elastin networks create structured background patterns [29] [48].
Solutions:
- Apply targeted quenching reagents based on the autofluorescence source.
- For lipofuscin: Use TrueBlack Lipofuscin Autofluorescence Quencher or Sudan Black B [34] [48].
- For aldehyde fixation artifacts and non-lipofuscin sources: Use ReadyProbes Tissue Autofluorescence Quenching Kit or TrueVIEW [29] [48].
- Optimize application timing: Pre-treatment is preferred but requires avoiding detergents in subsequent steps [34].
Problem: Signal Degradation in Archived FISH Samples
Description: HER2 FISH signals, particularly CEP17 signals, degrade over time, affecting interpretation of archived specimens.
Diagnosis:
- Signal loss follows a non-linear pattern [49].
- CEP17 signals degrade faster than HER2 signals [49].
- Degradation correlates with storage conditions and time [49].
Solutions:
- Implement proper storage protocols: Store FISH slides at -80°C for long-term signal preservation [49].
- Establish retention policies: Cold storage preserves both HER2 and CEP17 signals for at least 4 years [49].
- Room temperature storage should be limited due to rapid signal degradation [49].
Problem: Shadow and Stripe Artifacts in Imaging
Description: Attenuation artifacts appear as shadows or stripes along light propagation paths, particularly in light sheet fluorescence microscopy (LSFM).
Diagnosis:
- Artifacts result from light absorption by pigmented or dense tissue regions [50].
- Shadows appear in two directions: from illumination path attenuation and emission path attenuation [50].
- Artifacts are most problematic for quantitative analysis and structural mapping [50].
Solutions:
- Implement computational correction using optical projection tomography (OPT) to map attenuation coefficients [50].
- Consider multi-view imaging systems to "see around" attenuating features [50].
- For LSFM specifically, explore scanning illumination or Bessel/Airy beams to reduce artifacts [51].
Frequently Asked Questions (FAQs)
Q1: Why does my tissue still show strong autofluorescence after using a quenching kit?
A1: Most quenching kits do not address all autofluorescence sources. The ReadyProbes Kit, for example, minimizes autofluorescence from aldehyde fixation, red blood cells, collagen, and elastin but does not quench natural pigments like lipofuscin [29]. Ensure you've selected the appropriate quencher for your specific tissue type and autofluorescence source. Combination approaches may be necessary for tissues with multiple autofluorescence sources.
Q2: Can I store mixed quenching reagents for later use?
A2: No. Once the three components of the ReadyProbes Tissue Autofluorescence Quenching Kit are mixed, the solution must be used within one hour and should not be refrigerated or frozen for later use [29] [52]. This ensures optimal quenching performance.
Q3: How critical is the order of component mixing for quenching reagents?
A3: The mixing order is essential for proper function. For the ReadyProbes Kit, you must first mix Component A with Component B, then add Component C [29]. Deviating from this sequence will compromise quenching efficiency.
Q4: What is the impact of detergents on quenching treatments?
A4: Detergents will wash away most quenching dyes. When using TrueBlack or Sudan Black B pre-treatment, all subsequent steps must be performed without detergent [34] [48]. If your protocol requires detergent, use a post-treatment quenching approach instead.
Q5: Why do my negative control samples still show signal after quenching?
A5: Inadequate quenching may not be the only issue. Consider whether your signal represents true autofluorescence or specific binding. Also, investigate potential probe self-fluorescence or non-specific binding. Ensure your quenching protocol is appropriate for your specific tissue type and fixation method.
Table 1: HER2 FISH Signal Degradation Based on Storage Conditions [49]
| Storage Condition | Storage Duration | CEP17 Signal Retention | HER2 Signal Retention | Interpretability |
|---|---|---|---|---|
| -80°C Freezer | Up to 4 years | High | High | Fully interpretable |
| Room Temperature | 5-10 years | Significant decrease | Moderate decrease | Potentially compromised |
| Room Temperature | >10 years | Very low | Low | Largely uninterpretable |
Table 2: Autofluorescence Quenching Reagent Comparison
| Reagent | Primary Targets | Application Timing | Tissue Examples | Limitations |
|---|---|---|---|---|
| TrueBlack | Lipofuscin, collagen, elastin, red blood cells | Pre or post-treatment | Human brain, retina | Less effective on non-lipofuscin sources |
| ReadyProbes Kit | Aldehyde fixation, red blood cells, collagen, elastin | Post-antibody steps | Various FFPE and frozen | Does not quench lipofuscin |
| Sudan Black B | Lipofuscin, various other sources | Post-treatment | Pancreas, kidney, brain | Fluoresces in red/far-red |
| TrueVIEW | Non-lipofuscin sources (aldehyde fixed) | Not specified | Kidney, spleen | Less effective on lipofuscin |
Experimental Protocols
Protocol 1: TrueBlack Lipofuscin Autofluorescence Quenching
Pre-treatment Protocol (Preferred):
- Deparaffinize and perform antigen retrieval on FFPE sections as needed.
- Permeabilize sections with detergent if required.
- Rinse slides in PBS.
- Prepare 1X TrueBlack solution by diluting the 20X stock 1:20 in 70% ethanol.
- Blot excess buffer from sections and place slides on a level staining rack.
- Cover each section completely with 50-100 µL of 1X TrueBlack solution.
- Incubate for 30 seconds.
- Rinse slides 3 times with PBS.
- Perform blocking, antibody incubations, and washes using detergent-free buffers.
- Mount slides in aqueous antifade mounting medium with or without DAPI [34].
Post-treatment Protocol (For Detergent-Required Protocols):
- Complete immunofluorescence staining according to your standard protocol.
- Prepare 1X TrueBlack solution as described above.
- After the final wash, blot excess buffer and apply 50-100 µL of 1X TrueBlack solution.
- Incubate for 30 seconds.
- Rinse slides 3 times with PBS.
- Mount slides in aqueous antifade mounting medium [34].
Protocol 2: ReadyProbes Tissue Autofluorescence Quenching
- Complete blocking, primary antibody, and secondary antibody incubation steps.
- Combine components A, B, and C of the kit in a 1:1:1 ratio.
- Critical: Mix components A and B together before adding component C.
- Apply the resulting solution to tissue for 2-5 minutes at room temperature.
- Do not store the mixed solution beyond one hour.
- Apply counterstains (e.g., nuclear stains) after quenching [29] [52].
Protocol 3: Sudan Black B Autofluorescence Quenching
- Prepare 0.3% Sudan Black B powder in 70% ethanol.
- Shake the solution overnight in the dark.
- Filter the solution before use.
- After immunolabeling, incubate tissue with Sudan Black B for 10-15 minutes (duration varies by tissue type).
- Complete subsequent washes without detergent to prevent dye removal [48].
Research Reagent Solutions
Table 3: Essential Materials for Autofluorescence Quenching
| Reagent/Kits | Primary Function | Key Applications |
|---|---|---|
| TrueBlack Lipofuscin Autofluorescence Quencher | Quenches lipofuscin granules and reduces background from collagen, elastin, and RBCs | Human brain, retina, and other tissues with lipofuscin |
| ReadyProbes Tissue Autofluorescence Quenching Kit | Minimizes autofluorescence from aldehyde fixation, RBCs, collagen, and elastin | FFPE and frozen tissues for IHC, ICC, IF, and ISH |
| Sudan Black B (Solvent Black 3) | Lipophilic dye that masks lipofuscin autofluorescence and other sources | Multiple tissue types including pancreas, kidney, brain |
| TrueVIEW Autofluorescence Quencher | Diminishes non-lipofuscin autofluorescence in aldehyde-fixed tissue | Kidney, spleen, and other non-lipofuscin rich tissues |
Diagnostic Workflow for Insufficient Quenching
The following diagram illustrates a systematic approach to diagnosing insufficient quenching issues in whole mount FISH experiments:
Diagram 1: Diagnostic workflow for identifying and addressing insufficient quenching in FISH experiments.
Advanced Considerations for Signal Interpretation
Correcting Attenuation Artifacts in Complex Samples
For thick samples imaged with light sheet fluorescence microscopy, attenuation artifacts create shadows that complicate signal interpretation. The OPTiSPIM approach combines optical projection tomography (OPT) with SPIM to correct these artifacts [50]. This method:
- Creates a 3D map of the sample's optical attenuation properties using transmission OPT [50]
- Computationally corrects both illumination and emission path attenuation based on the Beer-Lambert law [50]
- Requires path integrals for illumination correction and more complex triple integrals for detection correction [50]
Addressing Signal-to-Noise Artifacts in Ratiometric Imaging
In quantitative FISH analysis, low signal-to-noise ratios at tissue edges or thin regions can create artifactual ratio gradients [53]. The Noise Correction Factor (NCF) method:
- Subtracts a calculated NCF from the numerator only, rather than performing traditional background subtraction on both channels [53]
- Prevents division by noise-dominated values that create artifactual high ratios [53]
- Is particularly valuable when analyzing regions with varying tissue thickness or volume [53]
Effective diagnosis and correction of insufficient quenching requires systematic investigation of autofluorescence sources, application of targeted quenching strategies, and awareness of potential artifacts in signal interpretation. By implementing the troubleshooting guides, protocols, and diagnostic workflows presented in this document, researchers can significantly improve signal-to-noise ratios in whole mount FISH experiments, leading to more reliable data interpretation and more confident conclusions in both basic research and drug development applications.
Optimizing Quenching Concentration and Incubation Time for Different Tissue Thicknesses
In whole-mount fluorescence in situ hybridization (FISH) research, tissue autofluorescence (AF) presents a significant barrier to achieving high-quality, quantifiable results. AF arises from endogenous molecules like lipofuscin, flavins, and collagen, emitting broad-spectrum fluorescence that obscures specific FISH signals [54]. This technical guide provides evidence-based, optimized protocols for quenching AF, focusing on the critical parameters of quenching agent concentration and incubation time across diverse tissue thicknesses. Proper optimization of these parameters is essential for enhancing the signal-to-noise ratio, thereby ensuring the reliability of gene expression analysis in complex 3D tissue architectures.
Troubleshooting Guide: Quenching Agent Performance
Q1: Which quenching agents are most effective for whole-mount tissues, and how do their concentrations and incubation times vary?
The optimal quenching agent depends on the tissue type and the primary source of autofluorescence. The following table summarizes key performance data for widely used agents.
Table 1: Performance Comparison of Autofluorescence Quenching Agents
| Quenching Agent | Optimal Concentration | Effective Incubation Time | Key Tissue Considerations | Reported AF Reduction |
|---|---|---|---|---|
| TrueBlack Lipofuscin Autofluorescence Quencher | Diluted as per mfrs. protocol (e.g., 1X) [54] | 30 minutes [54] | Highly effective for lipid-rich tissues (e.g., adrenal cortex, brain); preserves specific signal and tissue integrity [54]. | 89% - 93% [54] |
| MaxBlock Autofluorescence Reducing Reagent | Diluted as per mfrs. protocol [54] | 30 minutes [54] | Broad efficacy across tissues; comparable performance to TrueBlack [54]. | 90% - 95% [54] |
| Sudan Black B (SBB) | 0.1% - 1.0% in 70% ethanol [54] | 30 minutes [54] | Can produce uneven staining; AF may persist in less-stained regions [54]. | ~82% - 88% [54] |
| OMAR (Oxidation-Mediated AF Reduction) | N/A (Photochemical bleaching) [17] | 1-2 hours [17] | A chemical bleaching step using hydrogen peroxide or similar agents, suitable for whole-mount embryonic tissues like mouse limb buds [17]. | N/A |
Q2: How should the quenching protocol be adjusted for different tissue thicknesses?
Thicker tissues require longer diffusion times for quenching agents and present greater challenges from light scattering, necessitating combined quenching and clearing strategies.
Table 2: Quenching Protocol Adjustments for Tissue Thickness
| Tissue Thickness | Recommended Quenching Protocol Adjustments | Compatible Clearing Methods | Expected Imaging Depth |
|---|---|---|---|
| Thin Sections (< 50 µm) | Standard incubation (e.g., 30 min) with TrueBlack or SBB is sufficient [54]. | Often not required for standard confocal imaging. | Full thickness [54]. |
| Mid-Range Thickness (50 - 300 µm) | Extend incubation time to 1-2 hours; ensure gentle agitation [55]. | LIMPID [6], CUBIC [55]. | Up to 150-250 µm post-clearing [6] [55]. |
| Thick/Whole-Mount Tissues (> 300 µm) | Combine chemical quenching (overnight incubation) with optical clearing; consider OMAR pretreatment [17] [6]. | LIMPID, CUBIC, or SDS-based clearing [17] [6] [56]. | Up to 500 µm or more with advanced microscopy [6]. |
Experimental Protocols for Optimal Quenching
Protocol 1: Standard Chemical Quenching for Tissues < 300 µm
This protocol is adapted from studies on adrenal cortex and myocardial tissues, effective for a range of tissue thicknesses [55] [54].
- Sample Fixation and Preparation: After whole-mount FISH procedures, fix tissues with 4% PFA and wash thoroughly with PBS or your standard buffer [54].
- Quenching Solution Preparation: Prepare a working solution of TrueBlack Lipofuscin Autofluorescence Quencher or 0.1-0.3% Sudan Black B (SBB) in 70% ethanol. Protect from light [54].
- Incubation: Immerse the tissue sample in the quenching solution.
- Washing: Rinse the tissue thoroughly with your standard buffer (e.g., PBS or 2x SSC) multiple times to remove any residual quenching agent [54].
- Mounting and Imaging: Proceed with optical clearing (if required) and mounting for microscopy imaging [6] [54].
Protocol 2: Integrated Quenching and Clearing for Thick Whole-Mount Tissues (> 300 µm)
For challenging thick tissues, a combination of bleaching, quenching, and clearing is most effective, as demonstrated in whole-mount mouse embryo and adult brain tissue studies [17] [6].
- Oxidation-Mediated Bleaching (OMAR): Following fixation, treat tissues with a photochemical bleaching solution (e.g., containing hydrogen peroxide) for 1-2 hours to oxidize and reduce autofluorescent compounds [17].
- Extended Chemical Quenching: After bleaching and washing, incubate tissues in a quenching agent like TrueBlack or SBB for several hours to overnight at 4°C with gentle agitation to ensure full penetration [6].
- Optical Clearing: Transfer the quenched tissue to a compatible optical clearing agent.
- LIMPID Method: Immerse tissue in the LIMPID solution (containing iohexol, urea, and SSC) until transparent. This method preserves lipids and is highly compatible with FISH signals [6].
- CUBIC Method: For myocardial and other tissues, incubate in CUBIC Reagent I for 12-24 hours for delipidation and clearing [55].
- Refractive Index Matching: For high-resolution imaging with oil-immersion objectives, fine-tune the refractive index of the clearing solution (e.g., by adjusting iohexol concentration in LIMPID) to match that of the objective lens (approximately 1.515) [6].
- 3D Imaging: Mount the cleared and quenched sample for imaging with confocal or light-sheet microscopy [6].
The following workflow diagram summarizes the key decision points for optimizing autofluorescence quenching based on your tissue properties.
The Scientist's Toolkit: Key Reagent Solutions
Table 3: Essential Reagents for Autofluorescence Quenching in Whole-Mount FISH
| Reagent / Kit Name | Primary Function | Key Considerations |
|---|---|---|
| TrueBlack Lipofuscin Autofluorescence Quencher | Quenches lipofuscin-based AF with high efficiency [54]. | Preserves specific fluorescence signals and tissue integrity; easy to use [54]. |
| MaxBlock Autofluorescence Reducing Reagent | Reduces broad-spectrum AF across tissue types [54]. | Shows performance comparable to TrueBlack [54]. |
| Sudan Black B (SBB) | A cost-effective chemical quencher for lipid-based AF [54]. | May require optimization to avoid uneven staining; use in ethanol [54]. |
| Hydrogen Peroxide (H₂O₂) | Key component in OMAR for oxidation-mediated bleaching of AF [17]. | Integral to a photochemical bleaching step rather than a simple incubation [17]. |
| LIMPID Solution | Aqueous optical clearing cocktail (iohexol, urea, SSC) [6]. | Preserves lipids and FISH signals; enables deep-tissue imaging via refractive index matching [6]. |
| CUBIC Reagents | Hydrophilic tissue clearing kits for delipidation and clearing [55]. | Effective for myocardial and other tissues; optimal incubation is 12-24 hours for Reagent I [55]. |
In whole mount fluorescence in situ hybridization (FISH), achieving a high signal-to-noise ratio is paramount. A significant challenge in this pursuit is managing tissue autofluorescence while simultaneously preserving the integrity and intensity of your fluorophore signals. This technical guide addresses the critical balance between effective quenching and fluorophore preservation, providing targeted troubleshooting and methodologies to help you resolve signal loss in your experiments.
Frequently Asked Questions (FAQs)
1. What is the fundamental difference between dynamic and static quenching, and why does it matter for my FISH protocol?
Dynamic and static quenching represent two distinct classes of mechanisms. Dynamic quenching occurs after a fluorophore has entered its excited state, meaning the quenching process interferes with emission from the excited state. A key hallmark is a measurable reduction in the fluorescence lifetime of the fluorophore. In contrast, static quenching prevents the formation of the emissive excited state from the outset, typically through the pre-formation of a non-fluorescent complex, and does not alter the observed fluorescence lifetime [57]. Understanding this distinction is crucial for diagnostics; lifetime measurements can help you identify the dominant quenching mechanism in your system, guiding your optimization strategy.
2. Beyond true quenching, what is a common "trivial" cause of signal loss I might be overlooking?
A frequent source of apparent signal loss is the inner-filter effect, a form of trivial quenching [57]. This is not a quenching mechanism but an artefact where the quencher either absorbs the excitation light before it reaches the fluorophore or absorbs the emitted fluorescence itself. You can diagnose this effect by looking for non-uniform quenching across your emission spectrum or by using fluorescence lifetime measurements, which are generally immune to such effects [57].
3. My whole-mount tissues have high autofluorescence. What are my options for reducing this background?
Several optical clearing methods can effectively reduce light scattering and autofluorescence in thick tissues. One effective method is the ClearSee treatment, which has been successfully applied to Arabidopsis roots, shoot apical meristems, and ovules to improve the signal-to-noise ratio for single-molecule RNA FISH [42]. Alternatively, the LIMPID protocol offers a single-step, aqueous clearing technique that is compatible with RNA FISH and preserves lipids and tissue structure well [6]. A third option is chemical bleaching with H~2~O~2~, a common step in immunohistochemistry and FISH protocols to eliminate autofluorescence [6].
4. How can I experimentally distinguish between dynamic quenching and static quenching?
The most direct method is to measure the fluorescence lifetime [57].
- In dynamic quenching, the excited state is depopulated, leading to a decrease in both fluorescence intensity and fluorescence lifetime.
- In static quenching, the emissive excited state is never formed, so the fluorescence intensity decreases, but the lifetime of the remaining fluorescent molecules remains unchanged. A comparison of Stern-Volmer plots from intensity (F~0~/F) and lifetime (τ~0~/τ) data will show a divergence for static or mixed quenching, while they will overlap for pure dynamic quenching [57].
Troubleshooting Guides
Troubleshooting Signal Loss and Background Issues
| Problem Identifier | Possible Cause | Recommended Solution |
|---|---|---|
| High autofluorescence and background, weak probe signals | Inefficient clearing, suboptimal pretreatment | Use validated optical clearing (e.g., ClearSee, LIMPID) [42] [6]. Store pre-treatment solutions at 2-8°C and maintain water bath at 98-100°C [58]. |
| A cloudy haze, inconsistent DAPI staining, reduced probe signal | Incomplete enzyme digestion, under-digestion | Slightly increase enzyme digestion time [58]. Perform digestion on a 37°C hotplate for consistent temperature [58]. |
| Tissue fragmentation, 'ghost' nuclei, loss of target signal | Over-digestion by enzyme | Decrease the enzyme digestion time [58]. After digestion, stain with DAPI and check under a microscope; over-digested cells should be <15% of the total [58]. |
| Absent or very weak probe signals | Insufficient denaturation, probe degradation | Calibrate hotplate/hybridizer to ensure correct denaturation temperature (e.g., 75°C for 5 mins, potentially increasing to 85°C for difficult specimens) [58]. |
| Excess paraffin in FFPE samples | Inadequate paraffin clearing | Ensure all paraffin is cleared with extra xylene washes over a longer period [58]. |
| Signal loss mistaken for quenching | Inner-filter effect (trivial quenching) | Check for changes in absorbance spectra. Use fluorescence lifetime measurements, which are immune to this effect, to confirm true quenching [57]. |
Optimizing Quenching Efficiency: An Experimental Workflow
The following diagram outlines a systematic workflow for diagnosing and addressing signal loss issues, helping you determine the correct optimization path.
Diagnosing Signal Loss Workflow
Detailed Methodology for Key Diagnostic Steps:
Measuring Fluorescence Lifetime: This is the most critical step for mechanism identification. Use time-correlated single photon counting (TCSPC) or a phase-modulation fluorometer. Prepare your sample as usual for FISH imaging. A decrease in lifetime concurrent with a drop in intensity confirms a dynamic process, while an intensity drop with stable lifetime points to static quenching [57].
Checking for Ground-State Complex Formation (Static Quenching): Record the absorbance spectrum of your fluorophore in the presence and absence of the quencher. A change in the absorbance profile suggests the formation of a ground-state complex. Note that excitation spectra can help differentiate these changes from inner-filter effects [57].
Checking for FRET (A Dynamic Mechanism): To evaluate FRET as a quenching mechanism, confirm three conditions: (1) The distance between fluorophore and quencher is between 1-10 nm, (2) There is significant spectral overlap between the fluorophore's emission and the quencher's absorbance, and (3) The decrease in fluorophore fluorescence lifetime matches the quenching of intensity [57].
Applying Optical Clearing (LIMPID Protocol): This hydrophilic method preserves lipids. After FISH staining, incubate the whole-mount tissue in the LIMPID solution (containing saline-sodium citrate, urea, and iohexol). The refractive index can be fine-tuned by adjusting the iohexol percentage to match your objective lens (e.g., 1.515), reducing aberrations and improving image quality deep within the tissue [6].
Optimizing Multiplexed FISH Performance
For advanced applications like multiplexed error robust FISH (MERFISH), protocol optimization is key to balancing signal brightness and background. The table below summarizes findings from a systematic investigation into improving MERFISH performance [59].
| Optimization Parameter | Tested Variable | Key Finding | Recommendation for FISH |
|---|---|---|---|
| Probe Design | Target region length (20, 30, 40, 50 nt) | Signal brightness depended weakly on length for regions of sufficient length [59]. | Prioritize 30-40 nt target regions for a good balance of specificity and assembly efficiency. |
| Hybridization | Method of encoding probe delivery | Changes in hybridization method can substantially enhance the rate of probe assembly [59]. | Explore alternative hybridization protocols to increase the speed and efficiency of probe binding. |
| Buffer & Reagents | Imaging buffer composition and stability | Reagent "aging" during multi-day experiments can decrease performance [59]. | Use fresh buffers and consider stabilizers. New buffer formulations can improve fluorophore photostability. |
| Background Reduction | Specificity of readout probes | Readout probes can bind non-specifically in a tissue-specific manner, raising background [59]. | Pre-screen readout probes against your sample type to identify and eliminate problematic sequences. |
The Scientist's Toolkit: Key Research Reagents
| Item | Function in Quenching/Autofluorescence Reduction | Example/Application |
|---|---|---|
| ClearSee | A hydrophilic optical clearing agent that reduces tissue autofluorescence and light scattering, compatible with FISH in plant tissues [42]. | Used in whole-mount smFISH on Arabidopsis roots and shoot apical meristems to detect PP2A and GAPDH mRNAs [42]. |
| LIMPID Solution | A single-step, aqueous optical clearing medium using SSC, urea, and iohexol for refractive index matching. Preserves lipids and FISH probes [6]. | Enables high-resolution 3D imaging of RNA and protein co-localization in thick mouse brain slices (250 μm) [6]. |
| Formamide | A chemical denaturant used in hybridization buffers. It helps balance probe assembly efficiency and specificity by modulating stringency [59]. | Concentration is optimized (e.g., with a fixed 37°C temperature) based on FISH probe length to maximize signal-to-noise [59]. |
| RNase A | An enzyme that degrades single-stranded RNA. Used as a critical negative control to confirm the specificity of FISH signals [42]. | Treatment of a sample should abolish punctate FISH signals, verifying that they originate from RNA and not background autofluorescence [42]. |
| Encoding Probes | Unlabeled DNA probes containing a target-specific region and a barcode region. They form the foundation for multiplexed FISH readout schemes [59]. | In MERFISH, these are hybridized to cellular RNA first, and their barcodes are read out in successive rounds with fluorescent readout probes [59]. |
Troubleshooting Guides
Tissue Shrinkage and Swelling
| Problem Description | Primary Cause | Recommended Solution | Key Parameters & Expected Outcome |
|---|---|---|---|
| Significant tissue shrinkage and hardening, leading to poor probe penetration. | Use of harsh organic solvents or excessive concentrations of delipidating detergents like Sodium Dodecyl Sulfate (SDS), which aggressively strip lipids and dehydrate tissue [60]. | Replace SDS with a milder detergent like Sodium Cholate (SC) in clearing and hybridization buffers. SC has a lower aggregation number and forms smaller micelles, enabling effective delipidation with better tissue structure preservation [60]. | Detergent Concentration: 10% (w/v) SC [60]. Outcome: Improved structural integrity and transparency while preserving protein epitopes and fluorescent signals. |
| Tissue swelling and loss of morphological fidelity. | Osmotic imbalance or overly aggressive permeabilization disrupting the extracellular matrix [17]. | Optimize permeabilization by using a balanced combination of detergents (e.g., Triton X-100) and protease inhibitors. For whole-mount samples, a photochemical bleaching step can also aid in permeabilization without damage [17]. | Permeabilization Solution: 2% (v/v) Triton X-100 [60]. Outcome: Maintained tissue architecture with sufficient permeability for probes and antibodies. |
Autofluorescence and Background Noise
| Problem Description | Primary Cause | Recommended Solution | Key Parameters & Expected Outcome |
|---|---|---|---|
| High levels of tissue autofluorescence, obscuring specific FISH signals, particularly in formalin-fixed tissues. | Endogenous fluorophores (e.g., lipofuscin, collagen) and fluorescent products induced by aldehyde-based fixatives like formalin [61]. | Implement Oxidation-Mediated Autofluorescence Reduction (OMAR). This photochemical bleaching step uses light irradiation in the presence of an oxidizing agent to quench autofluorescence prior to hybridization [17]. | Protocol: Follow established OMAR workflow [17]. Outcome: Significant reduction of background autofluorescence, eliminating the need for extensive digital post-processing. |
| Specific fluorescent signal is quenched along with autofluorescence. | The autofluorescence quenching method is too aggressive and damages the target epitopes or fluorescent labels [61]. | Avoid chemical quenchers like Sudan Black B for sensitive targets, as it can mask specific signals. Prioritize gentle physical quenching methods like OMAR or switch to frozen tissue sections when possible [61]. | Recommendation: Test quenching methods on control tissues. For FFPE poultry tissues, frozen sections are recommended due to the ineffectiveness of common chemical quenchers [61]. |
Poor Probe Penetration and Hybridization
| Problem Description | Primary Cause | Recommended Solution | Key Parameters & Expected Outcome |
|---|---|---|---|
| Weak or non-uniform FISH signal in whole-mount or thick tissue sections. | Inefficient penetration of encoding or readout probes due to dense tissue matrix or insufficient clearing [59] [60]. | Use a refractive index (RI) matching solution containing urea and sorbitol (e.g., OptiMuS). Urea disrupts hydrogen bonds for hyperhydration, while sorbitol provides gentle clearing, collectively enhancing probe diffusion [60]. | RI Solution: 4 M Urea, 10% D-sorbitol [60]. Outcome: Deeper probe penetration and brighter, more uniform single-molecule signals throughout the tissue volume. |
| Low signal-to-noise ratio in MERFISH and multiplexed FISH. | Suboptimal hybridization efficiency of encoding probes or non-specific binding of readout probes [59]. | Systematically optimize hybridization conditions (e.g., formamide concentration, temperature) and buffer composition. Pre-screen readout probes against the sample to identify and mitigate tissue-specific non-specific binding [59]. | Optimization: Screen formamide concentrations (e.g., 10-60%) at 37°C [59]. Outcome: Increased assembly efficiency of probes onto target RNAs, leading to brighter specific signals and reduced false positives. |
Frequently Asked Questions (FAQs)
Q1: What is the most critical factor to balance when choosing a delipidation detergent for tissue clearing? The most critical balance is between clearing efficacy and tissue integrity. Harsh detergents like SDS clear quickly but damage tissue and proteins. Milder alternatives like Sodium Cholate (SC) clear effectively while preserving structural and molecular information, which is crucial for downstream FISH and immunofluorescence analysis [60].
Q2: My whole-mount embryo samples have high background fluorescence. What is the most effective first step to address this? The most effective first step is to incorporate an Oxidation-Mediated Autofluorescence Reduction (OMAR) treatment into your fixation and permeabilization protocol. This method directly quenches autofluorescence at the source before you begin the FISH procedure, providing a cleaner baseline than digital subtraction post-imaging [17].
Q3: Can I use the same autofluorescence quenching protocol for all tissue types? No, quenching protocols are not universally applicable. The efficacy of chemical quenchers varies significantly by species and tissue type. For example, in formalin-fixed chicken tissues, common quenchers either failed or abolished specific signals, making frozen sections the only viable option. Always validate your quenching method on your specific tissue model [61].
Q4: Why is my probe signal weak in the center of thick tissue sections even after long hybridization times? This indicates a penetration issue. For thick tissues, passive clearing alone may be insufficient. Employ a combined approach using a mild detergent like SC for delipidation and a hyperhydration agent like urea in your RI-matching solution. This strategy enhances tissue transparency and creates pathways for probes to diffuse deeply into the tissue core [60].
Q5: How can I improve the performance and longevity of my MERFISH reagents during a multi-day experiment? Reagent "aging" can degrade performance. Explore protocol modifications related to buffer storage and composition. Using optimized imaging buffers can improve fluorophore photostability and effective brightness. Additionally, simple steps like changing the clearing or hybridization solution once a day can maintain reagent efficacy throughout long experiments [59].
Research Reagent Solutions
The following table details key reagents for maintaining tissue integrity and achieving high-quality results in whole-mount FISH.
| Reagent | Function in Protocol | Key Benefit |
|---|---|---|
| Sodium Cholate (SC) [60] | A mild, bile salt detergent used for delipidation in tissue clearing. | Preserves tissue architecture and protein epitopes better than SDS due to smaller micelle size and non-denaturing properties. |
| Urea [60] | A component of refractive index (RI) matching and clearing solutions. | Acts as a hyperhydration agent by disrupting hydrogen bonds, reducing light scattering, and improving probe penetration. |
| OMAR Reagents [17] | A photochemical bleaching treatment for autofluorescence reduction. | Quenches endogenous fluorescence prior to hybridization, eliminating the need for digital post-processing and preserving signal integrity. |
| PNA FISH Probes [62] | Synthetic peptide nucleic acid probes used for hybridization. | The electrically neutral backbone provides higher binding affinity and specificity, allowing for faster hybridization and lower background than DNA probes. |
| Hybridization Buffer (with formamide) [59] [62] | A standardized solution for probe hybridization. | The chemical denaturant (formamide) balance is critical for controlling stringency, which maximizes specific binding and minimizes off-target hybridization. |
| Anti-Dye Antibodies [63] | Primary antibodies that recognize specific fluorophores or haptens. | Enable powerful signal amplification via tyramide signal amplification (TSA), useful for detecting low-abundance targets in multiplexed experiments. |
Experimental Workflows and Signaling Pathways
Whole-Mount FISH with Tissue Integrity Preservation Workflow
This diagram illustrates the optimized integrated workflow for whole-mount FISH, incorporating key steps to prevent tissue damage.
Signaling Pathways in Early Development for FISH Analysis
This diagram outlines key signaling pathways whose activity can be studied using the optimized FISH protocol, showing their main regulators and outcomes.
FAQ: Addressing Autofluorescence in Whole Mount FISH
Why is autofluorescence obscuring my RNA FISH signal, and how can I reduce it?
Most cells and tissue types have natural autofluorescence that is more pronounced in the green region of the visible spectrum. This broad emission can span the visible spectrum, obscuring true FISH signals [64].
Solutions include:
- Fluorophore Selection: Use longer-wavelength fluorophores such as Quasar 570/670 or CAL Fluor Red 610. The signal from shorter wavelength dyes, like fluorescein (emission near 520 nm), is more difficult to distinguish from background autofluorescence [64].
- Fixation Method: The degree of autofluorescence depends on your fixation method. Formaldehyde tends to cross-link fluorescent enzyme co-factors, whereas fixation with methanol/acetic acid tends to release and wash them away. Prolonged fixation at elevated temperatures tends to exacerbate autofluorescence [64].
- Imaging Controls: Perform a "no probe control" by imaging a second sample in parallel that has not undergone probe hybridization. This helps assess the overall background and autofluorescence [64]. You can also collect light in a secondary, unused filter channel to confirm your RNA signal is only present with the correct excitation [64].
How can I achieve high multiplexing while ensuring strong, specific signals?
Advanced methods combine robust probe design with signal amplification to enable highly multiplexed experiments. Key strategies include:
Probe Design for Specificity:
- π-FISH Probes: Utilize primary probes containing 2–4 complementary base pairs in the middle region, allowing them to form a stable π-shaped bond. This design increases hybridization efficiency and specificity compared to traditional split probes [65].
- Tetrahedral DNA Dendritic Nanostructures (TDDN): Employ a modular, enzyme-free system where self-assembling DNA nanostructures provide exponential signal amplification. This method is rapid (~1 hour post-hybridization) and generates high signal intensity with minimal primary probes [66].
Combinatorial Coding:
- Use a cyclic encoding-decoding framework. By combining a limited number of fluorescent colors in different patterns across multiple hybridization rounds, you can uniquely identify dozens to hundreds of RNA species [66]. For example, four fluorescent colors can generate 15 unique barcodes in a single round [65].
What are the common causes of high background or non-specific signal, and how can I fix them?
High background often stems from incomplete washing, non-specific probe binding, or suboptimal hybridization conditions [16].
Troubleshooting strategies:
- Optimize Washes: Increase the stringency of your post-hybridization washes by adjusting the temperature, salt concentration, and duration. Gradually increasing stringency removes weaker, non-specific interactions [16] [67].
- Check Probe Concentration: Overly high probe concentration can lead to non-specific binding. Titrate your probe to find the optimal concentration that provides a strong specific signal with minimal background [16].
- Verify Hybridization Conditions: Carefully tune hybridization temperature (typically 55–62°C) and the composition of your hybridization buffer (e.g., formamide concentration) to ensure specificity [67].
- Ensure Proper Permeabilization: Incomplete permeabilization traps unbound probes, while over-permeabilization damages morphology. Optimize the concentration, time, and temperature for agents like Triton X-100 or proteinase K [16].
Troubleshooting Guide: Maintaining Signal-to-Noise in Multiplexed FISH
This guide addresses the most frequent issues encountered when running multiplexed FISH assays.
Poor or Weak Signal
| Problem | Possible Cause | Solution |
|---|---|---|
| Poor/No Signal [16] | Inefficient probe design or labeling. | Check probe design and labeling efficiency. For DNA probes, verify fragment size is 100-250 bp [67]. |
| Inadequate denaturation of target or probe. | Optimize denaturation conditions (e.g., 75°C for 5 mins; may increase to 85°C for difficult specimens) [68]. | |
| Insufficient permeabilization. | Optimize permeabilization conditions (agent concentration, time, temperature) [16]. | |
| Weak/Faded Signal [16] | Photobleaching from light exposure. | Use an antifade mounting medium and minimize light exposure during imaging [67]. |
| Signal amplification insufficient for target. | Employ enzymatic or enzyme-free signal amplification methods like HCR, TDDN, or π-FISH [66] [65]. | |
| Over-fixation or over-permeabilization. | Avoid over-fixation (>24 hours) and optimize permeabilization to preserve nucleic acids and cell structure [67]. |
High Background and Autofluorescence
| Problem | Possible Cause | Solution |
|---|---|---|
| High Background [16] | Low stringency washes. | Increase wash stringency (temperature, decrease salt concentration) and duration [16] [67]. |
| Probe cross-reactivity or concentration too high. | Check probe specificity and titrate to optimal concentration. Include Cot-1 DNA in hybridization to block repetitive sequences [67]. | |
| Incomplete clearing of paraffin (FFPE). | Ensure complete dewaxing with fresh xylene washes [68]. | |
| Autofluorescence [64] [68] | Natural tissue properties (e.g., lipofuscin). | Use longer-wavelength fluorophores (e.g., Quasar 670) [64]. |
| Fixation with formaldehyde. | Consider methanol/acetic acid fixation where applicable to wash away fluorescent co-factors [64]. | |
| Enzyme over-digestion. | Decrease enzyme digestion time; after digestion, check with DAPI. Over-digested cells should be <15% of total [68]. |
Experimental Protocols for Advanced Multiplexing
Protocol 1: π-FISH Rainbow for Multiplexed Target Detection
This protocol enables highly efficient, multiplexed detection of RNA/DNA with high signal intensity and low background [65].
- Probe Design: Design primary "π-FISH target probes" containing 2-4 complementary base pairs in the middle region to form a stable π-shaped structure.
- Sample Preparation: Fix samples appropriately (e.g., fresh frozen or FFPE sections). For FFPE, ensure optimal dewaxing and permeabilization.
- Hybridization: Hybridize the π target probes to the prepared sample.
- Signal Amplification:
- Apply secondary U-shaped amplification probes.
- Apply tertiary U-shaped amplification probes.
- Fluorescence Visualization: Hybridize with fluorescent signal probes. For multiplexing, use combinations of up to 4 fluorophores to generate unique color codes for different targets in a single round.
- Imaging and Decoding: Image the sample and decode the multiplexed signals based on the fluorescent color combinations.
Protocol 2: TDDN-FISH for High-Speed, Sensitive RNA Detection
This enzyme-free protocol uses DNA nanostructures for rapid, powerful signal amplification, ideal for detecting short RNAs and for high-throughput applications [66].
- Nanostructure Assembly: Pre-assemble the Tetrahedral DNA Dendritic Nanostructure (TDDN) via a layer-by-layer self-assembly of T0 (core), T1 (Shell-1), and T2 (Shell-2) monomers functionalized with sticky ends.
- Primary Probe Hybridization: Hybridize a bifunctional primary probe to the cellular mRNA target. The probe has a target-specific sequence and a readout sequence.
- TDDN Attachment: Introduce the pre-assembled TDDN to the sample. The TDDN binds to the readout sequence of the primary probe via complementary sticky ends.
- Rapid Imaging: Image the sample using a confocal microscope. The dendritic amplification provides strong signals, enabling short imaging times (~1 hour post-hybridization).
Research Reagent Solutions
| Reagent / Material | Function / Explanation | Reference |
|---|---|---|
| Quasar 670 / CAL Fluor Red 610 | Long-wavelength fluorophores that help discern true signal from green-region autofluorescence. | [64] |
| Methanol/Acetic Acid Fixative | Preferable to formaldehyde for reducing autofluorescence; releases and washes away fluorescent enzyme co-factors. | [64] [67] |
| Tetrahedral DNA Dendritic Nanostructure (TDDN) | Enzyme-free, self-assembling DNA nanostructure that provides exponential signal amplification for high sensitivity and speed. | [66] |
| π-FISH Target Probes | Primary probes with complementary base pairs for stable π-shaped bonding, increasing hybridization efficiency and specificity. | [65] |
| Cot-1 DNA | Included in hybridization buffer to block non-specific hybridization to repetitive DNA sequences, reducing background. | [67] |
| Antifade Mounting Medium | Preserves fluorescence and reduces photobleaching during microscopy and storage. | [16] [67] |
| Protease (e.g., Pepsin) | Enzyme used for controlled permeabilization of samples, particularly tissues, to allow probe access while preserving morphology. | [67] [68] |
| Formamide | Component of hybridization buffer that allows hybridization to occur at lower, morphology-preserving temperatures. | [67] |
Workflow: Autofluorescence Troubleshooting
The following diagram outlines a logical pathway for diagnosing and resolving autofluorescence in FISH experiments, integrating key strategies from this guide.
Method Validation and Comparative Analysis: Performance Metrics Across Techniques and Tissues
Troubleshooting Guides
FAQ: Addressing Autofluorescence in Whole-Mount FISH
Q: What are the primary sources of autofluorescence in whole-mount samples, and how can they be effectively reduced prior to imaging?
A: Tissue autofluorescence originates from various endogenous molecules, such as those in blood vessels and specific tissue types. It poses a significant challenge for high-sensitivity RNA-FISH detection by reducing the signal-to-noise ratio (SNR). A highly effective pre-treatment method is Oxidation-Mediated Autofluorescence Reduction (OMAR). This protocol combines photochemical bleaching using a high-intensity cold white light source (e.g., high-power LED spotlights or 20,000-lumen LED panels) in the presence of reagents to oxidize fluorophores causing autofluorescence. Successful treatment is indicated by the appearance of bubbles in the solution during illumination. This method consistently reduces or eliminates autofluorescence prior to probe hybridization, alleviating the need for digital post-processing and significantly improving SNR for both whole-mount RNA-FISH and immunofluorescence [2].
Q: How can I optimize my fluorescence microscope settings to maximize the SNR for quantitative imaging?
A: Maximizing SNR requires a systematic approach to both hardware settings and sample handling. A framework based on the SNR model involves characterizing and minimizing all noise sources [69]:
- Camera Noise: Verify and minimize contributions from readout noise, dark current, and clock-induced charge (for EMCCD cameras). These parameters can be measured by isolating each noise source.
- Optical Path: Introduce secondary emission and excitation filters to reduce excess background noise from the light source or ambient light.
- Acquisition Protocol: Introduce a wait time in the dark before fluorescence acquisition to allow for the decay of transient fluorescent states. Experimentally, this holistic approach can improve SNR by up to 3-fold, bringing it near the theoretical maximum permitted by the camera [69].
Q: Can computational methods improve image quality after acquisition, and how can I control for potential artifacts?
A: Yes, deep-learning-based denoising methods like Noise2Void (n2v) can effectively reconstruct images acquired with lower SNR, for instance, at high speeds or with low exposure times. This allows for a trade-off, such as tripling acquisition speed while maintaining usable image quality. However, these methods can introduce errors. A quality-controlled two-phase acquisition protocol is recommended [70]:
- Assessment Phase: For each sample position, acquire a small set of high-quality reference images (using a longer exposure time,
t_ref) alongside the planned low-quality images (with a short exposure time,t_exp). - Time-lapse Phase: Acquire the full time-lapse dataset using only the low-quality/high-speed settings (
t_exp). Use the paired images from the first phase to train the n2v network and to validate the quality of the reconstructed images using metrics like the Structural Similarity Index (SSIM) and Fourier Ring Correlation (FRC), which assesses effective resolution. This workflow ensures that reconstruction artifacts are identified and managed [70].
Q: What quality control measures are critical for ensuring the accuracy of a diagnostic FISH test?
A: Rigorous quality assurance/quality control (QA/QC) is essential for reliable clinical FISH results, even in the era of next-generation sequencing. Following established guidelines (e.g., from ACMGG) is critical. Key measures include [71]:
- Probe Validation: For each new probe lot, perform probe localization to confirm it hybridizes to the correct chromosomal band (e.g., BCR to 22q11.2 and ABL1 to 9q34). This is often confirmed using DAPI banding and inverted G-banding.
- Performance Metrics: Establish the sensitivity and specificity of the FISH probe using normal control samples. Standards typically require a probe sensitivity of ≥95% and specificity of ≥98%.
- Ongoing Controls: Implement a continuous quality improvement system, including standardized operating procedures (SOPs), regular equipment maintenance, and staff training.
Experimental Protocols for Key Techniques
Protocol 1: OMAR for Autofluorescence Reduction in Whole-Mount Samples
This protocol is designed for mouse embryonic limb buds but is applicable to other tissues and vertebrate embryos [2].
- Key Reagents: Paraformaldehyde, Hydrogen Peroxide, Methanol, Tween 20.
- Equipment: High-intensity cold white light source (e.g., flexible arm LED spotlights or 20,000 lumen LED panels), glass vials, nutator.
- Procedure:
- Collect and fix embryos using standard methods (e.g., 4% PFA).
- Photochemical Bleaching:
- Transfer samples to a glass vial containing a freshly prepared bleaching solution (e.g., hydrogen peroxide in a suitable buffer).
- Illuminate the sample for a predetermined time (e.g., 1-2 hours) using the high-intensity LED source. The appearance of bubbles indicates an active oxidation reaction.
- Protect the vial from ambient light and place it on a nutator for gentle agitation.
- Wash the samples thoroughly after bleaching.
- Permeabilize the tissue using a detergent-based solution (e.g., Tween 20).
- Proceed with standard whole-mount RNA-FISH (e.g., using HCR v3.0) or immunofluorescence protocols.
- Perform optical clearing of the samples prior to imaging.
Protocol 2: Quality-Controlled Denoising for High-Speed Live-Cell Imaging
This workflow enables reliable denoising for time-lapse experiments where acquisition speed is critical [70].
- Key Software: Noise2Void or similar self-supervised denoising algorithm, ImageJ/Fiji.
- Procedure:
- Two-Phase Acquisition at each sample position:
- Phase A (Assessment): Acquire one low-quality image (with desired short exposure time,
t_exp), followed by two high-quality reference images (with longer exposure time,t_ref), and finally two more low-quality test images (t_exp). - Phase B (Time-lapse): Acquire the entire time-series using only the low-quality/high-speed settings (
t_exp).
- Phase A (Assessment): Acquire one low-quality image (with desired short exposure time,
- Network Training & Validation:
- Use the paired high-quality and low-quality images from Phase A to train a denoising network (like n2v) specific to your sample and acquisition settings.
- Denoise the low-quality test images from Phase A and compare them to the high-quality reference images using SSIM and FRC metrics.
- Time-Series Processing:
- If the validation in step 2 confirms high structural reliability and acceptable effective resolution, apply the trained network to denoise the entire time-lapse dataset from Phase B.
- Two-Phase Acquisition at each sample position:
The table below summarizes key quantitative metrics from the cited research for easy comparison.
Table 1: Quantitative Performance Metrics for SNR and Resolution Enhancement Techniques
| Technique / Technology | Key Performance Metric | Reported Improvement / Value | Application Context |
|---|---|---|---|
| OMAR Autofluorescence Reduction [2] | Signal-to-Noise Ratio (SNR) | Eliminates endogenous autofluorescence, enabling high-sensitivity detection without post-processing. | Whole-mount RNA-FISH and immunofluorescence on mouse embryonic limb buds. |
| Microscope SNR Optimization Framework [69] | Signal-to-Noise Ratio (SNR) | 3-fold improvement in SNR by minimizing background noise and verifying camera parameters. | Quantitative single-cell fluorescence microscopy (QSFM). |
| Deep-Learning Denoising (Noise2Void) [70] | Acquisition Speed / Effective Resolution | Acquisition speed tripled (2-s time resolution) while maintaining 350 nm lateral resolution in live zebrafish embryos. | High-speed time-lapse imaging of RNA polymerase II clusters. |
| Compressed Pulse Weighting Method (CPWM) [72] | Penetration Depth & Image Quality | 32.42% increase in penetration depth, 9.48 dB improvement in SNR, and 0.13 mm improvement in axial resolution. | 12-MHz Endoscopic Ultrasound (EUS) imaging. |
| Terahertz Metamaterial Biosensor [73] | Detection Limit | Approximately 1 x 10^5 cells/mL for cancer cells (HSC3); 5 mg/L for carbendazim. | Label-free detection of biomarkers and chemicals. |
Research Reagent Solutions
Table 2: Essential Reagents and Materials for Featured Experiments
| Item | Function / Application | Example / Note |
|---|---|---|
| High-Intensity LED Light Source | Provides illumination for the OMAR photochemical bleaching reaction. | 20,000 lumen LED panels or high-power LED spotlights [2]. |
| Hydrogen Peroxide | Key oxidizing reagent in the OMAR protocol for quenching autofluorescence. | Used in a specific concentration within the bleaching solution [2]. |
| HCR RNA-FISH Probe Sets | Target-specific probes for detecting mRNA transcripts in whole-mount samples. | Available from Molecular Instruments (e.g., for Hand2, Shh, Sox9) [2]. |
| HCR Amplifiers | Fluorescently labeled DNA hairpins that amplify the signal from bound HCR probes. | Available in multiple fluorophore channels (e.g., B1 514, B2 594, B4 647) [2]. |
| Optical Clearing Agents | Reduce light scattering in thick tissues, improving penetration and image clarity. | Reagents that replace water in the sample to improve transparency for imaging [73] [2]. |
| Commercial FISH Probes (e.g., Vysis BCR-ABL1 ES) | Validated probes for clinical cytogenetic diagnosis and quality control. | Designed to detect specific gene fusions; require localization and sensitivity validation [71]. |
Experimental Workflow and Signaling Pathways
Diagram 1: OMAR and RNA-FISH Experimental Workflow
Diagram 2: SNR Optimization Pathway for Microscopy
Autofluorescence is a significant challenge in fluorescence microscopy, particularly in fluorescence in situ hybridization (FISH) experiments. This background interference can obscure specific signals from labeled probes, complicating data analysis and interpretation. Effective quenching methods are therefore essential for obtaining reliable, high-quality images in whole mount FISH research. This technical support center provides a comparative analysis of modern and traditional autofluorescence quenching agents, specifically focusing on TrueBlack Lipofuscin Autofluorescence Quencher versus traditional alternatives like cupric sulfate and SDS treatment. We present troubleshooting guidance, experimental protocols, and quantitative data to assist researchers in selecting and optimizing quenching methods for their specific applications.
Quantitative Comparison of Quenching Agents
The efficacy of autofluorescence quenching agents varies significantly based on their chemical composition and mechanism of action. The table below summarizes key performance characteristics based on empirical studies:
Table 1: Quantitative Comparison of Autofluorescence Quenching Agents
| Quenching Agent | Reported Autofluorescence Reduction | Key Advantages | Key Limitations | Impact on Specific Signal |
|---|---|---|---|---|
| TrueBlack Lipofuscin Autofluorescence Quencher | 89-95% [74] | Minimal background increase in red/far-red channels; preserves specific fluorescence signals; compatible with various staining protocols [75] [74] | Commercial cost | Minimal effect on fluorescent antibodies or nuclear counterstains [75] |
| MaxBlock Autofluorescence Reducing Reagent Kit | 90-95% [74] | High efficacy; preserves tissue integrity | Commercial cost; specific protocol requirements | Reliable detection of fluorescent labels maintained [74] |
| Cupric Sulfate | Variable (specific percentage not quantified in results) | Cost-effective; readily available | Lower efficacy compared to specialized reagents [74] | Not specified in search results |
| SDS Treatment | Not quantified in results | Part of comprehensive quenching protocols | Requires combination with other methods for effective results; may require optimization [75] | Can cause signal loss in HCR assays if not properly optimized [75] |
| Sudan Black B | Historically effective | Traditional method with extensive literature | Introduces non-specific background fluorescence in red/far-red channels [75] | Higher background can reduce signal-to-noise ratio [75] |
Experimental Protocols and Methodologies
TrueBlack Lipofuscin Autofluorescence Quenching Protocol
This protocol is adapted from validated methods used in neuroscience research and adrenal tissue studies [75] [74].
Materials Required:
- TrueBlack Lipofuscin Autofluorescence Quencher (Biotium)
- Phosphate-buffered saline (PBS)
- Washing buffers appropriate for your sample type
- Mounting medium (with or without DAPI)
Procedure:
- Complete all fixation, permeabilization, and hybridization (FISH) or immunostaining steps.
- Following final washes, prepare TrueBlack solution at a concentration of 0.7% in the recommended buffer (e.g., glycol methacrylate embedding medium for resin-embedded tissues or PBS for standard sections) [75].
- Apply the TrueBlack solution to cover the tissue sections completely.
- Incubate for 2-15 minutes at room temperature. Note: Optimization of incubation time may be necessary for different tissue types. Start with 5 minutes and adjust based on quenching efficacy and signal preservation.
- Rinse the sections thoroughly with PBS or your standard washing buffer (2-3 times, 5 minutes each) to remove excess reagent.
- Proceed with mounting using an appropriate antifade mounting medium.
Critical Considerations:
- TrueBlack treatment can be performed either before or after immunostaining or FISH procedures [75].
- The reagent is particularly effective for quenching lipofuscin autofluorescence, which is common in neuronal tissues and aged samples [75].
- It has been validated for use with hybridization chain reaction (HCR) FISH, effectively reducing background without causing signal loss [75].
Traditional Cupric Sulfate Quenching Protocol
This method represents a more traditional approach to autofluorescence reduction.
Materials Required:
- Cupric sulfate pentahydrate (CuSO₄·5H₂O)
- Ammonium chloride (NH₄Cl)
- Saline solution (e.g., PBS)
- Staining containers
Procedure:
- Prepare cupric sulfate solution in saline (typical concentration range: 0.1-1 mM).
- Alternatively, use an ammonia-ethanol solution or a copper-based quenching buffer as described in some protocols.
- Apply the solution to tissue sections after fixation and before primary antibody incubation or FISH procedures.
- Incubate for 30 minutes to 2 hours, depending on the tissue autofluorescence intensity.
- Rinse thoroughly with PBS or appropriate buffer before proceeding with subsequent steps.
Critical Considerations:
- Cupric sulfate demonstrates variable efficacy across different tissue types and excitation wavelengths [74].
- This method may require extensive optimization for specific applications and often shows lower quenching efficiency compared to specialized commercial reagents [74].
Troubleshooting Guides and FAQs
Frequently Asked Questions
Q1: Why should I choose TrueBlack over traditional Sudan Black B for quenching lipofuscin autofluorescence in neuronal tissue?
A: TrueBlack provides superior performance compared to Sudan Black B because it effectively quenches lipofuscin autofluorescence while introducing minimal non-specific background in red and far-red channels [75]. Sudan Black B, while historically used for this purpose, generates significant background fluorescence in these channels, reducing your signal-to-noise ratio and potentially obscuring specific labeling [75]. TrueBlack has been specifically validated in challenging neuronal applications, including microglia imaging and resin-embedded brain tissues [75].
Q2: Can I use TrueBlack in combination with RNA FISH techniques like Hybridization Chain Reaction (HCR)?
A: Yes, TrueBlack is compatible with advanced FISH techniques. In fact, a recent study tested multiple quenching methods for HCR in mouse and human frozen tissues and found TrueBlack to be the most effective quencher for eliminating lipofuscin autofluorescence without causing V3HCR signal loss [75]. This makes it particularly valuable for mRNA detection in autofluorescence-prone tissues like human neuronal populations.
Q3: I am experiencing persistent autofluorescence after using a quenching agent. What could be the issue?
A: Several factors could contribute to inadequate quenching:
- Insufficient incubation time: Optimize the incubation duration with your quenching agent; different tissues may require different exposure times.
- Incorrect concentration: Verify that you are using the recommended concentration for your specific sample type.
- Agent selection mismatch: Some quenchers are more effective for specific autofluorescence sources. TrueBlack is particularly effective against lipofuscin, which is common in neuronal tissues and aged samples [75].
- Incomplete removal of residual reagent: Ensure thorough washing after the quenching step to remove all unbound reagent.
- Fixation-induced autofluorescence: Some autofluorescence originates from fixatives like formaldehyde; consider reducing fixation time or using alternative fixatives.
Q4: How does the cost of TrueBlack compare to traditional methods, and is it worth the investment?
A: While commercial reagents like TrueBlack typically have a higher upfront cost compared to traditional chemicals like cupric sulfate or Sudan Black B, this cost is often justified by superior performance. The significant improvement in signal-to-noise ratio (89-95% autofluorescence reduction) [74] can reduce imaging time, minimize the need for signal amplification, and provide more reliable, publication-quality data. The preservation of specific fluorescence signals also means you're less likely to lose valuable samples or need to repeat experiments.
Research Reagent Solutions
Table 2: Essential Materials for Autofluorescence Quenching Experiments
| Reagent/Equipment | Specific Function | Application Notes |
|---|---|---|
| TrueBlack Lipofuscin Autofluorescence Quencher | Specifically quenches lipofuscin and other sources of autofluorescence | Compatible with immunostaining and FISH; use before or after staining; minimal effect on specific signals [75] [74] |
| Cupric Sulfate | Traditional chemical quencher | Requires optimization; lower efficacy than specialized reagents; cost-effective [74] |
| Sudan Black B | Traditional lipofuscin quencher | Causes high background in red/far-red channels; less recommended for multi-color imaging [75] |
| MaxBlock Autofluorescence Reducing Reagent Kit | Commercial alternative for autofluorescence reduction | Shows efficacy similar to TrueBlack (90-95% reduction) [74] |
| SDS (Sodium Dodecyl Sulfate) | Detergent used in some quenching protocols | Often used in combination with other methods; may require careful optimization to prevent signal loss [75] |
| Fluorescent Mounting Medium with DAPI | Preserves fluorescence and counterstains nuclei | Essential for maintaining signal intensity during imaging and storage |
Visual Experimental Workflows
Autofluorescence Quenching Decision Pathway
This diagram illustrates the logical decision process for selecting an appropriate autofluorescence quenching method based on experimental requirements and sample characteristics.
Experimental Workflow: Integrating Quenching in FISH
This workflow outlines the key procedural steps for integrating autofluorescence quenching into a whole-mount FISH experimental pipeline, highlighting critical decision points.
Technical Specifications and Advanced Applications
Different quenching agents demonstrate variable performance across the excitation spectrum. TrueBlack Lipofuscin Autofluorescence Quencher shows consistent efficacy across multiple wavelengths while minimizing non-specific background, particularly in the red and far-red channels where Sudan Black B introduces significant interference [75]. This characteristic makes it particularly valuable for multi-color FISH experiments where preserving signal integrity across multiple channels is essential.
Application in Advanced Imaging Techniques
TrueBlack has been successfully implemented in several advanced research contexts:
- Neuroscience Research: Effectively quenches autofluorescence in microglia and other neuronal cell types without interfering with antibodies targeting microglial proteins [75].
- Resin-Embedded Tissues: When incorporated into glycol methacrylate embedding medium at 0.7% concentration, TrueBlack reduces up to 90% of autofluorescence background while retaining fluorescent signals better than Sudan Black B [75].
- Hybridization Chain Reaction (HCR) FISH: Proven to be the most effective quencher for eliminating lipofuscin autofluorescence without causing signal loss in V3HCR applications in frozen tissues from mouse and human [75].
Tissue Integrity Considerations
An important advantage of TrueBlack over some traditional quenching methods is its preservation of tissue integrity while effectively reducing autofluorescence. Studies on mouse adrenal cortex tissue demonstrated that TrueBlack treatment maintained tissue structure while allowing reliable detection of fluorescent labels [74]. This characteristic is particularly valuable for whole mount FISH applications where structural preservation is critical for accurate spatial localization of signals.
Troubleshooting Guides and FAQs
Tissue autofluorescence poses a major challenge for whole-mount RNA-FISH because it creates background noise that obscures specific fluorescent signals, reducing the signal-to-noise ratio crucial for accurate analysis. This autofluorescence emanates from various intrinsic sources within tissues [2]:
- Lipofuscin: An age-related pigment with broad emission spectra, particularly problematic in neuronal and adult tissues [55]
- Heme: Found in red blood cells and tissues with high vascularization like myocardium [55]
- Crosslinking from fixation: Paraformaldehyde (PFA) fixation creates fluorescent crosslinks [55]
- Elastin and collagen: Structural components in various connective tissues
The impact varies by tissue type, with myocardial tissues being particularly challenging due to high levels of both heme and lipofuscin [55].
Which autofluorescence quenching methods are most effective for different tissue types?
| Tissue Type | Recommended Quenching Method | Key Protocol Details | Performance Notes |
|---|---|---|---|
| Embryonic Tissues | OMAR (Oxidation-Mediated Autofluorescence Reduction) [2] | High-intensity white LED light (e.g., 20,000 lumen) in aqueous hydrogen peroxide solution [2] | Successfully eliminates autofluorescence in mouse embryonic limb buds; enables whole-mount HCR RNA-FISH without post-processing [2] |
| Insect Tissues | Alcoholic H₂O₂ Solution [15] | 6% H₂O₂ in alcohol following Carnoy's solution fixation [15] | Markedly reduces autofluorescence while preserving 16S rRNA for FISH detection of endosymbionts [15] |
| Myocardial Tissues | Immersion-based CUBIC clearing [55] | 24-hour CUBIC Reagent I incubation; optional quenching with TrueVIEW or Glycine [55] | Effective for imaging depths up to 150μm; TrueBlack and Sudan Black B reduced imaging depth [55] |
| Neuronal Tissues | iDISCO+ clearing [76] | Solvent-based clearing method [76] | Provides uniform labeling of larger samples and greater imaging depth compared to CLARITY [76] |
How do I troubleshoot common autofluorescence quenching problems in FISH experiments?
| Problem | Possible Causes | Solutions |
|---|---|---|
| Poor or No Signal After Quenching | Over-quenching; probe degradation; excessive fixation | Optimize quenching time/concentration; use Carnoy's fixative instead of formaldehyde-based; verify probe integrity [15] |
| High Background Post-Quenching | Incomplete quenching; non-specific probe binding; insufficient washing | Increase stringency of washes; optimize permeabilization; ensure complete denaturation of target nucleic acids [16] |
| Weak or Faded Signal | Signal bleaching; over-fixation; excessive light exposure | Use antifade mounting media; minimize light exposure during imaging; optimize fixation time [16] |
| Morphological Distortion | Over-permeabilization; harsh quenching conditions | Optimize permeabilization conditions; use gentler quenching methods; avoid over-fixation [16] |
| Inconsistent Results Across Tissue Types | Tissue-specific differences in autofluorescence sources | Validate methods for each tissue type; adjust protocols based on lipid/content composition [76] [55] |
Experimental Protocols
The OMAR protocol combines photochemical bleaching with detergent-based permeabilization for whole-mount RNA-FISH:
Materials Required:
- High-intensity cold white light source (20,000 lumen LED panels or flexible gooseneck LED spotlights)
- Hydrogen peroxide (H₂O₂)
- Phosphate buffer saline (PBS)
- PFA fixative
- Methanol
- Tween 20 or Triton X-100
Step-by-Step Procedure:
Sample Collection and Fixation
- Collect embryonic tissues (e.g., mouse embryonic limb buds) and fix in 4% PFA at 4°C
- Fixation time depends on tissue size: 12-36 hours
Photochemical Bleaching
- Prepare bleaching solution: 1x PBS with H₂O₂ (concentration optimized for tissue type)
- Place samples in solution and expose to high-intensity white LED light
- Monitor for appearance of bubbles indicating successful oxidation reaction
- Typical treatment: 2-4 hours, depending on tissue size and autofluorescence levels
Permeabilization
- Transfer samples to permeabilization buffer (PBS with 0.1-1% Tween 20 or Triton X-100)
- Incubate with gentle agitation for 24-48 hours at room temperature
RNA-FISH Processing
- Proceed with standard HCR RNA-FISH v3.0 protocol
- Use Molecular Instruments probes and amplifiers as directed
Clearing and Imaging
- Clear samples using appropriate method (CUBIC for embryonic tissues)
- Image using confocal or light-sheet microscopy
Validation: Successful OMAR treatment manifests as disappearance of endogenous autofluorescence across all channels of interest while maintaining specific FISH signals [2].
This specialized protocol addresses challenging autofluorescence in insect tissues while preserving bacterial endosymbiont detection:
Fixation:
- Use Carnoy's solution instead of formaldehyde-based fixatives
- Fix whole insects for 4-24 hours depending on size
Quenching:
- Prepare alcoholic 6% H₂O₂ solution
- Treat fixed tissues for 2-6 hours
- Avoid aqueous H₂O₂ which degrades rRNA targets
FISH:
- Apply 16S rRNA-targeted oligonucleotide probes
- Hybridize according to standard FISH protocols
- Wash with appropriate stringency
This protocol works for fresh samples and archival specimens preserved in acetone for several years [15].
| Quenching Agent | Signal-to-Noise Ratio (SNR) | Imaging Depth | Tissue Compatibility |
|---|---|---|---|
| TrueBlack | Improved at surface | Reduced vs. control | Rat and pig myocardial tissues |
| Sudan Black B | Improved at surface | Reduced vs. control | Rat and pig myocardial tissues |
| TrueVIEW | No significant impact | Similar to control | Rat and pig myocardial tissues |
| Glycine | No significant impact | Similar to control | Rat and pig myocardial tissues |
| Trypan Blue | No significant impact | Similar to control | Rat and pig myocardial tissues |
| No Quencher (Control) | Baseline | Up to 150μm | All tissues tested |
| Clearing Method | Signal-to-Noise Ratio | Imaging Depth | Tissue Uniformity | Processing Time |
|---|---|---|---|---|
| iDISCO+ | Good | Greater depth | More uniform in large samples | Moderate (days) |
| CLARITY | Higher | Limited depth | Less uniform | Longer (weeks) |
| CUBIC | Good | Up to 150μm | Good for myocardial tissues | Moderate (days) |
The Scientist's Toolkit: Research Reagent Solutions
| Reagent/Category | Function | Example Applications |
|---|---|---|
| OMAR Components [2] | Photochemical autofluorescence reduction | Whole-mount RNA-FISH on embryonic tissues |
| CUBIC Reagents [55] | Tissue clearing via delipidation and RI matching | Myocardial tissue microvasculature imaging |
| BHQ (Black Hole Quencher) [77] | Non-fluorescent quencher for FISH probes | Molecular beacons; reduces background in probe design |
| Carnoy's Solution [15] | Fixation with reduced autofluorescence | Insect tissue preservation for endosymbiont detection |
| Alcoholic H₂O₂ [15] | Autofluorescence quenching preserving RNA | Insect tissues with bacterial endosymbionts |
| TrueBlack [55] | Lipofuscin autofluorescence suppression | Myocardial and neuronal tissues |
| PNA FISH Probes [62] | High-affinity neutral backbone probes | Telomere, centromere, and repeat sequence detection |
| HCR Amplification System [2] | Signal amplification for low-abundance targets | Whole-mount RNA detection in cleared tissues |
Workflow Visualization
OMAR Experimental Workflow
Integrated FISH and Quenching Decision Pathway
Frequently Asked Questions
What is quenching efficiency and why is it critical for FISH signal-to-noise ratio? Quenching efficiency refers to how effectively a probe's fluorophore signal is suppressed ("quenched") when the probe is not bound to its target. High quenching efficiency is critical for a high signal-to-noise ratio because it minimizes background fluorescence, allowing for clearer detection of true specific hybridization signals. Inefficient quenching leads to high background, which can obscure genuine signals, especially in sensitive detection methods like whole-mount FISH [78].
How do double-quenched probes like BHQnova improve performance for long probe sequences? For long probe sequences (typically >25 bases), the physical distance between the fluorophore at one end and the quencher at the other can reduce quenching efficiency. Double-quenched probes incorporate a second internal quencher (e.g., the "nova" quencher positioned between the 9th and 10th base residues) closer to the fluorophore. This configuration provides more efficient quenching, resulting in lower background fluorescence, a greater signal-to-noise ratio, and improved assay sensitivity, particularly in AT-rich target regions or multiplex reactions [78].
Can I combine different probe chemistries and amplification methods in a single experiment? Yes, certain advanced FISH methods are designed for such compatibility. For instance, the π-FISH rainbow method has been successfully combined with the Hybridization Chain Reaction (HCR) amplification in the developed π-FISH+ technology. This combination leverages the stability and efficiency of π-shaped probes while utilizing HCR for signal amplification, enabling the detection of challenging targets like short nucleic acid fragments (e.g., microRNA and specific splicing variants such as ARV7 in circulating tumor cells) [65].
Besides probe design, what other factors can cause high background fluorescence? High background can stem from various sources unrelated to probe quenching:
- Sample Autofluorescence: Tissues and cells can have natural autofluorescence, often more pronounced in the green spectrum. Fixation methods (e.g., prolonged formaldehyde fixation) can exacerbate this by cross-linking fluorescent enzyme co-factors [64] [2].
- Experimental Conditions: Over-fixation, inadequate permeabilization, insufficient post-hybridization washes, or using inappropriate slides (e.g., positively charged slides for certain cell samples) can lead to high background [16] [79].
- Non-specific Probe Binding: This can occur due to suboptimal hybridization stringency (temperature, time, buffer composition) or probe cross-reactivity [16].
Troubleshooting Guide
| Problem | Possible Causes Related to Quenching/Probes | Solutions and Strategic Considerations |
|---|---|---|
| High Background / Low Signal-to-Noise Ratio | • Using a standard end-quenched probe for a long sequence (>25 bases).• Fluorophore emission in a spectrum with high sample autofluorescence (e.g., green channel).• Inefficient quenching due to probe design or degradation. | • For long probes, switch to double-quenched probes (e.g., BHQnova) for superior background suppression [78].• Use longer-wavelength fluorophores (e.g., Quasar 570/670, CAL Fluor Red 610) to avoid autofluorescence in the green spectrum [64].• Implement autofluorescence reduction protocols like OMAR (Oxidation-Mediated Autofluorescence Reduction) for whole-mount samples [2]. |
| Weak or Faded Signal | • Signal obscured by background noise, making true signal difficult to discern.• Low signal intensity from the amplification method. | • Increase quenching efficiency to lower background and reveal the true signal.• Employ signal amplification methods with high intrinsic efficiency, such as π-FISH rainbow, which has demonstrated higher signal intensity per cell compared to HCR and smFISH in controlled tests [65]. |
| Poor Detection of Short Targets | • Standard probe and amplification methods require long sequences for efficient binding and signal detection. | • Combine robust probe designs with amplification. The π-FISH+ method (π-FISH combined with HCR) is specifically validated for detecting short nucleic acids like microRNA and specific splicing variants [65]. |
Quantitative Performance Comparison of FISH Methodologies
The following table summarizes key quantitative findings from the literature regarding the performance of different FISH methods, which directly reflects the efficiency of their underlying probe and signal generation chemistries.
| Method / Technology | Probe Type | Key Performance Metric | Result / Advantage |
|---|---|---|---|
| BHQnova Probes [78] | Double-quenched hydrolysis probe | Signal-to-Noise Ratio | Significant improvement for long probes (>25 bases) compared to standard end-labeled probes. |
| π-FISH Rainbow [65] | π-shaped target probes with U-shaped amplifiers | Sensitivity (Signal spots per cell) | Highest sensitivity compared to HCR, smFISH, and smFISH-FL for detecting ACTB mRNA. |
| π-FISH Rainbow [65] | π-shaped target probes with U-shaped amplifiers | Specificity (False-positive rate) | < 0.51% false-positive rate in negative controls. |
| ECHO-FISH [80] | ECHO (Exciton-Controlled Hybridization-sensitive) probes | Protocol Simplicity | 25-minute protocol with no stringency washes required, due to high fluorescent turn-on upon hybridization. |
Experimental Protocol: Assessing Quenching Efficiency via Signal-to-Noise Measurement
This protocol provides a methodology to empirically evaluate the quenching efficiency and background performance of different probe sets in your experimental system.
Objective: To compare the background fluorescence and signal-to-noise ratio of a standard FISH probe versus a double-quenched FISH probe.
Materials:
- Test Probe Sets (e.g., standard end-quenched probe and double-quenched probe of the same target sequence)
- Target Sample (e.g., fixed cells or tissue sections with known expression of the target)
- Negative Control Sample (e.g., cells lacking the target, or sample treated with RNase for RNA-FISH)
- Standard FISH reagents: Fixative, Permeabilization buffer, Hybridization buffer, Wash buffers, Mounting medium with antifade
- Fluorescence Microscope with appropriate filter sets and a camera for quantitative imaging
Procedure:
- Sample Preparation: Prepare identical sets of your target and negative control samples. Ensure fixation and permeabilization are optimized and consistent across all samples [16].
- Hybridization: Hybridize one set with the standard probe and the other set with the double-quenched probe. Use the same probe concentration, hybridization time, and temperature for both.
- Post-Hybridization Washes: Perform identical stringent washes for all samples to remove unbound probes [16].
- Mounting and Imaging: Mount samples with an antifade medium. Using identical microscope settings (exposure time, gain, light intensity), capture images of both the target and negative control samples for each probe type.
- Image Analysis and Quantification:
- For the target samples, measure the mean fluorescence intensity of specific signal spots (
Mean_Signal). - For the negative control samples (or a blank area in the target sample), measure the mean fluorescence intensity of the background (
Mean_Background). - Calculate the Signal-to-Noise Ratio (SNR) for each probe:
SNR = Mean_Signal / Mean_Background.
- For the target samples, measure the mean fluorescence intensity of specific signal spots (
- Interpretation: A higher SNR indicates better performance, resulting from a combination of strong specific signal and low background, the latter being directly influenced by superior quenching efficiency.
Probe Signaling Pathways and Workflows
ECHO-FISH Probe Activation Mechanism
π-FISH Rainbow Workflow with Amplification
Research Reagent Solutions
The following table lists key reagents and technologies discussed, which are essential for implementing high-quenching-efficiency FISH protocols.
| Reagent / Technology | Function / Principle | Key Benefit |
|---|---|---|
| ECHO Probes [80] | Oligodeoxynucleotide probes containing a thymine or cytosine base labeled with a homodimer of thiazole orange (TO). Fluorescence activates only upon hybridization. | Enables rapid, wash-free FISH protocols due to extremely low background of unbound probes. |
| BHQnova Probes [78] | Double-quenched hydrolysis probes with a 5' fluorophore, a 3' BHQ quencher, and an internal "nova" quencher between bases 9 and 10. | Provides superior quenching efficiency for long probes (>25 bases), lowering background and increasing SNR. |
| π-FISH Rainbow Probes [65] | A system of primary π-shaped probes (with 2-4 complementary base pairs for stability) and secondary/tertiary U-shaped amplification probes. | Offers high signal intensity, low background, and high efficiency for multiplexed detection of various biomolecules. |
| OMAR Treatment [2] | A photochemical pre-treatment (Oxidation-Mediated Autofluorescence Reduction) using high-intensity light to reduce tissue autofluorescence. | Suppresses endogenous autofluorescence at the source, improving SNR without digital post-processing, crucial for whole-mount samples. |
| HCR v3.0 [65] [2] | An enzyme-free method for signal amplification using metastable DNA hairpins that self-assemble upon initiation by a probe. | Provides programmable and multiplexable signal amplification; can be combined with other methods (e.g., π-FISH) for sensitive detection. |
Autofluorescence Quenching and Signal Integrity FAQs
Q1: What are the most effective methods for quenching tissue autofluorescence in whole-mount FISH samples, and how do they impact fluorescence signal integrity across different imaging platforms?
Multiple effective methods exist for quenching tissue autofluorescence, each with considerations for signal integrity:
Chemical Quenching Agents: TrueBlack Lipofuscin Autofluorescence Quencher has been demonstrated as particularly effective for neuronal tissues, overcoming lipofuscin autofluorescence without causing signal loss in hybridization chain reaction (HCR) protocols. Testing showed it was the only acceptable option among multiple methods evaluated, including cupric sulfate, Dent's fixative, detergent extraction, Murray's clearing, SDS treatment, and standard Sudan Black blocking [81]. For general tissue autofluorescence, solutions containing hydrogen peroxide, dimethyl sulfoxide, and sodium azide have been patented specifically for optical clearing and autofluorescence quenching [82].
Photochemical Bleaching: Oxidation-mediated autofluorescence reduction (OMAR) using light-based bleaching effectively suppresses autofluorescence for whole-mount RNA-FISH and immunofluorescence without digital post-processing. This method is suitable for various tissues, organs, and vertebrate embryos [17].
Considerations for Cross-Platform Compatibility: Each quenching method interacts differently with microscope systems. Chemical quenching agents generally preserve signal well across confocal, light-sheet, and conventional fluorescence systems. Photochemical bleaching may require optimization of exposure parameters specific to each platform. Validation should always include testing signal-to-noise ratios on the intended imaging platform [17] [81].
Q2: How does refractive index matching in clearing protocols affect image quality across different microscopy platforms?
Refractive index (RI) matching is critical for image quality, with different considerations for each platform:
Confocal Microscopy: Requires precise RI matching to the objective lens (typically 1.515 for oil immersion) to minimize spherical aberrations and maintain resolution at depth. The LIMPID method allows fine-tuning by adjusting iohexol percentage to match this RI, enabling high-resolution imaging through 250μm of tissue [6].
Light-Sheet Microscopy: Benefits from hydrophilic clearing methods with RI ranges of 1.33-1.52, as these preserve fluorescent proteins and allow compatibility with water-dipping objectives. The CLARITY/PACT method uses mild processing that maintains RI compatibility while preserving fluorescent protein integrity for long-term imaging [83] [84].
Conventional Fluorescence Microscopy: More tolerant of RI mismatch but still benefits from clearing methods like LIMPID that use readily available chemicals (SSC, urea, iohexol) to improve penetration and signal-to-noise ratio without specialized equipment [6].
Table 1: Refractive Index Requirements by Microscope Objective Type
| Objective Type | Typical RI Range | Optimal Clearing Methods | Key Considerations |
|---|---|---|---|
| Oil Immersion | 1.51-1.52 | LIMPID (adjustable), hydrophobic methods | Precise matching critical for high-NA objectives |
| Water Dipping | 1.33-1.38 | Hydrophilic, hydrogel-based | Preserves fluorescent proteins better |
| Air | ~1.0 | All clearing methods | Least sensitive to RI mismatch |
| Silicone Oil | 1.40-1.42 | Hydrophilic, aqueous-based | Balance between resolution and working distance |
Q3: What specific steps can be taken to protect fluorescent signals during prolonged imaging sessions required for 3D reconstruction?
Extended imaging sessions risk photobleaching, particularly for large volume 3D reconstruction:
Fluorescence Protective Reagents: EDTP (Ethylenediamine-N,N,N′,N′-tetra-2-propanol) at 1% concentration significantly enhances GFP fluorescence intensity (to 181% of baseline) and provides protection against photobleaching comparable to 2.5% DABCO. It maintains fluorescence during room temperature storage and extended imaging sessions [84].
Imaging Parameter Optimization: For light-sheet microscopy specifically, implement multi-view imaging with optimized illumination patterns to distribute photobleaching more evenly. This is particularly important as the ratio of excitation length to sample length decreases, which exacerbates photobleaching [84].
Sample Storage Conditions: For experiments spanning multiple days, embed cleared samples in 2% agarose with protective reagents (e.g., 1% EDTP) and store at 4°C. This approach maintains fluorescence signal integrity for up to 6 weeks as demonstrated in spinal cord imaging studies [84].
Q4: How can researchers validate that their FISH signal remains quantifiable after clearing and across different imaging platforms?
Maintaining quantitative FISH signals requires careful protocol choices:
Linear Amplification Methods: Employ HCR (Hybridization Chain Reaction) with its linear amplification scheme, which scales fluorescence intensity to RNA quantity, unlike non-linear amplification methods that provide only qualitative information. This preserves quantifiability across platforms [6].
Cross-Platform Calibration: Use reference standards with known fluorescence intensity imaged on all platforms to establish normalization factors. The π-FISH rainbow method provides high signal intensity with low background, facilitating more accurate quantification [65].
Single-Molecule Validation: Limit HCR amplification time to visualize individual RNA molecules as discrete fluorescent dots. This approach allows absolute quantification by counting molecules within cell boundaries, providing a validation method that is transferable across platforms [6].
Troubleshooting Guides
Table 2: Troubleshooting Common Cross-Platform Imaging Issues
| Problem | Possible Causes | Confocal Solutions | Light-Sheet Solutions | Conventional Fluorescence Solutions |
|---|---|---|---|---|
| Signal loss at depth | RI mismatch, scattering | Adjust iohexol concentration in LIMPID to match 1.515 RI [6] | Use hydrophilic clearing (RI 1.33-1.52) with water-dipping objectives [83] | Increase laser power or exposure time; use brighter dyes |
| High background autofluorescence | Lipofuscin, fixative artifacts | Apply TrueBlack Lipofuscin Autofluorescence Quencher [81] | Implement OMAR photochemical bleaching during sample prep [17] | Use narrower emission filters; chemical quenching with H2O2 [82] |
| Photobleaching during extended acquisition | Oxygen radicals, insufficient protection | Add 1% EDTP to mounting medium [84] | Reduce laser power, increase camera sensitivity; use tiling with overlap | Limit exposure time; use antifade mounting media |
| Spatial resolution mismatch between platforms | Different voxel sizes, point spread functions | Use high-NA objectives with optimal RI matching [6] | Implement dual-side illumination; calculate optimal light-sheet thickness [85] | Account for lower resolution in analysis; avoid over-interpreting small features |
| Inconsistent signal quantification | Non-linear amplification, platform-specific detection efficiency | Use HCR with linear amplification [6] | Validate with calibration beads; use uniform illumination patterns | Establish platform-specific calibration curves; use internal standards |
Sample Preparation Troubleshooting
Issue: Incomplete clearing or quenching in thick tissues
Problem Identification: Sample remains opaque or shows high background in specific regions, particularly in deep tissue areas or in pigmented tissues [83].
Resolution Strategies:
- For lipid-rich tissues (brain): Extend delipidation time or consider gentle detergent-based lipid removal while preserving FISH signal [6].
- For pigmented tissues: Incorporate decolorization steps specifically for melanin or other pigments that may not be removed by standard clearing protocols [83].
- For autofluorescence persistence: Combine multiple quenching approaches sequentially - first chemical quenching (e.g., TrueBlack) followed by OMAR photobleaching if necessary [17] [81].
- Increase permeability: Add mild detergents (e.g., Triton X-100) to clearing solutions and extend incubation times with gentle agitation [82].
Issue: Signal loss or degradation after clearing
Problem Identification: Specific FISH signals diminish or become undetectable after clearing procedures, particularly problematic for low-abundance targets [6].
Resolution Strategies:
- Evaluate fixation conditions: Overfixation can reduce FISH signals; either reduce fixation time or apply protease treatment to free up cross-linked molecules [6].
- Add protective agents: Incorporate EDTP (1%) into clearing and mounting solutions to enhance and protect fluorescent signals [84].
- Optimize probe design: For short RNA targets or challenging specimens, use π-FISH+ technology that combines π-FISH with HCR for improved detection efficiency [65].
- Validate before clearing: Image samples before and after clearing to identify specific signal degradation versus general photobleaching [6].
Experimental Protocols for Cross-Platform Validation
Protocol 1: Whole-Mount FISH with Cross-Platform Compatible Clearing
This protocol adapts the 3D-LIMPID-FISH method for validation across multiple imaging systems [6]:
Materials:
- Tissue samples (250μm thickness optimal)
- Fixation buffer (4% PFA)
- Hybridization chain reaction (HCR) probes
- LIMPID clearing solution: saline-sodium citrate, urea, and iohexol
- TrueBlack Lipofuscin Autofluorescence Quencher (if needed)
- EDTP fluorescence protection additive
Procedure:
- Fixation: Fix tissues in 4% PFA for 24 hours at 4°C.
- Autofluorescence Reduction: Treat with either chemical quencher (TrueBlack per manufacturer protocol) or OMAR photobleaching [17] [81].
- FISH Hybridization: Perform HCR with linear amplification for 2 hours for single-molecule detection or longer for higher signal [6].
- Immunostaining (if needed): Co-stain with validated antibodies for protein targets.
- Clearing: Incubate in LIMPID solution with adjusted iohexol concentration:
- For confocal: Adjust to RI 1.515 using calibration curve
- For light-sheet: Adjust to RI 1.45-1.48
- For conventional fluorescence: RI 1.40-1.45
- Fluorescence Protection: Add 1% EDTP to final clearing solution for extended imaging sessions [84].
- Mounting: Mount in chambers compatible with each microscope system using the adjusted RI solutions.
Validation Steps:
- Image the same region of interest on all three platforms
- Compare signal-to-noise ratios and spatial resolution
- Quantify any systematic differences in detection efficiency
- Establish normalization factors for quantitative comparisons
Protocol 2: Quantitative Cross-Platform Calibration
Materials:
- Fluorescent calibration beads with known intensities
- Reference sample with stable fluorescence (e.g., transgenic GFP expression)
- All microscope systems to be validated
Procedure:
- Spatial Calibration: Image calibration beads with all systems using the same clearing method to establish spatial resolution limits for each platform.
- Intensity Calibration: Create standard curves for intensity quantification using reference samples.
- Detection Efficiency: Compare the number of detectable FISH signals per cell across platforms.
- Linearity Validation: Verify that signal intensity scales linearly with amplification time across all systems.
Workflow Visualization
The Scientist's Toolkit: Research Reagent Solutions
Table 3: Essential Reagents for Cross-Platform FISH Validation
| Reagent Category | Specific Products/Formulations | Primary Function | Cross-Platform Considerations |
|---|---|---|---|
| Autofluorescence Quenchers | TrueBlack Lipofuscin Autofluorescence Quencher [81] | Reduces lipofuscin and general autofluorescence | Compatible with all platforms; essential for neuronal tissues |
| Hydrogen peroxide-based solutions [82] | Chemical bleaching of autofluorescent compounds | Concentration may need optimization per platform | |
| Optical Clearing Agents | LIMPID (SSC, urea, iohexol) [6] | Refractive index matching for transparency | RI adjustable for each microscope type |
| Hydrophilic/hydrogel-based methods [83] [84] | Preserves fluorescent proteins and tissue structure | Ideal for light-sheet microscopy | |
| Signal Amplification Systems | Hybridization Chain Reaction (HCR) v3.0 [6] [81] | Linear amplification for quantitative FISH | Consistent performance across platforms |
| π-FISH rainbow [65] | High-efficiency multiplexed detection | Superior signal-to-noise for challenging targets | |
| Fluorescence Protection | EDTP (1% concentration) [84] | Enhances and protects against photobleaching | Critical for extended acquisitions on all systems |
| Glycerol-based mounting media | Temporary preservation for immediate imaging | Quick solution for conventional fluorescence | |
| Reference Standards | Fluorescent calibration beads | System calibration and normalization | Enables quantitative cross-platform comparison |
| Stable reference samples (e.g., transgenic GFP) | Longitudinal performance monitoring | Tracks system performance over time |
Advanced Methodologies
π-FISH Rainbow for Enhanced Multiplexing
The π-FISH rainbow method represents a significant advancement for cross-platform validation studies:
Enhanced Efficiency: π-FISH demonstrates higher sensitivity compared to HCR, smFISH, and smFISH-FL, with significantly increased signal spots per cell and higher fluorescence intensity [65].
Multiplexing Capability: Using four fluorescence signal probes, π-FISH can generate 15 different signal codes to differentiate 15 genes in a single round of hybridization, with overlapping ratios exceeding 99% for multichannel detection [65].
Short Sequence Detection: When combined with HCR (π-FISH+), the method overcomes limitations for detecting short nucleic acid fragments like microRNA and specific splicing variants, expanding applicability to clinical samples such as circulating tumor cells [65].
Light-Sheet Specific Optimization
For light-sheet microscopy applications, specific modifications enhance performance:
Double-Sided Illumination: Implement counter-propagating light sheets to reduce shadowing artifacts and maximize laser penetration from both sides of the sample [85].
Sample Mounting: Embed samples in low-melting-point agarose within FEP tubes placed in water-filled cuvettes to optimize refractive index matching and reduce scattering [85].
Live Imaging Compatibility: For dynamic studies, maintain samples in quasi-physiological conditions with minimal impairment after embedding, enabling time-course observations [85].
Conclusion
Effective autofluorescence quenching represents a transformative advancement for whole-mount FISH, enabling researchers to achieve unprecedented clarity in 3D gene expression mapping. By integrating specialized quenching agents like TrueBlack® with compatible optical clearing methods such as LIMPID, scientists can significantly enhance signal-to-noise ratios while preserving tissue integrity and probe signals. The systematic troubleshooting and validation frameworks provided ensure reliable implementation across diverse tissue types and experimental conditions. These methodologies open new frontiers in spatial transcriptomics, particularly for challenging applications like neuronal circuit mapping, developmental patterning studies, and drug mechanism investigation. Future directions will likely focus on developing more specific quenching agents, expanding compatibility with emerging multiplexed FISH technologies, and creating standardized validation protocols for regulatory applications in drug development. As these techniques become more accessible, they will undoubtedly accelerate discoveries in functional genomics and precision medicine.
References
- 1. A Biological Breakdown of Autofluorescence: Why Your ... [https://evidentscientific.com/en/insights/a-biological-breakdown-of-autofluorescence-why-your-samples-naturally-glow]
- 2. Optimized protocol for whole-mount RNA fluorescent in situ ... [https://pmc.ncbi.nlm.nih.gov/articles/PMC10522992/]
- 3. Autofluorescence Spectroscopy and Imaging: A Tool for ... [https://pmc.ncbi.nlm.nih.gov/articles/PMC4289852/]
- 4. Autofluorescence [https://en.wikipedia.org/wiki/Autofluorescence]
- 5. Lipofuscin, Its Origin, Properties, and Contribution to Retinal ... [https://pmc.ncbi.nlm.nih.gov/articles/PMC10740933/]
- 6. A simple and fast optical clearing method for whole-mount ... [https://pmc.ncbi.nlm.nih.gov/articles/PMC12342960/]
- 7. Autofluorescence in Microscopy Literature References [https://www.microscopyu.com/references/autofluorescence]
- 8. Two-Photon Autofluorescence Imaging of Fixed Tissues [https://pmc.ncbi.nlm.nih.gov/articles/PMC7183211/]
- 9. A rapid and sensitive, multiplex, whole mount RNA ... [https://plantmethods.biomedcentral.com/articles/10.1186/s13007-023-01108-9]
- 10. Signal-to-Noise Considerations [https://evidentscientific.com/en/microscope-resource/knowledge-hub/techniques/confocal/signaltonoise]
- 11. Mapping human tissues with highly multiplexed RNA in situ ... [https://www.nature.com/articles/s41467-024-46437-y]
- 12. IF Signal-To-Noise-Ratios [https://www.ptglab.com/support/immunofluorescence-protocol/if-signal-to-noise-ratios/?srsltid=AfmBOoqhS060IIqIWNkRGmcFvm0maj36hGyzBFJ7z402dy33nWZjEws6]
- 13. Learn More About Controls for ICC/IF Experiments [https://www.bio-techne.com/applications/imaging/immunocytochemistry/controls-for-icc-if-experiments]
- 14. How to reduce autofluorescence [https://www.ptglab.com/news/blog/how-to-reduce-autofluorescence/?srsltid=AfmBOoq7wjc9s8ZV2li4LSbN3dZyNIcHxtlYspfoH9JLpso_25mbEIuI]
- 15. Quenching autofluorescence of insect tissues for in situ ... [https://www.jstage.jst.go.jp/article/aez/44/2/44_2_281/_article]
- 16. FISH Tips and Troubleshooting [https://www.creative-bioarray.com/support/fish-tips-and-troubleshooting.htm]
- 17. Optimized protocol for whole-mount RNA fluorescent in situ ... [https://www.sciencedirect.com/science/article/pii/S2666166723005701]
- 18. Advancements in Single-Molecule Fluorescence Detection ... [https://pmc.ncbi.nlm.nih.gov/articles/PMC12109833/]
- 19. Automation of fluorescent in situ hybridization (FISH) ... [https://pubmed.ncbi.nlm.nih.gov/40962484/]
- 20. A technical review and guide to RNA fluorescence in situ ... [https://pmc.ncbi.nlm.nih.gov/articles/PMC7085896/]
- 21. Molecular elucidation of brain lipofuscin in aging and Neuronal Ceroid... [https://pmc.ncbi.nlm.nih.gov/articles/PMC11957193/]
- 22. Sablefish (Anoplopoma fimbra Pallas, 1814) plasma ... [https://journals.plos.org/plosone/article?id=10.1371/journal.pone.0246982]
- 23. Effect of Anticoagulants on Blood Cell Counts, Cell ... [https://pmc.ncbi.nlm.nih.gov/articles/PMC12428688/]
- 24. Fluorescence laser microdissection reveals a distinct ... [https://www.nature.com/articles/srep00783]
- 25. A Smart Imaging Workflow for Organ-Specific Screening in ... [https://pmc.ncbi.nlm.nih.gov/articles/PMC6471943/]
- 26. TrueBlack® Lipofuscin Autofluorescence Quencher [https://biotium.com/product/trueblack-lipofuscin-autofluorescence-quencher/]
- 27. TrueBlack ® Lipofuscin Autofluorescence Quencher #92401 [https://www.cellsignal.com/products/buffers-dyes/trueblack-lipofuscin-autofluorescence-quencher/92401?srsltid=AfmBOorA8sca4sHbiuINFj7-Zi0pHWfnLxdccDR4vvaonDhhU4sKCJE5]
- 28. How to reduce autofluorescence [https://www.ptglab.com/news/blog/how-to-reduce-autofluorescence/?srsltid=AfmBOoqsdjMzbuFVnXrhWx7Lhjm9xFdwKdQwj46oso5Kv21DlWRDkak5]
- 29. ReadyProbes™ Tissue Autofluorescence Quenching Kit [https://www.thermofisher.com/store/v3/products/faqs/R37630]
- 30. Live imaging of neutrophil motility in a zebrafish model ... [https://pmc.ncbi.nlm.nih.gov/articles/PMC2974588/]
- 31. A Simple and Fast Optical Clearing Method for Whole-Mount ... [https://pubmed.ncbi.nlm.nih.gov/39389582/]
- 32. A simple optical clearing method for investigating ... [https://www.spiedigitallibrary.org/conference-proceedings-of-spie/10472/104720P/A-simple-optical-clearing-method-for-investigating-molecular-distribution-in/10.1117/12.2291193.full]
- 33. Supplementary protocols for 'A simple and fast optical ... [https://www.protocols.io/view/supplementary-protocols-for-39-a-simple-and-fast-o-de2c3gaw.html]
- 34. Tech Tip: Battling Tissue Autofluorescence [https://biotium.com/tech-tips-protocols/tech-tip-battling-tissue-autofluorescence/]
- 35. Fluorescence quenching by high-power LEDs for highly ... [https://pmc.ncbi.nlm.nih.gov/articles/PMC9479452/]
- 36. FAQ [https://www.moleculartechnologies.org/info/faq]
- 37. FAQ [https://www.molecularinstruments.com/faq]
- 38. Molecular Instruments, Inc. | HCR™ RNA-FISH/IF [https://www.molecularinstruments.com/]
- 39. HCR spectral imaging: 10-plex, quantitative, high- ... [https://pmc.ncbi.nlm.nih.gov/articles/PMC10941662/]
- 40. Tips to Boost Performance in Your HCR™ RNA ... [https://www.hcrimaging.com/articles/boost-performance]
- 41. Optimizing the hybridization chain reaction-fluorescence in ... [https://pmc.ncbi.nlm.nih.gov/articles/PMC10077247/]
- 42. Whole-mount smFISH allows combining RNA and protein ... [https://www.nature.com/articles/s41477-023-01442-9]
- 43. Protocol for whole-mount preparation, clearing, and ... [https://pmc.ncbi.nlm.nih.gov/articles/PMC11683226/]
- 44. Fluorescence Quenching of Fish Tissue Sections by LED ... [https://nepagene.jp/en/applications/fluorescent-tissue-staining-in-situ-hcr/autofluorescence-quenching-en/fish]
- 45. HCR FISH - Fluorescence background subtraction [https://forum.image.sc/t/hcr-fish-fluorescence-background-subtraction/64612]
- 46. Comparative analysis of fixation and embedding techniques ... [https://pmc.ncbi.nlm.nih.gov/articles/PMC5936644/]
- 47. Choosing your fixation, embedding, and antigen retrieval ... [https://www.enzo.com/note/choosing-your-fixation-embedding-and-antigen-retrieval-method-for-successful-ihc/]
- 48. Autofluorescence Quenching [https://visikol.com/blog/2021/09/08/autofluorescence-quenching/]
- 49. HER2 fluorescent in situ hybridization signal degradation [https://pubmed.ncbi.nlm.nih.gov/33389404/]
- 50. Attenuation artifacts in light sheet fluorescence microscopy ... [https://www.nature.com/articles/s41377-018-0068-z]
- 51. Removing striping artifacts in light-sheet fluorescence ... [https://www.sciencedirect.com/science/article/pii/S0079610721000821]
- 52. ReadyProbes™ Tissue Autofluorescence Quenching Kit 1 Kit | Buy Online | Invitrogen™ [https://www.thermofisher.com/order/catalog/product/R37630]
- 53. Correcting Artifacts in Ratiometric Biosensor Imaging [https://pmc.ncbi.nlm.nih.gov/articles/PMC8418531/]
- 54. Characterizing and Quenching Autofluorescence in Fixed ... [https://www.mdpi.com/1422-0067/24/4/3432]
- 55. Immersion‐Based Clearing and Autofluorescence ... [https://pmc.ncbi.nlm.nih.gov/articles/PMC12589860/]
- 56. Iterative RNA FISH Experimental Protocol SOP002.v.4.6 [https://www.protocols.io/view/iterative-rna-fish-experimental-protocol-sop002-v-hadhb2a37.html]
- 57. Key Errors to Avoid in the Consideration of Fluorescence Quenching ... [https://www.spectroscopyonline.com/view/key-errors-avoid-consideration-fluorescence-quenching-data]
- 58. What's wrong with my FFPE FISH? [https://www.ogt.com/resources/fish-resources-and-support/fish-support/whats-wrong-with-my-ffpe-fish/]
- 59. Protocol optimization improves the performance of ... [https://www.nature.com/articles/s41598-025-17477-1]
- 60. A novel protein-preserving passive tissue clearing ... [https://www.nature.com/articles/s12276-025-01550-w]
- 61. Evaluation of autofluorescence quenching techniques on ... [https://www.sciencedirect.com/science/article/abs/pii/S0022175921001423]
- 62. PNA FISH Probes for Research [https://pnabio.com/pna-fish-probes/]
- 63. Anti-Dye Antibodies [https://www.thermofisher.com/us/en/home/life-science/antibodies/primary-antibodies/epitope-tag-antibodies/anti-dye-antibodies.html]
- 64. Why is autofluorescence obscuring my Stellaris™ RNA ... [https://oligos.biosearchtech.com/support/faqs/stellaris-rna-fish/why-is-autofluorescence-obscuring-my-stellaris-rna-fish-signal]
- 65. Highly efficient and robust π-FISH rainbow for multiplexed ... [https://www.nature.com/articles/s41467-023-36137-4]
- 66. Tetrahedral DNA dendritic nanostructure-enhanced FISH ... [https://www.nature.com/articles/s41467-025-64294-1]
- 67. FISH Tips and Troubleshooting [https://www.clinicallab.com/fish-tips-and-troubleshooting-22053]
- 68. What's wrong with my FFPE FISH? [https://www.ogt.com/us/resources/fish-resources-and-support/fish-support/whats-wrong-with-my-ffpe-fish/]
- 69. A framework to enhance the signal - to - noise for ratio ... quantitative [https://journals.plos.org/plosone/article?id=10.1371/journal.pone.0330718]
- 70. Deep-learning microscopy image reconstruction with quality ... [https://pmc.ncbi.nlm.nih.gov/articles/PMC9896941/]
- 71. Quality Assurance/Quality Control of Fluorescence in Situ ... [https://www.lidsen.com/journals/genetics/genetics-02-04-038]
- 72. An Improved Chirp Coded Excitation Based on Compression Pulse... [https://pubmed.ncbi.nlm.nih.gov/32746209/]
- 73. Terahertz spectroscopy in biomedical field: a review on... [https://photonix.springeropen.com/articles/10.1186/s43074-020-00011-z]
- 74. Characterizing and Quenching Autofluorescence in Fixed ... [https://pubmed.ncbi.nlm.nih.gov/36834842/]
- 75. Here's Why Neuroscience Researchers use TrueBlack ... [https://www.atlantisbioscience.com/blog/heres-why-neuroscience-researchers-use-trueblack-lipofuscin-autofluorescence-quencher-instead-of-sudan-black-b/?srsltid=AfmBOor9K9IwXpK8a1z1HR74vAAroRfuij7q6YfiEDpdJ6TiUOz1kf2G]
- 76. Optimization and evaluation of fluorescence in situ ... [https://pmc.ncbi.nlm.nih.gov/articles/PMC7962668/]
- 77. Know your oligo mod: BHQ® non-fluorescent quenchers [https://blog.biosearchtech.com/know-your-oligo-mod-bhq-black-hole-quencher-dyes]
- 78. BHQnova Probes [https://oligos.biosearchtech.com/products/custom-dna-probes-for-qpcr/bhqnova-probes]
- 79. What's wrong with my hematology FISH? [https://www.ogt.com/us/resources/fish-resources-and-support/fish-support/whats-wrong-with-my-hematology-fish/]
- 80. A quick and simple FISH protocol with hybridization-sensitive ... [https://pmc.ncbi.nlm.nih.gov/articles/PMC3261739/]
- 81. TrueBlack® Lipofuscin Autofluorescence Quencher is the ... [https://biotium.com/citations/trueblack-is-the-preferred-lipofuscin-quencher-for-detection-of-mrna-in-human-neuronal-populations/]
- 82. Optical clearing and auto-fluorescence quenching ... [https://patents.google.com/patent/EP4348216A1/en]
- 83. Spatial analysis of tissue immunity and vascularity by light ... [https://pmc.ncbi.nlm.nih.gov/articles/PMC12276897/]
- 84. EDTP enhances and protects the fluorescent signal of GFP ... [https://www.nature.com/articles/s41598-024-66398-y]
- 85. Light sheet fluorescence microscopy for the investigation of ... [https://parasitesandvectors.biomedcentral.com/articles/10.1186/s13071-022-05157-2]