Benchmarking Human Embryo Models: Validating Fidelity Against In Vivo References for Biomedical Research
This article provides a comprehensive framework for researchers and drug development professionals to authenticate stem cell-based human embryo models.
Benchmarking Human Embryo Models: Validating Fidelity Against In Vivo References for Biomedical Research
Abstract
This article provides a comprehensive framework for researchers and drug development professionals to authenticate stem cell-based human embryo models. It covers the foundational biology of early human development, current methodologies for model generation, and the critical application of single-cell RNA-sequencing reference tools for benchmarking. The content addresses common pitfalls in model validation, outlines optimization strategies, and synthesizes how rigorous benchmarking ensures these models are biologically meaningful for studying developmental disorders, improving assisted reproductive technologies, and conducting teratogen screening.
Understanding the Blueprint: Human Embryogenesis and the Rise of Stem Cell-Based Models
The earliest stages of human development represent a period of remarkable transformation, beginning with a single fertilized egg and progressing to a structured, multi-layered embryo. Understanding these precise developmental milestones is not only fundamental to embryology but also critically important for evaluating the rapidly advancing field of synthetic embryo models. This guide provides a systematic comparison of key embryonic stages against emerging embryo model technologies, offering researchers in developmental biology and drug discovery a structured framework for benchmarking in vitro systems against established in vivo references. The transition from zygote to gastrula encompasses the first three weeks of human development, characterized by precisely timed events of cell division, differentiation, and morphological reorganization that can be quantitatively assessed for model validation [1] [2].
Comparative Timeline of Key Developmental Stages
Table 1: Chronological Stages of Early Human Development from Fertilization to Gastrulation
| Day Post-Fertilization | Carnegie Stage | Developmental Event | Key Morphological Features | Research Imaging Considerations |
|---|---|---|---|---|
| 1 | 1 | Fertilization | Formation of diploid zygote | Not accessible for in vivo imaging |
| 2-3 | 2-3 | Cleavage | Division to 2-cell, 4-cell, morula (16+ cells) | Limited to in vitro models [3] |
| 4-5 | 4 | Blastulation | Formation of blastocyst with inner cell mass and trophoblast | Confocal microscopy possible for models [3] |
| 5-7 | 5 | Implantation | Blastocyst hatches and implants into uterine wall | Inaccessible for direct observation in humans |
| 7-12 | 5-6 | Bilaminar Disc | Formation of epiblast and hypoblast layers | Limited to histological reconstruction |
| 13-15 | 6-7 | Primitive Streak | Gastrulation begins; emergence of three germ layers | Ultrasound microscopy possible in animal models [3] |
| 16-21 | 8-9 | Gastrulation | Formation of ectoderm, mesoderm, and endoderm | Live imaging limited to model organisms [3] |
Table 2: Quantitative Metrics for Developmental Staging Benchmarking
| Developmental Stage | Size Range | Cell Number Estimate | Critical Quality Indicators | Common Abnormalities in Models |
|---|---|---|---|---|
| Zygote | 100-150 µm | 1 | Two pronuclei, two polar bodies | Triploidy, fertilization failure |
| Morula | 120-150 µm | 16-32 | Compaction, loss of cell boundaries | Arrested cleavage, fragmentation |
| Blastocyst | 150-200 µm | 100-200 | Distinct inner cell mass, trophectoderm | Collapsed blastocoel, disordered cells |
| Bilaminar Disc | 0.1-0.2 mm | 1,000+ | Defined epiblast and hypoblast layers | Disorganized axial structuring |
| Gastrula | 0.5-1.5 mm | 10,000+ | Primitive streak, three germ layers | Incomplete mesoderm formation |
Experimental Protocols for Developmental Staging
Morphological Assessment of Blastoid Models
Protocol Objective: To quantitatively evaluate the morphological maturity of stem-cell-derived blastocyst models (blastoids) against in vivo benchmarks.
Methodology Details:
- Fix blastoids at day 5-6 of differentiation in 4% paraformaldehyde for 30 minutes
- Permeabilize with 0.1% Triton X-100 for 15 minutes
- Stain with primary antibodies: OCT4 (inner cell mass), CDX2 (trophectoderm), and DAPI (nuclear)
- Image using confocal microscopy with z-stacking at 2µm intervals
- Analyze using image segmentation software to quantify cell numbers per lineage and spatial organization
Validation Metrics:
- Inner cell mass to trophectoderm cell ratio (target: 30:70)
- Blastocoel formation percentage (target: >80% of diameter)
- Polarization of trophectoderm cells (apical-basal orientation)
Recent advances in AI-based classification, such as the deepBlastoid system, have demonstrated the ability to automate this morphological assessment with accuracy surpassing human experts in research settings [4]. This tool uses deep learning to categorize blastoid structures into five quality tiers based on the clarity of inner cell clusters and fluid-filled cavities, enabling high-throughput screening of synthetic models.
Live Imaging of Gastrulation Events
Protocol Objective: To capture dynamic cell movements during gastrulation in experimental models.
Methodology Details:
- Mount embryos/models in fibrin gel for stabilization
- Use genetically encoded fluorescent reporters for germ layer markers: SOX17 (endoderm), BRA (mesoderm), SOX2 (ectoderm)
- Image with light-sheet or spinning disk confocal microscopy every 10-15 minutes for 24-48 hours
- Maintain temperature at 37°C and 5% CO2 throughout imaging
- Track individual cell trajectories using particle image velocimetry (PIV) techniques
Quantitative Analysis:
- Calculate cell velocity vectors and directionality
- Map primitive streak elongation rate (target: 5-10µm/hour)
- Quantify germ layer segregation timing and boundaries
As noted in studies of quantitative in vivo imaging, this approach has been successfully applied to avian and zebrafish embryos to follow extracellular matrix components and cell movements during early heart tube formation, providing reference data for benchmarking human models [3].
Visualization of Developmental Processes
Developmental Pathway from Zygote to Germ Layers
The Scientist's Toolkit: Essential Research Reagents
Table 3: Key Research Reagents for Embryo Model Studies
| Reagent Category | Specific Examples | Research Application | Validation Requirements |
|---|---|---|---|
| Pluripotency Markers | OCT4, SOX2, NANOG antibodies | Inner cell mass characterization | Co-localization verification |
| Lineage Tracing | CellTracker dyes, GFP reporters | Cell fate mapping | Specificity confirmation |
| Extracellular Matrix | Matrigel, laminin, fibronectin | Support for 3D culture | Batch-to-batch consistency |
| Metabolic Supplements | Pyruvate, glutamine, lipids | Energy substrate provision | Concentration optimization |
| Signaling Modulators | BMP4, FGF2, WNT agonists | Germ layer differentiation | Temporal precision |
| Fixation Reagents | Paraformaldehyde, methanol | Morphological preservation | Protocol standardization |
Benchmarking AI Applications in Embryo Model Research
The emergence of artificial intelligence tools has created new opportunities for quantifying and classifying embryonic structures, but recent studies highlight important considerations for their application in research settings.
Table 4: Performance Comparison of AI Applications in Embryo Analysis
| AI Application | Reported Performance | Limitations | Research Utility |
|---|---|---|---|
| deepBlastoid (blastoid classification) | Surpasses human expert accuracy in morphology assessment [4] | Training on limited dataset (~1,800 images) | High-throughput screening of synthetic models |
| SIL models (IVF embryo selection) | AUC ~60%, Critical error rate ~15% [5] | Poor consistency in ranking (Kendall's W ~0.35) | Limited reliability for precise quality assessment |
| LightGBM (blastocyst yield prediction) | R²: 0.673-0.676, MAE: 0.793-0.809 [6] | Center-specific training data | Cycle-level prediction rather than embryo quality |
Recent research evaluating AI stability in embryo assessment revealed substantial variability, with models showing poor consistency in embryo rank ordering (Kendall's W approximately 0.35) and high critical error rates (approximately 15%) where low-quality embryos were incorrectly top-ranked [5]. This instability, observed even among models with similar predictive accuracies, highlights the importance of rigorous validation when implementing AI tools for embryo model classification.
The precise staging of early human development from zygote to gastrula provides an essential reference framework for evaluating increasingly sophisticated embryo models. By combining traditional morphological assessment with emerging technologies such as AI classification and live imaging, researchers can establish quantitative benchmarks for model fidelity. Current data suggests that while AI tools show promise for high-throughput screening of embryo models, their instability in clinical embryo assessment underscores the need for rigorous validation in research applications. As the field progresses, integrating multiple assessment modalities—morphological, molecular, and functional—will be essential for establishing comprehensive quality standards that accurately reflect in vivo developmental processes.
Despite decades of advances in reproductive medicine, the process of human embryo implantation remains a major barrier to achieving pregnancy, contributing significantly to infertility and early pregnancy loss. Our understanding of this critical developmental stage, often referred to as a "black box," remains limited by both the inability to observe this process in utero and the poor translatability of animal models [7]. For decades, knowledge has relied solely on the Carnegie Collection—a limited set of histological specimens that precludes molecular or chronological analysis [7]. This fundamental knowledge gap has driven the development of alternative research models, each with distinct technical capabilities and ethical considerations that must be carefully benchmarked against in vivo development.
The emergence of extended in vitro embryo culture systems and stem cell-based embryo models offers powerful opportunities to study the dynamic molecular and cellular events of human embryogenesis in real time [7] [8]. These models present researchers with critical choices regarding their appropriate application, fidelity to natural development, and ethical acceptability. This review serves as a comparative guide to these technologies, objectively evaluating their performance against natural embryos and providing the experimental frameworks necessary for informed model selection in basic research and drug development.
Comparative Analysis of Human Embryo Research Models
Model Classifications and Characteristics
Human embryo research utilizes three primary model systems, each with distinct advantages and limitations for investigating early development.
Natural human embryos derived from IVF represent the gold standard for research but face significant ethical and practical constraints. Research is typically restricted to the first 14 days post-fertilization, a limit based on the emergence of the primitive streak and the completion of implantation [9]. While some ethical frameworks now advocate for extending this period to 28 days to study organ development origins, this remains controversial [9].
Stem cell-based embryo models (SCBEMs) reconstruct embryonic development using pluripotent stem cells and are categorized as either non-integrated or integrated models. Non-integrated models mimic specific aspects of development, such as the 2D micropatterned colony reflecting gastrulation or the 3D post-implantation amniotic sac embryoid (PASE) [8]. Integrated models contain both embryonic and extra-embryonic cell types and are designed to model the integrated development of the entire early human conceptus [8] [10].
In vitro embryo culture systems enable the extended culture of natural embryos beyond previous limitations, potentially allowing observation of implantation stages previously inaccessible to research [7].
Table 1: Classification and Characteristics of Human Embryo Research Models
| Model Type | Key Features | Developmental Coverage | Ethical Status |
|---|---|---|---|
| Natural Human Embryos | Derived from IVF; considered the "gold standard" | Pre-implantation to 14 days (legally restricted); some proposals to extend to 28 days | Highest protection level; subject to 14-day rule in most countries [9] |
| Non-integrated Embryo Models | Mimic specific developmental aspects; lack some tissue types | Post-implantation processes (gastrulation, amniotic sac formation) | Lower moral status than natural embryos; not subject to 14-day rule [8] [9] |
| Integrated Embryo Models | Contain embryonic and extra-embryonic cell types; model entire conceptus | Pre- to post-implantation stages; potential for extended development | Currently not granted same status as natural embryos; transfer to uterus prohibited [8] [9] |
| In Vitro Culture Systems | Support development of natural embryos in laboratory setting | Implantation stages and early post-implantation | Subject to same restrictions as natural embryos [7] |
Technical Performance Benchmarking
When evaluating model performance against natural embryogenesis, researchers must consider morphological fidelity, developmental trajectory, and molecular accuracy.
Table 2: Technical Performance Metrics of Embryo Research Models
| Model System | Morphological Fidelity | Developmental Timeline | Lineage Representation | Key Limitations |
|---|---|---|---|---|
| Natural Embryos | Complete anatomical structure | Physiologically accurate | All embryonic and extra-embryonic lineages | Limited availability; ethical restrictions; technical challenges in prolonged culture [7] [9] |
| Micropatterned Colonies | Radial organization of germ layers; lacks 3D architecture | Accelerated development; compressed timeline | Ectoderm, mesoderm, endoderm; extra-embryonic cells of unclear origin [8] | Two-dimensionality doesn't reflect in vivo condition; lacks bilateral symmetry and central lumen [8] |
| PASE Embryoids | 3D amniotic sac-like structure; disk-like epiblast | Models post-implantation events | Amniotic ectoderm, epiblast, primitive streak-like cells [8] | Limited extra-embryonic components; incomplete lineage specification |
| Integrated Embryo Models | High structural organization; embryonic and extra-embryonic compartments | Varies by protocol; generally follows natural sequence | Epiblast, trophoblast, hypoblast derivatives [10] | Incomplete extra-embryonic support systems; limited developmental potential [10] |
Functional Application in Research and Drug Development
Different embryo models offer distinct advantages for specific research applications, from basic developmental biology to pharmaceutical testing.
Developmental Process Investigation: Non-integrated models like micropatterned colonies have proven invaluable for studying fundamental mechanisms such as basement membrane assembly and disassembly, with researchers identifying OCT4 as a major regulator of this process [8]. These simplified systems allow precise manipulation of specific developmental events without the complexity of complete embryogenesis.
Disease Modeling and Drug Screening: Integrated embryo models provide platforms for investigating congenital abnormalities, developmental disorders, and infertility-related conditions such as implantation failure [7] [10]. Their scalability enables medium-throughput drug screening that would be impossible using natural embryos.
AI-Enhanced Predictive Modeling: Machine learning approaches are increasingly applied to embryo assessment, with models like FEMI (Foundational IVF Model for Imaging) trained on approximately 18 million time-lapse embryo images to predict ploidy status, blastocyst quality, and developmental milestones [11]. These tools achieve area under the receiver operating characteristic (AUROC) > 0.75 for ploidy prediction using only image data, significantly outpacing benchmark models [11].
Experimental Protocols and Methodologies
Standardized Framework for Embryo Model Evaluation
To enable meaningful comparison across studies, researchers have proposed standardized assessment criteria based on morphological, temporal, and functional benchmarks [7]. This framework allows for consistent evaluation of model performance against natural embryogenesis.
Morphological Criteria include the formation of key embryonic structures such as the primitive streak, amniotic cavity, and bilaminar disc. For integrated models, the presence and organization of extra-embryonic tissues represents a critical benchmark.
Temporal Alignment requires that developmental milestones in model systems occur within timeframes consistent with natural embryogenesis. Significant deviations may indicate aberrant developmental pathways.
Functional Capacity assessment examines whether models recapitulate fundamental developmental processes such as cell differentiation, tissue morphogenesis, and lineage specification observed in natural embryos.
Machine Learning Implementation for Embryo Assessment
Recent advances incorporate artificial intelligence for quantitative embryo evaluation. The development of machine learning models like LightGBM for predicting blastocyst yield demonstrates how AI can enhance predictive accuracy in embryo assessment [6].
Data Preparation: Models are typically trained on thousands of IVF cycles, with datasets randomly split into training and test sets. For example, one study utilized 9,649 cycles with 3,927 (40.7%) producing no usable blastocysts, 3,633 (37.7%) yielding one or two usable blastocysts, and 2,089 cycles (21.6%) resulting in three or more usable blastocysts [6].
Feature Selection: Recursive feature elimination (RFE) identifies optimal predictive features. The LightGBM model identified eight key predictors, with the number of extended culture embryos emerging as the most critical (61.5%), followed by Day 3 embryo metrics including mean cell number (10.1%) and proportion of 8-cell embryos (10.0%) [6].
Model Validation: Performance metrics include R² values (0.67-0.68 for top models vs. 0.59 for linear regression) and mean absolute error (0.79-0.81 vs. 0.94 for linear regression) [6]. The FORTUNE classification system demonstrates how such models can stratify patients into distinct prognostic groups, with chances of obtaining ≥3 euploid blastocysts ranging from 79.8% in very good prognosis groups to 0% in very poor prognosis groups [12].
Protocol for Integrated Embryo Model Generation
The generation of integrated embryo models requires precise coordination of multiple cell types and signaling environments.
Cell Line Preparation: Human pluripotent stem cells (hPSCs), including embryonic stem cells (hESCs) or induced pluripotent stem cells (hiPSCs), are maintained in defined conditions. Extra-embryonic-like cells may be modified to overexpress specific transcription factors [10].
Self-Organization Induction: Through cadherin-mediated cell adhesion and cortical tension regulation, stem cells self-assemble into structures mimicking post-implantation embryos. XEN cells orient themselves under ES cells, while TS cells position above ES cells, recapitulating natural embryonic architecture [10].
Culture Conditions: Models are typically embedded in ECM-containing media and cultured under precisely controlled physicochemical conditions to support multi-lineage development and morphogenesis.
The Scientist's Toolkit: Essential Research Reagents and Materials
Table 3: Key Research Reagents for Embryo Model Research
| Reagent/Category | Function | Example Applications | Technical Considerations |
|---|---|---|---|
| IVF Blastocyst Medium | Supports embryo development from blastocyst stage to transfer | Extended embryo culture; implantation studies | Defined formulations with precise amino acids, vitamins, growth factors; controlled pH and osmolality [13] |
| Extracellular Matrix Components | Provide structural support and biochemical cues | 3D model formation; microenvironment studies | Matrigel, collagen, laminin; concentration affects differentiation outcomes [8] |
| Signaling Pathway Modulators | Direct lineage specification and morphogenesis | Germ layer patterning; embryonic-extraembryonic interactions | BMP4, WNT, NODAL inhibitors/activators; concentration and timing critical [8] |
| Cell Lineage Markers | Identify and validate cell types | Quality assessment; protocol validation | Immunofluorescence markers for epiblast (OCT4), trophectoderm (CDX2), hypoblast (SOX17) [10] |
| Time-Lapse Imaging Systems | Non-invasive monitoring of development | Morphokinetic analysis; AI model training | EmbryoScope systems; image capture frequency affects data resolution [11] |
| Single-Cell Analysis Platforms | Molecular characterization at cellular resolution | Transcriptomic profiling; lineage tracing | scRNA-seq, spatial transcriptomics; requires cell dissociation or sectioning [10] |
Ethical Frameworks and Regulatory Considerations
The ethical landscape surrounding human embryo research continues to evolve alongside technical capabilities. The foundational "14-day rule" – restricting embryo culture to approximately 14 days post-fertilization – represents a carefully considered but debatable demarcation rather than a rigid moral boundary [9]. Recent proposals advocate extending this limit to 28 days to study critical developmental events including the origins of organ development and congenital abnormalities, while noting that beyond 28 days, research on aborted tissues becomes a viable alternative [9].
Stem cell-based embryo models present distinct ethical considerations. The International Society for Stem Cell Research (ISSCR) has established clear guidelines prohibiting the use of any stem cell-based embryo models to attempt pregnancy in humans or animals, or growing them in artificial wombs to viability points [14]. A consensus is emerging that integrated embryo-like structures should not currently be granted the same moral status as natural embryos, though if they pass certain developmental competence tests, they should be subject to similar regulations [9].
For drug development applications, embryo models offer significant advantages in reduced ethical concerns compared to natural embryo research. However, researchers must navigate varying international regulations regarding embryo model research and its applications in pharmaceutical testing [10]. The ethical framework for these technologies continues to develop through multidisciplinary collaboration between scientists, ethicists, and policymakers.
The rapidly advancing field of human embryo modeling presents researchers with an expanding toolkit for investigating early development. Natural embryos remain the gold standard but face significant ethical and practical constraints. Stem cell-based models offer complementary approaches with varying degrees of biological fidelity and ethical complexity. As these technologies continue to evolve, standardized benchmarking against natural embryogenesis will be essential for validating their utility in basic research and drug development.
Future advances will likely focus on enhancing model fidelity through improved recapitulation of embryonic-extraembryonic interactions, spatial organization, and developmental timing. The integration of artificial intelligence with multi-omics technologies promises to unlock deeper insights into developmental mechanisms while improving predictive accuracy for clinical applications. Throughout these technical advances, maintaining thoughtful ethical oversight and public engagement will be essential for responsible progress in this transformative field.
For researchers selecting embryo models, the optimal choice depends fundamentally on the specific scientific question, with each model system offering distinct advantages for particular applications. As these technologies mature, they hold immense promise for illuminating the mysteries of early human development, unraveling the causes of developmental disorders, and creating novel platforms for drug discovery and safety testing.
Stem cell-based embryo models (SCBEMs) are three-dimensional structures derived from pluripotent stem cells that self-organize to mimic specific aspects of early human embryonic development [15]. These innovative models provide unprecedented opportunities to study developmental processes that are otherwise inaccessible in utero, addressing fundamental questions about human embryogenesis, infertility, early pregnancy loss, and developmental disorders [8] [15]. The field has rapidly evolved to generate models that recapitulate various developmental stages, leading to the emergence of two primary classifications: integrated and non-integrated systems.
Integrated embryo models are designed to contain both embryonic (epiblast-derived) and extra-embryonic (hypoblast and trophoblast-derived) cell lineages, aiming to recapitulate the integrated development of the entire early human conceptus [16] [8]. In contrast, non-integrated models typically consist of epiblast derivatives alone and mimic only specific aspects of embryo development, often lacking complete extra-embryonic lineages [16] [8]. Both systems serve as vital tools for overcoming the ethical and technical limitations associated with human embryo research, while providing scalable platforms for investigating developmental principles and disease mechanisms [17] [8].
Table 1: Fundamental Characteristics of Embryo Model Classifications
| Feature | Integrated Models | Non-Integrated Models |
|---|---|---|
| Definition | Contain embryonic and multiple extra-embryonic lineages | Model specific aspects of development without complete extra-embryonic compartments |
| Lineage Composition | Epiblast, trophoblast, and hypoblast derivatives | Primarily epiblast-derived tissues; may include some extra-embryonic cell types |
| Developmental Potential | Model integrated development of entire conceptus | Limited to specific processes or windows of development |
| Regulatory Oversight | Subject to more extensive scientific and ethical review [16] | Generally subject to less stringent oversight [16] |
| Representative Examples | Blastoids, E-assembloids, SEMs, Bilaminoids [16] | Gastruloids, MP colonies, PASE, PTED embryoids [16] [8] |
Quantitative Benchmarking of Model Systems
Lineage Composition and Molecular Fidelity
The utility of embryo models hinges on their molecular, cellular, and structural fidelity to natural human embryos [17]. Recent advances in single-cell RNA-sequencing (scRNA-seq) have enabled rigorous transcriptional benchmarking against integrated reference datasets from human embryos spanning zygote to gastrula stages [17]. These references capture key developmental transitions, including the first lineage branch point where inner cell mass and trophectoderm cells diverge around embryonic day 5 (E5), followed by the bifurcation of ICM cells into epiblast and hypoblast lineages [17].
Table 2: Quantitative Benchmarking of Embryo Models Against In Vivo References
| Model Type | Key Marker Expression | Developmental Stage Modeled | Transcriptional Similarity to In Vivo |
|---|---|---|---|
| Blastoids | CDX2 (TE), NR2F2 (TE), NANOG (epiblast), GATA4 (hypoblast) [17] | Pre-implantation blastocyst (E5-E7) | High similarity to blastocyst lineages; shows limited developmental potential post-implantation [16] |
| Gastruloids | TBXT (primitive streak), POU5F1 (epiblast), MESP2 (mesoderm) [17] | Post-implantation gastrulation (E14+) | Recapitulates germ layer specification; lacks extra-embryonic support tissues [8] |
| MP Colonies | BMP4-responsive genes, ectoderm/mesoderm/endoderm markers [8] | Early gastrulation (E14) | Represents radial patterning of germ layers; lacks 3D architecture and bilateral symmetry [8] |
| PASE | ISL1 (amnion), GABRP (amnion), epithelial-mesenchymal transition markers [17] [8] | Peri-implantation to early post-implantation (E8-E10) | Forms amniotic sac-like structures; shows lumenogenesis and PS-like structure development [8] |
Functional and Morphological Benchmarking
Beyond transcriptional profiling, functional assessments evaluate the morphological and developmental capabilities of embryo models. Quantitative experimental embryology approaches—including cell addition, removal, and confinement experiments—provide essential metrics for evaluating model performance [18]. For instance, the ability of blastoids to mimic the mechanical properties of natural blastocysts, such as surface tensions governing cell sorting and lineage segregation, represents a critical benchmark [19]. Computational modeling of these physical interactions has revealed how asymmetric segregation of apical domains generates blastomeres with different contractility, ultimately triggering cell sorting into inner and outer positions [19].
Cadherin-mediated cell adhesion and cortical tension have been identified as crucial mechanical determinants in synthetic embryo formation, with differential cadherin expression driving precise cell sorting that defines the basic architecture of developing embryo models [10]. Experimental manipulation of these mechanical properties can enhance the formation efficiency of well-organized synthetic embryos, providing quantitative parameters for optimizing model systems [10].
Experimental Protocols for Model Generation
Generation of Non-Integrated Embryo Models
Micropatterned Colonies (MP Colonies):
- Protocol: Seed human embryonic stem cells (hESCs) on circular micropatterns fabricated on slides with arrays of extracellular matrix (ECM)-coated disks [8]. The ECM drives cell adhesion and defines colony boundaries.
- Induction: Treat with BMP4 to induce self-organization into radial patterns over 3-5 days [8].
- Outcome: Generation of 2D structures with an ectodermal center encircled by mesodermal and endodermal rings, with an outermost ring of extra-embryonic cells of unclear origin [8].
- Validation: Immunostaining for germ layer markers (SOX2 for ectoderm, BRA for mesoderm, SOX17 for endoderm) and analysis of BMP4 response pathways [8].
Gastruloids:
- Protocol: Aggregate hESCs in low-adhesion U-bottom plates to form 3D aggregates [8].
- Induction: Activate Wnt, BMP, and Nodal signaling pathways using CHIR99021, BMP4, and other small molecules to mimic primitive streak patterning [8].
- Outcome: Formation of elongated structures displaying axial organization and representing the three germ layers without extra-embryonic support [8].
- Validation: Single-cell RNA-sequencing to confirm presence of ectoderm, mesoderm, and endoderm populations; trajectory analysis to verify proper lineage relationships [17].
Generation of Integrated Embryo Models
Blastoids:
- Protocol: Aggregate extended pluripotent stem cells (EPS cells) or reprogrammed cells in specialized 3D culture systems [16] [10].
- Lineage Specification: Employ sequential modulation of Hippo, TGF-β, and Wnt signaling pathways to specify trophectoderm, epiblast, and primitive endoderm lineages [16].
- Outcome: Formation of blastocyst-like structures with three founding lineages: epiblast, hypoblast, and trophoblast [16].
- Validation: Immunofluorescence for lineage-specific markers (NANOG for epiblast, GATA6 for hypoblast, CDX2 for trophoblast); transcriptomic comparison to human blastocysts; demonstration of in vitro attachment and outgrowth potential [16] [17].
E-assembloids/SEMs (Structured Embryo Models):
- Protocol: Co-culture hESCs with genetically modified extraembryonic-like cells overexpressing specific transcription factors in a 3D ECM scaffold [10].
- Induction: Utilize tissue-tissue interactions and self-organization principles driven by cadherin-mediated cell adhesion and cortical tension [10].
- Outcome: Formation of post-implantation embryo-like structures with embryonic and extra-embryonic compartments [16] [10].
- Validation: Detailed morphological analysis; scRNA-seq benchmarking against integrated human embryo references; functional tests for developmental potential [17] [10].
The Scientist's Toolkit: Essential Research Reagents
Table 3: Essential Reagents for Embryo Model Research
| Reagent/Category | Specific Examples | Function in Embryo Modeling |
|---|---|---|
| Stem Cell Sources | Human embryonic stem cells (hESCs), induced pluripotent stem cells (hiPSCs), extended pluripotent stem cells (EPS cells) [8] [10] | Starting material for generating embryo models; different types offer varying differentiation potentials and applications |
| Signaling Modulators | BMP4, CHIR99021 (Wnt activator), FGF2, TGF-β inhibitors, Nodal/Activin A [8] | Direct lineage specification and patterning by activating or inhibiting key developmental pathways |
| Extracellular Matrix | Matrigel, laminin, collagen, synthetic hydrogels [8] [19] | Provide structural support and biochemical cues for 3D organization; influence cell polarity and morphogenesis |
| Culture Systems | Low-adhesion plates, micropatterned surfaces, air-liquid interface cultures, microfluidic devices [8] | Control the physical environment for aggregate formation and self-organization; enable high-throughput production |
| Analytical Tools | Single-cell RNA-sequencing, live-imaging systems, immunofluorescence markers, computational modeling tools [17] [18] [19] | Enable validation and characterization of models at molecular, cellular, and structural levels |
Signaling Pathways and Molecular Regulation
Embryo model development is governed by conserved signaling pathways that direct lineage specification and morphogenetic events. In integrated models, the interplay between embryonic and extra-embryonic tissues is mediated by BMP, Wnt, Nodal, and FGF signaling pathways, which establish feedback loops necessary for coordinated development [8] [10]. In non-integrated models such as gastruloids, controlled activation of Wnt signaling initiates primitive streak-like patterning, while BMP and Nodal signaling guide germ layer segregation [8].
At the molecular level, transcription factor networks drive lineage commitment: OVOL2 and CDX2 regulate trophectoderm specification; NANOG and POU5F1 maintain pluripotency in epiblast compartments; GATA4 and SOX17 direct hypoblast formation; and TBXT marks primitive streak initiation during gastrulation [17]. Recent single-cell transcriptomic analyses have identified additional regulators, including HMGN3 which shows upregulated expression across multiple lineages during post-implantation stages [17].
Stem cell-based embryo models, whether integrated or non-integrated, provide complementary platforms for investigating distinct aspects of human development. Integrated models offer more comprehensive systems for studying the crosstalk between embryonic and extra-embryonic tissues during critical developmental transitions, while non-integrated models allow focused investigation of specific processes such as germ layer patterning and axial organization [16] [8]. Both approaches continue to be refined through rigorous benchmarking against in vivo references, particularly using single-cell transcriptomic atlases that provide high-resolution maps of human embryogenesis [17].
The future of embryo modeling will likely see increased sophistication in model fidelity, integration with microphysiological systems, and application to disease modeling and drug screening [10]. However, these advances must be accompanied by ongoing ethical oversight, as emphasized in recent ISSCR guideline updates that propose all organized 3D human SCBEMs should be subject to appropriate review, have clear scientific rationale, and adhere to defined culture timelines [16] [20] [21]. As the field progresses, quantitative benchmarking against gold-standard references will remain essential for validating new models and ensuring their physiological relevance to human development.
The use of model organisms, particularly the mouse (Mus musculus), is fundamental to biomedical research, providing critical insights into the molecular and cellular mechanisms of human development. Despite significant genetic homology, substantial differences in developmental timing, physiology, and gene regulation exist between these species, creating a "cross-species gap" that can hinder translational research success. In the context of benchmarking embryo models—a rapidly advancing field—understanding these differences becomes paramount for accurate validation and interpretation. This guide objectively compares mouse and human developmental processes, synthesizing current experimental data to highlight critical species-specific differences. By framing these comparisons within a rigorous benchmarking framework, we provide researchers, scientists, and drug development professionals with the evidence necessary to critically evaluate model systems and improve the predictive power of preclinical studies.
Fundamental Biological Differences in Development
Developmental Timing and Staging
Mouse and human embryos follow distinct developmental timelines, particularly during key events such as implantation and gastrulation. These temporal differences are crucial for interpreting experimental results from stem cell-derived embryo models.
Table 1: Comparative Developmental Timelines of Key Early Events
| Developmental Event | Mouse Timeline | Human Timeline | Significance for Modeling |
|---|---|---|---|
| Implantation | ~E4.5 | ~Day 7-12 | Human models require extended culture to post-implantation stages [17] |
| Gastrulation | ~E6.5-7.5 | ~Day 14-16 | Human gastrulation occurs after embryo culture "14-day rule" limit [17] |
| Blastocyst Formation | ~E3.5 | ~Day 5-6 | Timing is relatively conserved, making blastocyst models more comparable [17] |
| Early Organogenesis | ~E8.5 and beyond | ~Week 3-8 and beyond | Mouse models enable full in vivo study of organogenesis [22] |
Transcriptomic and Regulatory Divergence
Systematic comparisons of gene expression profiles reveal that transcriptional programs, even when producing similar morphological stages, can differ significantly between species.
- Divergent Transcriptional Programs: A comparative analysis of embryonic gene expression found that when directly translating mouse results to human, only one out of three significantly altered genes was shared, with a mean overlap of just 5% (1 in 20 genes) across studies. This indicates that identification of human disease-associated genes by direct inference from mouse gene expression fails to capture the majority of the human signal [23].
- Conservation of Developmental Genes, Divergence of Expression: While the core set of developmental genes is often conserved, their expression patterns can be species-specific. Research in nematodes revealed that over a third of orthologous genes exhibited divergent temporal expression patterns between two morphologically similar species, suggesting that similar developmental outcomes can be achieved through different transcriptional routes [24].
- Epigenetic and Regulatory Landscapes: Studies of the developing mouse visual cortex have reconstructed detailed gene regulatory networks that link transcription factors to downstream targets through accessible chromatin motifs [25]. The degree to which these specific regulatory connections are conserved in human development remains an active area of investigation, with differences likely contributing to species-specific traits.
Experimental Data and Quantitative Comparisons
Direct Functional Assessment of Enhancer Activity
Non-coding regulatory elements, such as enhancers, often exhibit significant species-specificity in their activity. The dual-enSERT (dual-fluorescent enhancer inSERTion) system enables quantitative comparison of human enhancer variants in live mouse embryos [26].
Table 2: In Vivo Analysis of Human Enhancer Variants Using Dual-enSERT
| Enhancer (Gene) | Variant | Associated Condition | Observed Effect in Mouse Model | Functional Outcome |
|---|---|---|---|---|
| ZRS (Shh) | 404G>A | Preaxial Polydactyly | Ectopic reporter expression in anterior limb bud | 31-fold stronger expression in anterior hindlimb; Gain-of-function [26] |
| hs737 (EBF3) | 830G>A | Autism Spectrum Disorder | Altered reporter expression in the brain | Reproducible alteration of in vivo enhancer activity [26] |
| OTX2 Enhancer | Rare variants | Neurodevelopmental Disorders | Altered reporter activity in brain | Identified specific variants that disrupt normal activity [26] |
Methodologies for Cross-Species Translation
To systematically address transcriptomic differences, computational tools like the Found In Translation (FIT) model have been developed. FIT leverages public gene expression data to predict human disease-associated genes from mouse experiments [23].
- Experimental Protocol for FIT Model Application:
- Input Data Collection: A new mouse gene expression dataset (disease vs. control) is generated or obtained.
- Compendium Reference: The FIT model draws upon a manually curated compendium of 170 paired human and mouse gene expression datasets across 28 diseases [23].
- Model Prediction: Using a regularized linear model (LASSO), FIT predicts the expected human effect-size per gene by combining the new mouse data with prior knowledge on mouse-human similarities and differences from the training compendium.
- Output and Validation: The model outputs a prioritized list of genes with high predicted relevance to the human condition. In validation studies, FIT increased the overlap of differentially expressed genes with human data by 20-50% compared to direct extrapolation from mouse results [23].
Figure 1: Workflow of the FIT Model for Cross-Species Prediction. The FIT model uses a new mouse experiment and a large compendium of existing paired data to predict genes relevant to the human condition, improving upon direct cross-species extrapolation [23].
The Scientist's Toolkit: Essential Research Reagents and Solutions
Table 3: Key Reagent Solutions for Cross-Species Developmental Studies
| Research Tool / Reagent | Function and Application | Example Use Case |
|---|---|---|
| Dual-enSERT System | Cas9-based site-specific dual-fluorescent reporter for quantitative comparison of enhancer variants in live mice [26]. | Testing human enhancer variants linked to polydactyly and autism in mouse embryos. |
| FIT (Found In Translation) Model | Data-driven statistical model predicting human disease genes from mouse gene expression data [23]. | Increasing translational overlap for diseases like sepsis; available at www.mouse2man.org. |
| scRNA-seq / snMultiome | Single-cell transcriptomics and epigenomics for cell-type atlas construction and regulatory network inference [25]. | Mapping developmental trajectories of all major cell types in the mouse visual cortex. |
| StembryoNet (AI Model) | Deep learning model (ResNet18-based) for classifying and predicting outcomes of stem cell-derived embryo models [27]. | Improving selection accuracy of normal vs. abnormal ETiX-embryos based on live imaging. |
| Raman Spectroscopy | Non-invasive metabolic profiling of embryo culture medium and intracellular components [28]. | Characterizing dynamic glucose and lipid metabolic profiles during murine preimplantation development. |
The empirical data clearly demonstrate that while mouse models are indispensable for developmental biology, direct extrapolation to human development is fraught with challenges. Significant differences in transcriptional regulation, enhancer function, and developmental timing necessitate a cautious and informed approach. For researchers benchmarking embryo models or investigating developmental mechanisms, a multi-faceted strategy is recommended: First, leverage computational tools like the FIT model to prioritize candidate genes and pathways with higher potential for human relevance. Second, employ advanced functional assays like dual-enSERT to directly test human regulatory elements in a live, whole-animal context when possible. Finally, validate key findings across multiple systems, including human cell-based models and where available, non-human primate data, to build a convincing case for translational relevance. By systematically acknowledging and investigating species-specific differences, the scientific community can more effectively bridge the cross-species gap and accelerate the discovery of mechanisms underlying human development and disease.
Building and Applying Embryo Models: From Protocols to Biomedical Insights
The study of early human development has long been constrained by ethical considerations and the limited availability of human embryos. In response, scientists have developed sophisticated stem cell-based embryo models (SCBEMs) that replicate specific aspects of embryogenesis. These models serve as powerful tools for investigating infertility, early pregnancy loss, and congenital diseases, while also providing platforms for drug testing and toxicology screening [8] [29]. The usefulness of these models hinges entirely on their fidelity to in vivo development, making rigorous benchmarking against reference human embryo datasets a critical step in their validation [17].
This guide provides an objective comparison of three primary tools in the scientist's toolkit: blastoids, gastruloids, and micropatterned colonies. We compare their performance, applications, and limitations, with a particular focus on their validation against in vivo references, to help researchers select the most appropriate model for their investigative needs.
Blastoids: Modeling the Pre-Implantation Embryo
Blastoids are three-dimensional cellular models that mimic the pre-implantation human blastocyst approximately 5-7 days post-fertilization [29]. They are integrated models, meaning they contain representative cells from both the embryonic epiblast (which forms the embryo proper) and extra-embryonic lineages, specifically the trophectoderm (precursor to the placenta) and hypoblast (primitive endoderm, which forms the yolk sac) [30] [29]. Their primary application lies in studying early lineage specification, blastocyst formation, and the critical process of implantation [30] [29].
Protocols for generating blastoids have evolved rapidly. Early methods used naive human pluripotent stem cells (PSCs) forced to aggregate in specialized microwells, with more recent approaches achieving efficiencies greater than 70% [29]. These models have been co-cultured with endometrial cells to create "feto-maternal assembloids," successfully mimicking ICM polarization and implantation events, including endometrial stromal cell fusion [30].
Gastruloids: Modeling Post-Implantation Development and Gastrulation
Gastruloids are three-dimensional models that primarily mimic the post-implantation period, specifically the process of gastrulation—a key developmental stage around day 14-16 in human embryos when the three primary germ layers (ectoderm, mesoderm, and endoderm) are established [8] [31]. Traditionally considered non-integrated models, they typically lack structured extra-embryonic tissues and are instead generated by prompting a single stem cell entity to self-organize and differentiate using chemical and physical triggers [8].
These models are particularly valuable for studying germ layer specification, axial organization, and the emergence of the body plan. A significant advance in this field is the development of microraft array-based technology, which allows for the automated screening and sorting of hundreds to thousands of individual gastruloids, enabling large-scale assays and the dissection of heterogeneity within these complex structures [31].
Micropatterned Colonies: A 2D Platform for Studying Gastrulation
Micropatterned (MP) Colonies are a two-dimensional model system designed to study the spatial patterning events of gastrulation [8]. They are created by confining human embryonic stem cells (hESCs) to circular micropatterns on slides coated with extracellular matrix (ECM). Treatment with Bone Morphogenetic Protein 4 (BMP4) induces the cells to self-organize into radial patterns consisting of an ectodermal center, a mesodermal ring, and an endodermal outer layer [8]. A key feature is the formation of a primitive streak (PS)-like structure where cells undergo epithelial-mesenchymal transition (EMT) and migrate inwards, mimicking gastrulation [8].
The major strengths of this system are its simplicity, high reproducibility, and ease of imaging. However, its two-dimensionality does not fully reflect the in vivo condition, and it lacks key features like bilateral symmetry and a central lumen that could develop into an amniotic cavity [8].
Table 1: Key Characteristics of Stem Cell-Based Embryo Models
| Feature | Blastoids | Gastruloids | Micropatterned Colonies |
|---|---|---|---|
| Developmental Stage Modeled | Pre-implantation blastocyst (∼5-7 days post-fertilization) [29] | Post-implantation gastrulation (∼14+ days) [8] [31] | Post-implantation gastrulation (∼14-16 days) [8] |
| Key Lineages Present | Epiblast, Trophectoderm, Hypoblast [30] [29] | Ectoderm, Mesoderm, Endoderm (three germ layers) [8] | Ectoderm, Mesoderm, Endoderm (three germ layers) [8] |
| Extra-Embryonic Tissues | Integrated (contains both embryonic & extra-embryonic) [29] | Generally non-integrated (may contain trophectoderm-like cells) [8] [31] | Non-integrated (may contain cells of unclear extra-embryonic origin) [8] |
| Morphology | 3D spherical, cavitated structure [30] | 3D aggregates [8] | 2D patterned colonies [8] |
| Primary Applications | Implantation studies, early lineage specification [30] [29] | Germ layer formation, axial patterning, disease modeling [8] [31] | Signaling pathway analysis, spatial patterning, high-content screening [8] |
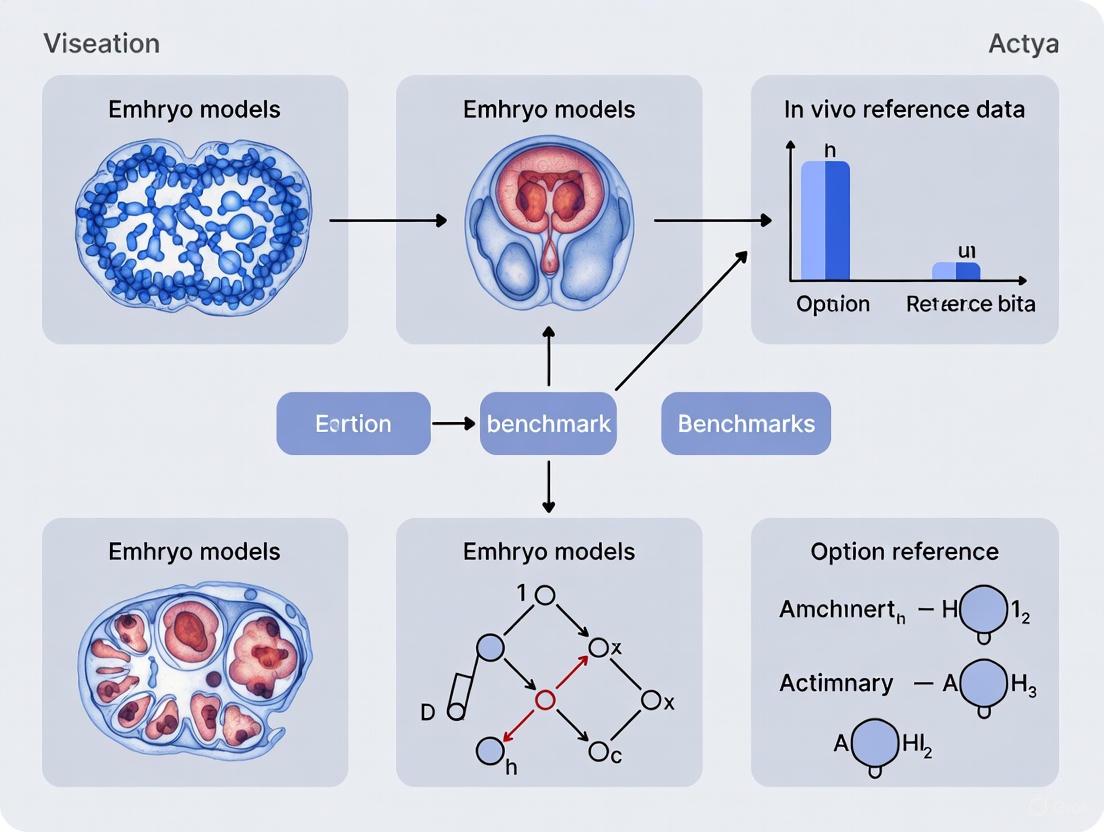
Benchmarking and Validation Against In Vivo Reference Data
A critical challenge in the field is the accurate authentication of embryo models. Global gene expression profiling via single-cell RNA sequencing (scRNA-seq) has become the gold standard for unbiased validation [17]. A significant recent advancement is the creation of a comprehensive human embryo reference tool that integrates scRNA-seq data from six published human datasets, covering development from the zygote to the gastrula stage [17]. This tool allows researchers to project their SCBEM data onto the in vivo reference to annotate cell identities and assess transcriptional fidelity.
Using such a reference for benchmarking is crucial, as studies have revealed a risk of misannotation of cell lineages in embryo models when relevant human embryo references are not utilized [17]. For instance, when used to analyze published models, this integrated reference has highlighted both significant overlaps with human pre-implantation stage cells and the presence of post-implantation cell clusters not typically seen in native pre-implantation samples, underscoring the models' complexity and the need for careful validation [30] [17].
Table 2: Benchmarking Data and Validation Methods
| Model | Key Benchmarking Metrics | Transcriptomic Fidelity (vs. In Vivo Reference) | Common Validation Methods |
|---|---|---|---|
| Blastoids | Presence of OCT4+ (epiblast), GATA3+ (trophectoderm), SOX17+ (hypoblast) cells; blastocoel cavity formation [30] | Overlap with pre-implantation cell clusters, but with notable variation and differences in composition [30] [17] | Immunofluorescence for lineage markers, scRNA-seq, implantation potential in co-culture [30] [29] |
| Gastruloids | Formation of three germ layers; spatial organization; expression of NOG, KRT7; response to BMP4 signaling [31] | Used to identify model-specific transcriptomes and potential misannotations; requires projection on post-implantation reference [17] | Immunofluorescence, scRNA-seq, automated image analysis of patterning [31] |
| Micropatterned Colonies | Radial organization of germ layers; formation of PS-like structure; EMT and cell migration [8] | Can be projected onto gastrulation-stage reference to validate primitive streak-like and germ layer identities [17] | Immunofluorescence (e.g., Collagen IV for basement membrane), analysis of signaling pathways (BMP, WNT, Nodal) [8] |
Experimental Protocols and Workflows
Protocol for Generating Gastruloids and Micropatterned Colonies
The formation of 2D gastruloids or micropatterned colonies begins with the precise patterning of an extracellular matrix (ECM) onto a culture surface. The process involves confining human Pluripotent Stem Cells (hPSCs) to these defined circular islands, which self-organize and differentiate in response to a key signaling molecule, BMP4 [8] [31].
Protocol for Generating Blastoids
Blastoid generation leverages the self-organization capabilities of naive-state pluripotent stem cells. The process relies on forced aggregation to initiate the formation of a structure that mimics the natural blastocyst [30] [29].
Essential Research Reagent Solutions
Successful experimentation with embryo models requires a suite of reliable reagents and platforms. The table below details key materials and their functions as derived from the cited experimental protocols.
Table 3: Essential Research Reagents and Materials
| Reagent/Material | Function | Example Application in Protocols |
|---|---|---|
| Naive State hPSCs | Starting cell population with pre-implantation-like pluripotency, crucial for forming integrated models. | Generation of blastoids [30] [29]. |
| Primed/Conventional hPSCs | Starting cell population with post-implantation-like pluripotency. | Formation of gastruloids and micropatterned colonies [8] [31]. |
| AggreWell/U-Bottom Plates | Microwell plates that force cell aggregation, standardizing the size and shape of 3D aggregates. | Generating uniform blastoid and gastruloid precursors [30]. |
| Bone Morphogenetic Protein 4 (BMP4) | A key morphogen that triggers signaling cascades for germ layer patterning and trophectoderm-like differentiation. | Inducing spatial patterning in micropatterned colonies and gastruloids [8] [31]. |
| Extracellular Matrix (ECM) | Coating substrate that provides adhesive signals and defines the geometry for 2D model culture. | Creating circular micropatterns for colony formation [8] [31]. |
| GATA3, TFAP2C, GATA6, SOX17 Inducible Systems | Transcription factor overexpression to drive differentiation toward extra-embryonic lineages. | Generating trophoblast-like and hypoblast-like cells for integrated embryoids [32]. |
| Microraft Arrays | Platforms with indexed, releasable microrafts for high-throughput imaging and sorting of individual microtissues. | Automated screening and sorting of gastruloids based on phenotypic features [31]. |
The choice between blastoids, gastruloids, and micropatterned colonies is dictated by the specific research question. Blastoids are unparalleled for studying implantation and early lineage segregation, gastruloids excel at modeling gastrulation and germ layer specification, and micropatterned colonies offer a highly reproducible system for dissecting signaling pathways during patterning events [8] [30] [29].
A paramount consideration in this rapidly advancing field is the ethical framework governing this research. The International Society for Stem Cell Research (ISSCR) has established clear guidelines, including the prohibition of transferring any SCBEM to a human or animal uterus or culturing them to the point of potential viability [14] [33]. Adherence to these guidelines is essential for maintaining public trust and ensuring the responsible progression of this transformative science.
As benchmarked model fidelity continues to improve, this toolkit of SCBEMs will profoundly deepen our understanding of human development and disease, paving the way for novel therapeutic interventions in reproductive medicine and beyond.
The emergence of stem cell-based human embryo models represents a transformative development in the study of early human development, offering unprecedented tools for investigating fundamental biological processes, infertility, congenital diseases, and drug testing [8]. These in vitro models are designed to recapitulate specific aspects or entire stages of early human embryogenesis, from the pre-implantation blastocyst to the post-implantation gastrula stage [17] [8]. However, the scientific validity and utility of these models hinge entirely on their fidelity to the in vivo counterparts they aim to emulate [17]. Without rigorous benchmarking against genuine human embryonic reference data, researchers cannot determine whether the cell types, structures, and molecular patterns observed in models accurately reflect natural development or represent artifacts of in vitro culture conditions.
This guide establishes a comprehensive framework for evaluating stem cell-based embryo models against three fundamental criteria: cell-type composition, spatial organization, and functional capacity. The development of integrated analysis tools and reference datasets now enables researchers to move beyond qualitative assessments based on a handful of marker genes to quantitative, unbiased comparisons of entire transcriptional programs and tissue architectures [17] [34]. By implementing the standardized benchmarking approaches detailed in this guide, researchers can authenticate their models with greater confidence, ensure reproducibility across laboratories, and generate biologically meaningful data that advances our understanding of human development.
Benchmarking Criterion 1: Cell-Type Composition
Experimental Protocol: scRNA-Seq and Reference Atlas Integration
The most robust method for authenticating cell-type composition in embryo models involves single-cell RNA sequencing (scRNA-seq) followed by computational projection onto a comprehensive reference atlas. The protocol below outlines the key steps for this authentication process, adapted from established methodologies [17].
- Step 1: Reference Atlas Construction: Integrate multiple published human scRNA-seq datasets covering developmental stages from zygote to gastrula using a standardized processing pipeline. This includes read mapping and feature counting with the same genome reference (e.g., GRCh38) to minimize batch effects. Employ data integration methods such as fast Mutual Nearest Neighbors (fastMNN) to correct for technical variations between datasets and create a unified transcriptional landscape [17].
- Step 2: Cell Type Annotation: Annotate cell identities in the integrated reference using known lineage-specific markers. For early human development, key lineages include trophectoderm (TE), inner cell mass (ICM), epiblast (EPI), hypoblast, and their derivatives (e.g., cytotrophoblast, syncytiotrophoblast, extravillous trophoblast, amnion, primitive streak, mesoderm, definitive endoderm) [17]. Validate these annotations against available human and non-human primate datasets.
- Step 3: Query Data Processing: Process scRNA-seq data from the embryo model using the same bioinformatic pipeline and reference genome as the reference atlas to ensure technical compatibility.
- Step 4: Projection and Prediction: Project the query data onto the pre-established reference using a stabilized Uniform Manifold Approximation and Projection (UMAP). Utilize a prediction tool to assign cell identities from the reference to cells in the embryo model based on transcriptional similarity [17].
- Step 5: Quantitative Assessment: Calculate the proportion of cells in the model that confidently map to expected cell types from the reference at the corresponding developmental stage. Identify and investigate any cell populations that project poorly or map to unexpected identities, as these may represent mis-specifications [17].
Key Analytical Tool: The Integrated Human Embryo Transcriptome Reference
The creation of a comprehensive, integrated reference is fundamental to cell-type composition benchmarking. One such resource integrates six publicly available human datasets, encompassing development from zygote to gastrula stages (Carnegie Stage 7) [17]. This unified atlas includes 3,304 early human embryonic cells and provides a continuous transcriptional roadmap of early human development [17].
Table 1: Key Lineage Markers in the Human Embryo Reference Atlas [17]
| Cell Lineage/Type | Key Marker Genes | Developmental Stage |
|---|---|---|
| Morula | DUXA |
Pre-implantation |
| Inner Cell Mass (ICM) | PRSS3 |
Pre-implantation (E5) |
| Epiblast (early) | POU5F1, NANOG, TDGF1 |
Pre- to Post-implantation |
| Epiblast (late) | HMGN3 |
Post-implantation (E9-CS7) |
| Hypoblast (early) | GATA4, SOX17 |
Post-implantation (E5-E10) |
| Hypoblast (late) | FOXA2, HMGN3 |
Post-implantation (E10+) |
| Trophectoderm (TE) | CDX2, NR2F2 |
Pre-implantation (E5) |
| Cytotrophoblast (CTB) | GATA2, GATA3, PPARG |
Post-implantation |
| Primitive Streak | TBXT |
Gastrulation (CS7) |
| Amnion | ISL1, GABRP |
Gastrulation (CS7) |
| Extra-Embryonic Mesoderm | LUM, POSTN |
Gastrulation (CS7) |
This reference tool has demonstrated practical utility by revealing the risk of misannotation in published human embryo models when relevant human references were not used for benchmarking [17]. For instance, models might lack specific late epiblast markers or express unexpected combinations of transcription factors, highlighting deviations from in vivo developmental trajectories.
Benchmarking Criterion 2: Spatial Organization
Experimental Protocol: Spatially Resolved Omics and Multi-Scale Analysis
While transcriptome analysis identifies cell types, assessing their physical arrangement is crucial for evaluating morphological fidelity. Spatially Resolved Omics (SRO) technologies enable molecular profiling while preserving spatial context, allowing for direct comparison of tissue organization between embryo models and natural embryos [34].
- Step 1: Data Acquisition: Generate SRO data from embryo model sections using technologies such as Xenium, MERFISH, or seqFISH. These methods provide transcriptome-wide or targeted gene expression data along with the precise centroid coordinates of each cell [34].
- Step 2: Cell-Type Annotation and Segmentation: Annotate cell types based on the SRO gene expression data, either de novo or by leveraging cell-type signatures from the scRNA-seq reference. Perform cell segmentation to define the boundaries and spatial positions of all cells within the tissue section.
- Step 3: Multi-Scale Spatial Relationship Analysis: Quantify spatial relationships using an analytical framework like CRAWDAD (Cell-type Relationship Analysis Workflow Done Across Distances) [34]. This workflow assesses whether cell types are statistically enriched (colocalized) or depleted (separated) within each other's neighborhoods at various length scales.
- Step 4: Null Model Generation: Create an empirical null background by shuffling cell-type labels within tiles of a grid overlaid on the tissue. The tile size corresponds to the spatial length scale being tested, preserving local spatial structure while randomizing global cell-type relationships [34].
- Step 5: Statistical Testing and Trend Analysis: For a given reference cell type, calculate the observed proportion of neighbor cell types within a defined neighborhood distance (e.g., 50µm). Compare this to the distribution of proportions from the shuffled data using a binomial proportion test, generating a Z-score for each cell-type pair. Repeat this analysis across a series of length scales (e.g., from 100µm to 1000µm) to create a multi-scale spatial relationship profile [34].
Key Analytical Tool: The CRAWDAD Workflow
The CRAWDAD R package provides a standardized method for quantifying cell-type spatial relationships, moving beyond qualitative descriptions [34]. Its utility lies in characterizing relationships at multiple spatial extents, which is critical because some cell types interact at fine, micrometer scales (e.g., for paracrine signaling), while others organize into larger functional tissue units or anatomical structures [34].
Table 2: Interpretation of Multi-Scale Spatial Relationship Trends [34]
| Spatial Trend Pattern | Biological Interpretation | Example Scenario |
|---|---|---|
| Monotonic Enrichment | Two cell types are consistently colocalized across all analyzed scales. | Intermixed cell populations, such as supportive stromal and parenchymal cells. |
| Oscillatory Trend | Cell types show separation at fine scales but colocalization at broader scales. | Cell types residing in adjacent but distinct tissue layers or compartments within the same organ. |
| Monotonic Depletion | Two cell types are consistently separated across all analyzed scales. | Mutually exclusive cell populations occupying distinct anatomical regions. |
| Scale-Dependent Relationship | A colocalization or separation relationship is only evident at a specific spatial threshold. | A structured niche environment where interactions are confined to a specific physical range. |
This multi-scale approach is more informative than whole-tissue analysis, as it can reveal, for example, that two cell types form distinct compartments at a fine scale but are part of the same larger structure—a nuance that would be missed by a single-scale analysis [34].
Benchmarking Criterion 3: Function
Experimental Protocol: Assessing Developmental Trajectory and Patterning
Functional benchmarking evaluates a model's capacity to execute developmental programs correctly, including the accurate progression through developmental stages and the establishment of fundamental body axes.
- Step 1: Pseudotime and Trajectory Inference: Using the scRNA-seq data from the model, apply trajectory inference algorithms such as Slingshot to order cells along a pseudotemporal continuum. This pseudotime represents an inferred developmental timeline from less to more differentiated states [17].
- Step 2: Transcription Factor Dynamics Analysis: Identify transcription factors whose expression is dynamically modulated along the inferred pseudotime. Use tools like SCENIC to analyze single-cell regulatory networks and infer transcription factor activity. Compare the timing and sequence of these regulatory events to those in the in vivo reference [17].
- Step 3: Axis Patterning Check: For models extending to gastrulation stages, assess the establishment of the anterior-posterior axis. This can involve imaging for asymmetric expression of patterning genes (e.g., by immunofluorescence or in situ hybridization) or scRNA-seq analysis to identify the presence and correct patterning of primitive streak cell populations [8] [17].
- Step 4: Functional Perturbation Assays: Test the model's response to genetic or chemical perturbations. For example, inhibit a key developmental pathway (e.g., WNT, BMP) and assess whether the model fails to form expected lineages or structures, thereby validating that the model's functional circuitry mirrors that of the natural embryo.
Key Analytical Tool: Trajectory Inference and Regulatory Network Analysis
Applying trajectory inference to the integrated human embryo reference has revealed key transcription factor dynamics along the three primary lineage trajectories (epiblast, hypoblast, and trophectoderm) [17]. For instance, along the epiblast trajectory, pluripotency markers like NANOG and POU5F1 are highly expressed in the pre-implantation epiblast but decrease post-implantation, while HMGN3 shows upregulated expression in later stages [17]. Similar analyses can be performed on embryo models to check if these critical regulatory transitions occur at the correct pseudotemporal point.
Table 3: Key Transcription Factor Dynamics in Early Human Lineages [17]
| Lineage Trajectory | Early-Stage Transcription Factors | Late-Stage Transcription Factors | Trajectory-Specific Factors |
|---|---|---|---|
| Epiblast | DUXA, FOXR1, NANOG, POU5F1 |
HMGN3, VENTX |
ZSCAN10 |
| Hypoblast | DUXA, FOXR1, GATA4, SOX17 |
FOXA2, HMGN3 |
GATA4 |
| Trophectoderm | DUXA, FOXR1, CDX2, NR2F2 |
GATA2, GATA3, PPARG, HMGN3 |
NR2F2 |
Successfully conducting the benchmarking experiments outlined above requires a suite of specialized reagents, datasets, and computational tools.
Table 4: Essential Research Reagent Solutions for Benchmarking Embryo Models
| Tool Category | Specific Resource | Function and Application |
|---|---|---|
| Reference Datasets | Integrated Human Embryo Transcriptome Atlas [17] | Gold-standard reference for scRNA-seq data projection and cell identity prediction. Covers zygote to gastrula. |
| Cell Lineage Markers | Validated Antibodies for ISL1, GABRP, TBXT, POU5F1 [17] | Immunostaining of tissue sections to validate spatial organization of key lineages (e.g., amnion, primitive streak, epiblast). |
| Spatial Omics Platforms | Xenium, MERFISH, seqFISH [34] | In situ gene expression analysis to map cell types and states within the intact spatial context of the embryo model. |
| Computational Tools | CRAWDAD R Package [34] | Quantifies cell-type spatial relationships (colocalization & separation) across multiple length scales from SRO data. |
| Developmental Inducers | Recombinant BMP4, WNT Agonists [8] | Used to pattern 2D micropatterned colonies and other embryo models to induce germ layer and lineage specification. |
| Trajectory Analysis Software | Slingshot, SCENIC [17] | Infers developmental pseudotime and reconstructs lineage trajectories from scRNA-seq data. |
Stem cell-based embryo models (SCBEMs) have emerged as transformative tools for studying early human development. Their usefulness in biomedical applications, including infertility research, disease modeling, and teratogen screening, hinges on a critical factor: their fidelity to in vivo human embryos. This guide benchmarks various embryo models against a new, comprehensive human embryo transcriptomic reference, providing an objective comparison of their performance in recapitulating human development. The data reveal that without such rigorous benchmarking, there is a substantial risk of misinterpreting results due to incomplete or inaccurate model systems [17].
A fundamental challenge in human developmental biology is the scarcity and limited accessibility of human embryos for research, compounded by ethical principles and legal regulations, such as the "14-day rule" [17] [8]. While animal models have been invaluable, significant species-specific differences in developmental pathways limit their ability to accurately predict human biology [8] [35].
To overcome these hurdles, researchers have developed a variety of stem cell-based human embryo models. However, the field has lacked an organized, integrated reference dataset to authoritatively determine how well these models mimic actual human development [17]. A universal reference is crucial for the validation and authentication of embryo models, moving beyond the limited verification offered by a handful of lineage markers to an unbiased, global assessment of transcriptional fidelity [17].
A Universal Human Embryo Reference for Model Authentication
Development of the Integrated Transcriptomic Roadmap
A significant advance is the creation of a comprehensive human embryogenesis transcriptome reference. This resource was built by integrating six publicly available single-cell RNA-sequencing (scRNA-seq) datasets, creating a high-resolution roadmap of human development from the zygote to the gastrula stage (Carnegie stage 7) [17].
- Scope: The integrated dataset encompasses 3,304 early human embryonic cells, covering pre-implantation embryos, post-implantation blastocysts cultured in 3D, and an in vivo isolated Carnegie stage 7 gastrula [17].
- Standardization: All datasets were reprocessed using a standardized pipeline aligned to the same genome reference to minimize technical batch effects [17].
- Lineage Annotation: The reference provides detailed annotations for all major embryonic and extra-embryonic lineages, from the initial segregation of the inner cell mass and trophectoderm to the later specification of germ layers and specialized tissues like amnion and primordial streak [17].
Table: Key Features of the Integrated Human Embryo Reference
| Feature | Description |
|---|---|
| Developmental Window | Zygote to Carnegie Stage 7 gastrula (approx. day 16-19) |
| Number of Cells | 3,304 individual embryonic cells |
| Data Type | Single-cell RNA-sequencing (scRNA-seq) |
| Key Lineages Captured | Epiblast, Trophectoderm, Hypoblast, Primitive Streak, Amnion, Mesoderm, Endoderm, Hematopoietic progenitors |
| Primary Application | Benchmarking and authenticating stem cell-based embryo models |
The Embryogenesis Prediction Tool
To make this reference accessible, researchers created an online early embryogenesis prediction tool. This allows scientists to project their own scRNA-seq data from an embryo model onto the reference map. The tool then annotates the model's cells with predicted identities, providing an objective measure of its accuracy in recapitulating specific developmental stages and lineages [17].
Benchmarking Embryo Models for Teratogen Screening
Teratogen screening is a critical application where the predictive power of embryo models is paramount. Traditional animal models are costly, time-consuming, and can show species-specific responses that do not translate to humans [36] [35]. The following section compares the performance of several human stem cell-based assays, with a focus on how they recapitulate in vivo developmental processes.
Performance Comparison of Teratogen Screening Platforms
Table: Comparison of In Vitro Human Pluripotent Stem Cell (hPSC) Teratogen Screening Platforms
| Assay Platform | Principle / Readout | Reported Accuracy | Key Advantages | Key Limitations / Risks |
|---|---|---|---|---|
| Gastruloids (3D) [37] | Morphology & gene expression (e.g., SOX2, BRA, SOX17) in self-organizing structures | Proof-of-concept (Recapitulates known species-specificities) | Recapitulates gastrulation; medium-throughput; quantifiable; mimics species-specific sensitivity | Early-stage model; requires further validation with larger compound libraries |
| Micropatterned hPST (2D) [38] | Morphometric disruption of mesoendoderm patterns (Brachyury+ cells) | 97% Accuracy (100% Specificity, 93% Sensitivity on 30 compounds) | High-throughput; scalable; simplified morphometric readout | 2D architecture lacks 3D context of development |
| Stem Cell Monolayer [36] | Varies (e.g., metabolomics, immunocytochemistry for pluripotency/differentiation markers) | Varies by endpoint | Amenable to high-throughput screening; focuses on specific processes (e.g., self-renewal) | Disorganized structure; lacks morphogenic context; may miss complex teratogenic effects |
| Human Embryo Reference Tool [17] | Transcriptomic fidelity to in vivo human development | N/A (Benchmark, not an assay) | Unbiased, universal authentication; identifies lineage mis-specification | Does not directly predict teratogenicity; used to validate models for use in screening |
Experimental Protocols for Key Assays
Protocol 1: Micropatterned Human Pluripotent Stem Cell Test (µP-hPST)
This assay detects teratogens by their disruption of organized cell differentiation and migration [38].
- Micropatterning: Plate hPSCs (e.g., H9 line) as a confluent monolayer on circular, extracellular matrix-coated micropatterns.
- Mesoderm Induction & Compound Exposure: Culture cells for 3 days in mesoendoderm induction medium, supplemented daily with the test compound at a range of concentrations (e.g., covering IC25 cytotoxicity values and human plasma Cmax).
- Immunostaining: On day 3, fix cells and immunostain for the mesoendoderm marker Brachyury (T).
- Morphometric Analysis: Acquire fluorescent images and quantify morphological features of the T+ patterns (e.g., annular integrity, migration distance). The Lowest Disruption Concentration (LDC) is identified.
- Teratogen Classification: Apply a two-step classification rule based on the LDC and the compound's cytotoxicity thresholds (IC25 for hPSCs and adult human fibroblasts) [38].
Protocol 2: Gastruloid-based Teratogenicity Testing
Gastruloids are 3D aggregates that recapitulate gastrulation-like events [37].
- Gastruloid Generation: Generate mouse or human gastruloids from pluripotent stem cells using established 3D aggregation protocols.
- Compound Exposure: Expose gastruloids to reference compounds with known teratogenic risk during key developmental stages.
- Endpoint Analysis:
- Quantitative Morphology: Image gastruloids and measure gross morphological effects, such as significantly reduced elongation or decreased size.
- Gene Expression Analysis: Use fluorescent reporters for genes like SOX2, BRA, and SOX17 to detect multi-lineage differentiation defects and disrupted axial patterning.
- Validation: Compare the responses of mouse and human gastruloids to known species-specific teratogens to validate the model's physiological relevance [37].
The Scientist's Toolkit: Essential Reagents and Solutions
The following table details key reagents and materials essential for the fabrication and analysis of stem cell-based embryo models and their subsequent benchmarking.
Table: Key Research Reagent Solutions for Embryo Model Research
| Reagent / Material | Function in Experimental Protocol |
|---|---|
| Human Pluripotent Stem Cells (hPSCs) [10] [8] | The foundational starting material for generating most non-integrated and integrated embryo models, including embryonic stem cells (hESCs) and induced pluripotent stem cells (hiPSCs). |
| Extracellular Matrix (ECM) Components [8] [38] | Provides the biophysical and biochemical cues for cell adhesion, polarity, and self-organization; used for coating micropatterned surfaces [38] or as a 3D gel bed [8]. |
| Lineage Induction Media [8] [38] | Chemically-defined media containing specific growth factors (e.g., BMP4 [8]) to direct the differentiation of hPSCs into specific embryonic lineages and trigger self-organization. |
| Fluorescent Reporter Cell Lines [37] | hPSCs engineered with fluorescent tags under the control of lineage-specific promoters (e.g., SOX17 for endoderm); enable real-time, live imaging of cell fate decisions and patterning. |
| scRNA-seq Library Prep Kits [17] | Essential reagents for preparing genetic libraries from individual cells of the embryo model, enabling transcriptomic analysis and benchmarking against the universal human embryo reference. |
| Cadherin Modulators [10] | Used in integrated models to experimentally manipulate cadherin-mediated cell adhesion, a critical mechanism guiding the spatial arrangement of embryonic and extra-embryonic lineages. |
Visualizing the Benchmarking Workflow for Embryo Models
The following diagram illustrates the logical process of creating, applying, and validating stem cell-based embryo models against the universal human embryo reference.
The establishment of a comprehensive human embryo reference dataset marks a pivotal step toward standardizing and validating stem cell-based embryo models [17]. As the field progresses, the application of these authenticated models is poised to revolutionize our understanding of human development and disease.
Future directions will likely focus on enhancing model fidelity, particularly in replicating later stages of development and complex tissue-tissue interactions [10] [39]. The integration of multi-omics technologies—including single-cell transcriptomics, epigenetics, and proteomics—with artificial intelligence will further refine our ability to predict developmental outcomes and drug responses [10]. As these tools become more sophisticated, ongoing critical discussion of the associated ethical and regulatory frameworks, guided by organizations like the ISSCR, will be essential to ensure responsible and scientifically robust progress [20].
The advent of single-cell and spatial omics technologies represents a paradigm shift in biomedical research, moving beyond bulk tissue analysis to reveal cellular heterogeneity and spatial organization at unprecedented resolution. While traditional bulk RNA sequencing provides population-averaged data that obscures cellular diversity, single-cell RNA sequencing (scRNA-seq) enables detailed exploration of genetic information at the cellular level, capturing inherent heterogeneity within samples [40] [41]. Spatial transcriptomics further extends this capability by merging tissue sectioning with single-cell sequencing to characterize spatial locations, preserving the architectural context that is destroyed in dissociation-based single-cell methods [42] [40]. These technologies are particularly transformative for validating complex biological systems such as stem cell-based embryo models, where molecular fidelity to in vivo counterparts must be rigorously authenticated [17]. This guide provides an objective comparison of these technologies, their performance characteristics, and detailed experimental methodologies to inform researchers in developmental biology and drug development.
Fundamental Technological Principles
Single-cell and spatial omics technologies encompass diverse methodologies with complementary strengths. scRNA-seq analyzes gene expression profiles of individual cells from both homogeneous and heterogeneous populations through isolating single cells (typically via encapsulation or flow cytometry), followed by amplification and sequencing of RNA transcripts from each cell independently [40] [41]. Spatial transcriptomics technologies can be broadly categorized into sequencing-based approaches (utilizing spatial DNA barcodes analogous to cell barcodes in scRNA-seq) and imaging-based approaches (using in situ hybridization or sequencing to localize transcripts) [42]. The integration of these technologies creates a powerful framework for comprehensive biological characterization, as they overcome each other's limitations—spatial omics recovers the architectural context lost in scRNA-seq, while scRNA-seq provides deeper transcriptome coverage often missing from spatial profiles [43].
Quantitative Performance Comparison
Recent systematic benchmarking studies have evaluated the performance characteristics of various spatial transcriptomics methods. A comprehensive 2024 analysis compared 11 sequencing-based spatial transcriptomics (sST) methods using well-characterized reference tissues with defined histological architectures, including mouse embryonic eyes, hippocampal regions, and olfactory bulbs [42]. The results provide critical quantitative data for researcher decision-making.
Table 1: Performance Comparison of Selected Spatial Transcriptomics Methods [42]
| Method | Spatial Resolution | Capture Efficiency | Molecular Diffusion | Tissue Compatibility |
|---|---|---|---|---|
| Visium (PolyA-based) | 2-µm areas (effectively multi-cell) | High | Moderate | Fresh frozen, FFPE |
| Stereo-seq | Subcellular | High | Low | Specialized chip |
| DBiT-seq | Single-cell (10-20µm) | Moderate | Low | Standard slides |
| Slide-seq V2 | Single-cell (10µm) | Moderate-high | Low | Bead arrays |
| Visium (Probe-based) | 2-µm areas (effectively multi-cell) | High | Minimal | FFPE (via CytAssist) |
| HDST | Subcellular | Lower | Low | Specialized slides |
The benchmarking revealed that molecular diffusion varies significantly across methods and tissue types, substantially affecting effective resolutions [42]. Additionally, spatial transcriptomic data demonstrated unique attributes beyond merely adding a spatial axis to single-cell data, including enhanced ability to capture patterned rare cell states with specific markers, though this capability is influenced by multiple factors including sequencing depth and resolution [42].
Table 2: Application-Based Performance Characteristics [42] [43]
| Method Category | Transcriptome Coverage | Cell Type Identification | Spatial Context Preservation | Rare Cell Detection |
|---|---|---|---|---|
| Whole Transcriptome sST (e.g., Visium) | Comprehensive (unbiased) | Moderate (deconvolution needed) | Excellent tissue-level | Limited without deep sequencing |
| Imaging-Based Spatial (e.g., Xenium) | Targeted (100s-1000s genes) | Excellent (single-cell resolution) | Excellent single-cell | Good for panel targets |
| Single-Cell RNA-seq | Comprehensive (unbiased) | Excellent | Lost during dissociation | Excellent with sufficient cells |
Experimental Protocols and Methodologies
Integrated Reference Atlas Construction
A landmark study demonstrating the application of these technologies established a comprehensive human embryo reference through integration of six published human datasets covering development from zygote to gastrula stages [17]. The experimental workflow provides a template for rigorous benchmark creation:
Sample Preparation and Processing:
- Collected cultured human preimplantation stage embryos, three-dimensional cultured postimplantation blastocysts, and a Carnegie Stage 7 human gastrula
- Reprocessed all datasets using the same genome reference (GRCh38 v.3.0.0) and annotation through a standardized pipeline to minimize batch effects
- Employed fast mutual nearest neighbor (fastMNN) methods for dataset integration [17]
Data Analysis Workflow:
- Embedded expression profiles of 3,304 early human embryonic cells into two-dimensional space using Uniform Manifold Approximation and Projection (UMAP)
- Performed single-cell regulatory network inference and clustering (SCENIC) to explore transcription factor activities
- Conducted Slingshot trajectory inference based on 2D UMAP embeddings to reveal developmental trajectories
- Identified unique markers for each distinct cell cluster using differential expression analysis [17]
This integrated reference enabled detailed comparison with human embryo models, revealing risks of misannotation when relevant references are not utilized for benchmarking [17].
Figure 1: Experimental workflow for integrated reference atlas construction combining single-cell and spatial omics approaches
Spatial Multi-Omics Integration Protocol
Advanced applications now integrate multiple analytical modalities within the same experimental framework. A 2025 study on ovarian endometriomas exemplifies this approach:
Multi-Omics Integration Methodology:
- Combined scRNA-seq with Digital Spatial Profiler-Whole Transcriptome Atlas for spatial transcriptomics
- Incorporated non-targeted Matrix-Assisted Laser Desorption/Ionization-Mass Spectrometry Imaging for spatially resolved metabolomics
- Identified key markers (XBP1, VCAN, CLDN7 in epithelial cells; THBS1 in perivascular cells)
- Revealed altered activity of cytochrome P450 enzymes, lipoprotein particles, and cholesterol metabolism in mesenchymal regions [44]
Integrated Analysis Workflow:
- Performed cross-platform data normalization and integration
- Conducted pathway analysis highlighting cell adhesion, ECM-receptor interaction, and focal adhesion pathways
- Mapped spatially defined metabolic reprogramming in disease context [44]
Analytical Frameworks and Data Processing
Computational Analysis Pipeline
The analytical workflow for single-cell and spatial omics data requires specialized computational tools and processing steps:
Data Preprocessing:
- Quality control filtering based on doublets, mitochondrial content, and erythrocytes
- Feature selection identifying highly variable genes
- Dimension reduction using principal component analysis (PCA), uniform manifold approximation and projection (UMAP), or t-distributed stochastic neighbor embedding (t-SNE) [41]
Advanced Analytical Modules:
- Clustering and annotation of cell types
- Differential expression analysis and gene set enrichment
- Single-cell regulatory network inference and clustering (SCENIC) for transcription factor identification
- Cell-cell communication analysis based on ligand-receptor interactions
- Cell trajectory inference using pseudotime analysis [41]
Spatial Data Analysis:
- Spatial clustering and domain identification
- Cell-type deconvolution for sequencing-based spatial data
- Spatial expression pattern analysis
- Niche and neighborhood identification [42]
Figure 2: Computational analysis workflow for single-cell and spatial omics data
Multi-Omics Integration Challenges
Integrating single-cell and spatial omics data presents significant computational challenges that require specialized approaches:
Batch Effect Correction:
- Batch effects may arise from different experimental conditions, sequencing lanes, or processing times
- Employ algorithms such as Seurat's canonical correlation analysis (CCA), mutual nearest neighbors (MNN), or Harmony for batch correction [41]
Multimodal Data Integration:
- Integration of transcriptomic, epigenomic, proteomic, and spatial data within the same analytical framework
- Development of cross-modal reference systems and integration algorithms
- Sample multiplexing using DNA oligonucleotide barcodes before pooling to enable massive parallelization [41]
Essential Research Reagents and Platforms
The successful implementation of single-cell and spatial omics studies requires specific research solutions and platform technologies. The following table details key reagents and their applications in experimental workflows.
Table 3: Essential Research Reagent Solutions for Single-Cell and Spatial Omics
| Research Solution | Function | Application Examples |
|---|---|---|
| Chromium Single Cell Platform (10x Genomics) | Comprehensive single cell profiling for gene expression, protein, TCR/BCR, chromatin accessibility | Unbiased single cell discovery, high per-gene sensitivity [45] |
| Visium Spatial Platform (10x Genomics) | Whole transcriptome spatial mapping with morphological context | Unbiased spatial discovery, tissue architecture studies [45] |
| Xenium Spatial Platform (10x Genomics) | Targeted gene expression with single-cell resolution | Targeted spatial exploration, cellular neighborhood analysis [45] |
| ClickTags | Sample multiplexing via "click chemistry" DNA oligos | Live-cell sample multiplexing, batch effect reduction [41] |
| CITE-seq Reagents | Cellular indexing of transcriptomes and epitopes by sequencing | Integrated transcriptome and proteome profiling [41] |
Application in Embryo Model Benchmarking
The application of single-cell and spatial omics technologies to embryo model validation represents one of their most impactful uses. The human embryo reference tool developed through integration of multiple datasets enables:
Lineage Authentication:
- Contrasting and validating lineage annotations with available human and nonhuman primate datasets
- Constructing early embryogenesis prediction tools where query datasets can be projected on the reference
- Annotating cell identities with predicted developmental stages [17]
Developmental Trajectory Mapping:
- Revealing three main trajectories related to epiblast, hypoblast, and trophectoderm lineage development
- Identifying 367, 326, and 254 transcription factor genes showing modulated expression along respective lineages
- Capturing known transcription factors (DUXA, FOXR1) and stage-specific markers [17]
Quality Assessment of Embryo Models:
- Providing unbiased transcriptional profiling for model authentication
- Highlighting risks of misannotation when relevant references are not utilized
- Establishing molecular, cellular, and structural fidelity metrics [17]
Single-cell and spatial omics technologies provide an indispensable toolkit for advanced characterization in developmental biology, disease research, and therapeutic development. The quantitative performance data and experimental protocols outlined in this guide demonstrate both the capabilities and limitations of current technologies. As these methods continue to evolve—with improvements in resolution, throughput, and multi-omics integration—they will further transform our ability to benchmark complex models against in vivo references. For researchers embarking on such studies, careful selection of appropriate technologies based on performance characteristics, coupled with rigorous experimental design and computational analysis, is essential for generating biologically meaningful insights.
Navigating Challenges: Common Pitfalls and Optimization of Model Fidelity
Identifying and Correcting Transcriptional Drift in Cultured Models
Transcriptional drift, the systematic shift in gene expression when cells are removed from their native environment and placed in vitro, presents a significant challenge in biological research. This phenomenon is particularly critical in the field of stem cell-based embryo modeling, where the molecular fidelity of in vitro models directly impacts their utility for studying development, disease, and drug discovery. When embryonic cells are transitioned to culture conditions, they lose essential contextual cues including heterotypic cell interactions, physiological physical forces, and three-dimensional organization, leading to substantial alterations in their transcriptional landscape. Understanding, identifying, and correcting these drifts is fundamental to creating more accurate and reliable experimental models that better mirror in vivo biology.
Defining the Problem: Quantifying Transcriptional Drift
When primary cells are isolated and placed in standard culture conditions, they undergo massive transcriptional reprogramming. Research on human umbilical vein endothelial cells (HUVECs) has quantified this phenomenon, revealing the profound impact of the in vitro environment on gene expression profiles.
Table 1: Magnitude of Transcriptional Drift Between In Vivo and In Vitro Conditions
| Measurement Parameter | In Vivo (Cord) | In Vitro (Culture) | Change |
|---|---|---|---|
| Percentage of transcriptome significantly changed | - | - | >43% [46] [47] |
| Expression of flow-responsive genes (KLF2, KLF4) | High | Lost [46] [47] | Decreased |
| Expression of extracellular matrix genes (COL23A1, ELN, FBLN2) | High | Significantly decreased [46] [47] | Decreased |
| Expression of cell cycle genes (CCNB2, CCNA2) | Low | Acquired [46] [47] | Increased |
| Pro-angiogenic & survival genes (APLN, BAX, MDM2) | Low | Upregulated [46] [47] | Increased |
| TGFβ and BMP target genes | High | Reduced [46] [47] | Decreased |
This drift is not merely technical but reflects fundamental biological changes. Principal component analysis of transcriptomic data shows that the culture environment accounts for 47.4% of total variance, dramatically overshadowing other factors like passage number [46] [47]. Proteomic analyses further confirm these findings, demonstrating significant correlation between RNA and protein level changes (r = 0.4, p = 1×10⁻⁰⁷), validating that transcriptional drift has functional consequences at the protein level [46].
Correcting Transcriptional Drift: Experimental Approaches and Efficacy
Several experimental strategies have demonstrated effectiveness in rescuing the in vivo transcriptional signature. These approaches aim to reintroduce key physiological elements missing in standard culture.
Table 2: Efficacy of Interventions for Correcting Transcriptional Drift
| Intervention Method | Key Experimental Parameters | Rescue Efficacy | Genes/Pathways Affected |
|---|---|---|---|
| Long-Term Shear Stress | Laminar flow conditions mimicking blood flow [46] | ~17% of genes significantly rescued [46] [47] | Flow-responsive genes (KLF2, KLF4); novel flow-dependent genes [46] |
| Heterotypic Cell Interactions | Co-culture with Smooth Muscle Cells (SMCs) [46] [47] | ~9% of original in vivo signature normalized [46] [47] | Genes requiring cell-cell contact for proper expression [46] |
| Benchmarking Against Reference | Comparison to human embryo transcriptome reference [17] [48] | Enables accurate annotation and validation [17] | Corrects misannotation in embryo models [17] |
Experimental Workflow for Identifying and Correcting Transcriptional Drift
Transcriptional Drift in Embryo Model Benchmarking
The establishment of a comprehensive human embryo reference tool through integration of six published single-cell RNA-sequencing datasets has provided an essential benchmark for authenticating stem cell-based embryo models [17] [48]. This reference covers development from zygote to gastrula stages and enables objective assessment of model fidelity.
Without such reference-based benchmarking, embryo models risk substantial misannotation of cell lineages. Projection of query datasets onto this integrated reference allows for unbiased assessment of transcriptional similarity to in vivo counterparts and identification of drift specific to in vitro conditions [17]. This approach is particularly valuable given the ethical and technical limitations of studying human embryos beyond 14 days post-fertilization [8].
Stem cell-based embryo models range from non-integrated models (such as 2D micropatterned colonies and 3D gastruloids) that mimic specific aspects of development, to integrated models that contain both embryonic and extra-embryonic lineages and aim to recapitulate the entire conceptus [8]. Each model system demonstrates distinct transcriptional drift profiles that must be characterized against the reference standard.
Benchmarking Workflow for Embryo Model Validation
Table 3: Key Research Reagent Solutions for Transcriptional Drift Studies
| Reagent/Resource | Function/Application | Example Use Case |
|---|---|---|
| Human Umbilical Vein Endothelial Cells (HUVECs) | Primary cell model for drift studies [46] [47] | Comparison of cord (in vivo) vs cultured (in vitro) transcriptomes [46] |
| Shear Stress Devices | Apply physiological fluid forces to cultured cells [46] | Rescue of flow-responsive gene expression [46] |
| Smooth Muscle Cells (SMCs) | Provide heterotypic cell interactions [46] [47] | Co-culture to normalize cell-contact dependent genes [46] |
| Integrated Human Embryo Reference | scRNA-seq atlas from zygote to gastrula [17] [48] | Benchmarking embryo model fidelity [17] |
| Bulk and Single-Cell RNA Sequencing | Global transcriptome profiling [46] [17] | Quantifying expression changes across conditions [46] [17] |
| Liquid Chromatography-Mass Spectrometry (LC-MS) | Proteomic validation of transcriptomic findings [46] [47] | Confirming drift at protein level [46] |
Transcriptional drift represents a critical variable in the use of cultured models for research and therapeutic development. The quantitative data presented demonstrates that over 43% of the transcriptional landscape is altered when cells transition to standard culture conditions, with profound implications for interpreting experimental results. However, targeted interventions including physiological stimulation through shear stress, heterotypic cell interactions, and rigorous benchmarking against integrated reference datasets offer powerful strategies to correct these drifts. As stem cell-based embryo models continue to advance as tools for studying human development and disease, systematic assessment and correction of transcriptional drift will be essential for ensuring their biological relevance and predictive validity. The methodologies and reference standards outlined here provide a framework for researchers to authenticate their models and enhance translational potential.
The emergence of stem cell-based embryo models (SCBEMs) represents a transformative advance in the study of early human development, congenital disorders, and regenerative medicine. These models, which include synthetic embryo models (SEMs), blastoids, and gastruloids, provide unprecedented in vitro systems for investigating processes that are otherwise inaccessible in human embryos due to ethical constraints and the 14-day rule [10] [8]. However, the scientific utility of these models hinges entirely on their fidelity—how accurately they recapitulate the molecular, cellular, and structural characteristics of their in vivo counterparts [17] [8]. A significant challenge in the field is the accurate identification of cell types present in these models, a process known as annotation. Without proper validation against genuine embryonic reference data, researchers risk misannotation—incorrectly identifying cell types—which can lead to flawed biological interpretations and questionable translational applications [17] [49].
The risk of misannotation is not merely theoretical. As highlighted by recent studies, many cell lineages that co-develop in early human development share the same molecular markers, making distinction by a limited number of lineage markers unreliable [17]. This review explores how rigorous benchmarking studies—the systematic comparison of embryo models against comprehensive reference datasets—are essential for authenticating these models and mitigating the risk of misannotation. We examine the development of integrated reference tools, present comparative data on model performance, detail experimental protocols for validation, and provide resources to support accurate annotation in the field.
The Human Embryo Reference: A Foundation for Accurate Annotation
Development of a Comprehensive Reference Tool
To address the critical need for standardized benchmarking in the field, researchers have recently developed an integrated human embryogenesis transcriptome reference through the consolidation of six published single-cell RNA-sequencing (scRNA-seq) datasets [17]. This reference encompasses developmental stages from the zygote to the gastrula (Carnegie Stage 7, approximately embryonic day 16-19), capturing the complete continuum of early human development [17]. The creation of this resource involved reprocessing all datasets using the same genome reference (GRCh38) and standardized computational pipeline to minimize batch effects, followed by integration using fast mutual nearest neighbor (fastMNN) methods [17]. The resulting dataset includes transcriptome profiles of 3,304 individual embryonic cells, providing unprecedented resolution of lineage specification events [17].
This reference tool enables researchers to project their own scRNA-seq data from embryo models onto the reference landscape using stabilized Uniform Manifold Approximation and Projection (UMAP), where cell identities can be predicted based on similarity to authentic embryonic cells [17]. The UMAP visualization reveals a continuous developmental progression with clear lineage specification and diversification, including: the first lineage branch point where inner cell mass (ICM) and trophectoderm (TE) cells diverge during E5; subsequent bifurcation of ICM into epiblast and hypoblast; maturation of TE into cytotrophoblast (CTB), syncytiotrophoblast (STB), and extravillous trophoblast (EVT); and further specification of the epiblast into amnion, primitive streak, mesoderm, and definitive endoderm at gastrulation stages [17].
Lineage Trajectories and Regulatory Networks
Beyond static classification, the reference tool enables dynamic analysis of developmental trajectories. Slingshot trajectory inference based on UMAP embeddings has revealed three main trajectories corresponding to epiblast, hypoblast, and TE development, each associated with distinct sets of transcription factors showing modulated expression along pseudotime [17]. For example, transcription factors such as DUXA and FOXR1 exhibit high expression during morula stages but decrease during development across all three lineages, while pluripotency markers like NANOG and POU5F1 are expressed in preimplantation epiblast but decrease following implantation [17].
Complementary SCENIC (Single-Cell Regulatory Network Inference and Clustering) analysis has captured the activities of key transcription factors characteristic of specific lineages, including VENTX in epiblast, OVOL2 in TE, TEAD3 in STB, ISL1 in amnion, and MESP2 in mesoderm [17]. These analyses provide not only validation of cell identities but also insights into the regulatory programs driving lineage specification—essential knowledge for evaluating the molecular fidelity of embryo models.
Quantitative Assessment of Misannotation Risks
Documented Cases of Misannotation
The application of the integrated reference tool to published embryo models has revealed concrete examples of misannotation that occurred when relevant human embryo references were not utilized for benchmarking [17]. In several cases, cells in embryo models were incorrectly annotated based on limited marker genes or comparisons to non-human or irrelevant developmental stages. When projected onto the comprehensive reference, these cells clustered with different cell types than originally claimed, demonstrating that global transcriptomic profiling is necessary for unbiased cell type identification [17].
One particularly common misannotation challenge involves distinguishing between amnion cells and other extraembryonic mesoderm populations. The reference dataset clarifies that amnion formation occurs in distinct waves, with earlier putative amnion cells from extended blastocyst culture intermingling with advanced mesoderm and extraembryonic mesoderm cells from CS7 gastrula in the UMAP space [17]. Without the proper reference for comparison, these populations are easily confused, leading to incorrect claims about model capabilities.
Table 1: Common Misannotation Challenges in Embryo Models
| Cell Type in Question | Common Misannotation | Distinguishing Features | Reference-Based Resolution |
|---|---|---|---|
| Early amnion | Advanced mesoderm or extraembryonic mesoderm | ISL1 and GABRP expression [17] | Position in UMAP relative to CS7 amnion and mesoderm populations |
| Trophoblast subtypes | Undifferentiated trophectoderm | Specific expression of TEAD3 in STB, GATA2/GATA3/PPARG in CTB [17] | Separation along TE maturation trajectory in reference |
| Primitive streak | Early epiblast | TBXT expression combined with position along epiblast trajectory [17] | Projection onto gastrulation stage reference |
| Hypoblast derivatives | Other endodermal populations | GATA4 and SOX17 (early), FOXA2 and HMGN3 (later stages) [17] | Placement along hypoblast developmental trajectory |
Consequences of Misannotation
The implications of misannotation extend beyond academic inaccuracy to affect downstream applications. In disease modeling, incorrect cell type identification can lead to misattributed disease mechanisms. In drug screening applications, compounds may be erroneously deemed effective or toxic based on misidentified cell types. For regenerative medicine approaches, understanding the precise identity of cells is prerequisite to safe transplantation. Furthermore, misannotation propagates through the literature when incorrectly characterized models are used as references for subsequent studies, amplifying the initial error [17] [49].
Experimental Protocols for Benchmarking and Validation
Standardized scRNA-seq Workflow for Benchmarking
To ensure reproducible and accurate benchmarking of embryo models against the reference dataset, researchers should follow a standardized experimental and computational workflow:
Sample Preparation: Process embryo models and control samples using consistent dissociation protocols to minimize technical artifacts. Include samples across multiple developmental time points to capture dynamic processes.
Library Preparation and Sequencing: Utilize plate-based scRNA-seq methods (Smart-seq2) or droplet-based methods (10X Genomics) that are compatible with the reference datasets. Aim for sequencing depth of at least 50,000 reads per cell to ensure adequate gene detection.
Data Preprocessing: Process raw sequencing data using the standardized pipeline established for the reference, including:
- Read alignment to GRCh38 human genome reference
- Gene-level quantification using the same annotation (v.3.0.0)
- Quality control filtering (remove cells with <500 genes or >10% mitochondrial content)
- Normalization using scran or SCTransform
Data Integration: Project the query dataset onto the reference using fastMNN correction to account for batch effects while preserving biological variation [17].
Cell Type Prediction: Transfer cell type labels from the reference to the query dataset based on nearest neighbors in the integrated space. Calculate confidence scores for each prediction.
Validation: Validate predictions using known marker genes and regulatory networks identified through SCENIC analysis [17].
Diagram 1: Embryo model annotation workflow using reference atlas.
Multimodal Validation Approaches
While transcriptomic benchmarking provides a powerful foundation, comprehensive validation should incorporate multiple modalities:
Spatial Transcriptomics: Validate the spatial organization of predicted cell types using technologies like MERFISH or Visium, comparing to known embryonic patterns.
Lineage Tracing: Combine scRNA-seq with genetic lineage tracing to confirm developmental relationships inferred from trajectory analysis.
Functional Assays: Assess functional properties of identified cell types, such as differentiation potential or secretory activity, to confirm identity beyond transcriptional similarity.
Cross-Species Comparison: When human data is limited, compare to non-human primate references (macaque, marmoset) to identify conserved and species-specific features [17].
Research Reagent Solutions for Embryo Model Benchmarking
Table 2: Essential Research Reagents for Embryo Model Benchmarking Studies
| Reagent/Category | Specific Examples | Function in Benchmarking | Considerations |
|---|---|---|---|
| scRNA-seq Platforms | 10X Genomics Chromium, Smart-seq2 | Generate transcriptome profiles for comparison to reference | Compatibility with reference dataset protocols; Smart-seq2 provides greater depth, 10X provides higher throughput |
| Reference Datasets | Integrated human embryo atlas (zygote to gastrula) [17] | Gold standard for cell identity prediction | Ensure consistent genome build (GRCh38) and processing pipeline |
| Bioinformatics Tools | fastMNN, UMAP, Slingshot, SCENIC | Data integration, visualization, trajectory inference, regulatory network analysis | Standardize parameters to match reference analysis |
| Marker Gene Panels | DUXA (morula), PRSS3 (ICM), TBXT (primitive streak), ISL1 (amnion) [17] | Independent validation of computationally predicted identities | Use multiple markers per cell type; confirm specificity in reference |
| Spatial Validation Technologies | MERFISH, Visium, seqFISH+ | Confirm spatial organization matches embryonic patterns | Resolution limitations may affect precise localization in small structures |
| Lineage Tracing Systems | CRISPR-based barcoding, fluorescent reporter lines | Validate developmental trajectories inferred from pseudotime analysis | Potential perturbation of native biology; control experiments essential |
Signaling Pathways and Regulatory Logic in Lineage Specification
The accurate annotation of embryo models requires understanding the signaling pathways and regulatory logic governing lineage specification during normal embryogenesis. Key pathways include BMP, WNT, Nodal, and FGF signaling, which interact in complex networks to pattern the embryo and direct cell fate decisions.
Diagram 2: Key signaling pathways and transcription factors in lineage specification.
The reference tool enables researchers to assess whether embryo models recapitulate these regulatory relationships by comparing transcription factor activities and pathway target gene expression to authentic embryos. SCENIC analysis has identified distinct transcription factor signatures characteristic of specific lineages, including DUXA in 8-cell lineages, VENTX in epiblast, OVOL2 in TE, TEAD3 in syncytiotrophoblast, ISL1 in amnion, E2F3 in erythroblasts, and MESP2 in mesoderm [17]. Discrepancies in these regulatory networks between models and references indicate fundamental differences in developmental processes beyond mere marker gene expression.
The risk of misannotation in stem cell-based embryo models represents a significant challenge to the field, with implications for basic research, disease modeling, and therapeutic development. The development of comprehensive reference datasets, such as the integrated human embryogenesis transcriptome atlas, provides an essential foundation for rigorous benchmarking and accurate cell type identification [17]. The documented cases of misannotation when proper references were not utilized underscore the necessity of global transcriptomic profiling rather than reliance on limited marker panels [17].
As the field advances, several priorities emerge: First, reference datasets must be expanded to include more donors, stages, and modalities (epigenomics, proteomics, spatial transcriptomics). Second, benchmarking standards should be established and adopted by the community to ensure consistency across studies. Third, computational methods for comparison and annotation must continue to improve in accuracy and accessibility. Finally, ethical frameworks must evolve alongside technical capabilities to ensure responsible research practices [10] [8].
By embracing rigorous benchmarking against authentic embryonic references, researchers can minimize the risk of misannotation, validate the fidelity of embryo models, and ensure that conclusions drawn from these powerful systems accurately reflect human development. This approach will ultimately maximize the scientific and translational potential of stem cell-based embryo models while maintaining the highest standards of scientific rigor.
Improving Reproducibility and Scalability in Model Generation
The field of developmental biology has been transformed by stem cell-based embryo models, which provide an accessible and scalable alternative to the study of early human development. These models offer unprecedented opportunities to investigate fundamental biological processes, congenital disorders, and infertility. However, their scientific and clinical utility hinges critically on their fidelity to the in vivo embryonic counterparts they aim to replicate. Establishing this fidelity requires rigorous benchmarking against gold-standard reference data, a process that ensures the reproducibility of findings and enables the scalable generation of high-quality models. Without such standardized validation, researchers risk drawing conclusions from models that may misrepresent actual embryonic development, potentially leading to erroneous biological insights or ineffective clinical applications.
The challenges of studying early human development directly are significant. Human embryos are scarce for research, face ethical constraints including the 14-day rule, and are technically challenging to acquire and maintain [50] [51]. Embryo models circumvent these limitations but introduce new challenges in quality control and validation. This guide objectively compares current benchmarking approaches and the experimental data supporting them, providing researchers with a framework for evaluating and improving their embryo model systems within the critical context of establishing reproducible and scalable model generation pipelines.
Comparative Analysis of Benchmarking Approaches
Reference Atlas Technologies
Table 1: Comparison of Embryo Reference Atlas Technologies
| Technology | Key Features | Primary Applications | Limitations |
|---|---|---|---|
| Integrated scRNA-seq Reference [50] | Combines 6 human datasets (zygote to gastrula); 3,304 cells; UMAP visualization; FastMNN integration | Authenticating embryo models; Lineage annotation; Identifying misannotations | Limited by source data scarcity; Potential batch effects despite normalization |
| Single-Cell Regulatory Network Inference (SCENIC) [50] | Infers transcription factor activities; Identifies key regulators (e.g., DUXA, VENTX, OVOL2) | Complementing lineage identity validation; Revealing regulatory dynamics | Computational complexity; Requires specialized expertise |
| Slingshot Trajectory Inference [50] | Pseudotime analysis; Identifies 367+ modulated transcription factors per trajectory | Mapping developmental trajectories; Identifying lineage-specific factors | Inference rather than direct measurement; Sensitive to parameter choices |
Computational Assessment Tools
Table 2: Comparison of Computational Assessment Tools for Embryo Models
| Tool Name | Technology Base | Key Capabilities | Performance Metrics |
|---|---|---|---|
| FEMI (Foundational IVF Model) [11] | Vision Transformer trained on 18M time-lapse images | Ploidy prediction; Blastocyst quality scoring; Developmental timing | AUROC >0.75 for ploidy prediction; Outperforms benchmark models |
| EmbryoProfiler [52] | Visual analytics with deep learning pipeline | Automated annotation; Feature extraction; Transparent viability scoring | Enables informed selection; Improves clinical outcomes |
| iDAScore [53] | Deep learning on 180,000+ time-lapse sequences | Automated embryo ranking; Objective scoring (1-9.9); workflow prioritization | Correlates with implantation; 10x faster than manual assessment |
Experimental Protocols for Benchmarking Embryo Models
Protocol 1: Establishing a Comprehensive scRNA-seq Reference
The creation of an integrated single-cell RNA sequencing reference represents a foundational methodology for authenticating human embryo models [50]. The protocol begins with the collection of six published human datasets spanning developmental stages from zygote to gastrula, including cultured preimplantation embryos, three-dimensional cultured postimplantation blastocysts, and a Carnegie Stage 7 human gastrula. To ensure technical consistency across datasets, researchers must reprocess all data using a standardized pipeline with the same genome reference (GRCh38 v.3.0.0) and annotation.
- Data Integration: Employ Fast Mutual Nearest Neighbor (FastMNN) methods to correct for batch effects while preserving biological variation, embedding expression profiles of all cells into a unified dimensional space.
- Lineage Annotation: Contrast and validate annotations with available human and non-human primate datasets, identifying unique markers for each distinct cell cluster (e.g., DUXA in morula, TBXT in primitive streak cells).
- Tool Implementation: Develop a stabilized Uniform Manifold Approximation and Projection (UMAP) prediction tool that enables query datasets to be projected onto the reference for automated cell identity annotation.
- Validation: Perform trajectory inference using Slingshot to identify transcription factors with modulated expression across pseudotime, confirming known developmental regulators and identifying potential novel factors.
This protocol's effectiveness is demonstrated by its ability to reveal misannotations in published embryo models when relevant references were not utilized for benchmarking, highlighting the critical importance of appropriate reference selection [50].
Protocol 2: AI-Based Morphological Assessment
Artificial intelligence approaches provide a complementary methodology for evaluating embryo models through non-invasive morphological assessment [11]. The FEMI (Foundational IVF Model for Imaging) protocol utilizes a Vision Transformer architecture trained on approximately 18 million time-lapse embryo images through self-supervised learning. Implementation requires compiling a diverse dataset from multiple clinics to ensure robust generalization, with images cropped around embryos using a segmentation model based on the InceptionV3 architecture.
- Model Pre-training: Train a ViT-MAE (Vision Transformer Masked Autoencoder) on time-lapse images taken after 85 hours post-insemination, using tight cropping around embryos and reconstruction of masked image patches to learn domain-specific features.
- Task Fine-tuning: Append task-specific layers to the encoder for various downstream applications including ploidy prediction, blastocyst quality scoring, and developmental milestone timing.
- Sequence Analysis: For ploidy prediction, process sequences of images (video input) from 96 to 112 hours post-insemination to capture dynamic developmental processes, incorporating maternal age as an additional predictive feature.
- Validation: Compare performance against both traditional supervised architectures (VGG16, ResNet-RS, EfficientNet V2) and other self-supervised models using area under the receiver operating characteristic (AUROC) and accuracy metrics.
This approach demonstrates that image-based ploidy prediction can achieve AUROC >0.75 using only non-invasive methods, significantly outpacing benchmark models and reducing reliance on invasive genetic testing [11].
Visualization of Benchmarking Workflows
Embryo Model Validation Pathway
Figure 1: Embryo model validation pathway illustrating the integration of molecular and morphological assessment methods to establish developmental fidelity.
Computational Multi-scale Modeling Framework
Figure 2: Computational multi-scale modeling framework for embryo development, integrating processes from intracellular regulation to tissue-level organization.
Essential Research Reagent Solutions
Table 3: Key Research Reagents for Embryo Model Benchmarking
| Reagent Category | Specific Examples | Function in Benchmarking |
|---|---|---|
| Stem Cell Building Blocks [51] | Naive, Formative, and Primed Pluripotent Stem Cells; Trophoblast Stem Cells; Extraembryonic Endoderm Stem Cells | Provide foundational cells for constructing embryo models with specific lineage potentials |
| Lineage Markers [50] | DUXA (morula), POU5F1 (epiblast), TBXT (primitive streak), GATA4 (hypoblast), CDX2 (trophectoderm) | Enable validation of correct lineage specification through expression analysis |
| Reference Datasets [50] [11] | Integrated scRNA-seq atlas; Time-lapse image libraries (>18 million images) | Serve as gold standards for comparative analysis and model authentication |
| Culture Matrices [54] | Precisely controlled physicochemical environments; 3D culture systems; Synthetic biology gene circuits | Provide developmental cues that guide self-organization and morphogenesis |
| Computational Tools [50] [11] [52] | FastMNN; UMAP; SCENIC; FEMI; EmbryoProfiler | Enable data integration, visualization, regulatory inference, and automated assessment |
The establishment of comprehensive reference tools and standardized validation protocols represents a critical advancement in the field of embryo model research. As the comparison data demonstrates, integrating molecular reference atlases with AI-based morphological assessment provides a powerful framework for evaluating model fidelity. The experimental protocols outlined offer practical methodologies for implementation, while the essential research reagents table provides a checklist for establishing necessary resources.
For the field to progress, researchers must adopt consistent benchmarking practices that enable direct comparison across models and laboratories. This includes utilizing shared reference datasets, implementing transparent computational tools, and establishing quality metrics that can be universally applied. As these standards evolve, they will enhance both the reproducibility and scalability of embryo model generation, accelerating our understanding of early human development and creating new opportunities for addressing infertility and congenital disorders. Future directions should focus on expanding reference datasets to encompass more developmental stages, improving the integration of multi-modal data, and developing more sophisticated computational models that can predict developmental outcomes from initial stem cell states.
Integrating Extra-Embryonic Cell Lines for Enhanced Physiological Relevance
The physiological relevance of embryo models is significantly enhanced by the incorporation of extra-embryonic cell lines. In vivo, extra-embryonic tissues are indispensable for embryonic development, serving as a potent source of inductive signals, mediating implantation, and providing crucial nutrition [55]. These tissues form critical interfaces that support and guide the developing embryo. Consequently, the integration of accurate extra-embryonic cellular components into in vitro models is not merely an additive improvement but a fundamental requirement for creating high-fidelity systems that truly recapitulate the complex processes of early development. This guide provides a comparative benchmark of available extra-embryonic endoderm cell lines, enabling researchers to select the most appropriate tools for constructing physiologically meaningful embryo models.
Comparative Analysis of Key Extra-Embryonic Endoderm Cell Lines
To assist in model selection, we provide a direct comparison of three prominent rodent extra-embryonic endoderm (ExEn) cell lines: XEN, PYS2, and END2. A comprehensive analysis of their molecular and morphological characteristics is essential for understanding their respective utilities in modeling different aspects of the in vivo endoderm [56] [57].
Table 1: Comparative Profile of Extra-Embryonic Endoderm Cell Lines
| Cell Line | Developmental Origin | Reported Lineage | Key Molecular Markers (Mouse) | Limitations/Notes |
|---|---|---|---|---|
| XEN | Mouse blastocyst [57] | Primitive Endoderm-like [56] [57] | GATA4+, GATA6+, SOX7+ (subset) [57] | Represents a mixed population expressing markers for several ExEn lineages [56]. |
| PYS2 | Mouse embryonal carcinoma (EC) [56] [57] | Parietal Endoderm (PE)-like [56] [57] | GATA4+, GATA6+, SOX7+ [57] | Represents a mixed population; shows uniform expression of primitive endoderm markers [56] [57]. |
| END2 | P19 EC cells [56] [57] | Visceral Endoderm (VE)-like [56] [57] | GATA6 (low), lacks GATA4 and SOX7 [57] | Does not represent a bona fide single lineage; expresses markers for a VE subset (anterior VE) and PE [56]. |
Beyond the standard characterization, pathway analysis of these cell lines has revealed that SMAD-independent TGFβ signaling through a TAK1/p38/JNK or TAK1/NLK pathway may represent a shared mode of intracellular signaling [56]. This suggests that factors downstream of these pathways may mediate some of the key inductive functions of the extra-embryonic endoderm in vivo. The following diagram illustrates this core signaling pathway.
Experimental Protocols for Characterization and Application
Robust experimental protocols are essential for characterizing these cell lines and evaluating their performance in integrated embryo models. Below are detailed methodologies for key analyses.
Molecular Characterization via Immunocytochemistry
This protocol is used to assess the expression of key lineage-specific transcription factors, validating the identity of the cell lines [57].
- Cell Seeding: Plate cells on gelatin-coated coverslips or culture dishes at an appropriate density (e.g., 1-5 x 10^4 cells/cm²) and culture until they reach 60-80% confluence.
- Fixation: Aspirate the culture medium and rinse cells gently with phosphate-buffered saline (PBS). Fix cells with 4% paraformaldehyde in PBS for 15 minutes at room temperature.
- Permeabilization and Blocking: Rinse cells with PBS and permeabilize with 0.1% Triton X-100 in PBS for 10 minutes. Block non-specific binding by incubating with a blocking buffer (e.g., 5% normal serum in PBS) for 1 hour.
- Primary Antibody Incubation: Incubate cells with primary antibodies (e.g., anti-GATA4, anti-GATA6, anti-SOX7) diluted in blocking buffer overnight at 4°C.
- Secondary Antibody Incubation: Wash cells thoroughly with PBS and incubate with fluorophore-conjugated secondary antibodies for 1 hour at room temperature, protected from light.
- Imaging and Analysis: After final washes, mount coverslips and image using a fluorescence or confocal microscope. Analyze the proportion and intensity of positive cells to assess population heterogeneity.
Functional Analysis in Barrier Integrity Assays
For cell lines used to model trophic interfaces, functional barrier assays are critical. This protocol is adapted from studies on trophoblast barriers [58].
- Setup: Culture cells on transparent, permeable transwell inserts with a pore size of 0.4 μm or 3.0 μm, depending on the experimental need.
- TEER Measurement: Measure Trans Epithelial Electrical Resistance (TEER) using an epithelial voltohmmeter. Take measurements every 48 hours to monitor the formation of a tight barrier. TEER values (Ohms/cm²) are calculated by multiplying the measured resistance by the surface area of the filter.
- Paracellular Permeability Assay: After a stable TEER is established, add a non-reactive tracer molecule like sodium fluorescein (376 Da) to the apical chamber.
- Sampling and Quantification: After a set incubation period (e.g., 1-2 hours), sample from the basal chamber. The concentration of the tracer that has passed to the basal chamber is quantified using a fluorescence plate reader. The percentage of transported tracer is calculated as (Basal Concentration / Initial Apical Concentration) * 100%.
Workflow for Integrated Embryo Model Assembly
The general workflow for assembling an embryo model incorporating extra-embryonic endoderm cells involves a multi-step process of co-culture and aggregation, guided by the principles outlined in recent literature [55] [59].
The Scientist's Toolkit: Essential Research Reagents
Successful culture and application of these cell lines require a defined set of reagents. The following table lists key materials and their functions.
Table 2: Essential Research Reagents for Extra-Embryonic Cell Line Work
| Reagent/Category | Specific Examples | Function in Research |
|---|---|---|
| Cell Lines | XEN cells, PYS2 cells, END2 cells, Trophoblast Stem Cells (TSCs) [55] | Serve as the foundational building blocks for constructing embryo models, providing embryonic and extra-embryonic components. |
| Culture Media Supplements | Fibroblast Growth Factor 2 (FGF2), Activin A, Leukemia Inhibitory Factor (LIF) [55] | Maintain stem cell pluripotency or direct differentiation toward specific lineages in defined culture conditions. |
| Small Molecule Inhibitors/Activators | CHIR99021 (GSK3 inhibitor), PD0325901 (MEK inhibitor), XAV939 (WNT inhibitor), BMP4 [55] [59] | Precisely control intracellular signaling pathways (e.g., WNT, FGF) to guide self-organization and patterning in embryo models. |
| Extracellular Matrix (ECM) | Matrigel, Gelatin, Laminin, Collagen | Provide a physiological 3D scaffold that supports complex morphogenesis and cell-matrix interactions. |
| Key Antibodies | Anti-GATA4, Anti-GATA6, Anti-SOX7, Anti-OCT4, Anti-ZO-1 [57] [58] | Enable characterization of cell identity and functional status via immunocytochemistry and validate model fidelity. |
The integration of extra-embryonic cell lines is a pivotal step toward achieving physiological relevance in embryo models. The choice between XEN, PYS2, and END2 cells should be guided by the specific research question, as each line offers distinct advantages and limitations in modeling primitive, parietal, or visceral endoderm. As the field progresses, the application of these benchmarks will be crucial for validating new and more sophisticated models. Future efforts will likely focus on the continued refinement of human extra-embryonic cell lines and the establishment of standardized protocols for their integration, ultimately providing unprecedented insights into human development and reproductive health.
The Gold Standard for Validation: Leveraging Integrated scRNA-seq References
Why a Universal Reference Tool is Needed
The study of early human development is fundamental for understanding infertility, early miscarriages, and congenital diseases. While stem cell-based embryo models (SCBEMs) have emerged as powerful experimental tools to overcome the ethical and technical challenges of working with rare human embryos, their scientific utility depends entirely on their molecular and cellular fidelity to real human embryos [17] [8]. Single-cell RNA sequencing (scRNA-seq) has become the gold standard for unbiased authentication of these models. However, the lack of a comprehensive, integrated scRNA-seq reference spanning key developmental stages has hampered rigorous benchmarking, potentially leading to misannotation of cell lineages in embryo models [17]. In response to this critical gap, researchers have recently developed an integrated human embryogenesis transcriptome reference, creating a universal prediction tool for the scientific community [17] [48].
This universal reference tool was constructed through the integration of six published human scRNA-seq datasets, creating a continuous transcriptomic roadmap of early human development from the zygote stage through gastrulation [17]. The dataset encompasses 3,304 early human embryonic cells, processed through a standardized pipeline using the GRCh38 genome reference to minimize batch effects [17].
Table: Technical Specifications of the Universal Human Embryo Reference Tool
| Specification | Description |
|---|---|
| Developmental Coverage | Zygote to gastrula (Carnegie Stage 7, E16-19) |
| Integrated Datasets | 6 published human scRNA-seq datasets |
| Total Cells | 3,304 early human embryonic cells |
| Processing Pipeline | Standardized mapping and feature counting |
| Genome Reference | GRCh38 (v.3.0.0) |
| Integration Method | Fast Mutual Nearest Neighbor (fastMNN) |
| Visualization | Stabilized Uniform Manifold Approximation and Projection (UMAP) |
| Public Access | Online early embryogenesis prediction tool and Shiny interfaces |
The reference captures all major lineage trajectories, including the first branching point where inner cell mass (ICM) and trophectoderm (TE) cells diverge around E5, followed by ICM bifurcation into epiblast and hypoblast lineages [17]. The tool employs a stabilized UMAP projection that allows query datasets to be projected onto the reference and automatically annotated with predicted cell identities [17] [48].
Performance Comparison with Alternative Annotation Methods
While several computational approaches exist for cell type annotation, the human embryo reference tool addresses specific challenges in developmental biology. Traditional methods face limitations when applied to embryo models due to the dynamic nature of embryonic development and overlapping marker expression between closely related lineages.
Table: Comparison of Cell Annotation Approaches for Embryonic Data
| Method | Approach | Advantages | Limitations for Embryo Models |
|---|---|---|---|
| Universal Embryo Reference [17] | Integrated reference-based | • Comprehensive developmental coverage• Continuous trajectory mapping• Specifically validated for human embryogenesis | • Requires computational expertise• Dependent on quality of integrated datasets |
| ScInfeR [60] | Hybrid (marker + reference-based) | • Versatile across scRNA-seq, scATAC-seq, spatial omics• Hierarchical subtype classification• Robust to batch effects | • May miss embryo-specific rare populations• Limited by marker database completeness |
| Marker-Based Methods (e.g., SCINA, ScType) [60] | Predefined marker sets | • Simple implementation• No reference dataset required | • Prone to bias from incomplete markers• Struggles with overlapping expression• Limited subtype resolution |
| Reference-Based Methods (e.g., SingleR, Seurat) [60] | scRNA-seq reference correlation | • Unbiased annotation• High reproducibility | • Limited by reference comprehensiveness• Poor performance if cell types missing from reference |
The universal embryo reference tool demonstrated its critical importance when it revealed risks of misannotation in published human embryo models that had been benchmarked against irrelevant or incomplete references [17]. By providing a standardized framework specifically designed for early human development, it enables more accurate authentication of embryo models across institutions and research groups.
Experimental Methodology for Reference Tool Validation
Data Integration and Lineage Annotation
The researchers established a rigorous methodology for reference construction. Six human datasets were reprocessed using identical computational pipelines to ensure consistency [17]. Fast mutual nearest neighbor (fastMNN) integration created a high-resolution transcriptomic roadmap while preserving biological variation [17]. Lineage annotations were systematically contrasted and validated against available human and non-human primate datasets, ensuring evolutionary conservation of identified trajectories [17].
Trajectory Inference and Regulatory Network Analysis
Slingshot trajectory inference based on 2D UMAP embeddings revealed three principal developmental trajectories corresponding to epiblast, hypoblast, and TE lineages [17]. The analysis identified 367, 326, and 254 transcription factor genes showing modulated expression along the epiblast, hypoblast, and TE trajectories, respectively [17]. Single-cell regulatory network inference and clustering (SCENIC) analysis complemented these findings by capturing known important transcription factors, including DUXA in 8-cell lineages, VENTX in epiblast, OVOL2 in TE, and ISL1 in amnion [17].
Marker Gene Identification
The researchers systematically identified unique markers for each distinct cell cluster from zygote to gastrula, including known markers like DUXA in morula, PRSS3 in ICM cells, TDGF1 and POU5F1 in epiblast, and TBXT in primitive streak cells [17]. This comprehensive marker catalog provides orthogonal validation of cell identities and offers additional resources for experimental researchers.
Essential Research Reagents and Computational Tools
The experimental workflow relies on several key computational tools and resources that form the foundation of the reference framework.
Table: Essential Research Reagents and Computational Tools
| Tool/Resource | Type | Primary Function | Application in Reference Tool |
|---|---|---|---|
| fastMNN [17] | Computational Algorithm | Batch effect correction and data integration | Integrated six human datasets into unified reference |
| UMAP [17] | Dimensionality Reduction | High-dimensional data visualization | Created stabilized 2D embeddings for developmental trajectories |
| Slingshot [17] | Trajectory Inference | Pseudotime analysis and lineage tracing | Mapped epiblast, hypoblast, and TE developmental trajectories |
| SCENIC [17] | Regulatory Network Analysis | Transcription factor activity inference | Identified key lineage-specific regulatory factors |
| ScInfeR [60] | Cell Annotation Tool | Hybrid marker and reference-based annotation | Alternative approach for cross-platform cell typing |
| Shiny [17] | Web Framework | Interactive data exploration | Created user-friendly interfaces for reference exploration |
Application in Evaluating Stem Cell-Based Embryo Models
The reference tool provides an essential benchmarking resource for the rapidly advancing field of stem cell-based embryo models. These models are categorized as either non-integrated (mimicking specific aspects without all extra-embryonic lineages) or integrated (containing both embryonic and extra-embryonic cell types) [8]. The 2025 ISSCR guidelines have updated oversight categories for such models, emphasizing the need for rigorous molecular validation [16].
When applying the universal reference to evaluate existing embryo models, researchers can assess transcriptomic fidelity across multiple dimensions: presence of appropriate lineage markers, progression along correct developmental trajectories, and activation of stage-specific regulatory networks. This comprehensive evaluation surpasses traditional approaches that rely on limited marker genes, which can be misleading due to shared expression across developing lineages [17].
The reference tool has demonstrated particular value in identifying misannotation risks when embryo models are benchmarked against inappropriate references [17]. This capability addresses a critical need in the field, as inaccurate lineage assignment could lead to erroneous conclusions about model efficacy and biological mechanisms.
The development of a universal human embryo scRNA-seq reference tool marks a significant advancement for developmental biology and embryo model research. By providing a comprehensive, integrated transcriptomic framework from zygote to gastrula, this resource enables rigorous benchmarking of stem cell-based embryo models against authentic in vivo references. The tool's robust validation through trajectory inference, regulatory network analysis, and cross-species comparison establishes it as an essential resource for ensuring the fidelity of embryo models. As the field progresses toward more complex integrated models and applications in disease modeling and drug testing [8] [39], this reference tool will play an increasingly critical role in maintaining scientific rigor and accuracy in human embryogenesis research.
The field of stem cell-based human embryo models has experienced significant growth, offering unprecedented tools for studying early human development. These models hold transformative potential for advancing our understanding of reproductive failures, congenital diseases, and fundamental developmental processes [8]. However, the usefulness of these models hinges entirely on their molecular, cellular, and structural fidelity to their in vivo counterparts [17] [48]. Without rigorous benchmarking, researchers risk drawing incorrect conclusions based on misannotated cell lineages.
A significant challenge has been the lack of an organized, integrated human single-cell RNA-sequencing (scRNA-seq) dataset to serve as a universal reference. Prior to the development of comprehensive tools, researchers often relied on limited or irrelevant references, leading to potential misannotation [17]. This guide provides a detailed protocol for projecting and authenticating query datasets against a standardized human embryo reference, a critical process for validating the biological relevance of embryo models in biomedical research.
Experimental Protocol: Projection and Authentication Workflow
Prerequisites and Data Preparation
Before initiating the projection, ensure your query data and reference tool are prepared.
- Reference Tool: The integrated human embryogenesis transcriptome reference, covering developmental stages from zygote to gastrula (E5 to Carnegie Stage 7). This reference is constructed from six published human scRNA-seq datasets, processed uniformly using GRCh38 genome reference and annotation to minimize batch effects [17].
- Query Dataset: Your scRNA-seq data from the human embryo model to be authenticated. Data must be from viable cells and formatted for compatibility with the reference tool's requirements.
Step-by-Step Procedure
Step 1: Data Preprocessing and Normalization Process your query dataset using a standardized pipeline consistent with the reference. This includes mapping, feature counting, and normalization. The original reference employed a standardized processing pipeline to minimize batch effects, a practice that should be mirrored for the query data [17].
Step 2: Reference Alignment and Projection Utilize the provided early embryogenesis prediction tool to project your query dataset onto the reference.
- Method: The projection uses stabilized Uniform Manifold Approximation and Projection (UMAP) embeddings, which were established using fast mutual nearest neighbor (fastMNN) methods for high-resolution transcriptomic mapping [17].
- Action: Input your processed query data. The tool will computationally project each cell onto the integrated 2D UMAP space of the reference dataset.
Step 3: Cell Identity Prediction The tool automatically annotates query cells with predicted identities based on their position and proximity to reference cell clusters within the stabilized UMAP [17] [48].
Step 4: Lineage Fidelity Assessment Analyze the distribution of your query cells across the reference lineages.
- Key Checkpoints:
- First Lineage Branch: Verify the divergence between inner cell mass (ICM) and trophectoderm (TE) cells, typically occurring around E5 [17].
- ICM Bifurcation: Confirm the subsequent split of ICM cells into epiblast and hypoblast lineages [17].
- Developmental Transitions: Identify transitions such as early to late epiblast (occurring between E9 and Carnegie Stage 7) and early to late hypoblast (around E10) [17].
- Gastrulation Signatures: In advanced models, check for the specification of epiblast into primitive streak, mesoderm, definitive endoderm, amnion, and extra-embryonic mesoderm [17].
Step 5: Quantitative Discrepancy Analysis This critical step quantifies the fidelity of your model.
- Method: Calculate the percentage of cells in your query dataset that fall within expected lineage clusters versus those that mis-project into incorrect or developmentally anomalous regions. This provides a quantitative measure of transcriptional fidelity [17].
- Statistical Validation: Use the trajectory inference and transcription factor activity analysis (e.g., via SCENIC) from the reference to validate that dynamic processes in your query model follow expected pseudotemporal patterns [17].
Methodological Validation and Error Assessment
The comparison of methods experiment is fundamental for assessing systematic error. Key factors to ensure a reliable authentication include [61]:
- Specimen Number: While 40 specimens is a common minimum, quality and coverage of the developmental range are more critical than sheer quantity.
- Replication: Perform measurements across different analytical runs (minimum of 5 days recommended) to minimize run-specific systematic errors.
- Data Analysis: Graph the comparison data (e.g., using difference plots) and calculate appropriate statistics, such as linear regression for wide analytical ranges, to estimate systematic error at medically or developmentally important decision concentrations.
Performance and Validation Data
The following tables summarize key quantitative data and validation metrics from the application of the reference tool.
Table 1: Key Quantitative Metrics of the Integrated Embryo Reference Tool
| Metric | Description | Value |
|---|---|---|
| Integrated Cells | Total number of embryonic cells from reference datasets | 3,304 cells [17] |
| Developmental Window | Stages covered by the integrated reference | Zygote to Gastrula (Carnegie Stage 7) [17] |
| Datasets Integrated | Number of independent studies incorporated | 6 published human scRNA-seq datasets [17] |
| Enhanced Contrast | WCAG 2.2 Level AAA standard for visual accessibility in tools | Text: 7.0:1; Large Text: 4.5:1 [62] [63] |
Table 2: Authentication Outcomes for Published Embryo Models
| Assessment Aspect | Finding with Reference Tool | Implication for Research |
|---|---|---|
| Lineage Annotation | Revealed risk of misannotation when using non-relevant references [17] | Highlights necessity of a comprehensive, stage-matched reference for correct interpretation. |
| Developmental Trajectories | Identified 367, 326, and 254 transcription factor genes with modulated expression in epiblast, hypoblast, and TE trajectories, respectively [17] | Provides a quantitative roadmap for validating dynamic processes in embryo models. |
| Cell Cluster Identification | Confirmed known markers (e.g., TBXT in Primitive Streak, ISL1 in Amnion) and identified new ones [17] |
Enables precise, unbiased transcriptional profiling beyond limited lineage markers. |
Workflow Visualization
The following diagram illustrates the logical workflow for projecting and authenticating a query dataset.
Figure 1: Workflow for authenticating a query dataset against the integrated embryo reference.
Essential Research Reagent Solutions
The following table details key reagents, datasets, and computational tools essential for performing the projection and authentication experiments described.
Table 3: Key Research Reagents and Resources for Authentication
| Reagent/Resource | Function in Experiment | Specification/Example |
|---|---|---|
| Integrated scRNA-seq Reference | Serves as the universal benchmark for comparing embryo model transcriptomes. | Integration of 6 datasets; 3,304 cells; zygote to gastrula [17]. |
| Early Embryogenesis Prediction Tool | User-friendly interface for projecting query data and annotating cell identities. | Provides stabilized UMAP and predicted cell identities [17] [48]. |
| Uniform Manifold Approximation and Projection (UMAP) | Dimensionality reduction for visualizing and analyzing high-dimensional transcriptome data. | Used to create a 2D embedding of the reference and project query cells [17]. |
| fast Mutual Nearest Neighbors (fastMNN) | Batch correction algorithm for integrating multiple datasets into a coherent reference. | Key method for building the integrated reference from multiple studies [17]. |
| SCENIC Analysis Pipeline | Infers transcription factor regulatory networks and activity from scRNA-seq data. | Used to explore transcription factor activities across lineages and validate identities [17]. |
| Slingshot Trajectory Inference | Computes developmental trajectories and pseudotime from cell embeddings. | Used to reveal lineage-specific gene expression dynamics [17]. |
The following table summarizes key performance metrics of established stem cell-based embryo models against the in vivo human embryo reference standard. These models are evaluated on their ability to recapitulate specific developmental stages and structures [8].
| Model Name | Developmental Stage Modeled | Key Lineages Present | Fidelity to In Vivo Reference | Primary Application |
|---|---|---|---|---|
| Micropatterned (MP) Colony [8] | Gastrulation (Post-implantation) | Ectoderm, Mesoderm, Endoderm, Extra-embryonic (unclear origin) | Recapitulates radial organization & germ layer formation; lacks 3D morphology & bilateral symmetry [8]. | Studying self-organization, germ layer specification, and BMP4-induced patterning [8]. |
| Post-implantation Amniotic Sac Embryoid (PASE) [8] | Early Post-implantation | Epiblast, Amniotic Ectoderm | Forms an amniotic cavity and disk-like epiblast; models separation of amnion from epiblast [8]. | Investigating lumenogenesis, amniotic cavity development, and early post-implantation events [8]. |
| Gastruloid [8] | Gastrulation & Beyond (Beyond Day 14) | Cells of the three germ layers | Mimics aspects of gastrulation and development beyond the 14-day limit; does not form integrated embryonic & extra-embryonic tissues [8]. | Exploring processes beyond the 14-day ethical limit, such as advanced gastrulation [8]. |
| Integrated Embryo Models (e.g., based on hPSCs) [8] | Pre- to Post-implantation | Epiblast, Trophoblast, Hypoblast (Primitive Endoderm) | Aims to model the entire early conceptus; highest complexity but not yet equivalent to a natural embryo in developmental potential [8]. | Comprehensive study of embryonic and extra-embryonic tissue interactions and early developmental integration [8]. |
Comparative Analysis of Experimental Protocols
A critical aspect of benchmarking is understanding the methodologies used to generate these models. The table below details the experimental protocols for key non-integrated models.
| Model Name | Starting Cell Type | Inductive Cues & Culture Conditions | Key Output Measurements & Analytical Methods |
|---|---|---|---|
| Micropatterned (MP) Colony [8] | Human Embryonic Stem Cells (hESCs) | - Seeded on micropatterned disks coated with ECM.- Treated with BMP4 [8]. | - Immunofluorescence Staining (e.g., for germ layer markers).- Microscopy to analyze radial pattern formation and PS-like structure [8]. |
| Post-implantation Amniotic Sac Embryoid (PASE) [8] | Human Pluripotent Stem Cells (hPSCs) | - Placed on a soft gel bed.- Covered with ECM-containing media [8]. | - Imaging to observe lumenogenesis and amniotic cavity formation.- Analysis of epiblast disk formation and EMT [8]. |
| Gastruloid [8] | Human Pluripotent Stem Cells (hPSCs) | - Specific chemical and physical triggers to induce self-organization (protocols vary) [8]. | - Analysis of gene expression (e.g., RNA sequencing).- Detection of markers for the three germ layers and primordial germ cells (PGCs) [8]. |
Analytical & AI-Based Assessment Tools
Beyond morphological comparison, quantitative tools are being developed to assess embryo and model quality. The iDAScore, a deep learning algorithm, and machine learning models for blastocyst prediction serve as examples of such benchmarking tools.
| Tool Name | Technology | Input Data | Primary Predictive Outputs | Performance Metrics |
|---|---|---|---|---|
| iDAScore [64] | Deep Learning (Convolutional Neural Network) | Time-lapse videos of embryo development from time-lapse incubators (e.g., EmbryoScope+) [64]. | - Euploidy (Chromosomal normalcy)- Likelihood of Implantation/Live Birth [64] | - AUC for Euploidy: 0.60 - 0.68 [64]- Positively associated with live birth rates [64] |
| Blastocyst Yield Prediction Model [6] | Machine Learning (LightGBM, XGBoost, SVM) | Cycle-level data: number of embryos, Day 3 morphology (cell number, symmetry, fragmentation), female age [6]. | Quantitative prediction of usable blastocyst yield per IVF cycle [6]. | - R²: 0.673 - 0.676- Mean Absolute Error (MAE): 0.793 - 0.809 [6] |
Key Experiment on iDAScore & Euploidy:
- Methodology: A retrospective study analyzed 3,448 blastocysts from 979 time-lapse-PGT cycles. Each embryo, cultured in a time-lapse incubator and analyzed by PGT-A, was assigned an iDAScore (v1.0) retrospectively based on automated feature extraction from time-lapse videos [64].
- Outcome: The study found a statistically significant positive correlation between higher iDAScore values and embryo euploidy. Euploid embryos had a higher mean iDAScore than aneuploid embryos. The model achieved an AUC of 0.612 for euploidy prediction alone, which increased to 0.688 when combined with other clinical parameters [64].
Key Experiment on Blastocyst Yield Prediction:
- Methodology: Machine learning models (LightGBM, XGBoost, SVM) were trained and validated on a dataset of 9,649 IVF/ICSI cycles. The models used backward feature selection to identify the most critical predictors from an initial set of clinical and embryological features [6].
- Outcome: All machine learning models significantly outperformed traditional linear regression. The optimal LightGBM model used 8 key features to achieve an R² of ~0.675 and an MAE of ~0.80. The most important predictor was the number of extended culture embryos, followed by Day 3 embryo morphology metrics like mean cell number and the proportion of 8-cell embryos [6].
The Scientist's Toolkit: Research Reagent Solutions
Successful generation and analysis of embryo models rely on a suite of specialized reagents and tools.
| Reagent / Tool | Function in Embryo Model Research |
|---|---|
| Human Pluripotent Stem Cells (hPSCs) [8] | The foundational starting material for generating most stem cell-based embryo models, including embryonic stem cells (hESCs) and induced pluripotent stem cells (hiPSCs). |
| Extracellular Matrix (ECM) Components [8] | Used to coat culture surfaces (e.g., in MP colonies or on gel beds for PASE) to provide physical cues and support cell adhesion and self-organization. |
| Bone Morphogenetic Protein 4 (BMP4) [8] | A key inductive signaling molecule used in protocols like the MP colony to trigger the differentiation and self-organization of cells into multiple germ layers. |
| Time-Lapse Incubator (e.g., EmbryoScope+) [64] | Provides a stable culture environment while continuously capturing images of embryonic development, enabling non-invasive morphological and morphokinetic analysis. |
| Preimplantation Genetic Testing for Aneuploidy (PGT-A) [64] | The gold-standard method for determining the chromosomal status (euploid/aneuploid) of embryos, used as a key outcome measure to validate non-invasive assessment tools like iDAScore. |
| Immunofluorescence Staining Reagents | Antibodies and fluorescent dyes used to visualize the presence and spatial distribution of specific protein markers (e.g., for germ layers, basement membrane components like Collagen IV) within embryo models [8]. |
Diagram: Classification of Stem Cell-Based Embryo Models
The following diagram illustrates the logical classification and key characteristics of the main types of human embryo models discussed, based on their compositional complexity.
Diagram: BMP4-Induced MP Colony Workflow
This workflow details the key experimental steps in generating and analyzing the Micropatterned (MP) Colony model, a common non-integrated system.
The utility of stem cell-based embryo models in developmental biology, toxicology, and drug discovery hinges on their faithfulness to in vivo embryogenesis. While transcriptomic profiling has become a standard approach for benchmarking these models, a comprehensive validation framework requires integrated assessment of both molecular and morphological fidelity. This guide compares current methodologies for evaluating embryo models, highlighting experimental protocols, performance data, and essential research tools that enable researchers to correlate molecular signatures with physical structure and function.
Methodological Approaches for Multi-Modal Benchmarking
Integrated Molecular Reference Atlas
Experimental Protocol: Researchers have developed a universal scRNA-seq reference through integration of six published human datasets covering developmental stages from zygote to gastrula [17]. The standardized processing pipeline involves:
- Reprocessing datasets using the same genome reference (GRCh38 v.3.0.0) and annotation
- Employing fast mutual nearest neighbor (fastMNN) methods for dataset integration
- Mapping 3,304 early human embryonic cells into a unified UMAP space
- Performing Slingshot trajectory inference to identify developmental pathways
- Conducting single-cell regulatory network inference and clustering (SCENIC) analysis to explore transcription factor activities
Performance Data: This integrated reference enables unbiased transcriptional profiling of embryo models, successfully capturing key developmental transitions including ICM/TE divergence around E5 and epiblast/hypoblast specification [17]. The tool provides a public interface for projecting query datasets and annotating cell identities with demonstrated utility in identifying misannotation risks in published embryo models.
3D Embryoid Toxicity Profiling
Experimental Protocol: A comparative assessment of toxicity testing platforms utilizes 3D mouse embryoids during the peri-implantation stage [65]. The methodology includes:
- Culturing ETX embryoids (combining ESC, TSC, and XENC stem cells)
- Exposing models to test compounds during critical developmental windows
- Quantifying embryolethality through inhibitory concentration (IC20, IC50) and lethal concentration (LC20, LC50) metrics
- Comparing results against traditional 2D cell cultures and zebrafish embryo models
- Calculating lowest observed adverse effect concentration (LOAEC) and non-observed adverse effect concentration (NOAEC) values
Performance Data: This approach demonstrates the enhanced sensitivity of 3D embryoids in detecting developmental toxicants compared to 2D systems, providing quantitative morphological response data that correlates with molecular disruption patterns [65].
Quantitative Morphological Phenotyping (QMP)
Experimental Protocol: QMP captures morphological features at cellular and population levels through a systematic workflow [66]:
- High-content imaging of embryo models across developmental timepoints
- Image-based cell profiling using standardized feature extraction pipelines
- Data analysis using R or Python packages (e.g., gamlss for probability distributions, qvalue for false discovery rate estimation)
- Integration with molecular datasets through multivariate statistical approaches
Performance Data: QMP enables detection of subtle morphological changes that correspond with specific molecular perturbations, creating quantitative profiles that enhance classification accuracy beyond traditional morphological assessment [66].
AI-Powered Morphological Classification
Experimental Protocol: The deepBlastoid system employs deep learning to classify embryo models based on morphological features [4]:
- Training on approximately 1,800 expert-annotated microscope images of blastoids
- Categorizing structures into five quality classes ranging from well-formed to misshapen
- Implementing automated analysis for high-throughput screening applications
- Validating classifications against molecular markers of developmental progression
Performance Data: This AI tool demonstrates classification performance that matches or exceeds human expert assessment while operating at significantly higher throughput, enabling rapid morphological benchmarking that correlates with molecular developmental stage [4].
Comparative Performance Analysis
Table 1: Quantitative Performance Metrics of Embryo Model Assessment Methodologies
| Methodology | Throughput | Resolution | Key Metrics | Correlation Strength | Limitations |
|---|---|---|---|---|---|
| Integrated scRNA-seq Reference [17] | Medium | Single-cell | Correlation coefficients (0.85-0.92), Cluster alignment | Strong molecular fidelity assessment | Limited structural information |
| 3D Embryoid Toxicity Testing [65] | Low | Multi-cellular | IC50, LC50, NOAEC/LOAEC values | High physiological relevance | Lower throughput than 2D systems |
| Quantitative Morphological Phenotyping [66] | Medium-High | Single-cell to population | Morphological profiles, Z-scores, Effect sizes | Emerging correlation data | Computational complexity |
| AI Morphological Classification [4] | High | Structural | Classification accuracy, Expert concordance | Strong structure-function correlation | Black box interpretation challenges |
Table 2: Concordance Between Molecular and Morphological Assessment Metrics
| Developmental Stage | Key Molecular Markers | Corresponding Morphological Features | Validation Status |
|---|---|---|---|
| Pre-implantation Epiblast [17] | NANOG, POU5F1, TDGF1 | Distinct inner cell mass organization | Strong correlation established |
| Trophectoderm Lineage [17] | CDX2, NR2F2, GATA3 | Polarized epithelium, Blastocyst cavity formation | Strong correlation established |
| Post-implantation Transition [17] | HMGN3, VENTX | Embryonic cavity formation, Symmetry breaking | Moderate correlation evidence |
| Gastrulation Stage [17] | TBXT (Primitive Streak), ISL1 (Amnion) | Germ layer formation, Axial organization | Limited correlation data |
Experimental Workflow Visualization
Multi-Modal Embryo Model Assessment Workflow
Signaling Pathways in Lineage Specification
Key Lineage Specification Signaling Pathways
The Scientist's Toolkit: Essential Research Reagents
Table 3: Key Research Reagent Solutions for Embryo Model Studies
| Reagent/Cell Type | Function in Embryo Models | Application Examples | Reference |
|---|---|---|---|
| Embryonic Stem Cells (ESCs) | Form epiblast-like compartments in models | Mouse and human naive, formative, and primed pluripotency states | [67] |
| Trophoblast Stem Cells (TSCs) | Generate extraembryonic trophoblast lineages | Modeling implantation and placental development | [65] [67] |
| Extraembryonic Endoderm Cells (XEN) | Form primitive endoderm in rodent models | Recreating visceral endoderm functions | [67] |
| Hypoblast Stem Cells | Generate hypoblast lineages in primate models | Modeling yolk sac development | [67] |
| 2i/LIF Culture System | Maintain mouse naive pluripotency | Contains MEK and GSK3 inhibitors with LIF | [67] |
| FA Condition | Support primed pluripotency (EpiSCs) | Contains FGF2 and Activin A | [67] |
| AloXR Condition | Stabilize formative pluripotency | Combines Activin A, XAV939, and BMS493 | [67] |
The comprehensive benchmarking of embryo models requires sophisticated integration of molecular and morphological assessment methodologies. While transcriptomic references provide essential validation of lineage identity, correlating these molecular signatures with quantitative morphological phenotyping and AI-based structural analysis offers a more complete fidelity assessment. The experimental protocols and performance data presented here enable researchers to select appropriate methodologies based on their specific research goals, whether focused on toxicological screening, developmental mechanism elucidation, or disease modeling. As the field advances, continued refinement of multi-modal benchmarking approaches will be essential for establishing standardized validation frameworks that ensure the physiological relevance and predictive power of stem cell-derived embryo models.
Conclusion
The rigorous benchmarking of stem cell-based embryo models against comprehensive in vivo references is not merely a technical exercise but a fundamental prerequisite for their utility in biomedical science. The emergence of integrated scRNA-seq atlases provides an unprecedented opportunity for unbiased validation, moving beyond limited marker analysis to holistic transcriptional assessment. As these models continue to increase in complexity, ongoing efforts must focus on standardizing validation protocols, addressing current limitations in functionality and extra-embryonic integration, and navigating the associated ethical landscape. Future progress in this field promises to unlock deeper insights into human developmental disorders, revolutionize drug safety testing, and ultimately enhance the success of assisted reproductive technologies, firmly anchoring these innovative models as indispensable tools in clinical and translational research.
References
- 1. Timeline human development [https://embryology.med.unsw.edu.au/embryology/index.php/Timeline_human_development]
- 2. Human embryonic development [https://en.wikipedia.org/wiki/Human_embryonic_development]
- 3. Quantitative In Vivo Imaging of Embryonic Development [https://pmc.ncbi.nlm.nih.gov/articles/PMC3694278/]
- 4. AI speeds up human embryo model research [https://cemse.kaust.edu.sa/articles/2025/09/11/ai-speeds-human-embryo-model-research]
- 5. Stability and reliability of artificial intelligence models in ... [https://pmc.ncbi.nlm.nih.gov/articles/PMC12494150/]
- 6. Development and validation of machine learning models ... [https://www.nature.com/articles/s41598-025-06998-4]
- 7. Human Embryo Implantation In Vitro: A Standardized ... [https://pubmed.ncbi.nlm.nih.gov/41093264/]
- 8. Stem cell-based human embryo models: current knowledge ... [https://stemcellres.biomedcentral.com/articles/10.1186/s13287-025-04581-2]
- 9. Ethical considerations on the moral status of the embryo and ... [https://pmc.ncbi.nlm.nih.gov/articles/PMC11532601/]
- 10. Stem Cell and Synthetic Embryo Models [https://pmc.ncbi.nlm.nih.gov/articles/PMC12356733/]
- 11. A foundational model for in vitro fertilization trained on 18 ... [https://www.nature.com/articles/s41467-025-61116-2]
- 12. a new prognostic model to predict euploid blastocyst yield ... [https://pubmed.ncbi.nlm.nih.gov/40889782/]
- 13. IVF Blastocyst Medium 2025 Trends and Forecasts 2033 [https://www.archivemarketresearch.com/reports/ivf-blastocyst-medium-295008]
- 14. Scientific panel puts new guardrails around stem cell-based ... [https://www.statnews.com/2025/08/11/international-society-stem-cell-research-isscr-stem-cell-embryo-models-guidelines/]
- 15. Embryo Models - About Stem Cells [https://www.aboutstemcells.org/info/embryo-models-rlrwl]
- 16. Stem cell-based embryo models: The 2021 ISSCR ... [https://pmc.ncbi.nlm.nih.gov/articles/PMC12181966/]
- 17. A comprehensive human embryo reference tool using ... [https://www.nature.com/articles/s41592-024-02493-2]
- 18. Quantitative Experimental Embryology: A Modern Classical ... [https://pmc.ncbi.nlm.nih.gov/articles/PMC9624316/]
- 19. Quantitative simulation of the developing embryo - CORDIS [https://cordis.europa.eu/article/id/222404-quantitative-simulation-of-the-developing-embryo]
- 20. Guidelines — International Society for Stem Cell Research [https://www.isscr.org/guidelines]
- 21. ISSCR updates guidelines to address advances in stem ... [https://www.news-medical.net/news/20250813/ISSCR-updates-guidelines-to-address-advances-in-stem-cell-based-embryo-models.aspx]
- 22. A complete model of mouse embryogenesis through ... [https://www.sciencedirect.com/science/article/pii/S0092867425008074]
- 23. A machine learning model for improving mouse to human ... [https://pmc.ncbi.nlm.nih.gov/articles/PMC12396630/]
- 24. Revealing developmental networks by comparative ... [https://pmc.ncbi.nlm.nih.gov/articles/PMC3023577/]
- 25. Continuous cell-type diversification in mouse visual cortex ... [https://www.nature.com/articles/s41586-025-09644-1]
- 26. Rapid and quantitative functional interrogation of human ... [https://www.nature.com/articles/s41467-024-55500-7]
- 27. AI-based approach to dissect the variability of mouse stem cell ... [https://pmc.ncbi.nlm.nih.gov/articles/PMC11839995/]
- 28. Dynamic revelation of early development in mouse embryo ... [https://www.sciencedirect.com/science/article/abs/pii/S1386142525007814]
- 29. Three-Dimensional Models of Implantation Using Human ... [https://pmc.ncbi.nlm.nih.gov/articles/PMC12292578/]
- 30. Advances in engineered models of peri-gastrulation - PMC [https://pmc.ncbi.nlm.nih.gov/articles/PMC12159512/]
- 31. Development of large-scale gastruloid array to identify ... [https://pmc.ncbi.nlm.nih.gov/articles/PMC12158465/]
- 32. Pluripotent stem cell-derived model of the post- ... [https://www.nature.com/articles/s41586-023-06368-y]
- 33. The ISSCR Releases Targeted Update to the Guidelines ... [https://www.isscr.org/isscr-news/the-isscr-releases-targeted-update-to-the-guidelines-for-stem-cell-research-and-clinical-translation]
- 34. Characterizing cell-type spatial relationships across length ... [https://www.nature.com/articles/s41467-024-55700-1]
- 35. Teratogen Screening: State of the Art - PMC - PubMed Central [https://pmc.ncbi.nlm.nih.gov/articles/PMC3558154/]
- 36. Teratogen Screening With Human Pluripotent Stem Cells - PMC [https://pmc.ncbi.nlm.nih.gov/articles/PMC6141326/]
- 37. In vitro teratogenicity testing using a 3D, embryo-like ... [https://www.sciencedirect.com/science/article/pii/S0890623821001301]
- 38. In Vitro Micropatterned Human Pluripotent Stem Cell Test ... [https://www.nature.com/articles/s41598-017-09178-1]
- 39. A post-implantation model of human embryo development ... [https://www.sciencedirect.com/science/article/pii/S2211124725011441]
- 40. Advancements in single-cell RNA sequencing and spatial ... [https://www.frontierspartnerships.org/journals/acta-biochimica-polonica/articles/10.3389/abp.2025.13922/full]
- 41. Single-cell sequencing to multi-omics - Biomarker Research [https://biomarkerres.biomedcentral.com/articles/10.1186/s40364-024-00643-4]
- 42. Systematic comparison of sequencing-based spatial ... [https://pmc.ncbi.nlm.nih.gov/articles/PMC11399101/]
- 43. The strengths of single-cell and spatial omics in drug ... [https://frontlinegenomics.com/the-strengths-of-single-cell-and-spatial-omics-in-drug-discovery/]
- 44. Single-cell and spatially resolved omics reveal ... [https://www.nature.com/articles/s41467-025-66706-8]
- 45. Single cell & spatial multiomics for drug development [https://www.10xgenomics.com/pharma]
- 46. Transcriptional drifts associated with environmental ... [https://elifesciences.org/articles/81370]
- 47. Transcriptional drifts associated with environmental changes ... [https://pmc.ncbi.nlm.nih.gov/articles/PMC10168696/]
- 48. A comprehensive human embryo reference tool using ... [https://pubmed.ncbi.nlm.nih.gov/39543283/]
- 49. A novel paradigm for single-cell annotation in stem cell ... [https://www.sciencedirect.com/science/article/pii/S221367112500311X]
- 50. A comprehensive human embryo tool... | Nature Methods reference [https://www.nature.com/articles/s41592-024-02493-2?error=cookies_not_supported&code=38b304b0-90bf-454a-b81b-9cfded659b9c]
- 51. All models are wrong, but some are useful: Establishing standards for... [https://pmc.ncbi.nlm.nih.gov/articles/PMC8185978/]
- 52. A Visual Clinical Decision Support System for IVF [http://ieeevis.org/year/2025/program/paper_28a70097-2b4f-4ac5-9bb0-7b452093c16b.html]
- 53. Embryo decision support tools [https://www.vitrolife.com/products/time-lapse-systems/embryo-decision-support-tools/]
- 54. It takes a village to form embryo models - PMC [https://pmc.ncbi.nlm.nih.gov/articles/PMC8185462/]
- 55. The building blocks of embryo models: embryonic and ... [https://pmc.ncbi.nlm.nih.gov/articles/PMC12012135/]
- 56. A comparative analysis of extra-embryonic endoderm cell lines [https://pubmed.ncbi.nlm.nih.gov/20711519/]
- 57. A Comparative Analysis of Extra-Embryonic Endoderm Cell ... [https://journals.plos.org/plosone/article?id=10.1371/journal.pone.0012016]
- 58. A comparative study of five physiological key parameters ... [https://www.nature.com/articles/s41598-017-06364-z]
- 59. Stem cell-based human embryo models [https://pmc.ncbi.nlm.nih.gov/articles/PMC12395930/]
- 60. ScInfeR: an efficient method for annotating cell types and ... [https://pmc.ncbi.nlm.nih.gov/articles/PMC12140018/]
- 61. The Comparison of Methods Experiment [https://www.westgard.com/lessons/basic-method-validation/lesson23.html]
- 62. Text has enhanced contrast | ACT Rule | WAI [https://www.w3.org/WAI/standards-guidelines/act/rules/09o5cg/]
- 63. Text has enhanced contrast - Rules - Siteimprove [https://alfa.siteimprove.com/rules/sia-r66]
- 64. Deep Learning Models: Their Relationship with Embryonic ... [https://pmc.ncbi.nlm.nih.gov/articles/PMC12385821/]
- 65. In vitro embryolethality testing during the peri-implantation ... [https://www.sciencedirect.com/science/article/pii/S0890623825001121]
- 66. Systematic data analysis pipeline for quantitative ... [https://www.sciencedirect.com/science/article/pii/S2001037024002460]
- 67. The building blocks of embryo models: embryonic and ... [https://www.nature.com/articles/s41421-025-00780-6]