Beyond Redundancy: Advanced Strategies for Unraveling Hox Gene Function in Development and Disease
Functional redundancy among Hox genes, resulting from gene duplication events in vertebrate evolution, has long been a significant obstacle in genetic studies, often masking phenotypic consequences in single-gene knockout models.
Beyond Redundancy: Advanced Strategies for Unraveling Hox Gene Function in Development and Disease
Abstract
Functional redundancy among Hox genes, resulting from gene duplication events in vertebrate evolution, has long been a significant obstacle in genetic studies, often masking phenotypic consequences in single-gene knockout models. This article synthesizes current strategies to overcome this challenge, exploring the evolutionary origins of redundancy and detailing advanced methodological approaches, including multi-cluster CRISPR deletions and ecological fitness assays. We examine how researchers are systematically troubleshooting knockout studies by targeting specific paralogous groups and regulatory landscapes. Furthermore, we discuss rigorous validation techniques that demonstrate functional divergence between Hox paralogs, providing crucial insights for developmental biology and revealing new therapeutic targets in HOX-dysregulated diseases such as cancer.
The Evolutionary Puzzle of Hox Gene Redundancy: From Gene Duplication to Functional Overlap
FAQs: Overcoming Functional Redundancy in Hox Gene Research
What is the fundamental challenge of studying Hox gene function, and why does it occur?
The primary challenge is functional redundancy, where the loss of a single Hox gene is often compensated for by other members of the same paralog group. This occurs because vertebrates possess multiple Hox clusters (A, B, C, D) resulting from whole-genome duplications (WGDs), and genes within the same paralog group (e.g., Hoxa5, Hoxb5, Hoxc5) share similar sequences and often overlapping expression patterns and functions [1] [2]. Consequently, single gene knockouts may not reveal a phenotype, masking the gene's true developmental role.
What evolutionary events led to this redundancy in vertebrate Hox genes?
Vertebrate Hox clusters originated from two rounds of whole-genome duplication (1R and 2R) in the early vertebrate lineage. Evidence from cyclostome (hagfish and lamprey) genomes supports that 1R occurred in the vertebrate stem-lineage, while 2R occurred in the gnathostome (jawed vertebrate) stem-lineage after its divergence from cyclostomes [3]. This expanded the ancestral single Hox cluster into the four clusters (A, B, C, D) found in most jawed vertebrates, creating widespread genetic redundancy and increasing evolvability [4] [5].
Table 1: Hox Cluster Duplication Events in Vertebrate Evolution
| Event | Proposed Timing | Genomic Outcome | Key Supporting Evidence |
|---|---|---|---|
| 1R WGD | Early Cambrian | Single cluster → Two clusters | Inferred ancestral vertebrate karyotype reconstruction [3] |
| 2R WGD | Late Cambrian-Earliest Ordovician | Two clusters → Four clusters (in gnathostomes) | Genome synteny analysis; divergence from cyclostome lineage [3] |
| Teleost-specific WGD | After divergence from sturgeons | Four clusters → Up to eight clusters (e.g., in zebrafish) | Genomic analyses of teleost fishes [4] |
What is the most effective genetic strategy to overcome this redundancy?
Generating compound mutant mice—animals with simultaneous mutations in two or more Hox genes from the same paralog group—is a proven and effective strategy. For example, while single Hoxb5 or Hoxc5 mutants show no overt lung phenotype, and Hoxa5 single mutants do, Hoxa5;Hoxb5 compound mutants display an aggravated lung phenotype, leading to neonatal lethality and revealing specific and redundant roles for Hoxb5 in branching morphogenesis and goblet cell specification [1].
What critical phenotypic data should I analyze in Hox compound mutants?
A multi-faceted phenotypic analysis is crucial. Key endpoints include:
- Viability and Gross Morphology: Note neonatal lethality and overall organ structure [1].
- Histology: Use stains like Hematoxylin and Eosin (general morphology), Alcian blue (goblet cells/mucus), and Weigert (elastic fibers) [1].
- Immunohistochemistry (IHC) and Immunofluorescence (IF): Analyze cell proliferation (e.g., phospho-histone H3), apoptosis (e.g., cleaved caspase-3), and cell-type-specific markers (e.g., CC10, pro-SP-C, T1α, PECAM-1) [1].
- Morphometry: Quantify structural complexity using methods like radial alveolar count in the lung [1].
Table 2: Phenotypic Severity in Hox5 Paralog Mutants
| Genotype | Viability | Lung Phenotype Severity | Key Phenotypic Features |
|---|---|---|---|
| Wild-type | Viable | Normal | Normal branching, air space structure, and cell differentiation. |
Hoxb5−/− |
Viable | None reported | No overt lung defects described [1]. |
Hoxc5−/− |
Viable | None reported | No organ defects described [1]. |
Hoxa5−/− |
High neonatal mortality | Severe | Tracheal and lung dysmorphogenesis, emphysema-like phenotype in survivors [1]. |
Hoxa5−/−; Hoxb5−/− |
Lethal at birth | More severe than Hoxa5−/− alone |
Aggravated lung hypoplasia, defects in branching morphogenesis and goblet cell specification [1]. |
Are there new genomic technologies to study Hox gene regulation?
Yes, cutting-edge genomic technologies are essential for probing the complex regulatory landscape of Hox clusters. Key methods include:
- ATAC-seq: To identify open chromatin regions and map accessible cis-regulatory elements genome-wide [6].
- ChIP-seq: To determine the in vivo binding sites of Hox transcription factors and their co-factors, as well as histone modifications that mark active or repressed chromatin states [6].
- Spatial Transcriptomics (e.g., Curio): To map gene expression patterns within the context of the tissue architecture, directly linking Hox gene expression to specific anatomical locations [6].
Experimental Protocols
Protocol: Generating and Analyzing Hox Compound Mutant Mice
This protocol is adapted from research on Hoxa5;Hoxb5 compound mutants [1].
1. Generation of Compound Mutants
- Crossing Strategy: Mate single heterozygous (
Hoxa5+/−andHoxb5+/−) mice to generate double heterozygous (Hoxa5+/−;Hoxb5+/−) animals. Intercross these double heterozygotes to generate embryos of all possible genotypic combinations. - Genotyping: Perform Southern blot analysis or PCR on genomic DNA from experimental animals to identify all genotypes reliably.
2. Tissue Collection and Processing
- Collection: Collect lungs and other relevant tissues from wild-type and mutant embryos at key developmental stages (e.g., E13.5, E15.5, E18.5). Record wet lung and body weights.
- Fixation: Fix tissues in 4% cold paraformaldehyde.
- Embedding and Sectioning: Process fixed tissues through a graded ethanol series, clear in xylene, embed in paraffin, and section at 4 μm thickness.
3. Histological and Molecular Phenotyping
- Standard Staining:
- Hematoxylin and Eosin (H&E): For general morphology.
- Alcian Blue: To detect mucus-producing goblet cells.
- Weigert with tartrazine: To visualize elastic fibers.
- Immunohistochemistry (IHC):
- Deparaffinize and rehydrate sections.
- Perform antigen retrieval if required.
- Block endogenous peroxidases and apply blocking serum.
- Incubate with primary antibody (e.g., anti-phospho-Histone H3, anti-cleaved caspase-3).
- Incubate with a biotinylated secondary antibody, followed by an avidin-biotin-enzyme complex (ABC).
- Develop with a chromogen like DAB and counterstain.
- Quantitative Analysis:
- For proliferation indices, count pHH3-positive cells and total cell number in multiple random fields.
Protocol: Giemsa Banding (G-banding) for Karyotype Confirmation
G-banding is used for precise chromosomal identification, which is crucial when working with genetic models [7] [8].
Reagents & Equipment:
- Trypsin 2.5% solution (2.5 mL trypsin 10X + 49.5 mL 0.9% NaCl)
- Gurrs Giemsa stain (R66)
- Gurrs 6.8 Buffer
- 0.9% Sodium Chloride (NaCl)
- Acetone
- Coplin jars, forceps, coverslips, 50°C oven
Procedure:
- Set up six Coplin jars with the following solutions:
- Jar 1: 0.125% trypsin/0.9% NaCl mixture
- Jars 2 & 3: 0.9% NaCl for rinsing
- Jar 4: Gurrs Giemsa stain mixed with Gurrs 6.8 buffer and acetone
- Jars 5 & 6: Gurrs 6.8 buffer for rinsing
- Trypsinization: Dip a slide in the trypsin solution (Jar 1) for 10 seconds to 2 minutes. Timing is critical and must be optimized based on trypsin activity.
- Rinsing: Rinse the slide by sequential dipping in the two 0.9% NaCl rinsing jars (Jars 2 & 3).
- Staining: Place the slide in the Giemsa stain (Jar 4) for 5 minutes.
- Final Rinsing: Remove the slide and rinse by sequential dipping in the two Gurrs buffer jars (Jars 5 & 6).
- Drying and Mounting: Air-dry the slide, coverslip with a mounting medium, and dry in a 50°C oven. The slide is now ready for metaphase analysis under a microscope [8].
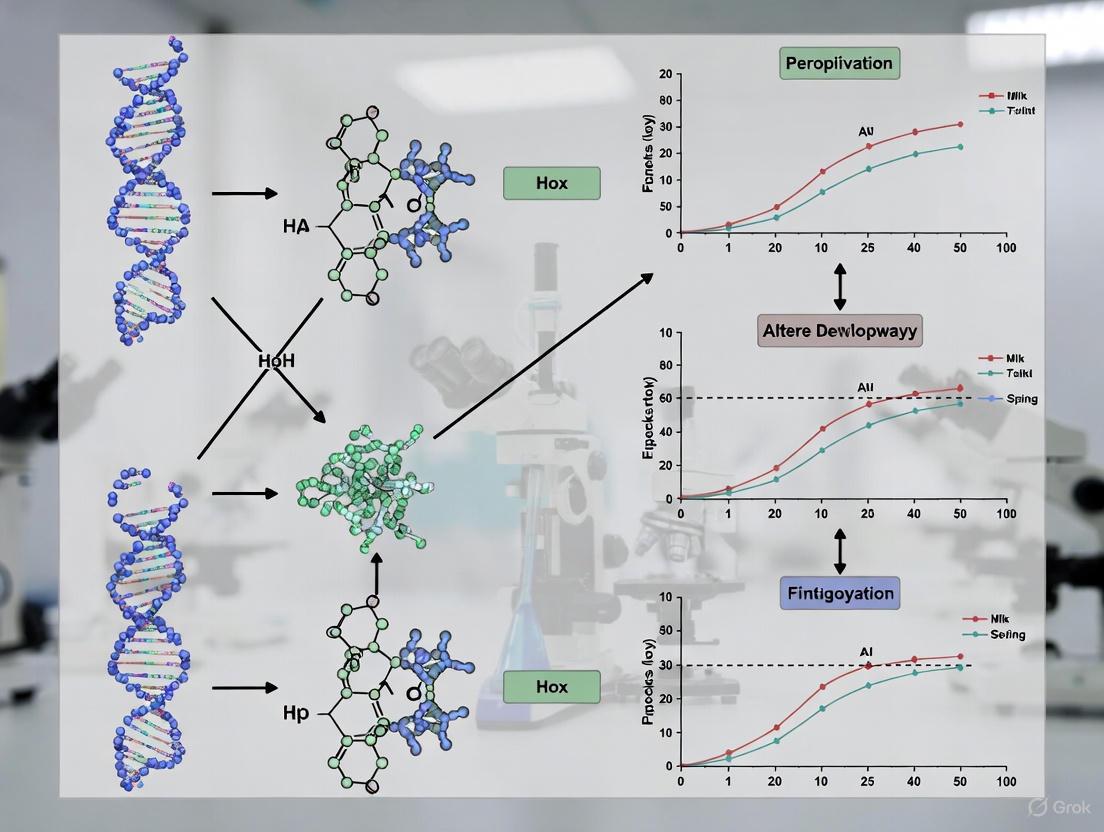
Visualizing Evolutionary and Experimental Relationships
Diagram 1: From Duplication to Experimental Solution
Diagram 2: Tackling Paralogue Redundancy
The Scientist's Toolkit: Research Reagent Solutions
Table 3: Essential Research Reagents for Hox Gene Functional Studies
| Reagent / Material | Function / Application | Example Use |
|---|---|---|
| Compound Mutant Mice | In vivo model to dissect functional redundancy between Hox paralogs. | Hoxa5;Hoxb5 mutants to uncover redundant roles in lung development [1]. |
| Antibodies for IHC/IF | Cell and tissue phenotyping. | Anti-pHH3 (proliferation), anti-cleaved caspase-3 (apoptosis), anti-CC10 (club cells), anti-PECAM-1 (endothelium) [1]. |
| Histological Stains | Visualizing tissue morphology and specific components. | Alcian Blue (acidic mucins), Weigert's stain (elastic fibers) [1]. |
| Giemsa Stain (G-banding) | Chromosome identification and karyotype confirmation. | Verifying chromosomal integrity and identifying large-scale abnormalities in mutant lines [7] [8]. |
| ATAC-seq & ChIP-seq Kits | Profiling chromatin accessibility and transcription factor binding. | Identifying active cis-regulatory elements and Hox gene targets genome-wide [6]. |
FAQs: Understanding Functional Redundancy in Gene Knockout Studies
Q1: Why does knocking out a single Hox gene sometimes fail to produce an observable phenotype?
A1: A single Hox gene knockout may not show a phenotype due to functional redundancy with its paralogs. Genes originating from duplication events, especially whole-genome duplications (WGD), are often retained because their proteins participate in multicomponent interactions like transcription factors and signal transduction [9]. When genes are functionally redundant, the presence of a paralog can compensate for the loss of the knocked-out gene, masking its function [1]. For instance, single mutants for Hoxb5 or Hoxc5 show no overt lung phenotype, whereas Hoxa5 mutants do, suggesting Hoxa5 function is less easily rescued but also hinting at potential compensation by other paralogs [1].
Q2: What are the common evolutionary fates of duplicated genes?
A2: After a duplication event, gene copies typically follow one of several paths [9]:
- Nonfunctionalization: The most common fate, where one copy accumulates deleterious mutations and becomes a non-functional pseudogene [9].
- Neofunctionalization: One copy acquires a mutation that gives it a novel, beneficial function, which is then preserved by natural selection [9].
- Subfunctionalization: The ancestral functions of the gene are partitioned between the two duplicates, often through complementary mutations in regulatory elements or protein domains [9] [10].
- Hypofunctionalization: Both copies undergo reduced expression, and the duplicate pair is maintained because the combined output is necessary for a critical function [9].
Q3: How can I experimentally overcome functional redundancy in my Hox gene research?
A3: To address functional redundancy, you must create compound mutants. This involves knocking out multiple paralogous genes simultaneously to uncover their combined roles [1]. For example, while Hoxa5 single mutants have a severe lung phenotype and Hoxb5 single mutants are viable with no reported defects, Hoxa5;Hoxb5 compound mutants display an aggravated lung phenotype, leading to neonatal death and revealing the partial redundant functions of Hoxb5 [1]. This demonstrates that compound mutagenesis is essential to unravel the full contribution of paralogous genes.
Q4: What is the relationship between subfunctionalization and neofunctionalization?
A4: Research suggests that subfunctionalization may act as a transition state to neofunctionalization rather than a terminal fate [10]. By partitioning ancestral functions, subfunctionalization can preserve a duplicate copy in the genome. This provides an evolutionary time window for one copy to accumulate mutations that may lead to a new function, ultimately resulting in neofunctionalization [10]. There is typically no long-term selective pressure to maintain simple genetic redundancy [10].
Troubleshooting Guide: Investigating Redundancy in Hox Gene Knockouts
Problem: No Phenotype Observed in Single Hox Gene Knockout
This guide outlines a systematic approach to confirm and investigate functional redundancy.
Step 1: Confirm Redundancy Hypothesis
- Action: Verify the expression patterns of paralogous genes.
- Protocol: Perform RNA in situ hybridization or immunohistochemistry on wild-type embryos at relevant developmental stages. Check for overlapping expression domains of the target gene and its paralogs [1].
- Expected Data: Significant overlap in spatiotemporal expression, particularly in the mesenchyme for Hox genes, supports the potential for functional redundancy [1].
Step 2: Design and Generate Compound Mutants
- Action: Cross single mutant lines to generate animals with mutations in multiple paralogous genes.
- Protocol:
- Mate
Hoxa5+/-mice withHoxb5-/-mice to obtain double heterozygous animals (Hoxa5+/-; Hoxb5+/-) [1]. - Intercross the double heterozygotes to generate embryos of all possible genotypic combinations, including the compound homozygous mutants (
Hoxa5-/-; Hoxb5-/-) [1]. - Genotype embryos using Southern blot analysis or PCR [1].
- Mate
Step 3: Phenotypic Characterization of Compound Mutants
- Action: Conduct a detailed morphological and molecular analysis of the compound mutants compared to wild-type and single mutants.
- Protocol:
- Histology: Collect and fix embryonic lungs (e.g., at E18.5). Process for paraffin embedding, section, and stain with Hematoxylin and Eosin (H&E) to assess general morphology [1].
- Special Stains:
- Immunohistochemistry (IHC): Use primary antibodies against cell-type-specific markers to assess cell fate specification. Example antibodies include:
- Proliferation/Apoptosis Assays:
Step 4: Data Analysis and Interpretation
- Action: Compare the severity of phenotypes across genotypes.
- Expected Outcome: A more severe phenotype in the compound mutant (e.g.,
Hoxa5-/-; Hoxb5-/-) compared to any single mutant (Hoxa5-/-orHoxb5-/-) confirms partial functional redundancy and reveals the collective role of the paralogs [1].
Data Presentation
Table 1: Evolutionary Fates of Duplicated Genes
| Fate | Description | Key Features | Likelihood in WGD vs. SSD |
|---|---|---|---|
| Nonfunctionalization | One copy loses function via deleterious mutations and is eventually lost. | Most common fate; returns the locus to a singleton state [9]. | High for both, but overall the most probable outcome. |
| Neofunctionalization | One copy acquires a new, adaptive function. | Generates evolutionary novelty; both copies are retained long-term [9]. | WGD genes are often involved in complex functions (e.g., signaling, development), making this fate significant [11]. |
| Subfunctionalization | Duplicates partition the ancestral gene's sub-functions. | Can be a neutral process that preserves duplicates; may be a transition to neofunctionalization [10]. | Facilitated by WGD due to dosage balance preservation [9]. |
| Hypofunctionalization | Both copies undergo reduced expression, but their combined output is essential. | Maintains duplicates through dosage sharing; expression can diverge in specific tissues [9]. | Common in WGD-derived pairs due to dosage constraints [9]. |
Table 2: Phenotypic Comparison of Hox5 Paralog Mutants in Mouse Lung Development
| Genotype | Viability | Key Lung Phenotypes | Interpretation |
|---|---|---|---|
| Wild-type | Viable | Normal branching morphogenesis, air space structure, and goblet cell distribution [1]. | Baseline normal development. |
| Hoxa5-/- | High neonatal mortality | Tracheal and lung dysmorphogenesis; surviving adults show emphysema-like air space enlargement and goblet cell metaplasia [1]. | Hoxa5 plays a unique and critical role, with limited compensation. |
| Hoxb5-/- | Viable | No overt lung phenotype reported in single mutants [1]. | Hoxb5 function is redundant or subtle under baseline conditions. |
| Hoxa5-/-; Hoxb5-/- | Lethal at birth | Aggravated lung phenotype: severe branching defects, goblet cell specification defects, and disrupted postnatal air space structure [1]. | Hoxa5 and Hoxb5 share partially redundant functions during lung morphogenesis. |
Experimental Pathways and Workflows
Diagram 1: Fate of Duplicated Genes Post-WGD
Diagram 2: Hox Gene Redundancy Investigation Workflow
The Scientist's Toolkit: Research Reagent Solutions
Table 3: Essential Reagents for Investigating Hox Gene Redundancy
| Reagent | Function/Application | Example/Target |
|---|---|---|
| Mutant Mouse Lines | In vivo models for studying gene function and genetic interactions. | Hoxa5 and Hoxb5 mutant lines [1]. |
| Primary Antibodies | Detection of specific cell types and processes via IHC/IF. | Pro-SP-C (alveolar type II cells), T1α (alveolar type I cells), CC10 (Clara cells), FOXA2 (endoderm), pHH3 (proliferation), Cleaved Caspase-3 (apoptosis) [1]. |
| Histological Stains | Visualization of tissue morphology and specific components. | Hematoxylin & Eosin (general structure), Alcian Blue (goblet cells/mucus), Weigert's stain (elastic fibers) [1]. |
| Genotyping Tools | Identification of animal genotypes. | Southern blot analysis or PCR protocols [1]. |
| Fixative | Tissue preservation for histological processing. | 4% Paraformaldehyde (PFA) [1]. |
FAQs: Addressing Core Challenges in Hox Gene Research
Q1: Why do many single Hox gene knockouts fail to show obvious developmental phenotypes?
A: This occurs primarily due to functional redundancy among Hox paralogs. Genes within the same paralog group share similar protein structures and expression patterns, enabling them to compensate for each other's loss [1] [12]. For instance, in the Hox5 paralog group, Hoxa5 single mutants exhibit significant lung defects, whereas Hoxb5 single mutants show no overt phenotype because Hoxa5 can compensate for its loss [1]. This suggests a threshold level of HOX5 proteins is required for normal development, which can be maintained by remaining paralogs [1].
Q2: What experimental evidence demonstrates functional redundancy between Hox genes?
A: Compound mutant studies provide the strongest evidence. Research on Hoxa5 and Hoxb5 showed that mutants carrying all four mutated alleles died at birth with aggravated lung defects, while single mutants were viable [1]. Similarly, in kidney development, knockout of the entire Hox11 paralog group abolishes kidney development, whereas single or double knockouts show less severe phenotypes [12]. These findings confirm that Hox paralogs share functions during organogenesis [1].
Q3: What advanced methodologies can detect subtle phenotypes in single Hox knockouts?
A: Single-cell, whole-embryo RNA sequencing provides unprecedented resolution. One study profiled over 1.6 million nuclei from 101 mouse embryos, identifying molecular and cellular changes in mutants that previously showed no overt physical abnormalities [13]. This approach can detect composition changes and gene expression differences across 52 cell types, revealing phenotypes that conventional methods miss [13].
Q4: How can researchers overcome redundancy to study Hox gene function?
A: Several strategies exist:
- Generate compound mutants targeting multiple paralogs within the same group [1]
- Use CRISPR/Cas9 mutagenesis for functional testing in diverse model organisms [14]
- Implement single-cell genomic approaches to identify subtle molecular changes [13]
- Analyze expression patterns to identify paralogs with overlapping domains that may compensate for each other [1]
Q5: Are there documented cases where single Hox knockouts do show clear phenotypes?
A: Yes, some single Hox knockouts produce distinct phenotypes, indicating they have unique, non-redundant functions. For example:
- Hoxa5 single mutants display tracheal and lung dysmorphogenesis with high neonatal mortality [1]
- Hoxa13 mutations cause hand-foot-genital syndrome in humans [12]
- In crustaceans, CRISPR/Cas9 knockout of individual Hox genes like Ubx, abd-A, and Abd-B causes specific homeotic transformations despite the presence of paralogs [14]
Quantitative Data on Hox Knockout Phenotypes
Table 1: Documented Phenotypes in Hox5 Paralog Group Mutants [1]
| Genotype | Viability | Lung Phenotype | Tracheal Phenotype | Other Defects |
|---|---|---|---|---|
| Wild-type | Viable | Normal | Normal | None |
| Hoxa5-/- | Neonatal lethality | Emphysema-like, goblet cell metaplasia | Dysmorphogenesis | Diaphragm innervation defects |
| Hoxb5-/- | Viable | No overt defects | Not reported | None reported |
| Hoxa5-/-;Hoxb5-/- | Neonatal lethality | Aggravated defects, impaired branching | Not studied | Not studied |
Table 2: Phenotype Severity Based on Number of Hox Paralogs Inactivated [12]
| Genes Inactivated | Kidney Phenotype | Interpretation |
|---|---|---|
| Single Hox11 gene | Normal development | Full compensation by other paralogs |
| Two Hox11 genes | Kidney hypoplasia | Partial compensation |
| All Hox11 paralogs | No kidney initiation | Complete loss of function |
Experimental Protocols for Studying Hox Redundancy
Protocol 1: Generating and Analyzing Compound Hox Mutants
Application: Systematically testing functional redundancy within Hox paralog groups [1].
Workflow:
- Mouse mating scheme: Cross single heterozygous mutants to obtain double heterozygous animals, then intercross to generate all allelic combinations
- Genotyping: Perform Southern blot analysis or PCR-based genotyping of offspring
- Embryo collection: Collect embryos at critical developmental stages (E13.5, E15.5, E18.5 for lung development studies)
- Phenotypic analysis:
- Measure wet lung/body weight ratios
- Histological staining (H&E for morphology, Alcian Blue for goblet cells)
- Immunohistochemistry for cell type markers (CC10, podoplanin, FOXA2, pro-SP-C)
- Cell proliferation assays (phospho-histone H3 immunostaining)
- Apoptosis assays (cleaved caspase-3 immunostaining)
Key Materials:
- Hox mutant mouse lines (maintain inbred background, e.g., 129/Sv)
- Primary antibodies against relevant markers
- Paraformaldehyde for fixation
- Paraffin embedding equipment
Protocol 2: Single-Cell RNA Sequencing for Phenotyping Hox Mutants
Application: Detecting subtle molecular and cellular phenotypes in Hox mutants [13].
Workflow:
- Embryo collection: Stage embryos precisely (e.g., E13.5)
- Nuclei isolation: Prepare single-cell or single-nucleus suspensions from whole embryos
- Library preparation: Use combinatorial indexing-based scRNA-seq (e.g., sci-RNA-seq)
- Sequencing: Profile approximately 16,000 nuclei per embryo
- Data analysis:
- Quality control (remove doublets, low-quality cells)
- Cell type identification using reference atlas (e.g., Mouse Organogenesis Cell Atlas)
- Differential abundance testing across cell types
- Pseudobulk analysis for genotype effects
- Trajectory inference for developmental processes
Key Materials:
- Single-cell RNA sequencing reagents
- Computational resources for large-scale data analysis
- Reference datasets for cell type annotation
Protocol 3: CRISPR/Cas9 Mutagenesis in Emerging Model Organisms
Application: Functional testing of Hox genes in diverse evolutionary contexts [14].
Workflow:
- Target selection: Design gRNAs against Hox genes of interest
- CRISPR/Cas9 delivery: Inject Cas9 protein/gRNA complexes into early embryos
- Somatic mutagenesis: Analyze resulting mosaic animals for homeotic transformations
- Phenotypic documentation: Image and characterize limb/specialized appendage transformations
- Validation: Confirm target gene disruption and correlate with expression domains
Key Materials:
- CRISPR/Cas9 reagents (Cas9 protein, synthetic gRNAs)
- Microinjection equipment
- Species-specific rearing facilities
Signaling Pathways and Experimental Workflows
Hox Redundancy Investigation Workflow
Research Reagent Solutions
Table 3: Essential Research Reagents for Hox Redundancy Studies
| Reagent/Tool | Application | Key Features | Example Use |
|---|---|---|---|
| Compound mutant mice | In vivo functional redundancy testing | Multiple Hox paralogs inactivated | Hoxa5;Hoxb5 double mutants [1] |
| CRISPR/Cas9 systems | Gene editing in diverse models | Somatic and germline mutagenesis | Parhyale limb specification studies [14] |
| Single-cell RNA-seq | Detecting subtle phenotypes | High-resolution molecular profiling | Whole-embryo mutant characterization [13] |
| Hox-specific antibodies | Protein expression analysis | Spatial expression patterns | IHC for Hox protein distribution |
| Primary cell markers | Cell type identification | Tissue-specific markers | CC10 (airway cells), podoplanin (lung epithelium) [1] |
| Spatial transcriptomics | Contextual gene expression | Maintains tissue architecture | Mapping Hox expression domains |
The Principle of Collinearity and Its Role in Axial Patterning and Limb Positioning
Frequently Asked Questions (FAQs)
Q1: What is the principle of collinearity in Hox gene function, and why is it a source of functional redundancy in knockout studies? The principle of collinearity describes the phenomenon where the order of Hox genes on chromosomes corresponds to both their temporal and spatial expression patterns along the embryo's anterior-posterior axis, as well as the anatomical boundaries of their function [15]. Genes at the 3' end of a cluster are expressed earlier and more anteriorly, while genes at the 5' end are expressed later and more posteriorly. This spatial and temporal organization is crucial for patterning the body plan, including determining the positions where limbs emerge [16] [15].
Functional redundancy arises because the 39 Hox genes in vertebrates are organized into four paralogous groups (A, B, C, D) as a result of genome duplication events [17] [18]. Genes within the same paralogous group (e.g., Hoxa1 and Hoxb1) can have highly similar protein sequences and overlapping expression domains, allowing one paralog to partially or fully compensate for the loss of the other in a standard laboratory knockout experiment [19]. This often results in minimal to no observable phenotypic consequences under controlled lab conditions, masking the gene's true biological function [19].
Q2: In a Hoxa2 knockout mouse, why is the limb positioning normal, and what does this teach us about functional redundancy? While Hoxa2 is crucial for patterning structures within the limb (autopod), its knockout does not typically affect the initial positioning of the limb along the body axis [15]. This is because limb positioning is governed by earlier-acting, more 3' Hox genes that specify the axial level of limb initiation [16] [15]. The Hoxa2 knockout phenotype primarily reveals its role in later patterning events, such as determining the identity of second pharyngeal arch derivatives and the formation of the external ear [20].
This teaches us that functional redundancy can be temporal and spatial. The functions of Hox genes in initial limb field specification are distinct from their later roles in patterning the limb bud itself. Knocking out a single Hox gene involved in later stages does not affect the earlier, redundant functions of other Hox genes that have already established the basic body plan.
Q3: What are the best experimental strategies to overcome the challenge of functional redundancy in Hox gene studies? Overcoming functional redundancy requires moving beyond single-gene knockouts in a standard lab setting. The following table summarizes robust experimental approaches:
Table: Strategies to Overcome Functional Redundancy in Hox Gene Research
| Strategy | Description | Key Insight |
|---|---|---|
| Multiple Gene Knockouts | Generating double, triple, or cluster-wide knockouts to eliminate all redundant paralogs [15]. | A progressive reduction in the gene dose of paralogous groups (e.g., Hoxa11 & Hoxd11) leads to proportional, severe limb truncations not seen in single mutants [15]. |
| Ecologically Relevant Fitness Assays (OPAs) | Competing mutant animals against wild-type controls in semi-natural enclosures to measure reproductive success and competitive ability [19]. | Reveals cryptic fitness defects (e.g., in territory acquisition and reproduction) that are completely masked in standard lab housing [19]. |
| Targeting cis-Regulatory Elements | Using CRISPR to delete specific enhancers or super-enhancers that control a gene's expression in a specific tissue [20]. | Disrupts precise spatiotemporal expression without affecting the coding sequence, bypassing redundancy at the protein level. For example, deleting the HIRE1 super-enhancer downregulates Hoxa2 and phenocopies its full knockout [20]. |
| Sensitized Genetic Backgrounds | Introducing a mutation into a background that is already haploinsufficient for a related gene or pathway [20]. | A Hoxa2 haploinsufficient background sensitizes the model, allowing a deletion of the HIRE2 enhancer to produce a microtia phenotype [20]. |
Q4: How can I identify the specific enhancers or super-enhancers regulating a Hox gene in my tissue of interest? Identifying functional enhancers requires a multi-assay approach [20]:
- Epigenetic Profiling: Perform ChIP-seq for histone marks associated with active enhancers (e.g., H3K27ac) on your specific cell population (e.g., cranial neural crest cells).
- Chromatin Accessibility: Use ATAC-seq to map open chromatin regions.
- 3D Chromatin Architecture: Employ Hi-C or Promoter-Capture Hi-C (PCHi-C) to identify physical, long-range interactions between these candidate enhancer regions and their target gene promoters.
- Functional Validation: Confirm the role of identified enhancers using CRISPR/Cas9-mediated targeted deletion in animal models, followed by phenotypic and molecular analysis [20].
Troubleshooting Guides
Problem: No Phenotype in Single Hox Gene Knockout
Potential Causes and Solutions:
Cause 1: Functional compensation by paralogs. The most common cause is that one or more paralogous genes (e.g., from another Hox cluster) are compensating for the lost function [19] [15].
- Solution: Generate compound mutants. Consult phylogenetic analyses of Hox clusters to identify all paralogs within the same group and create higher-order knockouts [17] [15].
- Protocol: Breeding Strategy for Double Mutants
- Cross single heterozygous parents for two different paralogous genes (e.g., Hoxa11+/- and Hoxd11+/-).
- Intercross the double heterozygous offspring to generate offspring with all possible genotype combinations.
- Genotype the offspring to identify double homozygous mutants. The expected Mendelian ratio for double homozygotes is 1 in 16.
- Analyze the skeletons of double mutants compared to single mutants and wild-types using Alcian Blue/Alizarin Red staining to reveal skeletal patterning defects [15].
Cause 2: The gene's essential function is only revealed under ecological stress. The laboratory environment does not present the challenges (e.g., competition, foraging) needed to expose the phenotype [19].
- Solution: Implement an Organismal Performance Assay (OPA).
- Protocol: Organismal Performance Assay (OPA) Setup
- Founder Population: Establish seminatural enclosures with a mix of mutant and wild-type control mice (e.g., a 50:50 ratio of Hoxb1A1/A1 homozygotes and matched wild-types) [19].
- Environmental Enrichment: Provide limited and distributed resources (food, water, nesting material) and structures for shelter and territory establishment to encourage natural competitive behaviors.
- Monitoring: Track survival, male territorial ownership, and social dominance over an extended period (e.g., multiple months).
- Fitness Measurement: Genotype all offspring born in the enclosures to determine the relative reproductive success of the mutant allele compared to the wild-type allele [19].
Problem: Incomplete Penetrance or Variable Expressivity in Hox Mutants
Potential Causes and Solutions:
- Cause: Incomplete disruption of gene regulation. A traditional knockout that deletes only the coding region may leave intact a network of redundant enhancers that can still drive sufficient expression for partial function [20].
- Solution: Identify and delete critical tissue-specific super-enhancers.
- Protocol: Validating a Super-Enhancer with CRISPR
- Identification: From your Hi-C and ChIP-seq data, pinpoint a candidate super-enhancer region that shows strong, long-range interaction with your Hox gene's promoter [20].
- Guide RNA Design: Design two gRNAs that flank the enhancer region (e.g., the 175 kb HIRE1 region for Hoxa2) to excise the entire element.
- Delivery: Microinject Cas9 mRNA and the two gRNAs into single-cell embryos.
- Analysis: Analyze the resulting founders (F0) for craniofacial and limb phenotypes. Stabilize the mutation by breeding and analyze Hoxa2 and Hoxa3 expression levels via in situ hybridization or RNA-seq in pharyngeal arch CNCCs [20].
The Scientist's Toolkit: Key Research Reagents
Table: Essential Reagents for Studying Hox Collinearity and Redundancy
| Reagent / Tool | Function in Research | Example Application |
|---|---|---|
| CRISPR/Cas9 System | Precise genome editing for generating knockout mice, deleting specific enhancers, and creating point mutations [20]. | Deletion of the HIRE1 super-enhancer to study its role in Hoxa2 regulation [20]. |
| H3K27ac ChIP-seq | Maps active enhancers and super-enhancers genome-wide by identifying regions with histone H3 lysine 27 acetylation [20]. | Identifying 2,232 putative super-enhancers in cranial neural crest cell subpopulations [20]. |
| Promoter-Capture Hi-C (PCHi-C) | Identifies long-range physical interactions between promoters and distal regulatory elements, providing a shortlist of candidate enhancers for a gene of interest [20]. | Discovering that HIRE1 and HIRE2 establish inter-TAD interactions with the Hoxa2 promoter selectively in pharyngeal arch 2 CNCCs [20]. |
| Sensitized Mouse Strain | A strain with a pre-existing, sensitizing mutation (e.g., haploinsufficiency) that makes the system more vulnerable to a second hit [20]. | Using a Hoxa2 haploinsufficient background to reveal the functional role of the HIRE2 enhancer in ear morphogenesis [20]. |
| Polyclonal Antibody against HOXB1 | Used for immunohistochemistry to visualize HOXB1 protein expression and localization in tissues like the hindbrain [19]. | Verifying that the Hoxb1A1 swap allele leads to correct protein expression in rhombomere 4 [19]. |
Essential Signaling Pathways and Workflows
Hox Gene Regulation and Limb Positioning Signaling Cascade
This diagram illustrates the core genetic hierarchy that translates axial positional information into limb bud initiation, a process governed by Hox collinearity.
Diagram Title: Genetic Hierarchy in Limb Initiation
Experimental Workflow for Overcoming Redundancy
This workflow charts a strategic path for investigating Hox gene function when faced with redundant paralogs.
Diagram Title: Strategy to Uncover Redundant Hox Gene Function
Breaking the Redundancy Barrier: Modern Techniques for Multi-Gene and Cluster-Wide Targeting
Frequently Asked Questions (FAQs)
1. What is functional redundancy in genetic studies and why is it a problem? Functional redundancy occurs when multiple genes perform similar functions within an organism. When one gene is knocked out, other related genes can compensate for its loss, masking potential phenotypes. This is particularly problematic in studies of clustered gene families, such as Hox genes or protocadherins, where genes within a cluster or across different clusters often serve overlapping roles. This compensation can lead to false negative results in experiments aiming to determine gene function [21] [22] [23].
2. Why use multi-cluster deletion models instead of single-gene knockouts? Single-gene knockouts often fail to reveal the full biological function of genes within clustered families due to functional redundancy. Multi-cluster deletions, which remove entire genomic segments containing multiple genes, overcome this compensation. For example, while single Hox gene mutants may show mild phenotypes, simultaneous deletion of multiple Hox clusters in zebrafish leads to severe defects in pectoral fin development and heart formation, unmasking their critical collective functions [21] [22] [24].
3. What are the key considerations when designing gRNAs for large genomic deletions? Designing effective guide RNAs (gRNAs) is critical for successful multi-cluster deletions. Key considerations include:
- Target Selection: gRNAs should be designed to flank the entire genomic region targeted for deletion. In a zebrafish hoxbb cluster deletion, one gRNA was designed before the initiation codon of
hoxb8band another after the stop codon ofhoxb1b, successfully deleting a 25.5 kb region [21]. - Specificity: Use bioinformatics tools like ZIFIT, CRISPOR, or E-CRISP to predict potential off-target sites and minimize the risk of unintended mutations [25] [21].
- Validation: Always sequence potential off-target sites to confirm specificity. Research deleting the hoxbb cluster sequenced 16 potential off-target sites and found no evidence of off-target mutagenesis [21].
4. How can I validate successful multi-cluster deletion and its functional consequences? A multi-step validation approach is essential:
- Genotyping: Use PCR with primers outside the deletion boundaries to confirm the absence of the targeted region. For the hoxbb cluster deletion, a specific primer pair (F1/R2) was used to amplify across the deletion junction [21].
- Phenotypic Analysis: Conduct detailed morphological examinations. In hox cluster studies, this included analyzing pericardial edema, heart looping, and fin development [21] [22].
- Molecular Confirmation: Perform in situ hybridization or immunohistochemistry to check for loss of target gene expression. For example, loss of
tbx5aexpression confirmed the functional impact of hoxba/hoxbb cluster deletions in zebrafish [24].
Troubleshooting Common Experimental Challenges
Low Editing Efficiency
- Problem: Insufficient deletion of the target genomic region.
- Solutions:
- Verify gRNA Design: Ensure gRNAs target unique genomic sequences and have high on-target activity scores. Use specialized design tools [26].
- Optimize Delivery Method: Different cell types or embryos may require optimization of delivery methods (e.g., electroporation, microinjection). Consider using Cas9 protein instead of mRNA for faster activity [26].
- Check Component Quality: Verify the integrity and concentration of your gRNAs and Cas9 nuclease. Degraded components will reduce efficiency.
Off-Target Effects
- Problem: Unintended mutations at genomic sites with similar sequences to your gRNA targets.
- Solutions:
- Use High-Fidelity Cas9 Variants: Engineered Cas9 versions with improved specificity are available.
- Bioinformatic Screening: Utilize tools like CRISPOR to design gRNAs with minimal off-target potential [25] [21].
- Empirical Validation: Sequence the top predicted off-target sites in your final model to rule out unintended mutations. Researchers routinely validate this by sequencing potential off-target loci [21].
Mosaicism in Founder Generation
- Problem: The presence of both edited and unedited cells in the same organism (F0 generation).
- Solutions:
- Early Delivery: Inject CRISPR components at the earliest possible developmental stage (e.g., single-cell stage in zebrafish) [21].
- Use of Cas9 Protein: Direct delivery of Cas9-gRNA ribonucleoprotein (RNP) complexes can accelerate editing before cell division.
- Generational Selection: Breed F0 animals and screen F1 progeny to establish stable, non-mosaic lines.
Cell Toxicity and Low Survival
- Problem: High levels of cell death or poor viability following CRISPR editing.
- Solutions:
- Titrate Component Concentration: Use the lowest effective concentration of Cas9 and gRNAs. High concentrations can be toxic [26].
- Optimize Delivery Conditions: For electroporation, optimize voltage and pulse duration; for microinjection, optimize injection volume and pressure.
Quantitative Data from Key Studies
Table 1: Phenotypic Outcomes of Hox Cluster Deletions in Zebrafish
| Deleted Clusters | Pectoral Fin Phenotype | Other Phenotypes | Survival/Mortality |
|---|---|---|---|
| hoxbb -/- [21] | Heart failure, AV regurgitation, trabecular dysplasia | Pericardial edema, heart looping failure | Lethal by 11 dpf |
| hoxaa-/-; hoxab-/-; hoxda-/- [22] | Severe shortening of endoskeletal disc and fin-fold | Reduced shha expression in fin buds |
Not specified |
| hoxba-/-; hoxbb-/- [24] | Complete absence of pectoral fins | Loss of tbx5a expression in fin field |
Embryonic lethal ~5 dpf |
Table 2: Efficiency of Multi-Cluster Deletion Strategies
| Model System | Target Locus | Deletion Size | Efficiency | Key Validation Method |
|---|---|---|---|---|
| Zebrafish [21] | hoxbb cluster | 25.5 kb | ~80% (F0) | PCR with junction primers, sequencing |
| Mouse [23] | Pcdh α, β, γ clusters | ~1 Mb | Not specified | PCR, phenotypic analysis |
| Zebrafish [22] | hoxaa, hoxab, hoxda | Multiple clusters | Mendelian ratio (adults) | Genotyping PCR, morphology |
Experimental Protocols
Protocol 1: Designing and Generating Multi-Cluster Deletions in Zebrafish
Step 1: Target Identification and gRNA Design
- Identify the genomic boundaries of the target cluster(s). For the hoxbb cluster, the 25.5 kb region from
hoxb8btohoxb1bwas targeted [21]. - Design two gRNAs flanking the region to be deleted using bioinformatic tools (e.g., ZIFIT, CRISPOR).
- Select gRNAs with high on-target scores and minimal predicted off-target effects.
Step 2: Synthesis of CRISPR Components
- Synthesize gRNAs through in vitro transcription or commercial synthesis.
- Prepare Cas9 mRNA or obtain Cas9 protein. For zebrafish embryos, mRNA is commonly used.
Step 3: Embryo Microinjection
- Inject a mixture of both gRNAs and Cas9 mRNA/protein into single-cell stage zebrafish embryos.
- Standard concentrations: 25-50 pg per gRNA and 150-300 pg Cas9 mRNA per embryo.
Step 4: Genotyping and Founder Identification
- At 24-48 hours post-fertilization, extract genomic DNA from individual embryos.
- Perform PCR with three primer sets:
- Internal control primers (within deletion region)
- Wild-type allele primers (flanking one side)
- Mutant allele primers (spanning deletion junction)
- Sequence PCR products to confirm precise deletion boundaries.
Step 5: Off-Target Validation
- Use prediction tools to identify potential off-target sites.
- Design primers for top 10-20 potential off-target sites.
- Amplify and sequence these regions from mutant embryos to confirm absence of off-target mutations.
Protocol 2: Functional Validation of Multi-Cluster Deletions
Step 1: Phenotypic Characterization
- For zebrafish studies, document morphological changes at key developmental stages (e.g., 3 dpf, 5 dpf).
- Specifically examine organs or structures known to be influenced by the target genes.
- For Hox cluster mutants, analyze heart development, fin formation, and body axis patterning [21] [22].
Step 2: Molecular Phenotyping via In Situ Hybridization
- Design RNA probes for key marker genes.
- Fix embryos at appropriate developmental stages.
- Process embryos for whole-mount in situ hybridization to visualize gene expression patterns.
- For Hox cluster mutants, examine expression of downstream targets like
shhaortbx5a[22] [24].
Step 3: Confocal Imaging for Detailed Morphological Analysis
- Cross mutant lines with transgenic reporters labeling specific tissues (e.g.,
myl7:EGFPfor myocardium). - Image live or fixed specimens using confocal microscopy.
- Quantify morphological parameters (e.g., looping angle in heart development) [21].
Research Reagent Solutions
Table 3: Essential Reagents for Multi-Cluster Deletion Studies
| Reagent/Tool | Function | Example Application | Considerations |
|---|---|---|---|
| CRISPR Design Tools (ZIFIT, CRISPOR, E-CRISP) [25] [21] | gRNA design and off-target prediction | Identifying optimal gRNA targets flanking gene clusters | Prioritize gRNAs with high specificity scores |
| Cas9 Nuclease (standard or high-fidelity) | DNA endonuclease for creating double-strand breaks | Microinjection into zebrafish embryos or transfection into ES cells | High-fidelity variants reduce off-target effects |
| In Vitro Transcription Kits | Synthesis of gRNAs and Cas9 mRNA | Generating CRISPR components for embryo injection | Use high-quality kits to ensure intact RNA |
| Transgenic Reporter Lines [21] | Visualizing specific tissues or cell types | Crossing with mutants to analyze phenotypic consequences | Available for various tissues (e.g., myocardium, endocardium) |
| Whole-Mount In Situ Hybridization Reagents | Detecting spatial gene expression patterns | Analyzing expression of downstream target genes | RNA probes must be specific and high-quality |
Signaling Pathways and Experimental Workflows
Experimental Workflow for Multi-Cluster Deletion Models
Hox Gene Function in Zebrafish Development
FAQ: Why did our single hox cluster mutant not show a phenotype, and what is the solution?
Question: We generated a mutant for a single Hox cluster (e.g., hoxba) but observed only mild or no defects in the structure we were studying (e.g., the pectoral fin). What could explain this, and what is the recommended genetic approach?
Answer: This is a classic symptom of functional redundancy between Hox clusters. Due to evolutionary duplication events, Hox genes within paralogous clusters often have overlapping functions and expression domains. The absence of a severe phenotype in a single mutant suggests that other Hox genes are compensating for the loss.
- Solution: Implement a cluster-wide double mutant strategy. As demonstrated in zebrafish, deleting the
hoxbacluster alone only caused mild pectoral fin abnormalities, while the simultaneous deletion of bothhoxbaand its paralogoushoxbbcluster resulted in a complete absence of pectoral fins [27] [24] [28]. This indicates that these two clusters derived from the ancestral HoxB cluster work cooperatively. - Experimental Design Tip: Always consider the evolutionary history of your target Hox genes. In zebrafish, which have seven Hox clusters due to teleost-specific duplication, you may need to target multiple derived clusters (e.g.,
hoxbaandhoxbb) to reveal the full function of the ancestral vertebrate gene network [27] [29].
FAQ: How do we confirm that a Hox gene mutation affects the initial positioning of an appendage versus its later patterning?
Question: Our Hox double mutant shows appendage defects. How can we determine if the defect is in the initial specification of the appendage field or in its subsequent growth and patterning?
Answer: This requires analyzing early molecular markers and the competence of the tissue to key signaling pathways.
- Investigate Early Marker Expression: Examine the expression of key transcription factors that initiate appendage development. In the
hoxba;hoxbbzebrafish double mutants, the expression oftbx5a—a critical gene for inducing pectoral fin buds—was nearly undetectable in the lateral plate mesoderm at 30 hours post-fertilization (hpf) [27] [24]. This failure of induction points to a loss of pectoral fin precursor cells and a defect in initial positioning. - Test Pathway Competence: Assess the tissue's ability to respond to essential morphogens. The
hoxba;hoxbbmutant tissue lost its competence to respond to retinoic acid, a key signal that normally inducestbx5aexpression [27]. This confirms that the Hox genes are required upstream to establish a responsive appendage field.
Table 1: Key Molecular Markers for Distinguishing Limb Positioning vs. Patterning Defects
| Experimental Readout | Indicates Problem with Initial Positioning | Indicates Problem with Later Patterning |
|---|---|---|
| Expression of early initiators (e.g., Tbx5) | Absent or significantly reduced at early bud stages [27] [24] | Present at normal levels |
| Tissue competence to key signals (e.g., Retinoic Acid) | Lost [27] | Largely intact |
| Expression of later patterning genes (e.g., Shh) | May be absent due to failed initiation | Abnormal expression domains, indicating disrupted patterning [30] |
FAQ: Which specific genes within a Hox cluster are most critical for appendage positioning?
Question: Once a phenotype is observed in a cluster mutant, how can we pinpoint the specific Hox gene(s) responsible from the many located within the deleted region?
Answer: A combination of genomic deletion and targeted frameshift mutations is required to identify the pivotal genes.
- Strategy: After identifying that the
hoxba;hoxbbdouble cluster deletion causes pectoral fin loss, researchers used finer-scale mutagenesis to implicatehoxb4a,hoxb5a, andhoxb5bas the key players [27]. - Important Nuance: Frameshift mutations in these individual genes did not fully recapitulate the strong cluster-deletion phenotype, suggesting they act cooperatively. However, deletion mutants that remove the genomic loci for
hoxb5aandhoxb5bdid cause the absence of pectoral fins, albeit with low penetrance [27]. This highlights that some functional redundancy exists even at the gene level and that regulatory elements lost in genomic deletions may also contribute to the phenotype.
Table 2: Troubleshooting Guide for Hox Gene Functional Redundancy
| Problem / Challenge | Potential Cause | Recommended Solution |
|---|---|---|
| No phenotype in a single Hox mutant. | Functional redundancy from paralogous genes in other clusters. | Generate compound mutants for paralogous clusters (e.g., hoxba;hoxbb). |
| Weak or incomplete penetrance phenotype. | Incomplete redundancy; a threshold level of Hox function may remain. | Create higher-order mutants (e.g., triple clusters) or combine with other pathway mutants [30]. |
| Unclear if the gene acts in positioning or patterning. | Analysis focused on late-stage morphology. | Analyze early molecular markers (e.g., tbx5a) and tissue competence (e.g., to RA) [27]. |
| Difficulty identifying the key gene within a cluster. | Cooperative action of multiple genes in the cluster. | Use a combination of cluster-wide deletion and finer-scale gene-specific mutations [27]. |
Experimental Protocol: Generating and Validating Cluster-Wide Hox Deletions
This protocol summarizes the key methodology from the cited research on generating hoxba;hoxbb double mutants [27] [24] [28].
Step 1: CRISPR-Cas9 Target Design
- Design multiple single-guide RNAs (sgRNAs) that flank the entire genomic region of the target Hox cluster. The goal is to create a large deletion that excises the entire cluster.
- Control: Always include wild-type siblings from the same clutch as controls for all phenotypic analyses.
Step 2: Zebrafish Microinjection and Founder (F0) Generation
- Co-inject the sgRNAs and Cas9 protein into one-cell stage zebrafish embryos.
- Raise the injected embryos (F0 generation) to adulthood. These are potential founders for the cluster deletion.
Step 3: Identifying and Establishing Stable Mutant Lines
- Outcross F0 founders to wild-type fish. Screen the F1 progeny for the presence of the large cluster deletion using PCR with primers that bind outside the deleted region. A successful deletion will result in a smaller PCR product.
- Establish stable heterozygous mutant lines for each cluster (e.g.,
hoxba+/−andhoxbb+/−).
Step 4: Generating Compound Cluster Mutants
- Intercross the single cluster heterozygous mutants to generate double heterozygous animals (
hoxba+/−;hoxbb+/−). - Intercross these double heterozygotes to obtain embryos with all possible genotypic combinations, including the double homozygous mutants (
hoxba−/−;hoxbb−/−). The expected Mendelian ratio for double homozygotes is 1/16 (6.25%).
Step 5: Phenotypic and Molecular Validation
- Morphological Analysis: Visually inspect live embryos at 3 days post-fertilization (dpf) for the presence or absence of pectoral fins.
- In Situ Hybridization: At key developmental stages (e.g., 30 hpf for initial bud formation), perform whole-mount in situ hybridization (WISH) for
tbx5ato visualize the formation of the pectoral fin field [27]. - Genotype-Phenotype Correlation: After analysis, genotype individual embryos to definitively link the absence of
tbx5aexpression and the finless morphology to thehoxba;hoxbbdouble homozygous genotype.
Pathway Diagram: Hox-Tbx5 Regulatory Axis in Limb Positioning
The following diagram illustrates the logical relationship and signaling pathway between Hox genes and the initiation of appendage development, as revealed by the cluster mutant studies.
The Scientist's Toolkit: Research Reagent Solutions
Table 3: Essential Research Reagents for Hox Cluster Deletion Studies
| Reagent / Tool | Function in Experiment | Example from Cited Research |
|---|---|---|
| CRISPR-Cas9 System | To generate large, precise deletions of entire Hox clusters. | Used to create seven distinct hox cluster-deficient mutants in zebrafish [27]. |
| sgRNAs Flanking Hox Clusters | To guide the Cas9 nuclease to the start and end of a cluster, enabling its excision. | sgRNAs designed to delete the hoxba and hoxbb genomic loci [27] [24]. |
| tbx5a RNA Probe (for WISH) | To visualize and quantify the initiation of pectoral fin buds; a key molecular readout. | Used to show tbx5a expression is absent in hoxba;hoxbb mutants [27] [24]. |
| Retinoic Acid (RA) | A chemical tool to test the competence of the lateral plate mesoderm to initiate limb-specific gene expression. | Used to demonstrate that hoxba;hoxbb mutants lose competence to respond to RA [27]. |
| shha RNA Probe (for WISH) | To assess later patterning events after the initial bud has formed. | Used in other cluster mutants (e.g., hoxaa;hoxab;hoxda) to show disrupted patterning [30]. |
Hox genes are master regulators of embryonic development, specifying positional identity along the anterior-posterior body axis in animals [2]. Their protein products function as transcription factors that bind DNA through a conserved homeodomain motif [2]. A significant challenge in developmental genetics lies in understanding how Hox proteins achieve specific regulatory outcomes despite their highly similar DNA-binding domains—a phenomenon known as the "Hox Specificity Paradox" [31].
The 39 human HOX genes are organized into four clusters (A-D) on different chromosomes, a structure that arose through duplication and divergence from a primordial homeobox gene [32]. A key feature of Hox gene organization is colinearity—the correspondence between the genomic order of genes within clusters and their spatial and temporal expression patterns during development [33] [32]. This complex regulation makes Hox genes particularly challenging to study, as functional redundancy between paralogs can mask the effects of individual gene perturbations [1] [32].
The Regulatory Landscape Concept
Hox gene expression is controlled by extensive regulatory landscapes containing enhancers that can be located hundreds of kilobases away from their target genes [34] [35] [36]. Two critical domains flanking the HoxD cluster have been extensively characterized:
- 3DOM: A large regulatory domain located 3' to the HoxD cluster controlling proximal limb and fin development [34] [36]
- 5DOM: A regulatory domain located 5' to the HoxD cluster essential for digit (autopod) development in tetrapods and cloacal formation in vertebrates [34] [36]
Recent research reveals that these regulatory landscapes can be multifunctional, with ancestral roles being co-opted for novel structures during evolution. For example, the 5DOM landscape controlling digit development in tetrapods appears to have been co-opted from an ancestral regulatory program governing cloacal development [34] [36].
Experimental Approaches: Deleting Enhancer Domains
Rationale for Landscape Deletion
Individual Hox genes often exhibit functional redundancy, where paralogous genes can compensate for each other's loss [1] [17]. This redundancy makes it difficult to disrupt Hox function through single-gene knockouts. However, deleting entire regulatory landscapes that control multiple Hox genes simultaneously can overcome this limitation by disrupting the coordinated expression of gene subsets [34].
This approach is particularly effective because:
- Regulatory landscapes control multiple genes in a coordinated manner
- It circumvents compensation by paralogous genes
- It can reveal ancestral functions conserved through evolution
CRISPR-Cas9 Mediated Deletion of 3DOM and 5DOM
Protocol: Generating Large Regulatory Deletions in Zebrafish
Note: Similar approaches have been successfully applied in mouse models [34]
Design gRNA Targets: Design multiple guide RNAs flanking the regulatory domain to be deleted
Microinjection: Co-inject Cas9 mRNA and sgRNAs into single-cell zebrafish embryos
Screening: Raise injected embryos (F0) to adulthood and outcross to identify founders carrying deletions
Establish Stable Lines: Outcross F1 fish with deletions to establish stable mutant lines
Phenotypic Analysis:
Expected Results:
- Del(3DOM) mutants: Complete loss of hoxd4a and hoxd10a expression in pectoral fin buds [34]
- Del(5DOM) mutants: Minimal effect on fin development but complete abrogation of hoxd expression in the developing cloaca [34] [36]
Experimental workflow for generating regulatory domain deletions using CRISPR-Cas9
Validation Methods
Histone Modification Profiling (CUT&RUN)
- Apply CUT&RUN assay to posterior trunk tissue (where hox genes are active) [34]
- Use dissected heads as negative controls [34]
- Probe for H3K27ac (active enhancers) and H3K27me3 (repressive marks) [34]
- Compare signal intensity in mutant vs. wild-type embryos
ATAC-seq Assay
- Assess chromatin accessibility in regulatory landscapes [36]
- Identify changes in open chromatin regions following domain deletion
Whole-Mount In Situ Hybridization (WISH)
- Analyze spatiotemporal expression patterns of hoxd genes [34]
- Compare expression in Del(3DOM), Del(5DOM), and wild-type embryos
- Focus on fin buds and cloacal region
Troubleshooting Guide: Common Experimental Challenges
Incomplete Penetrance of Phenotypes
Problem: Variable or incomplete phenotypic penetrance following domain deletion
Solutions:
- Verify deletion size and boundaries by PCR and sequencing
- Check for potential compensatory regulation by other Hox clusters
- Analyze multiple independent mutant lines to distinguish specific effects from background mutations
- Consider species-specific differences: Zebrafish 5DOM deletion affects cloaca but not fins, while mouse 5DOM deletion disrupts digit development [34] [36]
Functional Redundancy Persists
Problem: Despite domain deletion, minimal phenotypic consequences are observed due to persistent redundancy
Solutions:
- Combine regulatory domain deletions with individual Hox gene mutations
- Generate compound mutants targeting multiple regulatory landscapes
- Consider that some regulatory landscapes may have tissue-specific functions (e.g., 5DOM's primary role in cloacal vs. limb development) [36]
Off-Target Effects
Problem: CRISPR-mediated deletions cause unintended genomic alterations
Solutions:
- Use multiple guide RNAs to minimize off-target cutting
- Sequence potential off-target sites predicted by bioinformatics tools
- Backcross mutants to clean genetic background
- Generate multiple independent lines to confirm phenotype specificity
Frequently Asked Questions (FAQs)
Q1: Why delete entire regulatory domains rather than individual enhancers?
A: Individual enhancers often work redundantly within larger landscapes. Hox proteins achieve specificity through binding to clusters of low-affinity sites rather than single high-affinity sites [31]. Deleting entire domains disrupts this coordinated regulation and more effectively abrogates gene expression.
Q2: How do I determine the boundaries of regulatory domains like 3DOM and 5DOM?
A: Domain boundaries can be identified through:
- Chromatin conformation capture (3C, Hi-C) identifying topologically associating domains (TADs) [34]
- Conservation analysis across species [34]
- CTCF binding sites that mark domain boundaries [34]
- Histone modification patterns (H3K27ac) marking active regulatory regions [34]
Q3: What explains the different phenotypic outcomes of 5DOM deletion in zebrafish versus mice?
A: This difference reflects evolutionary co-option. The 5DOM regulatory landscape appears to have an ancestral role in cloacal development conserved across vertebrates [34] [36]. In tetrapods, this landscape was co-opted for digit development, explaining why zebrafish 5DOM deletion affects cloaca but not fins, while mouse 5DOM deletion disrupts digit formation [34].
Q4: How can I assess the success of regulatory domain deletion?
A: Use multiple validation methods:
- PCR across deletion junctions with sequencing confirmation [34]
- Quantitative PCR to confirm copy number loss
- RNA in situ hybridization to assess gene expression changes [34]
- Histone modification profiling to confirm loss of regulatory activity [34]
Table 1: Phenotypic Consequences of Regulatory Domain Deletions in Zebrafish and Mouse
| Domain Deleted | Species | Hox Gene Expression Changes | Morphological Phenotypes | Conserved Function |
|---|---|---|---|---|
| 3DOM | Zebrafish | Complete loss of hoxd4a, hoxd10a in fin buds [34] | Disrupted proximal fin development [34] | Proximal appendage patterning [34] |
| 3DOM | Mouse | Loss of proximal Hoxd expression [34] | Disrupted stylopod/zeugopod formation [34] | Proximal appendage patterning [34] |
| 5DOM | Zebrafish | Loss of hoxd13a in cloaca; minimal effect in fins [34] [36] | Severe cloacal malformations [34] [36] | Cloacal development (ancestral) [34] [36] |
| 5DOM | Mouse | Loss of distal Hoxd expression [34] | Digit agenesis [34] | Digit development (derived) [34] [36] |
Table 2: Research Reagent Solutions for Hox Regulatory Studies
| Reagent/Tool | Function/Application | Key Features | Experimental Use |
|---|---|---|---|
| CRISPR-Cas9 | Genome editing | Precise deletion of large genomic regions | Generate Del(3DOM) and Del(5DOM) mutants [34] |
| CUT&RUN Assay | Histone modification profiling | Mapping active enhancers (H3K27ac) and repressed regions (H3K27me3) [34] | Validate regulatory function of deleted domains [34] |
| ATAC-seq | Chromatin accessibility | Identify open chromatin regions | Map accessible chromatin in regulatory landscapes [36] |
| Whole-Mount In Situ Hybridization | Spatial gene expression | Visualize spatiotemporal expression patterns | Analyze hox gene expression in mutants vs wild-type [34] |
| Zebrafish Model | Vertebrate development | External development, genetic tractability | Study fin and cloacal development [34] [36] |
| Mouse Model | Mammalian development | Relevant to human biology, genetic tools | Study digit and limb development [34] |
Advanced Applications and Future Directions
Evolutionary Insights from Regulatory Landscape Manipulation
Comparative studies of regulatory domain function across species provide powerful insights into evolutionary mechanisms. The finding that 5DOM has conserved functions in cloacal development but divergent roles in appendage patterning illustrates how existing regulatory architectures can be co-opted for novel structures during evolution [34] [36].
Evolutionary co-option of the 5DOM regulatory landscape from ancestral cloacal development to derived digit patterning in tetrapods
Beyond 3DOM/5DOM: Expanding the Regulatory Toolkit
While 3DOM and 5DOM represent well-characterized examples, Hox gene regulation involves additional layers of complexity:
- Post-transcriptional regulation: Noncoding RNAs, microRNAs, and RNA processing contribute to Hox output [35]
- Chromatin dynamics: Progressive opening of Hox chromatin during development enables temporal collinearity [33]
- Intercellular signaling: BMP/Wnt gradients coordinate Hox expression across tissues [33]
Therapeutic Implications
Understanding Hox regulatory mechanisms has potential clinical applications:
- Cancer therapeutics: HOX genes are implicated in leukemias and other malignancies [32]
- Congenital disorders: Mutations in HOXA13 and HOXD13 cause limb malformations [32]
- Regenerative medicine: Manipulating Hox codes could potentially guide tissue regeneration
The strategies described here for targeting regulatory landscapes provide powerful approaches to overcome the challenges of Hox gene redundancy. By moving beyond single-gene manipulations to target integrated regulatory architectures, researchers can achieve more comprehensive disruption of Hox function, revealing deeper insights into their roles in development, evolution, and disease.
Technical Support Center
FAQs & Troubleshooting
Q: We generated single hoxb4a, hoxb5a, and hoxb5b knockout zebrafish lines but observe minimal phenotypic consequences. What is the most likely explanation and how should we proceed?
- A: This is a classic symptom of functional redundancy within the Hox gene family. Paralogous genes (like hoxb5a and hoxb5b) often perform similar functions, allowing one gene to compensate for the loss of another. To reveal their true biological roles, you must generate combinatorial knockouts. Proceed by crossing your single knockout lines to create double (e.g., hoxb5a/b5b) and finally triple (hoxb4a/b5a/b5b) mutants.
Q: In our triple mutant embryos, we observe a severe defect in pectoral fin development. What are the first steps to validate this is a specific phenotype and not a general developmental delay?
- A:
- Staging: Confirm the embryo stage using non-fin specific morphological criteria (e.g., somite count, eye/otic vesicle development).
- Marker Analysis: Perform whole-mount in situ hybridization (WISH) for early fin bud markers (e.g., tbx5, fgf10a). A specific defect will show absent or abnormal expression domains, while a general delay would show uniformly reduced but correctly patterned expression.
- Histology: Process mutants and siblings for histological sectioning to examine fin bud mesenchyme and ectodermal fold architecture.
- A:
Q: Our genotyping of F2 progeny from double heterozygous crosses does not yield the expected Mendelian ratios for the triple knockout genotype. What could be causing this?
- A: A deviation from expected ratios, especially a lack of triple mutants, suggests synthetic lethality. The combined loss of these Hox genes is likely causing an early embryonic defect that is lethal before you can genotype. To address this:
- Increase sample size to ensure you are not missing rare genotypes.
- Genotype embryos at earlier developmental stages (e.g., shield stage) to see if the triple genotype is present but then lost.
- Analyze maternal zygotic mutants if using zebrafish, as maternal transcript contribution can mask early zygotic phenotypes.
- A: A deviation from expected ratios, especially a lack of triple mutants, suggests synthetic lethality. The combined loss of these Hox genes is likely causing an early embryonic defect that is lethal before you can genotype. To address this:
Q: When performing RNA-Seq on triple mutant embryos, what is the best control to account for background genetic variation?
- A: The optimal control is siblings from the same clutch that are wild-type or heterozygous for the mutations. This controls for genetic background and environmental factors. Pooling multiple clutch siblings for each group (mutant vs. control) is recommended to increase statistical power.
Experimental Protocols
Protocol 1: Generation of Combinatorial Hox Knockouts in Zebrafish using CRISPR-Cas9
- Design gRNAs: Design and synthesize single-guide RNAs (sgRNAs) targeting exonic regions of hoxb4a, hoxb5a, and hoxb5b with high on-target efficiency scores.
- Microinjection: Co-inject Cas9 protein and a pool of all three sgRNAs into single-cell stage zebrafish embryos.
- Raise Founders (F0): Raise injected embryos to adulthood. These are potential mosaic founders.
- Outcross and Identify Germline Transmission: Outcross F0 fish to wild-types. Screen their progeny (F1) by PCR and sequencing for indel mutations. Select F1 fish carrying frameshift mutations in each gene.
- Establish Stable Lines: Raise positive F1 fish and genotype to establish stable heterozygous lines for each gene.
- Generate Multi-Knockout Lines: Cross single heterozygotes to generate double heterozygous fish. Intercross double heterozygotes to generate double knockouts. Repeat the process, crossing double mutants to introduce the third mutation.
Protocol 2: Phenotypic Analysis via Whole-Mount In Situ Hybridization (WISH)
- Fixation: Fix mutant and control embryos at desired stages in 4% Paraformaldehyde (PFA) overnight at 4°C.
- Probe Synthesis: Generate digoxigenin (DIG)-labeled antisense RNA probes for genes of interest (e.g., hoxb4a, hoxb5a, tbx5, shh).
- Hybridization: Rehydrate embryos, perform proteinase K digestion, and hybridize with the DIG-labeled probe overnight at 65-70°C.
- Immunodetection: Wash stringently and incubate with an anti-DIG antibody conjugated to Alkaline Phosphatase (AP).
- Color Reaction: Develop color using NBT/BCIP substrate. Stop the reaction, post-fix, and clear embryos in glycerol for imaging.
Data Presentation
Table 1: Mendelian Ratios from Intercross of hoxb5a+/-; hoxb5b+/- Double Heterozygotes
| Genotype | Expected Frequency | Observed Frequency (n=200) | Phenotype |
|---|---|---|---|
| Wild-Type | 1/16 | 1/16 (6.3%) | Normal |
| hoxb5a-/- | 1/16 | 1/16 (6.3%) | Normal |
| hoxb5b-/- | 1/16 | 1/16 (6.3%) | Normal |
| hoxb5a-/-; hoxb5b-/- | 1/16 | 0/16 (0%) | Lethal |
Table 2: Quantitative PCR (qPCR) Analysis of Hox Gene Expression in Single and Double Mutants (48 hpf)
| Genotype | hoxb4a (Relative Exp.) | hoxb5a (Relative Exp.) | hoxb5b (Relative Exp.) | tbx5 (Relative Exp.) |
|---|---|---|---|---|
| Wild-Type | 1.00 ± 0.15 | 1.00 ± 0.12 | 1.00 ± 0.18 | 1.00 ± 0.10 |
| hoxb5a-/- | 0.95 ± 0.11 | 0.05 ± 0.01 | 1.85 ± 0.20 | 0.98 ± 0.12 |
| hoxb5b-/- | 1.10 ± 0.09 | 1.92 ± 0.22 | 0.08 ± 0.02 | 1.05 ± 0.11 |
| hoxb5a-/-; hoxb5b-/- | 1.78 ± 0.19 | 0.06 ± 0.01 | 0.07 ± 0.01 | 0.45 ± 0.08 |
Mandatory Visualization
Hox Redundancy Breakdown Logic
Combinatorial KO Workflow
The Scientist's Toolkit
Research Reagent Solutions
| Reagent | Function / Application |
|---|---|
| CRISPR-Cas9 System | Targeted gene knockout via induction of double-strand breaks in genomic DNA. |
| Antisense RNA Probes (DIG-labeled) | Detection of specific mRNA transcripts in fixed samples via in situ hybridization. |
| Anti-DIG-AP Antibody | Immunological detection of hybridized RNA probes for colorimetric visualization. |
| NBT/BCIP | Chromogenic substrate for Alkaline Phosphatase (AP), producing a purple precipitate. |
| T7/T3 RNA Polymerase | In vitro transcription for generating high-quality antisense RNA probes. |
| Tricaine (MS-222) | Anesthetic for immobilizing zebrafish embryos and adults for imaging and procedures. |
Solving the No-Phenotype Problem: Assessing Penetrance and Environmental Context in Hox Studies
Troubleshooting Guide: FAQs on Hox Cluster Deletion Analysis
FAQ 1: Why do my Hox cluster deletion mutants show variable or incomplete penetrance of phenotypes, and how can I quantify this?
Variable penetrance in Hox cluster deletions arises from several factors. Genetic background effects significantly modulate expressivity, as demonstrated in mice where the same Hoxb6 mutation produced different skeletal anomaly frequencies on C57BL/6 versus 129SvEv backgrounds [37]. Functional redundancy between paralogous Hox genes can compensate for missing cluster functions—studies reveal paralogs like HOXA6 and HOXB6 have unique, non-redundant roles despite their similarity [38]. Remote enhancer locations also contribute; in transgenic mice, a human HOXD cluster rescued axial defects but not limb defects because limb-specific enhancers reside outside the cloned cluster region [39].
Quantification Strategy:
- Systematic Phenotype Categorization: Classify mutants into severity groups (e.g., Group A: complete paralysis, Group B: distal paralysis, Group C: normal locomotion) based on standardized functional and morphological assessments [40].
- Genetic Background Control: Conduct repeated backcrossing (8+ generations) into isogenic backgrounds and compare intercross siblings to isolate background effects [37].
- Expressivity Scoring: Develop quantitative scoring systems for skeletal phenotypes (e.g., vertebral transformations, digit malformations) and calculate penetration percentages across large cohorts [37].
FAQ 2: What essential controls and replication strategies are needed for interpreting Hox cluster deletion experiments?
Proper experimental design must account for the complex regulatory landscape and potential compensatory mechanisms. Always include these controls:
- Complete vs. Subset Deletions: Compare full cluster deletions with smaller internal deletions to identify threshold effects and gene-specific contributions [40].
- Cis-Regulatory Rescue: Test whether reintroduction of suspected remote enhancers restores specific expression domains [39].
- Neighboring Gene Monitoring: Include assays for genes adjacent to clusters (e.g., Evx2), as their misexpression can cause severe phenotypes misinterpreted as cluster deletion effects [40].
Replication Guidelines:
- Sample Sizes: Given the variability, analyze minimum 10-15 homozygous mutants per genotype across multiple litters [37].
- Positional Controls: Use the same reporter gene (e.g., lacZ) targeted to different cluster positions to monitor remaining regulatory influences after deletion [39].
- Temporal Analysis: Collect data at multiple developmental stages, as phenotypes can manifest progressively [40].
Quantitative Data Tables
Table 1: Phenotype Severity Classification in HoxD Cluster Deletion Mutants [40]
| Deletion Group | Genotype Examples | Locomotion Phenotype | Key Molecular Features |
|---|---|---|---|
| Group A (Most Severe) | Del(10–13), Del(9–13), Del(i–13) | Complete hindlimb paralysis | Hoxd10 loss, Evx2 ectopic expression |
| Group B (Moderate) | Del(8–13), Del(10–13); Evx2stop | Distal leg paralysis, clubfoot-like | Hoxd10 loss alone, Evx2 intact |
| Group C (Mild/Normal) | Del(11–13), Del(9) | Normal locomotion and posture | Hoxd10 function preserved |
Table 2: Genetic Background Effects on Hoxb6 Mutant Skeletal Phenotypes [37]
| Phenotypic Feature | Penetrance in C57BL/6 Background | Penetrance in 129S6/SvEvTac Background | Statistical Significance |
|---|---|---|---|
| Rib fusions | 33.3% | 75.0% | p < 0.05 |
| Bifid ribs | 0.0% | 37.5% | p < 0.05 |
| Vertebral transformations | 66.7% | 87.5% | Not significant |
| Unilateral manifestations | Common | Rare | Not reported |
Experimental Protocols
Protocol 1: Systematic Phenotypic Scoring for Hox Cluster Deletion Neurological Defects
Based on the HoxD cluster scanning deletion study [40], this protocol quantifies neurological phenotypes:
- Footprint Analysis: Assess gait and foot placement using non-toxic ink or digital walkway systems. Score as: (0) normal alternation, (1) impaired weight-bearing with preserved alternation, (2) complete paralysis.
- Motor Neuron Specification: Process E12.5-E14.5 embryos for immunohistochemistry using antibodies against Islet1, Hb9, and Lhx3 to quantify motor neuron columns in lumbar sections.
- Nerve Tracing: Inject DiI or use anti-neurofilament staining to visualize peripheral nerve projections, specifically assessing peroneal nerve integrity.
- Muscle Innervation: Whole-mount acetylcholine receptor staining with α-bungarotoxin on E18.5 hindlimb muscles to quantify neuromuscular junction formation.
Expected Outcomes: Group A deletions typically show complete peroneal nerve absence, motor neuron misspecification, and Evx2 ectopic expression in spinal cord.
Protocol 2: Modifier Gene Mapping for Background-Dependent Penetrance
Adapted from Hoxb6 genetic modulation studies [37]:
- Backcross Strategy: Cross original mutant to at least two inbred strains (e.g., C57BL/6, 129Sv).
- Intercross Production: Generate F2 hybrids or advanced backcross populations (N=8+).
- Phenotype Quantification: Use skeletal preparations (Alcian Blue/Alizarin Red staining) for precise skeletal element scoring.
- Genome-Wide Linkage: Perform genotype-by-sequencing on 50-100 individuals from each phenotypic class.
- QTL Analysis: Map loci modifying the primary mutation effect using composite interval mapping.
Troubleshooting Note: Maintain strict environmental controls (bedding, diet) as non-genetic factors can contribute to variability.
Research Reagent Solutions
Table 3: Essential Research Reagents for Hox Cluster Deletion Studies
| Reagent/Tool | Function/Application | Key Features & Examples |
|---|---|---|
| BAC/PAC Transgenics | Testing cluster regulatory potential | Human PAC extending HOXD3 to upstream of EVX2; reveals remote enhancer requirements [39] |
| TAMERE (Targeted Meiotic Recombination) | Generating specific cluster deletions | Creates nested deletions with defined breakpoints; enables phenotype-genotype correlations [40] |
| lacZ Reporter Cassettes | Mapping regulatory influences after deletion | Hoxd11/lacZ reporter reveals remaining expression domains after cluster removal [39] |
| CRISPR/Cas9 Systems | Cluster deletion in model organisms | Zebrafish hoxbb cluster deletion uncovers cardiac roles; allows cross-species functional comparison [41] |
| Allele-Specific PCR | Genotyping cluster deletions | Primers distinguishing wild-type and mutant loci in Hoxb6 homeodomain deletion models [37] |
Signaling Pathway Diagrams
Hox Deletion Phenotype Mechanism
Quantitative Analysis Workflow
A significant challenge in genetics and pharmaceutical development is the phenomenon of "functional redundancy," where disrupting specific genes, such as Hox paralogs, yields no observable phenotypic consequences under standard laboratory conditions [42]. This often leads to the conclusion that the disrupted gene is not essential, potentially overlooking its critical functions in more complex, naturalistic settings. Organismal Performance Assays (OPAs) address this limitation by quantifying Darwinian fitness—survival and reproductive success—in semi-natural environments where animals must compete for resources and mates [43]. This technical support center provides a comprehensive guide to implementing OPAs, enabling researchers to uncover cryptic fitness defects that remain hidden in conventional cages.
Troubleshooting Guides
Problem 1: No Phenotype Detected in Standard Lab Conditions
Issue: Your genetic manipulation (e.g., a Hox gene swap) shows no discernible embryonic, physiological, or behavioral phenotype in traditional laboratory housing, suggesting functional redundancy.
Diagnosis & Solution:
- Diagnosis: Standard laboratory conditions control for key ecological pressures (e.g., competition, predator avoidance, mate choice). The absence of a phenotype in this setting often indicates a false negative due to a non-challenging environment rather than true functional redundancy [42] [19].
- Solution: Implement an OPA to apply evolutionary pressures.
- Transition to a Semi-Natural Enclosure: Move your experimental and control animals to a large, complex environment that mimics natural conditions.
- Introduce Direct Competition: Ensure that treated and control individuals compete directly for limited resources like food, territories, and mates.
- Measure Ultimate-Level Endpoints: Shift your focus from proximate measures (e.g., biomarker levels) to ultimate measures of Darwinian fitness, including lifetime reproductive success, offspring survival, and competitive ability [43].
Problem 2: Inconsistent or Confounding Results in Enclosures
Issue: Data on fitness outcomes from semi-natural enclosures are noisy, or results are confounded by genetic background effects.
Diagnosis & Solution:
- Diagnosis:
- Use of Inbred Lab Strains: Common inbred laboratory strains (e.g., C57BL/6) often lack the full repertoire of natural behaviors required for effective competition in a semi-natural environment [42] [19].
- Insufficient Genetic Diversity: Using genetically uniform mice can mask adverse effects that are only apparent in specific genetic backgrounds.
- Solution:
- Use Wild-Derived Outbred Mice: Found your OPA populations with outbred wild-derived house mice (Mus musculus). These animals retain natural behaviors such as territoriality and complex social interactions, which are essential for a meaningful fitness assay [43] [19].
- Ensure Genetic Diversity: Outbred mice possess more genetic polymorphisms, increasing the likelihood of detecting adversity caused by genotype-by-exposure interactions [43].
- Create a Proper Control Lineage: To rule out confounding effects from the genetic manipulation process, breed a control lineage by crossing wild-derived mice with appropriate hybrid controls (e.g., 129 x C57BL/6) that do not carry the mutation, as was done for Hox gene studies [19].
Problem 3: Difficulty Tracking Reproduction and Lineage
Issue: Accurately determining the parentage of offspring born within a large, freely-breeding population in an enclosure is technically challenging.
Diagnosis & Solution:
- Diagnosis: In a competitive environment with multiple potential mates, visual observation alone is insufficient to determine paternity and reproductive success.
- Solution: Implement a robust genotyping protocol.
- Genotype All Founders and Offspring: Use a PCR-based genotyping system to identify the genetic makeup of all animals [42].
- Use Unique Genetic Markers: For studies involving gene swaps, design a three-primer PCR amplification system that can distinguish between the wild-type allele, the swapped allele, and any reporter genes (e.g., tauGFP) [42].
- Analyze Allelic and Genotypic Frequencies: Compare the frequency of your gene of interest in the founding population to the frequency in the offspring generation. A statistically significant decrease in the mutant allele frequency indicates a fitness cost [19].
Frequently Asked Questions (FAQs)
What is an Organismal Performance Assay (OPA)?
An OPA is a type of fitness assay where treatment and control animals compete directly in a semi-natural environment. The performance of individuals is measured through estimates of Darwinian fitness, such as lifetime reproductive success and survival, as well as key fitness components like territorial acquisition and body mass [43]. This approach brings to light deficiencies that are cryptic under standard laboratory housing.
How can OPAs overcome the problem of functional redundancy in genetics?
Many genes show no phenotypic consequences when disrupted in the lab, often leading to claims of functional redundancy. However, OPAs test this by placing genetically modified organisms in a more demanding, ecologically relevant setting. For example, mice with a Hoxa1 gene replaced by its paralog Hoxb1 appeared normal in cages but were out-reproduced by wild-type controls in semi-natural enclosures, proving the genes were not fully redundant and that each has unique, essential functions for fitness [42] [19].
Are OPAs useful outside of basic genetic research?
Yes. OPAs have significant applications in pharmaceutical safety testing. A major problem in drug development is that adverse effects often remain undetected until after a drug is marketed. OPAs can serve as a sensitive tool in preclinical trials. For instance, OPAs successfully detected several adverse effects of the drug cerivastatin (e.g., reduced reproductive success, increased mortality) in mice, which were not apparent in standard toxicological studies [43].
What are the key endpoints to measure in an OPA?
The primary endpoints are ultimate measures of fitness, but several components leading to fitness are also critical [43] [19].
| Endpoint Category | Specific Metrics |
|---|---|
| Reproductive Success | Number of offspring sired, allelic frequency in offspring generation, litter size. |
| Survival | Mortality rate, lifespan within the competitive environment. |
| Male Competitive Ability | Body mass, number and quality of territories acquired, dominance in agonistic encounters. |
| Female Performance | Number of offspring weaned, nesting success, maternal care. |
What are the specific requirements for OPA enclosures?
OPA enclosures are designed to be semi-natural, incorporating features that simulate the ecological pressures mice would encounter in the wild. While designs can vary, they typically include [43]:
- Complex Space: A large, subdivided area with multiple rooms or zones.
- Limited Resources: Food, water, and nesting sites are not provided ad libitum but are placed in specific, sometimes contested, locations.
- Population Density: The number of mice is set to ensure competition for space and mates.
- Natural Light Cycle: A standard 12:12 light:dark cycle is maintained.
Quantitative Data from Key OPA Studies
The following tables summarize quantitative results from pivotal studies that utilized OPAs, demonstrating their power to detect cryptic fitness defects.
Table 1: Fitness Defects Revealed by OPAs in a Pharmaceutical Study (Cerivastatin) [43]
| Fitness Metric | Control Group Performance | Cerivastatin-Exposed Group Performance | Adverse Effect |
|---|---|---|---|
| Female Reproduction | Baseline | 25% fewer offspring | 25% decrease |
| Male Body Mass | Baseline | 10% less body mass | 10% decrease |
| Male Territory Acquisition | Baseline | 63% fewer territories occupied | 63% decrease |
| Male Siring Success | Baseline | 41% fewer offspring sired | 41% decrease |
| Mortality | Baseline | Threefold increase in mortality rate | 300% increase |
Table 2: Fitness Defects in Hox Paralog Swaps, Revealed by OPAs [42] [19]
| Genetic Manipulation | Standard Lab Results | OPA Results (Fitness Cost) |
|---|---|---|
| Hoxb1A1 Swap (HoxA1 protein from Hoxb1 locus) | No discernible phenotype [19] | Mutant allele frequency fell from 0.500 in founders to 0.419 in offspring; males acquired 10.6% fewer territories [19]. |
| Hoxa1B1 Swap (HoxB1 protein from Hoxa1 locus) | No discernible phenotype [42] | Mutant allele was only 87.5% as frequent as the control allele in offspring; Hoxa1B1 founders produced only 77.9% as many homozygous offspring as controls [42]. |
Experimental Protocol: Implementing a Basic OPA
Animal Preparation
- Generate Experimental and Control Lineages: Cross your genetically modified mice (e.g., Hox swap mutants) with a wild-derived outbred stock for several generations to introduce genetic diversity and natural behaviors [19]. Create a matched control lineage.
- Genotype Founders: Confirm the genotypes of all animals selected as founders for the OPA using PCR [42].
- Pre-Release Housing: House animals under standard conditions (12:12 light:dark cycle, food and water ad libitum) before release.
OPA Population Establishment
- Release Cohorts: Release a mixed cohort of experimental and control animals (typically in a 50:50 ratio) into a semi-natural enclosure. A common population size is 30-50 mice per enclosure [43].
- Competition Period: Allow the population to compete freely for a set period, typically 20-30 weeks, to encompass multiple reproductive cycles [43] [42].
Data Collection During OPA
- Behavioral Monitoring: Track male territoriality through regular censuses, noting which mice occupy specific nest sites [19].
- Body Mass: Weigh animals at regular intervals to monitor condition.
- Survival: Record all instances of mortality.
Post-Trial Analysis
- Census Offspring: Count and genotype all offspring born within the enclosures to determine parentage and reproductive success.
- Calculate Fitness Metrics: Determine the relative fitness of experimental versus control animals by comparing:
- Total number of offspring produced.
- Frequency of the mutant allele in the offspring generation versus the founder generation.
- Territory acquisition rates.
- Survival rates.
The workflow below summarizes the key stages of an OPA.
The Scientist's Toolkit: Essential Research Reagents & Materials
| Item | Function in OPA Research |
|---|---|
| Wild-Derived Outbred Mice | Provide the natural behaviors and genetic diversity necessary for a sensitive fitness assay; foundational to the OPA system [43] [19]. |
| Semi-Natural Enclosures | Complex habitats with limited resources that simulate ecological pressures, forcing competition and revealing fitness differences [43]. |
| PCR Genotyping System | A critical molecular tool for confirming founder genotypes and determining the parentage of offspring born in enclosures, enabling accurate fitness calculations [42]. |
| Hox-Swap Mutant Mice | A genetically engineered model where one Hox paralog's coding sequence is replaced by another; used as a positive control to test for incomplete functional redundancy [42] [19]. |
| Cerivastatin | A statin drug withdrawn from the market due to adverse effects; serves as an excellent positive control for validating OPA's ability to detect pharmaceutical toxicity [43]. |
The following diagram illustrates the conceptual gap that OPAs fill by bridging observations from controlled lab environments with the complex realities of natural selection.
FAQs: Addressing Core Experimental Challenges
Q1: What does a complete failure of tbx5a expression indicate in a zebrafish Hox cluster mutant?
A complete absence of tbx5a expression in the lateral plate mesoderm indicates a fundamental failure in the initial specification of pectoral fin precursor cells. This phenotype is specifically observed in zebrafish hoxba;hoxbb cluster double-deleted mutants, where the competence to respond to retinoic acid signaling is lost, preventing tbx5a induction in the pectoral fin field [44] [24] [27]. This suggests that hoxba and hoxbb clusters act upstream of tbx5a to establish the positional cues for appendage formation.
Q2: Why might my Hox gene knockout not show a phenotype, and how can I overcome this?
Functional redundancy between Hox genes is a major challenge. In zebrafish, single hoxba cluster mutants show only reduced tbx5a expression and mild fin abnormalities, while the severe phenotype (complete fin loss) is only revealed in hoxba;hoxbb double homozygous mutants [44] [24]. This redundancy stems from their origin via teleost-specific genome duplication [17]. To overcome this:
- Target Multiple Clusters: Design strategies to delete entire paralogous clusters (e.g., both
hoxbaandhoxbb). - Target Key Nodes: Identify and simultaneously mutate pivotal genes within redundant clusters (e.g.,
hoxb4a,hoxb5a,hoxb5b) [44] [27].
Q3: How can I confirm that the observed phenotype is specific to the intended Hox cluster deletion? A proper experimental design includes multiple controls:
- Check Genetic Penetrance: The penetrance of the phenotype should align with Mendelian genetics. For
hoxba;hoxbbdouble homozygous mutants, the observed penetrance was 5.9% (15/252), consistent with the expected 6.3% (1/16) [44] [24]. - Analyze Heterozygous States: Confirm that
hoxba-/-;hoxbb+/-andhoxba+/-;hoxbb-/-mutants still develop pectoral fins, demonstrating that one allele from either cluster is sufficient for fin formation [44] [27]. - Examine Other Clusters: Verify that deletions of other Hox clusters (e.g.,
hoxaa,hoxab,hoxda) do not recapitulate the specific "no fin" phenotype, confirming the unique role of thehoxb-derived clusters in this early positioning event [24].
Troubleshooting Guide: Hox Gene Functional Analysis
Table 1: Troubleshooting Hox Gene Knockout Studies
| Problem | Potential Cause | Solution | Key Experimental Validation |
|---|---|---|---|
No or weak tbx5a expression |
Functional redundancy between Hox clusters [44] [24]. | Generate double or compound cluster mutants. | In situ hybridization on hoxba;hoxbb double mutants shows near-undetectable tbx5a at 30 hpf [44] [27]. |
| Low penetrance of phenotype | Incomplete functional compensation by paralogous genes [44]. | Create deletion mutants for specific genomic loci (e.g., hoxb4a/b5a/b5b). |
Frameshift mutations may not recapitulate the phenotype; large genomic deletions are more effective [44]. |
| Unspecific morphological defects | Off-target effects of gene editing or broad developmental disruption. | Use precise CRISPR-Cas9 to delete entire clusters [24]; include stringent genotyping. | Phenotype is specific to double homozygotes; other genotypes develop fins normally [44] [24]. |
| Failure to validate gene function | Over-reliance on a single methodological approach. | Combine genetic, molecular, and biochemical assays (e.g., mutant analysis, gene expression, RA competence tests) [44] [24]. | Test competence to respond to retinoic acid; hoxba;hoxbb mutants lose this ability [44]. |
Experimental Protocols for Key Methodologies
Protocol 1: Genetic Ablation of Hox Clusters in Zebrafish Using CRISPR-Cas9
This protocol is adapted from the approach used to generate seven distinct hox cluster-deficient mutants [44] [24] [27].
- Design gRNAs: Design multiple gRNAs flanking the entire genomic region of the target hox cluster (e.g.,
hoxbaorhoxbb) to excise it completely. - Microinjection: Co-inject Cas9 mRNA and gRNAs into single-cell stage zebrafish embryos.
- Founder Screening: Raise injected embryos (F0 founders) and outcross to identify germline-transmitted deletions.
- Establish Stable Lines: Intercross F1 carriers to establish stable homozygous mutant lines. Genotype progeny to confirm the deletion.
- Generate Compound Mutants: Cross single cluster mutant lines (e.g.,
hoxba-/-andhoxbb-/-) to create double homozygous mutants for phenotypic analysis.
Protocol 2: Molecular Phenotyping viatbx5aExpression Analysis by In Situ Hybridization
This protocol is critical for assessing the early molecular phenotype of fin bud formation failure [44] [24].
- Sample Collection: Collect wild-type and mutant embryos at key developmental stages (e.g., 30 hours post-fertilization).
- Fixation: Fix embryos in 4% paraformaldehyde (PFA) overnight at 4°C.
- Probe Synthesis: Generate a digoxigenin-labeled antisense RNA probe for the
tbx5agene. - Hybridization: Rehydrate fixed embryos, permeabilize with proteinase K, and hybridize with the
tbx5aprobe overnight. - Detection: Wash stringently and incubate with an anti-digoxigenin antibody conjugated to alkaline phosphatase. Develop the color reaction using NBT/BCIP.
- Analysis: Compare the
tbx5aexpression pattern and signal intensity in the lateral plate mesoderm between wild-type and mutant embryos. A specific lack of signal in mutants indicates a failure of fin bud induction.
The Scientist's Toolkit: Research Reagent Solutions
Table 2: Essential Reagents for Hox Gene and Limb Bud Formation Research
| Reagent / Tool | Function / Application | Example Use in Context |
|---|---|---|
| CRISPR-Cas9 System | Precise genomic editing for generating cluster-wide and single-gene knockout models. | Creating stable hoxba and hoxbb cluster-deleted zebrafish lines [44] [24]. |
tbx5a RNA Probe |
Molecular marker for detecting the earliest stages of pectoral fin bud specification via in situ hybridization. | Identifying the failure of fin field induction in hoxba;hoxbb mutants [44] [27]. |
| Retinoic Acid (RA) | Signaling molecule used to test the competence of the lateral plate mesoderm to form fin buds. | Demonstrating that hoxba;hoxbb mutants lose the ability to induce tbx5a in response to RA [44]. |
| Zebrafish Hox Cluster Mutants | Well-characterized genetic models for dissecting functional redundancy and gene regulation in vivo. | Providing the first genetic evidence for Hox genes in specifying appendage position [44] [24]. |
Signaling Pathways and Experimental Workflows
Hox-Tbx5a Regulatory Axis in Fin Bud Positioning
The following diagram illustrates the genetic pathway and key experimental findings regarding the role of Hox genes in pectoral fin positioning.
Experimental Workflow for Overcoming Functional Redundancy
This workflow outlines the strategic steps to conclusively demonstrate gene function in the face of redundancy.
Troubleshooting Guides
Common Experimental Challenges and Solutions
| Problem Phenomenon | Potential Cause | Diagnostic Approach | Recommended Solution |
|---|---|---|---|
| No overt phenotype in single Hox knockout | Functional redundancy from paralogous Hox genes [1] [29] | Generate compound mutants with paralogs (e.g., Hoxa5-/-;Hoxb5-/-); Analyze subtle morphological/histological changes [1] |
Create higher-order compound mutants; Use sensitive fitness assays in semi-natural environments [19] [45] |
| Variable expressivity/incomplete penetrance in neural defects | Incomplete disruption of RA-Hox signaling axis; Compensation from related signaling pathways [46] [47] | Validate loss of RA-responsive enhancer function (e.g., Hoxa-1 3'RARE mutation); Check expression of multiple 3'-Hox genes (Hox1-4) [48] [47] | Target multiple RAREs (e.g., DE-RARE and ENE-RARE); Combine genetic and pharmacological approaches [49] |
| Disrupted hindbrain patterning with normal Hox expression in other tissues | Tissue-specific regulatory elements; Divergent RA response elements [49] [50] | Use BAC reporters with serial labels to monitor multiple Hox genes; Assess RARE function in different tissues [49] | Employ tissue-specific knockout strategies; Verify with transgenic BAC reporters containing specific RAREs [49] |
| Viable mutants with no reported anatomical defects | Cryptic fitness defects not apparent in laboratory conditions [19] [45] | Conduct Organismal Performance Assays (OPAs) in semi-natural enclosures; Measure reproductive success and competitive ability [19] [45] | Implement fitness measures including male territorial acquisition and offspring genotypic frequencies [19] |
| Abnormal Hox gene response to exogenous RA | Disrupted RARE function; Altered epigenetic regulation of Hox clusters [48] [51] | Analyze histone modifications (H3K27me3, H3K4me3) at Hox loci; Test RA response in mutant RARE embryos [48] [51] | Investigate specific RAREs (e.g., DE-RARE) via knock-out models; Modulate epigenetic regulators [49] [51] |
Hox Gene Functional Redundancy Troubleshooting
| Research Goal | Genetic Strategy | Key Considerations | Expected Outcome Examples |
|---|---|---|---|
| Assess paralog redundancy | Gene replacement/swaps (e.g., Hoxb1 replaced by Hoxa1) [19] [45] |
Amino acid differences (up to 51%) may cause cryptic defects; Assess under competitive conditions [45] | Hoxb1A1/A1 mice show 10.6% fewer male territories and decreased allele frequency in offspring [19] |
| Overcome complete redundancy | Generate compound mutants for multiple paralogs (e.g., Hoxa5;Hoxb5) [1] |
Paralog-specific functions may persist; Threshold effects possible [1] | Hoxa5-/-;Hoxb5-/- neonates die with severe lung defects; single mutants are viable [1] |
| Uncover ecological functions | Organismal Performance Assays (OPAs) in semi-natural environments [19] [45] | Requires outbred, behaviorally competent mice; Measures reproductive fitness [19] [45] | Hoxa1B1/B1 founders produced 22.1% fewer offspring relative to controls [45] |
| Dissect regulatory vs. coding function | Targeted disruption of specific RAREs [48] [49] | Multiple RAREs may regulate a single gene; Enhancer sharing occurs [49] | Hoxa-1 3'RARE mutation causes rhombomere defects with lower severity than full knockout [48] |
Frequently Asked Questions (FAQs)
Experimental Design FAQs
Q: Why don't I see phenotypes in single Hox gene knockouts despite their important developmental functions?
A: This is most commonly due to functional redundancy among paralogous Hox genes. For example, while single Hoxa5 mutants show lung defects, Hoxb5 single mutants are viable with no reported organ defects. However, Hoxa5;Hoxb5 compound mutants display aggravated phenotypes and neonatal lethality, revealing their partial functional redundancy [1]. Gene duplication events in vertebrate evolution have created this redundancy, which can be overcome by generating compound mutants targeting multiple paralogs [29].
Q: How can I determine if apparently redundant Hox paralogs have truly identical functions?
A: Use competitive fitness assays in semi-natural environments rather than standard laboratory conditions. Studies replacing Hoxb1 with Hoxa1 (and vice versa) showed no discernible phenotypes under standard lab conditions, but when assessed in large, competitive enclosures, homozygous mutants suffered significant fitness reductions - acquiring fewer territories and producing fewer offspring [19] [45]. This indicates incomplete functional redundancy despite similar developmental functions.
Q: What are the key mechanisms ensuring proper Hox gene response to retinoic acid signaling? A: Retinoic acid response elements (RAREs) located in Hox gene clusters are essential. These include:
- 3' RAREs regulating
Hoxa-1andHoxb-1[48] [50] - DE-RARE and ENE-RARE that work distantly to regulate multiple 5'
Hoxbgenes [49] These RAREs enable direct transcriptional response to RA, establishing nested Hox expression patterns crucial for anterior-posterior patterning [46] [47] [49].
Q: Why do some RARE mutations only partially recapitulate full Hox gene knockout phenotypes?
A: Multiple RAREs with shared functions often regulate Hox genes. For instance, combined inactivation of both DE-RARE and ENE-RARE is needed to completely abolish rostral expansion of 5' Hoxb gene expression, while single RARE mutations produce milder effects [49]. Additionally, RA can influence Hox expression through indirect mechanisms beyond direct RARE binding [48].
Technical and Interpretation FAQs
Q: What controls are essential for proper interpretation of Hox mutation studies? A: Critical controls include:
- Genetic background controls using the same wild stock for both treatment and control lineages [19] [45]
- Verification of collinear Hox expression patterns using multiplexed BAC reporters [49]
- Assessment of multiple Hox paralogs beyond the targeted gene, as compensation can occur [1]
- Laboratory breeding data to compare with competitive enclosure outcomes [45]
Q: How does the epigenetic regulation of Hox clusters affect RA responsiveness? A: Hox genes are regulated by bivalent chromatin domains with both active (H3K4me3) and repressive (H3K27me3) marks in embryonic stem cells. RA signaling helps remove repressive marks through recruitment of histone demethylases during differentiation [51]. This epigenetic priming ensures proper temporal and spatial collinearity in Hox gene expression in response to RA.
Q: What explains the species-specific differences in RA-Hox pathway requirements?
A: Evolutionary diversification has created species-specific differences. For example, mice and chicks require RA repression of caudal Fgf8 for bilateral somite symmetry, but zebrafish do not [46]. These differences reflect alternative developmental mechanisms (e.g., zebrafish trunk formation uses gastrulation convergence rather than trunk NMPs) and highlight the importance of considering species context in interpreting RA-Hox pathway functions.
Signaling Pathway Diagrams
The Scientist's Toolkit: Research Reagent Solutions
| Reagent Category | Specific Examples | Function/Application | Key Features |
|---|---|---|---|
| Genetic Models | Hoxa1B1 and Hoxb1A1 swap mice [45] |
Test functional equivalence of paralogs; Assess redundancy | 51% amino acid difference; Reveal cryptic fitness defects |
Hoxa5-/-;Hoxb5-/- compound mutants [1] |
Overcome functional redundancy; Study paralog interactions | Neonatal lethality; Severe lung defects not seen in singles | |
| Reporter Systems | Multiplexed BAC reporters with serial labels [49] | Monitor multiple Hox genes simultaneously; Study RARE function | Recapitulates endogenous expression; Tests enhancer sharing |
| Hoxa-1 3'RARE mutant mice [48] | Dissect specific RA response mechanisms | Rhombomere defects; Direct RA control evidence | |
| Assay Systems | Organismal Performance Assays (OPAs) [19] [45] | Detect fitness consequences in semi-natural environments | Measures territory acquisition, reproductive success |
| Teratocarcinoma cell differentiation assays [50] | Study RA-induced Hox expression in vitro | Controlled RA exposure; Temporal collinearity studies | |
| Analytical Tools | RARE sequence analysis (DR5 elements) [50] | Identify conserved RA response elements | Cross-species conservation; DR5 motif identification |
| Epigenetic profiling (H3K4me3/H3K27me3) [51] | Assess bivalent chromatin states in Hox clusters | Stem cell differentiation status; Poised gene analysis |
Experimental Protocols
Organismal Performance Assay (OPA) for Fitness Assessment
Purpose: Detect cryptic fitness defects in Hox mutants that appear normal under standard laboratory conditions [19] [45].
Procedure:
- Founder Population Establishment:
- Cross mutant mice (e.g.,
Hoxb1A1/A1) with genetically diverse wild-derived mice - Select homozygous mutants as founders after two generations of outcrossing
- Establish matched control lineage using same wild stock
- Cross mutant mice (e.g.,
Enclosure Setup:
- Create semi-natural environments (≥ 100 ft²) with limited resources
- Establish three replicate populations with equal founder ratios (treatment:control)
- Maintain populations for 25 weeks to assess multiple reproductive cycles
Data Collection:
- Male Competitive Ability: Monitor territory acquisition through daily observation
- Reproductive Success: Genotype all offspring born in enclosures to determine allele frequencies
- Statistical Analysis: Compare observed vs. expected genotype frequencies using χ² tests
Interpretation: Significant decreases in mutant allele frequency (e.g., from 0.500 to 0.419) indicate incomplete functional redundancy and fitness costs [19].
Compound Mutant Generation for Redundancy Testing
Purpose: Overcome functional redundancy by targeting multiple Hox paralogs [1].
Procedure:
- Initial Crosses:
- Mate single heterozygous mutants (
Hoxa5+/−×Hoxb5+/−) - Generate double heterozygous animals (
Hoxa5+/−;Hoxb5+/−)
- Mate single heterozygous mutants (
Intercross Strategy:
- Intercross double heterozygotes to generate all allelic combinations
- Screen embryos or pups for compound mutant genotypes
- Expected Mendelian ratio: 1 wild-type: 4 single heterozygotes: 6 double heterozygotes: 4 single homozygotes: 1 double homozygous
Phenotypic Analysis:
- Embryonic Stages: Collect at E13.5, E15.5, E18.5 for morphological analysis
- Histological Processing: Fix in 4% paraformaldehyde, paraffin embed, section at 4μm
- Staining: H&E for morphology, Alcian blue for goblet cells, Weigert for elastic fibers
- Immunohistochemistry: Use antibodies against lineage markers (e.g., CC10, podoplanin, FOXA2)
Expected Results: Hoxa5-/-;Hoxb5-/- mutants display neonatal lethality with severe lung defects including impaired branching morphogenesis and air space structure [1].
Proving Functional Divergence: Cross-Species Validation and Mechanistic Insights
Troubleshooting Guides
Guide 1: Addressing Functional Redundancy in Hox Gene Knockouts
Problem: Inconclusive or mild phenotypes in single Hox gene knockouts.
- Root Cause: Functional redundancy between Hox paralogous genes (members of the same group across different clusters, e.g., Hoxb10, Hoxc10, Hoxd10) can compensate for the loss of a single gene [52] [53].
- Solution:
- Multi-Gene Knockout Strategy: Generate knockout models targeting all members of a paralogous group. For example, to reveal the role of Hox10 genes in stylopod (humerus/femur) patterning, simultaneous knockout of Hoxa10, Hoxc10, and Hoxd10 is necessary [52] [53].
- Validation: Confirm the knockout at the genomic (DNA sequencing), transcriptional (RT-qPCR, RNA in situ hybridization), and protein (Western blot, immunohistochemistry) levels for all targeted genes.
- Preventative Measures: Prior to experimentation, conduct a thorough phylogenetic analysis to identify all paralogous group members in your model organism. Design gRNAs or targeting vectors for all relevant genes from the outset.
Problem: Embryonic lethality in multi-gene knockout models.
- Root Cause: Hox genes are critical for early axial patterning. Disrupting multiple genes can cause severe developmental defects incompatible with survival, preventing the study of their later roles in limb development [54].
- Solution:
- Conditional Knockout Models: Utilize Cre-loxP technology to delete Hox genes specifically in the limb bud mesenchyme (e.g., using Prx1-Cre or Tbx4-Cre/Tbx5-Cre for hindlimbs/forelimbs) after the critical stages of axial patterning [55].
- Inducible Systems: Use tamoxifen-inducible Cre systems (CreER) to temporally control gene knockout, allowing you to dissect early vs. late functions in limb patterning.
- Next Steps: If lethality occurs, perform detailed phenotypic analysis of embryos at various developmental stages (e.g., E12.5-E18.5 in mice) to identify the primary defect.
Problem: Off-target effects in CRISPR/Cas9-mediated knockout.
- Root Cause: gRNAs may guide Cas9 to genomic sites with high sequence similarity to the intended target, causing unintended mutations.
- Solution:
- Bioinformatic Design: Use validated software to design gRNAs with high on-target specificity and minimal predicted off-target sites.
- Validation: Use whole-genome sequencing or targeted deep sequencing of predicted off-target sites in your final model to confirm specificity.
- Next Steps: If off-target effects are suspected, generate and phenotype multiple independent knockout lines. Consistent phenotypes across lines suggest on-target effects.
Guide 2: Challenges in Comparative Analysis Across Species
Problem: Divergent Hox gene expression patterns between fish and mouse models.
- Root Cause: Hox gene clusters have undergone duplication and divergence in different vertebrate lineages (e.g., 4 clusters in mice vs. 7 in zebrafish), leading to potential subfunctionalization or neofunctionalization [29] [54].
- Solution:
- Comprehensive Expression Atlas: First, meticulously map the expression patterns of all HoxB paralogs in your species of interest (e.g., zebrafish) using whole-mount in situ hybridization or single-cell RNA-seq across multiple limb/fin bud stages.
- Functional Equivalence Testing: Use CRISPR/Cas9 to knock out the zebrafish ortholog and compare the phenotypic outcome to the mouse knockout. Alternatively, perform cross-species transgenic rescue experiments to test if the gene can functionally replace its ortholog [29].
- Helpful Tip: Focus your initial comparative analysis on Hox genes with conserved synteny (position in the genome) between species, as they are more likely to have conserved functions.
Problem: Interpreting homeotic transformations versus growth defects.
- Root Cause: Hox genes can control both the identity (what a structure becomes) and the growth (how much it grows) of skeletal elements [55].
- Solution:
- Molecular Marker Analysis: Use molecular markers for specific skeletal elements (e.g., Shh for posterior identity, Sox9 for chondrogenesis) to determine if a transformation in identity has occurred.
- Detailed Skeletal Staining: Perform Alcian Blue (cartilage) and Alizarin Red (bone) staining on mutant skeletons and carefully compare the morphology of affected elements to wild-type, referencing established anatomical atlases.
- Interpretation: A homeotic transformation is indicated when one skeletal element clearly adopts the morphology of an adjacent element (e.g., a vertebra transforming to a more anterior identity). A growth defect is characterized by a reduction in size or truncation without a change in identity.
Frequently Asked Questions (FAQs)
Q1: Why is the HoxB cluster a particular focus in appendage positioning compared to other clusters? While HoxA and HoxD clusters are considered the primary regulators of limb patterning, the HoxB cluster (along with HoxC) also contributes to fine-tuning the process. In mice, deletion of the entire HoxB cluster did not result in overt limb patterning defects, suggesting its role might be more subtle, redundant with other clusters, or specific to certain contexts like the hindlimb [55]. In other species like zebrafish, the contribution of Hoxb genes to fin development may be more pronounced due to their different evolutionary history of cluster duplication [29] [54].
Q2: What are the key molecular techniques for identifying direct downstream targets of HoxB genes in the developing limb? The gold standard is Chromatin Immunoprecipitation followed by sequencing (ChIP-seq). This requires a high-quality, specific antibody against your HoxB protein of interest. Alternatively, you can tag the endogenous HoxB protein (e.g., with a HALO or FLAG tag) using CRISPR/Cas9-mediated gene editing and perform ChIP-seq with an antibody against the tag [54]. This data should be integrated with RNA-seq data from wild-type and mutant limb buds to correlate binding with transcriptional changes.
Q3: In a multi-species study, how do I account for the different number of Hox gene clusters (e.g., 4 in mouse vs. 7 in zebrafish)? The key is to identify paralogous groups, not just cluster location. For example, the Hox10 paralogous group in mice consists of Hoxa10, Hoxc10, and Hoxd10. In zebrafish, due to an additional whole-genome duplication, you must identify all orthologs of these genes (e.g., hoxa10a, hoxa10b, hoxc10a, etc.) through phylogenetic analysis. Your functional analysis should then target the entire paralogous group within each species to ensure a fair comparison [29].
Q4: What are the best practices for visualizing and quantifying Hox gene expression patterns in complex 3D structures like the limb bud?
- High-Resolution In Situ Hybridization: Coupled with optical projection tomography or micro-CT scanning to create 3D expression maps.
- Single-Cell RNA Sequencing (scRNA-seq): This is the most powerful method, as it provides quantitative expression data for every Hox gene at single-cell resolution, allowing you to see which combinations of Hox genes are co-expressed in specific progenitor subpopulations [56] [54].
- Lineage Tracing: Combine Hox gene-specific Cre-driver lines with fluorescent reporter mice to track the fate of cells that expressed a particular Hox gene.
Table 1: Phenotypic Outcomes of Select Hox Paralogous Group Knockouts in Mouse Limb Development
| Paralogous Group Targeted | Genes Knocked Out | Major Limb Phenotype | Molecular/Cellular Readout | Key Reference |
|---|---|---|---|---|
| Hox10 | Hoxa10, Hoxc10, Hoxd10 | Severe mis-patterning of the stylopod (humerus/femur); transformation of limb elements [52] [53] | Loss of proximal skeletal elements; ectopic rib-like structures | [53] |
| Hox11 | Hoxa11, Hoxc11, Hoxd11 | Severe mis-patterning of the zeugopod (radius/ulna; tibia/fibula); loss of zeugopod elements [52] | Failure to form radius/ulna; truncated limb bud growth | [52] |
| Hox13 | Hoxa13, Hoxc13, Hoxd13 | Complete loss of the autopod (hand/foot) bones [52] | Absence of digit condensations; disruption of Sonic hedgehog (Shh) signaling | [52] |
| HoxA & HoxD Clusters | All Hoxa and Hoxd genes | Forelimb development arrested early; severely truncated skeletal elements [52] [55] | Failure to maintain the Apical Ectodermal Ridge (AER); absence of Shh expression | [52] [55] |
Table 2: Essential Research Reagents for Hox Gene Functional Studies
| Reagent / Material | Function / Application | Example & Notes |
|---|---|---|
| Conditional KO Mice | Enables tissue-specific (e.g., limb bud) and/or temporal gene deletion to bypass embryonic lethality. | Prx1-Cre (limb mesenchyme), Tbx4-Cre (hindlimb), Tbx5-Cre (forelimb), CreERT2 (tamoxifen-inducible). |
| CRISPR/Cas9 System | For generating multi-gene knockouts and targeted mutations in cell lines or animal models. | Validated gRNAs for all members of a Hox paralogous group; high-fidelity Cas9. |
| Hox-Specific Antibodies | Detection of protein expression and localization (IHC, IF) and for ChIP-seq experiments. | Validation for specific paralogs is critical due to high sequence conservation. |
| scRNA-seq Platform | Unbiased profiling of Hox gene expression and identification of co-expression networks in limb buds. | 10X Genomics; useful for building a transcriptional atlas of wild-type vs. mutant limbs. |
| Skeletal Staining Dyes | Visualization of cartilage and bone formation in embryos and newborns. | Alcian Blue (cartilage) & Alizarin Red (bone). Standard protocol for phenotypic analysis. |
| Whole-Mount In Situ Hybridization (WMISH) | Spatial mapping of Hox gene mRNA expression patterns in developing embryos. | Requires specific RNA probes for each Hox gene; critical for comparative studies. |
Experimental Protocols & Workflows
Protocol 1: Generating a Multi-Hox Gene Knockout Mouse Model using CRISPR/Cas9
Objective: To create a mouse model with a knockout of the entire Hoxb9 paralogous group (Hoxb9-/-).
Materials:
- Cas9 mRNA or protein
- Single-guide RNAs (sgRNAs) designed against exons 1 or 2 of Hoxb9
- Fertilized C57BL/6J mouse zygotes
- Microinjection equipment
Method:
- sgRNA Design: Design 3-4 sgRNAs with high on-target scores against the first coding exons of the Hoxb9 gene. Check for potential off-target sites in the mouse genome.
- Zygote Microinjection: Co-inject Cas9 mRNA/protein and the pool of sgRNAs into the pronucleus or cytoplasm of fertilized mouse zygotes.
- Embryo Transfer: Surgically transfer the injected zygotes into the oviducts of pseudopregnant foster female mice.
- Genotyping Founders:
- Extract genomic DNA from tail biopsies of the resulting offspring (F0 founders).
- Perform PCR amplification of the Hoxb9 genomic region surrounding the sgRNA target sites.
- Analyze the PCR products by Sanger sequencing or next-generation sequencing (NGS) to identify insertion/deletion (indel) mutations. Founders carrying frameshift mutations in both Hoxb9 alleles are selected.
- Establishing the Line: Cross the F0 founder with wild-type mice to test for germline transmission. Establish a stable breeding colony from F1 offspring carrying the mutant allele.
- Phenotypic Analysis: Intercross heterozygous (Hoxb9+/-) mice to generate homozygous (Hoxb9-/-) mutants for analysis.
Protocol 2: Analyzing Hox Gene Expression via scRNA-seq on Limb Buds
Objective: To profile the transcriptional landscape, including all Hox genes, of mouse forelimb buds at E11.5.
Materials:
- Dissected E11.5 mouse forelimb buds
- Single-cell suspension kit (e.g., Papain-based dissociation kit)
- scRNA-seq library preparation kit (e.g., 10X Genomics Chromium Next GEM Single Cell 3')
- Bioanalyzer/TapeStation and sequencer (e.g., Illumina NovaSeq)
Method:
- Single-Cell Suspension: Dissect limb buds into cold PBS. Dissociate tissues into a single-cell suspension using a gentle enzymatic and mechanical dissociation protocol. Filter through a flow cytometry-compatible strainer (e.g., 40 µm) to remove debris.
- Viability and Count: Assess cell viability (aim for >90%) and count using an automated cell counter or hemocytometer.
- Library Preparation: Load the cells onto the scRNA-seq platform (e.g., 10X Genomics Chromium Chip) according to the manufacturer's instructions to generate barcoded single-cell libraries.
- Sequencing: Pool the libraries and sequence on an appropriate Illumina platform to a sufficient depth (e.g., 50,000 reads per cell).
- Bioinformatic Analysis:
- Data Processing: Use Cell Ranger (10X Genomics) or similar tools to align reads to the mouse genome (mm10), quantify gene expression (UMI counts), and perform initial clustering.
- Dimensionality Reduction: Use Seurat or Scanpy for further analysis, including normalization, principal component analysis (PCA), and graph-based clustering. Visualize cells in 2D using UMAP or t-SNE.
- Hox Gene Analysis: Extract the expression matrix for Hox genes. Visualize their expression on UMAP plots and across clusters. Identify cell populations based on their "Hox code."
Signaling Pathways and Experimental Workflows
Hox Gene Knockout Experimental Workflow
Hox Gene Roles in Limb Patterning
In mammalian development, the Hox family of transcription factors are master regulators of the body plan, particularly along the anteroposterior axis. Within the four Hox clusters (A, B, C, and D), the paralogous group 1 genes, including Hoxa1 and Hoxb1, are among the first expressed and are critical for patterning the early hindbrain. A significant challenge in this field has been the apparent functional redundancy between these paralogs, where knocking out a single gene produces minimal phenotypes, suggesting that related genes can compensate for each other's loss. However, emerging evidence from ecologically relevant fitness assays reveals this redundancy is incomplete, with each gene possessing unique, essential functions that become apparent only under specific conditions.
FAQ: Understanding Hoxa1 and Hoxb1 Redundancy
Q1: If Hoxa1 and Hoxb1 are considered redundant, why don't single knockout studies always show strong phenotypes? A1: Traditional laboratory studies often fail to reveal the full functional consequences of gene knockout due to:
- Overlapping Expression and Function: Hoxa1 and Hoxb1 are expressed in broadly overlapping domains in the early hindbrain. When one gene is absent, the other can often sufficiently perform the core transcriptional duties under stable, low-stress laboratory conditions [57] [19].
- Buffered Laboratory Environments: Standard housing eliminates ecological pressures like competition for territories and mates, which are key drivers of evolutionary fitness. Subtle neurological or physiological deficits may go undetected [19] [42].
Q2: What specific evidence challenges the notion of complete redundancy? A2: Key evidence comes from competitive fitness assays and detailed phenotypic analysis:
- Fitness Deficits in Semi-Natural Environments: When mice genetically engineered to express Hoxb1 from the Hoxa1 locus (the
Hoxa1B1swap) compete against wild-type controls in semi-natural enclosures, the mutant mice are out-reproduced. The mutant allele frequency decreased in offspring populations, indicating a clear fitness cost [42]. - Distinct Null Mutant Phenotypes: Single knockout studies do show distinct, non-overlapping critical functions.
Hoxa1null mutants die at birth due to malformed brainstem respiratory circuits, whileHoxb1null mutants are viable but exhibit facial paralysis due to defects in the motor neurons of the seventh cranial nerve [19].
Q3: What are the unique, non-redundant roles of Hoxa1 and Hoxb1 in brainstem development? A3: While their early patterning roles overlap, each gene has a unique functional portfolio.
- Hoxa1's Unique Role: It is critical for the proper formation of the brainstem respiratory circuits. Newborn
Hoxa1mutants die from apnea, highlighting its non-redundant role in establishing vital physiological control systems [19]. - Hoxb1's Unique Role: It maintains a persistent, high-level expression in rhombomere 4 (r4) through an autoregulatory loop. This function is essential for the specification and development of the facial motor neurons that form the seventh cranial nerve [19].
Troubleshooting Guide: Experimental Challenges in Demonstrating Unique Hox Functions
Problem 1: No phenotype is observed in a Hoxa1 or Hoxb1 knockout mouse model under standard laboratory conditions.
- Potential Cause: Functional compensation by the other paralog or other Hox PG1 genes (e.g., Hoxd1) masking the specific role of the targeted gene.
- Solutions:
- Generate Combination Knockouts: Create double or triple paralogous group 1 knockouts (e.g.,
Hoxa1/Hoxb1orHoxa1/Hoxb1/Hoxd1). Studies in Xenopus show that triple PG1 knockdowns produce more severe hindbrain and neural crest defects than single knockouts [57]. - Employ Fitness Assays: Implement Organismal Performance Assays (OPAs) where mutant and control mice compete for resources in large, semi-natural enclosures. This approach has successfully revealed fitness costs in
Hoxb1A1andHoxa1B1swapped mice that were invisible in standard cages [19] [42]. - Conduct Deep Phenotyping: Look beyond gross morphology. Examine specific neuronal populations (e.g., facial motor neurons), physiological functions (e.g., respiratory rhythm), and behavioral outputs in controlled stress paradigms.
- Generate Combination Knockouts: Create double or triple paralogous group 1 knockouts (e.g.,
Problem 2: Inconsistent results between gene replacement (knock-in) studies and traditional knockout studies.
- Potential Cause: Gene replacement (e.g., swapping
Hoxa1withHoxb1coding sequence) may preserve core biochemical function but disrupt gene-specific regulatory fine-tuning, including expression levels, timing, or response to specific co-factors. - Solutions:
- Quantify Expression Dynamics: Precisely characterize the spatial and temporal expression pattern of the knocked-in gene compared to the wild-type gene it replaces. Even subtle differences can lead to functional consequences.
- Analyze Protein-Protein Interactions: Investigate whether the swapped protein interacts correctly with native co-factors. Hox proteins achieve functional specificity by binding with TALE-family cofactors like Pbx and Meis; a swapped protein might have altered affinity [58].
- Test in Competitive Environments: As with Problem 1, move to a more naturalistic setting. The functional differences in swap alleles often only manifest as fitness deficits under competitive pressure [19] [42].
Experimental Protocols & Data
Key Experimental Methodology: Organismal Performance Assay (OPA)
Purpose: To detect subtle, ecologically relevant fitness differences between genetically modified mice (e.g., Hoxa1B1 swap) and wild-type controls that are not apparent in standard laboratory housing.
Workflow Overview:
Detailed Procedure:
- Animal Generation: Cross genetically modified mice (e.g.,
Hoxa1B1(g)/B1(g)) with a wild-derived, genetically diverse stock to create a heterogeneous experimental population. Establish a matched control lineage fromHoxa1+(g)/+(g)mice crossed with the same wild stock [42]. - Enclosure Setup: Use large, complex enclosures (e.g., >100 sq ft) containing shelters, nesting material, and a network of tunnels to simulate a competitive environment. Provide limited, distributed food and water resources.
- Population Founding: Release a balanced mix of experimental and control homozygous founders into the enclosure. The study period typically spans multiple generations (e.g., 25 weeks) [42].
- Data Collection:
- Male Territorial Acquisition: Track which males establish and hold territories.
- Survival and Health: Monitor all founders for injuries, weight loss, and mortality.
- Reproductive Success: Identify all offspring born within the enclosure.
- Genotypic Analysis: Genotype all offspring to determine the frequency of the mutant allele in the next generation. Compare observed genotypic ratios to Mendelian expectations.
- Data Analysis: Calculate the relative fitness of mutant versus control genotypes based on reproductive output and offspring survival.
Quantitative Data from Key Studies
Table 1: Phenotypic Consequences of Hoxa1 and Hoxb1 Manipulations in Mice
| Genotype / Manipulation | Viability | Key Phenotypes in Standard Lab Conditions | Fitness in Competitive Environment | Primary Reference |
|---|---|---|---|---|
Hoxa1-/- |
Lethal at birth | Malformed brainstem respiratory circuits; death from apnea. | Not tested (non-viable). | [19] |
Hoxb1-/- |
Viable | Facial paralysis; absence of seventh cranial nerve. | Not fully assessed. | [19] |
Hoxb1A1/A1 (Hoxb1 locus expresses Hoxa1) |
Viable | No discernible embryonic or physiological phenotype. | Reduced: Mutant allele frequency decreased from 0.500 to 0.419 in offspring; males acquired 10.6% fewer territories. | [19] |
Hoxa1B1/B1 (Hoxa1 locus expresses Hoxb1) |
Viable | No reported gross abnormalities under lab conditions. | Reduced: Mutant founders produced only 77.9% as many offspring as controls. | [42] |
Table 2: Essential Research Reagents for Investigating Hox PG1 Redundancy
| Reagent / Resource | Function / Purpose | Example Application | Key Consideration |
|---|---|---|---|
| Paralogous Group 1 Knockout Mice | To study loss-of-function phenotypes and functional compensation. | Comparing single (Hoxa1-/-), double (Hoxa1-/-; Hoxb1-/-), and triple (with Hoxd1-/-) mutants. |
Phenotype severity increases with the number of genes knocked out [57]. |
Gene-Swap Alleles (e.g., Hoxb1A1, Hoxa1B1) |
To test if one paralog's protein can replace another's function in its native genomic context. | Assessing functional interchangeability at the protein level. | "No phenotype" in the lab does not equate to full functional redundancy [19] [42]. |
| Seminatural Enclosures (OPA) | To provide an ecological context for measuring fitness and complex traits. | Detecting cryptic fitness deficits in genetically modified lines. | Essential for revealing the ultimate functional consequences of genetic manipulations. |
| Hindbrain & Neural Crest Markers | For detailed phenotypic characterization of mutant embryos. | Analyzing patterning defects (e.g., loss of rhombomere identity) and neural crest migration. | Used to show that PG1 knockdown disrupts hindbrain segmentation and blocks neural crest migration [57]. |
The Scientist's Toolkit: Research Reagent Solutions
- Morpholino Oligonucleotides: For rapid, transient knockdown of Hox genes in model organisms like Xenopus. Used to achieve simultaneous knockdown of multiple PG1 genes (Hoxa1, Hoxb1, Hoxd1), revealing severe combined phenotypes [57].
- Conditional Alleles (Cre-lox): For spatially or temporally controlled gene inactivation, allowing researchers to bypass early developmental lethality and study gene function in specific tissues or at later stages.
- Hox Reporter Mice: Transgenic lines where a fluorescent protein (e.g., GFP) is expressed under the control of a Hox gene promoter. Essential for tracking the precise expression domains of Hox genes in wild-type and mutant backgrounds.
- TALE Homeodomain Antagonists: Small molecules or peptides that disrupt Hox-TALE protein interactions. Useful as chemical probes to dissect the functional dependence of Hox proteins on these key cofactors [58].
Frequently Asked Questions (FAQs)
Q1: My Hox gene knockout shows no limb phenotype. Does this mean Hox genes are not involved in limb positioning?
A1: Not necessarily. A lack of phenotype is often due to functional redundancy between Hox genes or clusters. For example, in zebrafish, single mutants for the hoxba cluster show only mild pectoral fin defects, while double mutants for hoxba and hoxbb clusters result in a complete absence of pectoral fins [24]. Always consider generating higher-order compound mutants to reveal the full function of redundant Hox genes.
Q2: Transgenic reporter assays identified a Tbx5 limb enhancer. My CRISPR knockout of this enhancer shows no effect. Why?
A2: This discrepancy between transgenic reporter assays and endogenous gene function is a known challenge. One study reported that CRISPR/Cas9 knockout of two different presumed Tbx5 forelimb enhancers (an intronic one and a conserved downstream one called cns12sh), either singly or together, resulted in no effect on forelimb development or Tbx5 expression in mice [59]. This highlights that reporter constructs can be sensitive to genomic position effects and may not always reflect the function of the endogenous locus. Direct endogenous validation is essential.
Q3: What is the definitive genetic evidence that Hox genes directly regulate Tbx5?
A3: Converging evidence from multiple models supports this. In zebrafish, hoxba;hoxbb cluster-deleted mutants show a complete failure to induce tbx5a expression in the pectoral fin field, leading to a total lack of fins [24]. In mice, a specific 361-bp enhancer in the second intron of Tbx5 was identified that drives forelimb-specific expression. This enhancer contains multiple Hox binding sites, and Hox proteins can bind directly to it. Furthermore, mis-expression of Hox genes can alter the activity of this enhancer in vivo [60].
Q4: Beyond initiation, what roles do Hox genes play in limb development?
A4: Hox genes have distinct, sequential roles. Genes from the HoxA and HoxD clusters (paralogs 9-13) are critical for patterning and outgrowth after the limb bud has formed. In zebrafish, combined deletion of hoxaa, hoxab, and hoxda clusters leads to severe shortening of the pectoral fin, including downregulation of shha, a key signal for growth and patterning, but does not affect the initial induction of tbx5a [22]. This shows a clear separation between the early role in positioning (via HoxB-related genes) and later roles in patterning (via HoxA/HoxD-related genes).
Troubleshooting Guides
Issue 1: Phenotypic Penetrance in Hox Mutants
Problem: A Hox gene knockout exhibits a limb phenotype, but it is inconsistent or has low penetrance.
| Potential Cause | Solution | Example/Evidence |
|---|---|---|
| Genetic Redundancy | Generate compound mutants targeting multiple Hox genes or entire clusters. | Zebrafish hoxb5a and hoxb5b single mutants are viable; deletion of larger genomic loci encompassing multiple genes shows low-penetrance finless phenotypes, suggesting cooperative function [24]. |
| Compensatory Mechanisms | Analyze earlier developmental timepoints and molecular markers, not just final morphology. | In hoxba;hoxbb mutants, the failure is evident at the earliest stage of tbx5a induction in the lateral plate mesoderm [24]. |
| Strain-Specific Effects | Backcross the mutant line to different genetic backgrounds. | Not explicitly covered in results, but a standard genetic practice to address modifier genes. |
Issue 2: Validating Direct vs. Indirect Targets
Problem: It is difficult to determine if a Hox gene directly regulates a proposed target gene like Tbx5.
Solution: A multi-pronged experimental approach is required, as summarized in the workflow below.
Experimental Protocol: Chromatin Immunoprecipitation (ChIP) for Hox Proteins
- Objective: To identify genomic regions bound by a Hox transcription factor in vivo.
- Procedure:
- Cell/ Tissue Collection: Harvest limb buds or other relevant tissues at the appropriate developmental stage.
- Cross-linking: Fix tissues with formaldehyde to covalently link proteins to DNA.
- Chromatin Shearing: Lyse cells and sonicate chromatin to fragment DNA into 200-1000 bp pieces.
- Immunoprecipitation: Incubate chromatin with a specific antibody against the Hox protein of interest. Use a control (e.g., non-specific IgG).
- Reversal of Cross-links & Purification: Heat to reverse cross-links and purify the co-precipitated DNA.
- Analysis: Analyze the enriched DNA by qPCR (for specific loci) or sequencing (ChIP-seq for genome-wide profiling) [61].
- Troubleshooting Tip: The choice of antibody is critical. As an alternative, use a tagged protein-trap line, as demonstrated for Drosophila Ubx and Hth proteins [61].
Key Signaling Pathways and Genetic Networks
The core genetic pathway governing forelimb positioning involves Hox genes directly upstream of the key limb initiator Tbx5. The following diagram illustrates this relationship and the subsequent genetic network activated during limb outgrowth.
Quantitative Data from Key Studies
Table 1: Phenotypic Severity in Zebrafish Hox Cluster Mutants
| Genotype | Pectoral Fin Phenotype | Molecular Marker Analysis | Citation |
|---|---|---|---|
hoxba-/-; hoxbb-/- |
Complete absence | tbx5a expression absent in fin field |
[24] |
hoxaa-/-; hoxab-/-; hoxda-/- |
Severely shortened, but present | Normal initial tbx5a; reduced shha expression |
[22] |
hoxab-/-; hoxda-/- |
Shortened endoskeletal disc and fin-fold | Reduced shha expression |
[22] |
Table 2: Summary of Tbx5 Enhancer Validation Studies
| Enhancer Locus | Transgenic Reporter Result | Endogenous CRISPR Knockout Result | Conclusion | Citation |
|---|---|---|---|---|
| Intron 2 (Mouse) | Recapitulated forelimb expression | No effect on limb development or Tbx5 expression |
Not required endogenously | [59] |
| cns12sh (Mouse) | Recapitulated forelimb expression | No effect on limb development or Tbx5 expression |
Not required endogenously | [59] |
| cns12sh (Zebrafish) | Recapitulated pectoral fin expression | No effect on pectoral fin development | Not required endogenously | [59] |
The Scientist's Toolkit: Research Reagent Solutions
Table 3: Essential Reagents for Hox-Tbx5 Research
| Reagent / Tool | Function / Application | Example Use |
|---|---|---|
| CRISPR-Cas9 | Targeted gene and cluster deletion. Essential for overcoming redundancy. | Generating double hoxba;hoxbb cluster mutants in zebrafish [24]. |
| Protein-Trap Tagged Lines | Endogenously tagged Hox proteins for ChIP. Provides high specificity. | Drosophila Ubx-YFP line for genome-wide binding site mapping [61]. |
| Transgenic Reporter Assays | Testing the regulatory potential of DNA elements. | Identifying a 361-bp Tbx5 intronic element with Hox binding sites [60]. |
| Electrophoretic Mobility Shift Assay (EMSA) | Confirming direct physical binding of Hox protein to DNA in vitro. | Validating Hox protein binding to sites in the Tbx5 enhancer [60]. |
| Whole-mount In Situ Hybridization | Spatial visualization of gene expression patterns in embryos. | Assessing tbx5a and shha expression in zebrafish mutant larvae [24] [22]. |
HOX genes, a highly conserved family of 39 transcription factors in humans, are master regulators of embryonic development, cell differentiation, and tissue identity. Their organization into four clusters (A, B, C, and D) on different chromosomes exhibits a unique collinearity principle, where gene order within clusters corresponds to their expression patterns along the anterior-posterior axis [62]. A significant challenge in HOX research lies in their extensive functional redundancy, where paralogous genes (members of the same group across clusters) and flanking genes within a cluster can perform overlapping functions. This redundancy confounds traditional knockout studies, as removing single genes often produces minimal phenotypic consequences due to compensation by other family members [63]. This technical support guide provides methodologies and troubleshooting approaches to overcome these challenges and effectively link experimental findings to human disease and cancer prognostics.
Core Concepts: HOX Genes in Development and Disease
HOX Gene Function in Normal Biology
HOX genes exhibit stage- and lineage-specific expression patterns during hematopoietic development and differentiation. Multiple genes from the HOXA (e.g., A5, A9, A10), HOXB (e.g., B2-B9), and HOXC (e.g., C6, C8) clusters play distinct roles in erythropoiesis, lymphopoiesis, and myelomonocytic differentiation [64]. Beyond hematopoiesis, HOX genes are critical for organogenesis, as demonstrated by their functions in kidney development, where they regulate nephron progenitor maintenance and cellular lineage fidelity [63].
A key regulatory feature is temporal collinearity, where the sequential activation of HOX genes during development translates into a spatially organized pattern of expression along the body axis [33]. This spatiotemporal regulation is controlled by complex mechanisms including shared enhancers, as exemplified by the Drosophila EO053 enhancer that directs expression of two adjacent genes, pb and zen2, despite their disparate expression patterns [65].
HOX Gene Dysregulation in Human Disorders
Dysregulated HOX gene expression contributes significantly to disease pathogenesis, particularly in cancer. Depending on context, HOX genes can function as either oncogenes or tumor suppressors [62]. Their aberrant expression affects cancer hallmarks including differentiation, invasion, epithelial-to-mesenchymal transition (EMT), apoptosis, and receptor signaling [62].
Table 1: HOX Gene Dysregulation in Hematological Malignancies
| HOX Gene | Cancer Type | Expression Change | Clinical/Prognostic Significance | Affected Pathways |
|---|---|---|---|---|
| HOXA10 | Acute Myeloid Leukemia (AML) | Overexpression | Advanced risk stratification, shorter survival, chemoresistance | RAS, PI3K-AKT, OXPHOS [62] |
| HOXB5 | Acute Myeloid Leukemia (AML) | Overexpression | Leukocytosis, worse cytogenetic risk, decreased overall survival | Associated with DNMT3A, FLT3, NPM1 mutations [62] |
| Multiple HOXA genes | Acute Myeloid Leukemia (AML) | Overexpression | Contributes to leukemogenesis | Alters differentiation of myeloid progenitors [64] [62] |
In solid tumors, HOX gene dysregulation serves as both prognostic and diagnostic biomarkers. The specific role varies by gene and cancer type, influencing patient outcomes through governance of key signaling pathways including Notch, Sonic Hedgehog, and Wnt [66] [62].
Experimental Approaches: Overcoming Functional Redundancy
Strategic Design of Multi-Gene Knockouts
Conventional single-gene knockouts often fail to reveal HOX functions due to compensatory mechanisms. Effective strategies require systematic targeting of multiple redundant genes.
Table 2: Comparative Analysis of Multi-HOX Knockout Strategies
| Methodology | Key Features | Advantages | Limitations | Demonstrated Outcome |
|---|---|---|---|---|
| BAC Recombineering & Sequential Targeting [63] | - Frameshift mutations in multiple flanking genes- Uses "once-only" LoxP sites (Lox66/Lox71)- Preserves shared enhancers | - Avoids ectopic expression from enhancer deletion- Enables precise mutation of gene groups- Maintains genomic architecture | - Technically complex- Time-consuming- Requires specialized expertise | - Revealed kidney hypoplasia, agenesis, cysts- Identified cellular lineage infidelity [63] |
| CRISPR/Cas9 Deletion | - Creates chromosomal deletions- Removes gene clusters- Rapid generation of mutants | - High efficiency |
- May delete shared enhancers- Potential for compensatory expression from other clusters- Off-target effects | - Milder phenotypes than targeted mutations possible due to cross-cluster compensation [63] |
| Paralogous Group Targeting | - Simultaneously targets genes across all four clusters- Focuses on evolutionarily related paralogs (e.g., Hox9,10,11) | - Addresses deepest level of redundancy- Reveals fundamental shared functions- Models complete functional ablation | - Fertility issues in complex mutants- Lethality may prevent analysis of later developmental stages | - Blocked early kidney formation (Hox11 paralogs)- Stromal compartment defects (Hox10 paralogs) [63] |
Protocol: BAC Recombineering for Multi-HOX Gene Mutagenesis
This protocol is adapted from methods used to generate Hoxc9,10,11 and Hoxa9,10,11 mutant mice [63].
Objective: To introduce concurrent frameshift mutations in multiple flanking Hox genes while preserving intergenic regulatory elements.
Materials:
- BAC containing the target Hox cluster
- Targeting constructs with homology arms
- Kan/Neo selectable marker flanked by Lox66 and Lox71 sites
- Cre recombinase (inducible)
- Embryonic Stem Cells (ESCs)
- Electroporation system
- Genomic DNA qPCR reagents
Workflow:
Procedure:
BAC Modification
- Recombine the targeting construct containing the Kan/Neo marker into the BAC using homologous recombination.
- Identify successfully modified BAC clones through antibiotic selection and PCR verification.
Marker Excision
- Introduce inducible Cre recombinase to remove the Kan/Neo marker.
- The Lox66 and Lox71 sites recombine to form an inactive double mutant LoxP site, preventing further recombination.
ESC Targeting and Screening
- Electroporate the final BAC targeting construct into ESCs.
- Screen ESC clones by genomic DNA qPCR to identify those with correct targeting, indicated by a single remaining wild-type allele.
Mouse Generation
- Generate chimeric mice from targeted ESC clones.
- Cross to germline Cre-expressing mice to remove remaining Neo sequences.
- Interbreed heterozygotes to generate complex mutant combinations for phenotypic analysis.
Advanced 3D Genome Engineering Technologies
The development of CRISPR-based chromatin imaging and manipulation tools enables researchers to investigate and target the higher-order regulatory architecture controlling HOX gene expression.
Chromatin Visualization Tools:
- CRISPRainbow: Enables simultaneous labeling of up to 6 chromosomal loci using a color-mixing strategy [67].
- CRISPR-Sirius: Improves detection sensitivity through sgRNA scaffold optimization, visualizing repetitive sequences with as few as 20 copies [67].
- CARGO System: Uses a 3-plasmid expression setup to track enhancer-promoter dynamics during live cell differentiation [67].
- CRISPR-LiveFISH: Achieves high-resolution genomic DNA imaging across diverse human cell types using fluorescent ribonucleoprotein (fRNP) particles [67].
Troubleshooting Guide: FAQs for HOX Gene Research
Q1: Our single Hox gene knockout shows no phenotypic abnormality in the studied tissue. How should we proceed?
A: This likely indicates functional redundancy. Implement a systematic multi-gene targeting approach:
- First, identify all expressed paralogs within the same group (e.g., Hoxa11, Hoxc11, Hoxd11) through RNA-seq or qPCR.
- Design guide RNAs targeting conserved functional domains across multiple paralogs.
- Use BAC recombineering rather than cluster deletion to preserve shared enhancers and avoid compensatory overexpression from remaining genes.
- Analyze fetal development stages, as phenotypes may be evident only during embryogenesis [63].
Q2: How can we determine if a phenotypic result is due to specific Hox gene loss versus general developmental disruption?
A: Implement rigorous controls and analytical methods:
- Include lineage tracing to confirm that affected cells indeed expressed the targeted Hox genes.
- Perform single-cell RNA sequencing to identify aberrant co-expression of differentiation markers, which indicates lineage infidelity rather than general developmental arrest [63].
- Analyze whether the phenotype represents a homeotic transformation (change in cell identity) rather than generalized hypoplasia.
- Use inducible knockout systems to bypass early developmental requirements and assess specific later functions.
Q3: What are the best approaches to identify direct HOX target genes given their weak DNA-binding specificity?
A: Employ integrated multi-omics approaches:
- Combine ChIP-seq with chromatin conformation capture (Hi-C) to identify long-range interactions and enhancer-promoter looping.
- Utilize CUT&RUN or CUT&TAG for higher-resolution binding profiles with lower cell input requirements.
- Correlate binding data with transcriptomic changes after acute HOX depletion to distinguish direct from indirect targets.
- Look for cooperative binding with other transcription factors that increase binding specificity [64].
Q4: How can we translate findings from mouse Hox mutants to human cancer diagnostics?
A: Establish clinical correlation through these methods:
- Analyze HOX expression patterns in human tumor cohorts (e.g., TCGA data) using bioinformatics.
- Correlate specific HOX expression signatures with patient survival, metastasis, and treatment response.
- Develop patient-derived xenograft (PDX) models with modulated HOX expression to test causal relationships.
- Validate HOX proteins as circulating biomarkers in blood samples using sensitive immunoassays [66] [62].
The Scientist's Toolkit: Essential Research Reagents
Table 3: Key Reagents for HOX Gene Functional Studies
| Reagent/Category | Specific Examples | Function/Application | Technical Considerations |
|---|---|---|---|
| Multi-Gene Targeting Systems | BAC recombineering vectors (Lox66/Lox71); CRISPR/Cas9 with multiple gRNAs | Simultaneous mutation of redundant gene families; Preservation of regulatory elements | BAC methods preserve enhancers; CRISPR deletions may cause compensatory effects [63] |
| Chromatin Visualization Tools | CRISPRainbow; CRISPR-Sirius; CARGO; CRISPR-LiveFISH | Live imaging of chromatin dynamics; Tracking enhancer-promoter interactions | Varying sensitivity for repetitive vs. non-repetitive sequences; Different signal-to-noise ratios [67] |
| Cell Type Markers | SIX2 (nephron progenitors); GDNF (ureteric bud signaling); Segment-specific nephron markers | Identification of specific cell populations; Detection of lineage infidelity | Essential for identifying homeotic transformations at cellular resolution [63] |
| Bioinformatics Databases | UCSC Genome Browser; TCGA; GEO datasets | Analysis of HOX expression patterns; Correlation with clinical outcomes | Enables connection of basic findings to human cancer prognostics [62] [68] |
Visualizing HOX Regulatory Complexity
The regulatory relationships within HOX clusters involve shared enhancers and complex chromatin architecture, as demonstrated by the EO053 enhancer regulating both pb and zen2 [65].
This diagram illustrates how a single enhancer (EO053) can regulate two adjacent genes with disparate spatiotemporal expression patterns, representing both a challenge for functional studies (due to potential unintended effects when manipulating regulatory regions) and an opportunity for understanding evolutionary divergence of HOX gene function [65].
Overcoming functional redundancy in HOX gene research requires integrated approaches combining multi-gene targeting, advanced chromatin analysis, and careful phenotypic characterization. The methodologies outlined in this technical support guide enable researchers to move beyond the limitations of single-gene knockouts and establish meaningful connections between basic HOX gene functions and their roles in human disorders and cancer prognostics. By implementing these strategies, scientists can effectively dissect the complex regulatory networks governed by this critical gene family and translate findings into clinically relevant biomarkers and therapeutic targets.
Conclusion
The historical challenge of Hox gene functional redundancy is being systematically overcome through a multi-faceted arsenal of evolutionary insight, advanced genetic engineering, and ecologically relevant phenotyping. The convergence of evidence from cluster-wide deletions in zebrafish, fitness assays in mice, and regulatory landscape analyses demonstrates that apparent redundancy often masks deep functional divergence critical for development and fitness. These approaches have definitively established the role of Hox genes in specifying limb position—a long-debated question—and revealed cryptic phenotypes with significant evolutionary consequences. Future research must leverage single-cell technologies to dissect the subtle transcriptional networks controlled by specific paralogs and translate these findings into clinical applications, particularly for HOX-dysregulated cancers and congenital disorders. By moving beyond single-gene knockouts, the field is poised to fully decipher the Hox code and harness its principles for regenerative medicine and targeted therapeutics.
References
- 1. Partial functional redundancy between Hoxa5 and Hoxb5 ... [https://pmc.ncbi.nlm.nih.gov/articles/PMC3680751/]
- 2. Hox gene [https://en.wikipedia.org/wiki/Hox_gene]
- 3. Hagfish genome elucidates vertebrate whole ... [https://www.nature.com/articles/s41559-023-02299-z]
- 4. Hox cluster duplications and the opportunity for ... [https://pmc.ncbi.nlm.nih.gov/articles/PMC299744/]
- 5. Duplications of hox gene clusters and the emergence ... [https://www.sciencedirect.com/science/article/pii/S0012160613001334]
- 6. HOX Genes: Methods and Protocols [https://link.springer.com/book/10.1007/978-1-0716-4322-8]
- 7. G banding [https://en.wikipedia.org/wiki/G_banding]
- 8. Giemsa Banding (“GTG” Banding) [https://www.thermofisher.com/us/en/home/references/protocols/cell-and-tissue-analysis/staining-protocol/giemsa-banding.html]
- 9. The multiple fates of gene duplications [https://pmc.ncbi.nlm.nih.gov/articles/PMC9252495/]
- 10. Subfunctionalization of duplicated genes as a transition state ... [https://bmcecolevol.biomedcentral.com/articles/10.1186/1471-2148-5-28]
- 11. The impact of whole genome duplications on the human gene ... [https://pmc.ncbi.nlm.nih.gov/articles/PMC8675932/]
- 12. The Enigmatic HOX Genes: Can We Crack Their Code? [https://pmc.ncbi.nlm.nih.gov/articles/PMC6468460/]
- 13. Single-cell, whole-embryo phenotyping of mammalian ... [https://www.nature.com/articles/s41586-023-06548-w]
- 14. CRISPR/Cas9 Mutagenesis Reveals Versatile Roles of ... [https://www.sciencedirect.com/science/article/pii/S0960982215014153]
- 15. Limb Patterning - an overview [https://www.sciencedirect.com/topics/biochemistry-genetics-and-molecular-biology/limb-patterning]
- 16. Limb positioning and initiation: an evolutionary context of ... [https://pmc.ncbi.nlm.nih.gov/articles/PMC10623539/]
- 17. Diversification and Functional Evolution of HOX Proteins [https://www.frontiersin.org/journals/cell-and-developmental-biology/articles/10.3389/fcell.2022.798812/full]
- 18. Minireview Human HOX gene disorders [https://www.sciencedirect.com/science/article/pii/S1096719213003600]
- 19. Fitness Assays Reveal Incomplete Functional Redundancy of ... [https://pmc.ncbi.nlm.nih.gov/articles/PMC4596679/]
- 20. A multiple super-enhancer region establishes inter-TAD ... [https://pmc.ncbi.nlm.nih.gov/articles/PMC10241789/]
- 21. Modeling of large-scale hoxbb cluster deletions in ... [https://pmc.ncbi.nlm.nih.gov/articles/PMC11072906/]
- 22. and HoxD-related clusters in the pectoral fin development [https://www.nature.com/articles/s41598-024-74134-9]
- 23. Multicluster Pcdh diversity is required for mouse olfactory ... [https://pmc.ncbi.nlm.nih.gov/articles/PMC5529182/]
- 24. HoxB-derived hoxba and hoxbb clusters are essential for ... [https://elifesciences.org/articles/105889]
- 25. Genome-scale CRISPR-Cas9 screening in stem cells [https://pmc.ncbi.nlm.nih.gov/articles/PMC11264826/]
- 26. Troubleshooting Guide for Common CRISPR-Cas9 Editing ... [https://synapse.patsnap.com/article/troubleshooting-guide-for-common-crispr-cas9-editing-problems]
- 27. HoxB-derived hoxba and hoxbb clusters are essential for ... [https://pmc.ncbi.nlm.nih.gov/articles/PMC12638046/]
- 28. HoxB-derived hoxba and hoxbb clusters are essential for ... [https://elifesciences.org/reviewed-preprints/105889?utm]
- 29. Diversification and Functional Evolution of HOX Proteins - PMC [https://pmc.ncbi.nlm.nih.gov/articles/PMC9136108/]
- 30. and HoxD-related clusters in the pectoral fin development [https://pmc.ncbi.nlm.nih.gov/articles/PMC11464670/]
- 31. Solving the Hox Specificity Paradox [https://www.hhmi.org/news/solving-hox-specificity-paradox]
- 32. HOX GENES: Seductive Science, Mysterious Mechanisms [https://pmc.ncbi.nlm.nih.gov/articles/PMC1891803/]
- 33. Some Questions and Answers About the Role of Hox ... [https://pmc.ncbi.nlm.nih.gov/articles/PMC6895010/]
- 34. Co-option of an ancestral cloacal regulatory landscape ... [https://www.nature.com/articles/s41586-025-09548-0]
- 35. Regulatory Landscape of the Hox Transcriptome [https://pubmed.ncbi.nlm.nih.gov/30604839/]
- 36. EVOLUTIONARY CO-OPTION OF AN ANCESTRAL ... [https://pmc.ncbi.nlm.nih.gov/articles/PMC10996561/]
- 37. Genetic Modulation of the Hoxb6 Mutant Skeletal Phenotype [https://journals.plos.org/plosone/article?id=10.1371/journal.pone.0146019]
- 38. Genome-wide screening reveals essential roles for HOX ... [https://www.sciencedirect.com/science/article/pii/S2213671124002881]
- 39. Large scale transgenic and cluster deletion analysis of the ... [https://pmc.ncbi.nlm.nih.gov/articles/PMC312772/]
- 40. HoxD cluster scanning deletions identify multiple defects ... [https://pmc.ncbi.nlm.nih.gov/articles/PMC1315393/]
- 41. Modeling of large-scale hoxbb cluster deletions in ... [https://link.springer.com/article/10.1007/s00018-023-04933-2]
- 42. Mouse fitness measures reveal incomplete functional ... [https://pmc.ncbi.nlm.nih.gov/articles/PMC5381901/]
- 43. Quantification of cerivastatin toxicity supports organismal ... [https://pmc.ncbi.nlm.nih.gov/articles/PMC4869410/]
- 44. Genetic evidence: zebrafish hoxba and hoxbb clusters are essential for... [https://elifesciences.org/reviewed-preprints/105889v1]
- 45. Mouse fitness measures reveal incomplete functional ... [https://journals.plos.org/plosone/article?id=10.1371/journal.pone.0174975]
- 46. Retinoic acid signaling pathways - PMC [https://pmc.ncbi.nlm.nih.gov/articles/PMC6633611/]
- 47. Retinoic Acid Signaling in Vertebrate Hindbrain ... [https://www.mdpi.com/1424-2818/13/8/398]
- 48. In vivo functional analysis of the Hoxa-1 3' retinoic acid ... [https://pubmed.ncbi.nlm.nih.gov/9053316/]
- 49. Long-range regulation by shared retinoic acid response ... [https://www.sciencedirect.com/science/article/pii/S0012160614000669]
- 50. Retinoic Acid-responsive Enhancers Located 3ʹ of the ... [https://www.sciencedirect.com/science/article/pii/S0021925819784865]
- 51. A Case of Identity: HOX Genes in Normal and Cancer Stem ... [https://www.mdpi.com/2072-6694/11/4/512]
- 52. Hox Genes and Limb Musculoskeletal Development - PMC [https://pmc.ncbi.nlm.nih.gov/articles/PMC4216602/]
- 53. New Approach To Gene Knockouts Reveals The 'Master ... [https://www.sciencedaily.com/releases/2003/07/030718083710.htm]
- 54. Hox genes in development and beyond - PMC - PubMed Central [https://pmc.ncbi.nlm.nih.gov/articles/PMC10216783/]
- 55. The role of Hox genes during vertebrate limb development [https://www.sciencedirect.com/science/article/pii/S0959437X07001165]
- 56. HOX Pro DB: the functional genomics of hox ensembles [https://pmc.ncbi.nlm.nih.gov/articles/PMC99118/]
- 57. Knockdown of the complete Hox paralogous group 1 leads ... [https://pubmed.ncbi.nlm.nih.gov/15930115/]
- 58. Hox genes: The original body builders - PMC [https://pmc.ncbi.nlm.nih.gov/articles/PMC10949336/]
- 59. Genomic Knockout of Two Presumed Forelimb Tbx5 ... [https://pmc.ncbi.nlm.nih.gov/articles/PMC6034701/]
- 60. Hox genes regulate the onset of Tbx5 expression in the forelimb [https://pmc.ncbi.nlm.nih.gov/articles/PMC3413163/]
- 61. Genome-Wide Analysis of the Binding of the Hox Protein ... [https://journals.plos.org/plosone/article?id=10.1371/journal.pone.0014778]
- 62. The HOX Gene Family's Role as Prognostic and Diagnostic ... [https://www.mdpi.com/2072-6694/17/2/262]
- 63. Disruption of Hox 9,10,11 function results in cellular level lineage... [https://www.nature.com/articles/s41598-018-24782-5?error=cookies_not_supported]
- 64. Effects of HOX homeobox genes in blood cell differentiation [https://pubmed.ncbi.nlm.nih.gov/9365517/]
- 65. Disparate expression specificities coded by a shared Hox- ... [https://elifesciences.org/articles/39876]
- 66. The HOX Gene Family's Role as Prognostic and Diagnostic ... [https://pubmed.ncbi.nlm.nih.gov/39858044/]
- 67. 3D Genome Engineering: Current Advances and Therapeutic ... [https://pmc.ncbi.nlm.nih.gov/articles/PMC12399806/]
- 68. Genome Browser User's Guide [https://genome.ucsc.edu/goldenpath/help/hgTracksHelp.html]