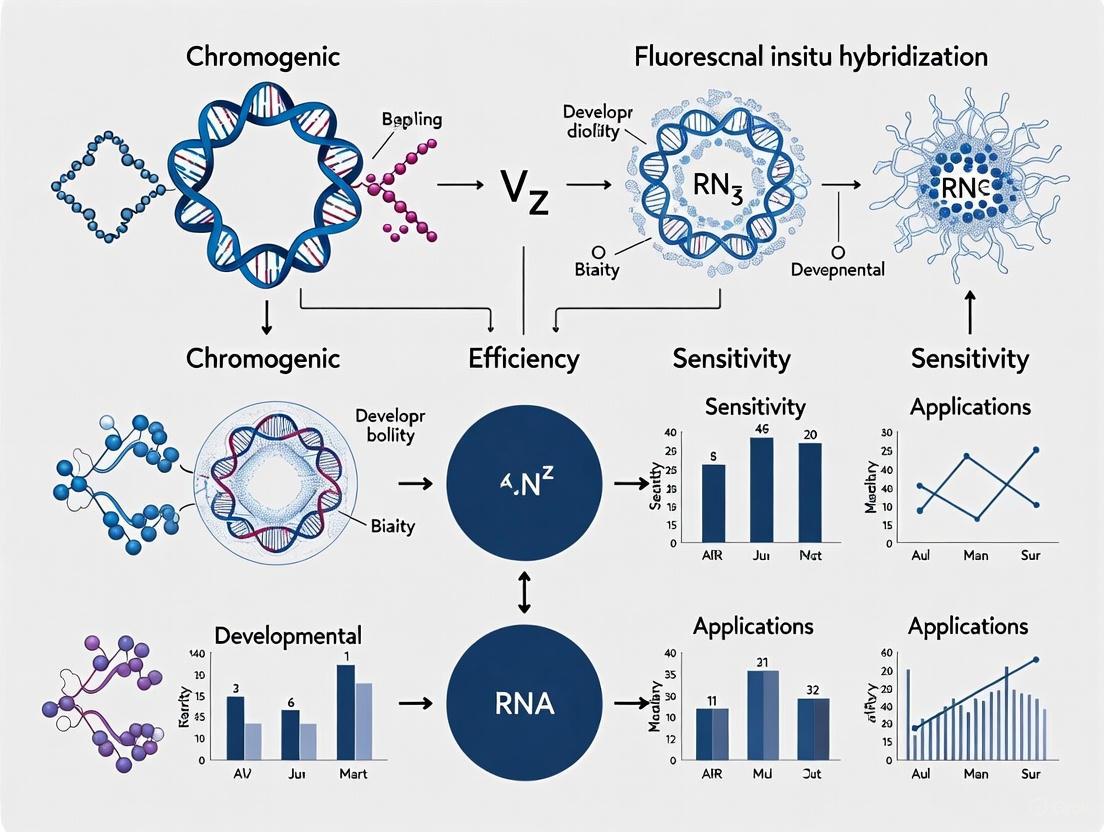
Chromogenic vs Fluorescent In Situ Hybridization: A Comprehensive Guide for Biomedical Researchers
This article provides a detailed comparison of Chromogenic (CISH) and Fluorescent In Situ Hybridization (FISH) for researchers and drug development professionals.
Chromogenic vs Fluorescent In Situ Hybridization: A Comprehensive Guide for Biomedical Researchers
Abstract
This article provides a detailed comparison of Chromogenic (CISH) and Fluorescent In Situ Hybridization (FISH) for researchers and drug development professionals. It covers the foundational principles of both techniques, explores their specific methodological applications in areas like HER2 testing in breast cancer and 1p/19q analysis in gliomas, and offers practical troubleshooting guidance. A critical validation and comparative analysis is presented, synthesizing data from multiple clinical studies to aid in the selection of the optimal methodology for specific research and diagnostic goals, from high-throughput clinical screening to complex, multi-target research applications.
Core Principles: Understanding CISH and FISH Fundamentals
In the field of molecular pathology, in situ hybridization (ISH) techniques are indispensable for visualizing specific nucleic acid sequences within cells and tissues. Two pivotal methods in this domain are Fluorescence In Situ Hybridization (FISH) and Chromogenic In Situ Hybridization (CISH). Both techniques allow for the localization and analysis of DNA or RNA targets within morphologically preserved tissue sections, cytological preparations, and chromosome spreads. While they share a common principle of nucleic acid hybridization, their detection systems, instrumentation requirements, and applications present distinct advantages and limitations. For researchers, scientists, and drug development professionals, understanding the nuances of these techniques is critical for selecting the appropriate method for specific diagnostic and research objectives, particularly in areas like oncology and genetics.
Core Principles and Comparative Analysis
Fundamental Principles
Both FISH and CISH rely on the fundamental principle of hybridizing a labeled nucleic acid probe to a complementary DNA or RNA target sequence within fixed cells and tissues [1] [2]. The probe is labeled with a reporter molecule, and the site of hybridization is visualized using an appropriate microscopy system. The key difference lies in the method of detection: FISH uses fluorescently labeled probes detected with a fluorescence microscope, whereas CISH uses probes detected with an enzyme-mediated chromogenic reaction visible under a standard bright-field microscope [3] [2].
Direct Comparison of FISH and CISH Characteristics
The table below summarizes the core characteristics that distinguish FISH and CISH.
| Characteristic | Fluorescence In Situ Hybridization (FISH) | Chromogenic In Situ Hybridization (CISH) |
|---|---|---|
| Visualization Method | Fluorescence microscopy [3] | Bright-field microscopy [3] |
| Probe Label | Fluorophores (e.g., FITC, Texas Red, Cy3) [1] [3] | Enzymes (e.g., Horseradish Peroxidase) [4] |
| Signal Type | Fluorescent signals [2] | Chromogenic precipitation (e.g., DAB) [2] |
| Primary Advantage | Multiplexing: simultaneous detection of multiple targets [3] | Ability to view signal and tissue morphology simultaneously [3] |
| Microscope Requirement | Fluorescence microscope with specific filters [1] | Standard light microscope [5] |
| Signal Permanence | Fades over time; requires antifade mounting [1] | Permanent; slides can be stored long-term [4] |
| Primary Application | Gene presence, copy number, location; mutation analysis [3] | Molecular pathology diagnostics [3] |
| Multiplexing Capability | Excellent; allows multicolor FISH [2] | Limited compared to FISH [2] |
Experimental Protocols for HER2 Testing in Breast Cancer
A primary clinical application for both FISH and CISH is the assessment of HER2 gene amplification status in breast cancer, which determines patient eligibility for targeted therapies like trastuzumab. The following protocols, adapted from clinical studies, outline the core steps for these assays.
Protocol A: Fluorescence In Situ Hybridization (FISH)
- Sample Preparation: Cut 4 µm thick sections from formalin-fixed, paraffin-embedded (FFPE) tissue blocks. Mount on slides, deparaffinize in xylene, and dehydrate in ethanol [4] [6].
- Pretreatment: Incubate slides in a pre-treatment reagent (e.g., 1 M NaSCN) at 80°C for 30 minutes to expose the target DNA. Wash in 2x SSC buffer [4].
- Protease Digestion: Treat slides with a protease solution (e.g., pepsin) at 37°C for 10-30 minutes to digest surrounding proteins and reduce background. Dehydrate the slides [4] [6].
- Denaturation and Hybridization: Apply a dual-color, HER2/CEP17-specific DNA probe mixture to the tissue section. Denature the probe and sample DNA together at 72-80°C for 5-10 minutes, then incubate at 37°C in a humidified chamber for 16-24 hours to allow hybridization [4] [6].
- Post-Hybridization Wash: Wash slides in a stringent buffer (e.g., 0.5x SSC) at 72°C to remove any unbound or mismatched probe [4].
- Counterstaining and Mounting: Apply a mounting medium containing a fluorescent nuclear counterstain, such as DAPI (4',6-diamidino-2-phenylindole) [4] [6].
- Signal Enumeration: Analyze slides using a fluorescence microscope equipped with appropriate filters. Score the ratio of HER2 (orange/red) to CEP17 (green) signals in at least 60 non-overlapping interphase nuclei. A ratio >2.2 is typically considered amplified [7] [8].
Protocol B: Chromogenic In Situ Hybridization (CISH)
- Sample Preparation: Identical to FISH protocol: deparaffinize and dehydrate 4 µm FFPE tissue sections [4].
- Pretreatment and Digestion: Heat slides in a pretreatment buffer at 92-100°C for 15 minutes. Then, digest with a tissue pretreatment enzyme (e.g., pepsin) at 37°C for 2-15 minutes [4] [6].
- Denaturation and Hybridization: Apply a digoxigenin-labeled HER2 DNA probe. Denature the DNA on a hot plate (95°C) for 5-10 minutes, then hybridize at 37°C for 16-24 hours [4] [6].
- Post-Hybridization Wash: Wash slides in a saline solution to remove excess probe [4].
- Chromogenic Detection:
- Blocking: Incubate slides with a blocking reagent and 3% H₂O₂ to suppress endogenous peroxidase activity [4].
- Antibody Incubation: Sequentially apply a mouse anti-digoxigenin antibody, followed by a polymerized HRP-conjugated anti-mouse antibody [4] [6].
- Signal Development: Apply the chromogen 3,3'-diaminobenzidine (DAB), which produces a brown precipitate at the probe binding site [4] [6].
- Counterstaining: Counterstain with hematoxylin to provide morphological context [4] [6].
- Signal Enumeration: Evaluate slides under a standard light microscope. Amplification is defined as >5-6 signals per nucleus or the presence of large gene clusters in >50% of tumor cells [4] [8].
Diagram 1: FISH experimental workflow for HER2 testing.
Diagram 2: CISH experimental workflow for HER2 testing.
Concordance and Performance Data in Clinical Validation
Multiple studies have validated CISH against the traditional gold standard, FISH, particularly in the context of HER2 testing in breast cancer. The table below summarizes key quantitative findings from these studies.
| Study Reference | Sample Size & Type | Concordance Between FISH and CISH | Notes / Key Findings |
|---|---|---|---|
| Tsiambas et al. (2008) [4] | 100 invasive breast carcinomas | 100% | 100% concordance in 88 interpretable cases. |
| Li et al. (2013) Multicenter Study [8] | 840 breast cancer core biopsies | 98% (based on HER2/CEN17 ratio) | Concordance based on ratio in 108 cases. |
| Lal et al. (2003) [6] | 188 primary breast carcinomas | 94.1% | HER2 amplification detected in 24.5% (FISH) vs 22.9% (CISH). |
| Nitta et al. (2013) [7] | 108 breast cancer samples | 99% (Cohen κ coefficient, 0.9664) | High concordance supporting CISH reliability. |
| An Update Study (2022) [5] | 254 breast cancer samples (IHC 0/1+, 2+, 3+) | 93-98% (across IHC groups) | 97% in IHC 0/1+, 98% in IHC 3+, 93% in equivocal IHC 2+. |
The Scientist's Toolkit: Essential Research Reagents and Materials
The following table details key reagents and materials required for performing FISH and CISH assays, based on the protocols and studies cited.
| Item | Function / Description | Example Assays / Components |
|---|---|---|
| Formalin-Fixed Paraffin-Embedded (FFPE) Tissue | Standard preserved tissue source for DNA in situ analysis. | Breast carcinoma core biopsies or sections [8] [6]. |
| Dual-Color DNA Probes | Labeled nucleic acid sequences targeting specific genes and control regions. | HER2/neu-specific probe and CEP17 (chromosome 17 centromere) probe [4] [6]. |
| Protease Solution | Enzyme (e.g., pepsin) that digests proteins surrounding DNA, improving probe access. | Tissue Pretreatment Enzyme [4] [6]. |
| Hybridization System | Provides controlled conditions for denaturation and hybridization. | Humidified chamber and heating system (e.g., hot plate, hybridizer) [4] [6]. |
| Fluorophore-Conjugated Antibodies / Detection Systems | For FISH: Directly labeled probes or detection systems for indirect labeling. | Fluorophores: Texas Red, FITC, Rhodamine [7] [1]. |
| Chromogenic Detection Kit | For CISH: Antibodies and enzymes that produce a visible precipitate. | Anti-digoxigenin, HRP-conjugated antibody, and DAB chromogen [4] [6]. |
| Fluorescence Microscope | Essential for visualizing and enumerating FISH signals. | Microscope with DAPI, FITC, Texas Red/Rhodamine filters [1] [4]. |
| Bright-Field Microscope | Standard microscope for viewing CISH-stained morphology and signals. | Conventional light microscope used for H&E evaluation [5] [3]. |
FISH and CISH are both highly reliable and accurate techniques for the detection of gene amplification, with a well-documented high degree of concordance. The choice between them is not a matter of one being superior to the other, but rather which is more suitable for a specific laboratory environment and research question. FISH remains the undisputed choice for multiplexing and complex cytogenetic analyses due to its ability to visualize multiple targets simultaneously. However, CISH presents a compelling alternative for high-throughput, routine diagnostic applications, particularly where morphology is paramount and access to fluorescence microscopy is limited. Its compatibility with standard pathology workflows and permanent slide archiving makes it an efficient and cost-effective solution. As the field advances, novel methods like CRISPR-CISH are emerging, combining the simplicity of chromogenic detection with newer gene-targeting technologies, further expanding the toolkit available to scientists and diagnosticians [9].
The selection of an appropriate detection method is a fundamental decision in the design of any in situ hybridization (ISH) or immunohistochemistry (IHC) experiment. The core detection mechanisms—fluorescence and chromogenic enzymatic reactions—each operate on distinct principles, offering unique advantages and limitations that directly impact experimental outcomes. The fluorescence method relies on fluorophores that emit light at specific wavelengths when excited by a light source, while chromogenic detection utilizes enzymatic reactions to deposit colored precipitates at target sites [10]. Understanding these fundamental mechanisms is essential for researchers aiming to generate reliable, reproducible, and interpretable data that effectively addresses their specific research questions.
The choice between these systems extends beyond simple preference; it influences experimental design, required instrumentation, analytical capabilities, and ultimately, the biological conclusions that can be drawn. This application note provides a detailed comparison of these core detection mechanisms, supported by quantitative data, standardized protocols, and practical guidance to inform method selection for research and drug development applications.
Mechanism Comparison and Quantitative Analysis
Core Principles and Technical Specifications
The fundamental difference between these detection methods lies in their signal generation mechanisms. In chromogenic detection, an enzyme (such as Horseradish Peroxidase or Alkaline Phosphatase) conjugated to an antibody catalyzes the conversion of a soluble chromogen into an insoluble, colored precipitate at the target site [11]. This precipitate is visible under standard bright-field microscopy. In contrast, fluorescent detection utilizes fluorophores conjugated to antibodies. When excited by light of a specific wavelength, these fluorophores emit light of a longer wavelength, which is detected using a fluorescence microscope equipped with specific filter sets [10].
Table 1: Core Characteristics of Fluorescence and Chromogenic Detection Methods
| Characteristic | Fluorescence Detection | Chromogenic Detection |
|---|---|---|
| Signal Type | Light emission from excited fluorophores | Insoluble colored precipitate |
| Visualization | Fluorescence microscope with specific filters | Standard bright-field microscope |
| Multiplexing Capacity | High (3+ targets with spectral separation) [12] | Low to Moderate (2-3 targets with color separation) [11] |
| Sensitivity & Dynamic Range | High signal-to-noise ratio; broader, linear dynamic range [13] | Lower dynamic range; non-linear intensity correlation [13] |
| Signal Stability | Prone to photobleaching; fades over time [10] | Highly stable; permanent record [11] [13] |
| Co-localization Analysis | Excellent; precise signal discrimination [12] [10] | Challenging; opaque stains can obscure each other [12] |
| Best For | Multiplexing, co-localization, quantitative measurement | Single targets, clinical pathology, long-term archiving |
Performance Data and Concordance
Studies have demonstrated a high concordance between fluorescence and chromogenic methods when detecting specific genetic alterations, validating the reliability of both techniques. A landmark study comparing fluorescence in situ hybridization (FISH) and chromogenic in situ hybridization (CISH) for determining HER2/neu status in 188 primary breast carcinomas found a 94.1% concordance between the two methods [6]. FISH identified amplification in 24.5% of tumors, while CISH identified it in 22.9% [6]. This high level of agreement confirms that chromogenic methods can be a reliable alternative for many diagnostic and research applications.
More recent advancements in automation have further refined these techniques. Validation of an automated FISH staining platform demonstrated a significant reduction in hands-on time while maintaining high performance, achieving a 98% concordance with manual FISH methods and improving specificity and sensitivity [14]. Furthermore, comparative studies of copy number variation assessment in gliomas have shown that while FISH, Next-Generation Sequencing (NGS), and DNA Methylation Microarray (DMM) are all effective, NGS and DMM exhibit stronger concordance with each other than with traditional FISH for certain parameters, highlighting the context-dependent performance of each method [15].
Detailed Experimental Protocols
Protocol for Chromogenic IHC/ISH Detection
The chromogenic protocol centers on an enzymatic reaction to generate a visible signal. The following procedure is adapted for manual processing but can be automated on platforms like the Ventana Benchmark or Leica BOND-III systems [11] [14].
Procedure:
- Deparaffinization and Rehydration: Incubate formalin-fixed, paraffin-embedded (FFPE) tissue sections at 56-60°C for 20 minutes to melt the paraffin. Immerse slides in xylene (or substitute) followed by a graded series of ethanol (100%, 95%, 70%) and finally purified water.
- Antigen Retrieval: Perform heat-induced epitope retrieval by incubating slides in a pre-warmed target retrieval solution (e.g., citrate buffer, pH 6.0 or EDTA buffer, pH 8.0-9.0) at 92-100°C for 15-20 minutes. Allow slides to cool slowly to room temperature in the buffer [6].
- Permeabilization and Enzyme Digestion (for ISH): For DNA or RNA target retrieval, treat slides with a protease solution (e.g., Pepsin or Proteinase K) at 37°C for 5-30 minutes. The concentration and time must be optimized for each tissue type and probe [6].
- Hybridization (for ISH): Apply a digoxigenin-labeled probe to the tissue section, cover with a coverslip, and denature on a hot plate at 95°C for 5-10 minutes. Transfer slides to a humidified chamber and hybridize at 37°C for 16-24 hours [6].
- Blocking: Rinse slides and apply a protein block (e.g., CAS-Block) for 10 minutes to reduce non-specific background staining.
- Antibody Incubation:
- Primary Antibody: Apply species-specific primary antibody diluted in antibody diluent. Incubate at room temperature for 60 minutes or at 4°C overnight.
- Secondary Antibody: Apply an enzyme-conjugated secondary antibody (e.g., HRP-anti-Ms/Rb) for 30-60 minutes. For ISH, an anti-digoxigenin antibody is used [6].
- Chromogen Reaction: Prepare the chromogen solution according to the manufacturer's instructions. For DAB, this typically involves mixing the chromogen with a hydrogen peroxide substrate. Apply the mixture to the tissue section and incubate for 5-20 minutes, monitoring development under a microscope [11].
- Counterstaining and Mounting: Counterstain with Hematoxylin for 1-5 minutes to visualize nuclei. Dehydrate slides through a graded ethanol series, clear in xylene, and mount with a permanent mounting medium [6].
Protocol for Fluorescent Detection (FISH/IF)
The fluorescent protocol focuses on specific binding and detection of fluorophore-conjugated reagents, requiring minimal light exposure to prevent photobleaching.
Procedure:
- Sample Preparation: Follow Steps 1-4 from the chromogenic protocol for deparaffinization, rehydration, antigen retrieval, and hybridization (if performing FISH).
- Blocking: Incubate tissue sections with a protein block (e.g., 5% normal serum from the secondary antibody host species) for 30 minutes at room temperature.
- Antibody Incubation (for IF):
- Primary Antibody: Apply the primary antibody diluted in antibody diluent. Incubate at room temperature for 60 minutes or at 4°C overnight.
- Secondary Antibody: Apply a fluorophore-conjugated secondary antibody (e.g., Alexa Fluor 488, 555, 647) diluted in antibody diluent. Incubate for 45-60 minutes at room temperature in the dark.
- Post-Hybridization Washes (for FISH): After hybridization, remove coverslips and wash slides in a post-hybridization buffer (e.g., 0.5x Sodium Chloride Citrate) at 72°C for 2-5 minutes to remove unbound probe [6].
- Nuclear Counterstaining and Mounting: Apply a nuclear counterstain such as DAPI (4',6-diamidino-2-phenylindole) for 5-10 minutes in the dark. Rinse and mount slides with an anti-fade mounting medium to preserve fluorescence.
- Storage and Imaging: Store slides at 4°C in the dark. Image as soon as possible using a fluorescence or confocal microscope with appropriate excitation/emission filter sets.
Visualization of Core Mechanisms
The following diagrams illustrate the fundamental signaling pathways for chromogenic and fluorescent detection, highlighting the key steps and components involved in each method.
Chromogenic Detection Mechanism
Fluorescent Detection Mechanism
Experimental Design and Selection Guide
Method Selection Criteria
Choosing between fluorescence and chromogenic detection requires a systematic evaluation of the experimental goals and practical constraints. Researchers should consider the following key questions derived from application needs [12] [10]:
- What is the primary research question? If the goal is to demonstrate the mere presence or absence of a single biomarker, chromogenic IHC is often sufficient and widely accepted. For investigating co-localization of multiple targets within the same cellular compartment, fluorescence is superior due to its ability to discriminate signals without overlap [12] [10].
- How abundant is the target? Chromogenic detection, especially when paired with signal amplification systems like tyramide, can provide high sensitivity for targets of low abundance [11] [10]. Fluorescence also offers high sensitivity with a broader dynamic range for quantification [13].
- What instrumentation is available? Chromogenic detection requires only a standard bright-field microscope, which is nearly universally available. Fluorescence detection necessitates a fluorescence microscope with specific filter sets, which may represent a barrier for some laboratories [12].
- How will the data be analyzed? For qualitative assessment and pathological scoring, chromogenic stains are well-established. For quantitative image analysis (QIA), fluorescence is often preferred due to its linear dynamic range and higher signal-to-noise ratio, although quantitative analysis of chromogenic stains is also possible [13].
- Is sample preservation important? Chromogenic stains are highly stable and provide a permanent record, while fluorescent signals are prone to photobleaching and fade over time, even with anti-fade mounting media [13] [10].
Advanced Applications: Multiplexing and Co-localization
Multiplex assays, which detect multiple biomarkers on the same tissue section, represent a powerful application of both detection methods, albeit with different capabilities. Fluorescent multiplexing is considered a high-plex option, capable of detecting 5 or more targets simultaneously using spectral unmixing techniques [12] [13]. Chromogenic multiplexing is typically a low-plex option (2-3 targets) due to the limited number of distinct chromogen colors that can be visually differentiated [11] [13].
A significant advancement in chromogenic multiplexing is the development of translucent chromogens (e.g., DISCOVERY Purple, Yellow, Teal). Unlike opaque chromogens like DAB that obscure underlying signals, translucent chromogens allow for color mixing when targets co-localize in the same cellular compartment, producing a distinct tertiary color (e.g., purple and yellow yielding a fiery red/orange) [11]. This enables bright-field co-localization studies that were previously only possible with fluorescence.
The Scientist's Toolkit: Research Reagent Solutions
Table 2: Essential Reagents for Detection Methods
| Reagent Type | Specific Examples | Function & Application Notes |
|---|---|---|
| Enzymes for Chromogenics | Horseradish Peroxidase (HRP), Alkaline Phosphatase (AP) | Catalyzes the conversion of soluble chromogens into insoluble precipitates. HRP is more robust and commonly used [11]. |
| Chromogens | DAB (3,3'-Diaminobenzidine), Fast Red, Silver Stain, DISCOVERY Purple/Red/Yellow | The substrate that forms the colored precipitate. DAB is the most common (brown); new narrow-absorbance chromogens aid multiplexing [11]. |
| Fluorophores | Alexa Fluor dyes (488, 555, 647), DAPI, FITC, Cy3, Cy5 | Emit light at specific wavelengths when excited. Must be selected to minimize spectral overlap in multiplexing [13] [10]. |
| Signal Amplification | Tyramide Signal Amplification (TSA), Avidin-Biotin Complex (ABC) | Significantly increases detection sensitivity. TSA creates a covalent, durable deposit of chromogen or fluorophore at the target site [11]. |
| Detection Kits | OmniMap / UltraMap (Roche), VENTANA kits | Pre-optimized reagent systems for automated stainers that ensure consistency and reproducibility in IHC and ISH assays [11]. |
| Probes for ISH | INFORM HER2 DNA Probe, RNAscope Probe Cocktail | Labeled nucleic acid sequences designed to hybridize with specific DNA or RNA targets within the tissue [16] [17]. |
Both fluorescence and chromogenic enzymatic reactions are powerful detection mechanisms that serve as cornerstones of modern biomedical research and diagnostics. The decision between them is not a matter of which is universally better, but which is more appropriate for the specific experimental context. Chromogenic detection offers permanence, accessibility, and ease of interpretation for single-target analysis, making it ideal for many clinical and research applications. Fluorescent detection provides superior capabilities for multiplexing, co-localization studies, and quantitative analysis, albeit with requirements for more specialized equipment and considerations for signal preservation. By understanding the core mechanisms, leveraging the provided protocols, and strategically selecting reagents, researchers can optimally apply these techniques to advance scientific discovery and drug development. Future directions will likely see increased automation, further refinement of translucent chromogens for bright-field multiplexing, and the integration of artificial intelligence to enhance the quantitative analysis of both fluorescence and chromogenic data.
In situ hybridization (ISH) is a foundational technique in molecular biology and diagnostic pathology for detecting specific nucleic acid sequences within fixed cells and tissue sections. The core principle involves hybridizing a complementary, labeled probe to a specific DNA or RNA target, which is then visualized in situ. The choice between its two primary variants—chromogenic ISH (CISH) and fluorescence ISH (FISH—is fundamentally determined by the probe composition, the labeling method, and the subsequent visualization system. Within clinical diagnostics, particularly for determining HER2 status in breast cancer, both CISH and FISH are established methods, with studies showing a concordance rate of 94.1% to 99% between them [6] [7]. This application note details the essential components and provides a standardized protocol for researchers and drug development professionals engaged in this comparative field.
The Scientist's Toolkit: Core Components for ISH
The successful execution of an ISH experiment, whether CISH or FISH, relies on a suite of critical reagents and materials. The table below catalogues these essential components and their functions.
Table 1: Key Research Reagent Solutions for ISH Protocols
| Item Name | Function/Description |
|---|---|
| Formamide | A component of hybridization buffer that helps lower the melting temperature of DNA, allowing for specific hybridization at manageable temperatures [7]. |
| Saline Sodium Citrate (SSC) | A buffer used in hybridization and post-hybridization washes; its concentration and temperature determine the stringency, helping to wash away non-specifically bound probe [18]. |
| Proteinase K | An enzyme used for tissue permeabilization; it digests proteins to enhance probe access to the target nucleic acids [19] [20]. |
| Paraformaldehyde | A common fixative used to preserve tissue architecture and nucleic acid integrity by cross-linking proteins [18]. |
| Bovine Serum Albumin (BSA) / Casein | Blocking agents used to reduce non-specific binding of probes or antibodies, thereby lowering background signal [18]. |
| Digoxigenin (DIG) | A hapten commonly used for non-radioactive probe labeling in CISH; it is detected by an enzyme-conjugated anti-DIG antibody [19] [20]. |
| Fluorescein (FITC) | A fluorophore used for direct or indirect labeling in FISH assays [7] [20]. |
| Anti-DIG-AP Fab Fragments | An antibody fragment conjugated to Alkaline Phosphatase (AP) enzyme; it binds to DIG-labeled probes for colorimetric detection in CISH [19]. |
| NBT/BCIP | A chromogenic substrate for AP; it produces a purple-blue precipitate at the probe binding site [19]. |
| DAPI (4',6-diamidino-2-phenylindole) | A fluorescent stain that binds to DNA, used as a nuclear counterstain in FISH [7] [18]. |
Probe Design and Labeling Strategies
Probes are the core of any ISH assay, and their characteristics directly impact sensitivity, specificity, and signal clarity.
Probe Types
The selection of probe type involves a trade-off between sensitivity, ease of production, and penetration efficiency.
- Double-stranded DNA (dsDNA) probes are generated via nick translation or PCR with labeled nucleotides. While suitable for abundant targets, their tendency to self-anneal can reduce the effective probe concentration available for target hybridization, resulting in lower sensitivity [20].
- Single-stranded DNA (ssDNA) probes, produced by reverse transcription PCR or chemical synthesis, offer higher sensitivity as they avoid self-annealing. Their production is straightforward, requiring minimal starting material [20].
- Single-stranded RNA (riboprobes) are produced by in vitro transcription. They are thermally stable and do not self-anneal, facilitating deeper penetration into tissues and making them ideal for high-sensitivity detection [20].
- Oligonucleotide probes are short (20-50 base) sequences produced by automated chemical synthesis. Their small size aids in tissue penetration, but their limited target coverage often necessitates using a probe mixture complementary to different regions of the target to enhance sensitivity [20].
Labeling Methods
Probe labeling can be achieved through various methods, categorized as radioactive or non-isotopic.
- Radioisotope labeling (e.g., ³²P, ³⁵S) offers high sensitivity but has declined in use due to safety concerns and long exposure times [20].
- Non-isotopic labeling is now the standard. Key haptens include:
- Biotin: Detected with enzyme-conjugated streptavidin.
- Digoxigenin (DIG): A plant-derived hapten detected with an enzyme-conjugated anti-DIG antibody, widely used for its low background in CISH [19] [20].
- Fluorescein: Can be used as a hapten for enzymatic detection or directly as a fluorophore in FISH [7] [20].
Table 2: Comparison of Probe Types for ISH
| Probe Type | Typical Length | Key Advantages | Key Disadvantages |
|---|---|---|---|
| Double-stranded DNA | Variable | Suitable for abundant targets; simple production. | Lower sensitivity; prone to self-annealing. |
| Single-stranded DNA | 200-500 bp | Higher sensitivity; no self-annealing. | Requires PCR or synthesis. |
| Single-stranded RNA | >100 bp | High sensitivity and specificity; RNase resistant. | Sensitive to RNase degradation during handling. |
| Oligonucleotide | 20-50 bp | Easy tissue penetration; highly specific. | Limited target coverage; may require a probe pool. |
Visualization Systems: CISH vs. FISH
The divergence between CISH and FISH occurs at the visualization stage, each with distinct workflows and instrumentation.
Chromogenic ISH (CISH)
CISH utilizes an immunohistochemistry-like peroxidase reaction for detection [6] [5]. A probe labeled with a hapten (e.g., DIG) is hybridized to the target. It is then detected with an antibody conjugated to an enzyme, typically Horseradish Peroxidase (HRP) or Alkaline Phosphatase (AP). The enzyme catalyzes a reaction with a chromogenic substrate, such as DAB (which produces a brown precipitate) or NBT/BCIP (which produces a blue-purple precipitate) [19] [18]. The results are permanent and can be viewed with a standard bright-field light microscope, allowing for easy correlation with tissue morphology [6].
Fluorescence ISH (FISH)
FISH relies on probes that are directly tagged with fluorophores (e.g., TexasRed, FITC) or indirectly labeled with haptens that are then detected with fluorescently labeled antibodies [7] [20]. The signals are visualized as distinct spots of light using a fluorescence microscope equipped with specific filter sets. While FISH is highly sensitive and allows for multiplexing (detecting multiple targets simultaneously with different colored fluorophores), the signals can fade over time and require a specialized microscope [21] [20].
The following diagram illustrates the core logical relationship and workflow differences between CISH and FISH.
Detailed Experimental Protocol for Chromogenic ISH
The following is a generalized CISH protocol, adaptable for DNA or RNA target detection.
Sample Preparation and Pre-Hybridization
- Fixation: Fix tissue samples in 10% neutral buffered formalin or 4% Paraformaldehyde (PFA) for 24 hours and 4 hours, respectively [20] [19].
- Sectioning and Dewaxing: For formalin-fixed, paraffin-embedded (FFPE) tissues, cut 3-5 μm sections. Deparaffinize in xylene and rehydrate through a graded ethanol series to water [18].
- Permeabilization: Treat slides with Proteinase K (e.g., 10 μg/mL for 5-30 minutes at 37°C) to digest proteins and allow probe penetration. Optimization of time and concentration is critical to avoid over- or under-digestion [19] [20].
- Pre-hybridization Blocking: Incubate sections in a pre-hybridization buffer (e.g., containing formamide, SSC, blocking agents like Denhardt's solution or salmon sperm DNA) for 30-60 minutes at 37-45°C to reduce non-specific binding [18].
Hybridization and Stringency Washes
- Probe Denaturation: Denature the labeled probe (e.g., DIG-labeled DNA probe) at 95°C for 5 minutes and immediately place on ice [18].
- Hybridization: Apply the denatured probe in hybridization buffer to the tissue section. Cover with a coverslip and incubate in a humidified chamber overnight (16-24 hours) at 37°C [19] [18].
- Stringency Washes: Remove coverslips and wash slides to remove unbound probe.
Chromogenic Detection
- Blocking: Incubate slides in a blocking solution (e.g., MaBl/2% Boehringer Blocking Reagent) for at least 2 hours at room temperature to prevent non-specific antibody binding [19].
- Antibody Incubation: Apply anti-DIG-AP Fab fragments (diluted 1:6000 in blocking solution) and incubate overnight at 4°C or for 1-2 hours at room temperature [19].
- Signal Development: Wash slides and incubate with the AP substrate NBT/BCIP in AP buffer. Monitor the development of the blue-purple precipitate under a microscope. Stop the reaction by washing with PBST once the desired signal-to-noise ratio is achieved (minutes to hours) [19].
- Counterstaining and Mounting: Counterstain lightly with hematoxylin (nuclear stain), dehydrate, clear in xylene, and mount with a permanent mounting medium [6] [19].
Performance Data and Comparative Analysis
In the context of HER2 testing for breast cancer, CISH has been validated against the traditional gold standard, FISH. The table below summarizes quantitative data from key comparative studies.
Table 3: Concordance Studies Between FISH and CISH in HER2 Testing
| Study Cohort (IHC Status) | Number of Cases | FISH vs. CISH Concordance | Notes | Source |
|---|---|---|---|---|
| IHC 0/1+ (Negative) | 69 | 97% (67/69) | Two discordant cases; 69/69 non-amplified by FISH. | [5] |
| IHC 3+ (Positive) | 50 | 98% (49/50) | One discordant case; three IHC 3+ cases were non-amplified by both (IHC false positives). | [5] |
| IHC 2+ (Equivocal) | 135 | 93% (126/135) | Discordant cases typically had very low or borderline amplification with FISH. | [5] |
| Mixed Cohort | 188 | 94.1% (177/188) | HER2/neu amplification associated with aggressive tumor features. | [6] |
| Mixed Cohort | 95 | 99% (94/95) | High concordance supported by a Cohen κ coefficient of 0.97. | [7] |
The selection of probes, labels, and visualization systems dictates the success of any ISH-based assay. CISH, with its bright-field microscopy requirements and permanent slides, offers a practical and cost-effective alternative to FISH, especially for high-throughput diagnostic environments like HER2 testing in breast cancer [7] [6]. The documented high concordance between the two methods underscores the reliability of CISH. The choice between them should be guided by the specific application's need for multiplexing, required resolution, available instrumentation, and workflow integration. The protocols and data presented herein provide a robust framework for researchers and clinicians to implement and critically evaluate these essential techniques.
In situ hybridization (ISH) is a cornerstone technique in molecular biology and diagnostic pathology, enabling the precise localization of specific DNA or RNA sequences within cells, tissue sections, or chromosomes. By using complementary nucleotide probes, ISH allows researchers and clinicians to visualize the spatial organization of genetic material in its biological context. The two predominant variants of this technique are fluorescence in situ hybridization (FISH) and chromogenic in situ hybridization (CISH). While FISH employs fluorescently labeled probes detected with a fluorescence microscope, CISH utilizes enzyme-conjugated probes that produce a permanent, precipitating chromogenic signal visible under a standard bright-field microscope [9] [5].
The choice between CISH and FISH involves critical trade-offs. This Application Note provides a detailed comparison of these methodologies, framed within the context of a broader thesis comparing chromogenic and fluorescent in situ hybridization. It offers structured quantitative data, detailed experimental protocols for key applications, and clear visual workflows to guide researchers, scientists, and drug development professionals in selecting and implementing the optimal ISH strategy for their needs.
Technical Comparison: CISH vs. FISH
Understanding the fundamental differences between CISH and FISH is essential for selecting the appropriate method. The table below summarizes the core technical and practical distinctions that impact their application in research and diagnostics.
Table 1: Core Technical and Practical Distinctions Between CISH and FISH
| Feature | Chromogenic In Situ Hybridization (CISH) | Fluorescence In Situ Hybridization (FISH) |
|---|---|---|
| Signal Detection | Chromogenic precipitation (e.g., DAB, Fast Red) [22] | Fluorescence emission [7] |
| Microscope Required | Standard bright-field light microscope [9] [5] | Fluorescence microscope with specific filter sets [9] |
| Permanence of Signal | Permanent, stable for long-term archiving [5] | Fades over time; requires anti-fade mounting media |
| Tissue Morphology | Easily correlated with H&E stained serial sections [7] | More challenging to correlate with tissue morphology |
| Throughput & Speed | Faster scanning (e.g., ~29 sec/mm² reported) [7] | Slower scanning (e.g., ~764 sec/mm² reported) [7] |
| Multiplexing Potential | Lower, typically 1-2 targets [22] | High, multiple targets with different fluorophores |
| DNA Denaturation | Often requires global DNA denaturation (heat/formamide) [9] | Can be bypassed in methods like CRISPR-FISH/CISH [9] |
Diagnostic Concordance and Performance
A critical measure for adopting any new diagnostic method is its concordance with the established gold standard. In the context of HER2 testing in breast cancer, multiple studies have validated CISH against FISH.
Table 2: Diagnostic Concordance Between FISH and CISH in HER2 Testing
| IHC Patient Group | Number of Cases | Concordance Between FISH and CISH | Notes |
|---|---|---|---|
| IHC Negative (0/1+) | 69 | 97% (67/69 non-amplified by both) [5] | 2 discordant cases |
| IHC Positive (3+) | 50 | 98% (46/47 amplified by both) [5] | 3 IHC false-positives; 1 FISH/CISH discordant |
| IHC Equivocal (2+) | 135 | 93% (89 non-amplified, 37 amplified by both) [5] | Discordant cases had very low/borderline FISH amplification |
| Overall (across groups) | 95 | 99% (κ = 0.9664) [7] | Based on mean HER2 ratio from 5 different genetic assays |
Experimental Protocols
This section provides detailed methodologies for a conventional CISH protocol and an emerging CRISPR-based CISH technique.
Detailed Protocol: Conventional CISH for Formalin-Fixed, Paraffin-Embedded (FFPE) Tissue
The following protocol is adapted for FFPE breast cancer tissue sections for the detection of HER2 gene amplification, a key diagnostic application [7] [5].
The Scientist's Toolkit: Key Reagents for CISH
- Probes: Dual-color DNA probes (e.g., HER2 gene probe and CEN17 centromere reference probe). The centromeric probe can be a DNA or a peptide nucleic acid (PNA) for better binding affinity [7].
- Formamide: A key component of the hybridization buffer that denatures DNA by breaking hydrogen bonds [19].
- 20x SSC Buffer: Saline-sodium citrate buffer used for post-hybridization washes to control stringency [19].
- Pepsin or Proteinase K: Enzymes used for digesting proteins to permeabilize the tissue and allow probe access [7] [19].
- Anti-Digoxigenin-AP Fab Fragments: An antibody conjugate that binds to digoxigenin-labeled probes. Coupled with alkaline phosphatase (AP) [19].
- NBT/BCIP: A chromogenic substrate for alkaline phosphatase that produces a permanent blue/purple precipitate [19]. Fast Red is an alternative chromogen that produces a red precipitate [22].
Workflow:
Procedure:
- Sample Preparation: Cut 3-6 μm thick sections from FFPE tissue blocks and mount on charged slides. Deparaffinize and rehydrate the sections through a series of xylene and graded ethanol washes [22].
- Antigen Retrieval: Perform heat-induced epitope retrieval in a suitable buffer (e.g., citrate or EDTA buffer) using a pressure cooker or water bath to unmask target sequences.
- Permeabilization: Treat slides with a pepsin solution (e.g., for 8 minutes at room temperature) to digest proteins and allow probe penetration [7].
- Denaturation and Hybridization: Apply the dual-color CISH probe mixture to the tissue. Co-denature the probe and target DNA simultaneously at 80°C for 5 minutes, followed by an overnight hybridization at 37-45°C in a humidified chamber [7].
- Post-Hybridization Washes: Wash slides with a pre-warmed stringency buffer (e.g., 0.5x SSC) to remove any non-specifically bound probe.
- Signal Detection: Block nonspecific binding sites with a blocking reagent (e.g., MaBl). Incubate with an anti-digoxigenin antibody conjugated to alkaline phosphatase (e.g., 1:6000 dilution). Develop the signal with NBT/BCIP (yields a blue/purple signal) or Fast Red (yields a red signal) [19] [22].
- Counterstaining and Analysis: Counterstain lightly with hematoxylin, which stains nuclei blue. Mount the slides and analyze under a bright-field microscope. Gene amplification is assessed by counting the number of gene signals (e.g., HER2) relative to the centromere reference signals (e.g., CEN17) per nucleus [7] [5].
Detailed Protocol: CRISPR-CISH for DNA Repeat Detection
CRISPR-CISH is a novel method that combines the programmability of CRISPR/Cas9 with chromogenic detection. It does not require global DNA denaturation, thus better preserving chromatin structure [9] [23].
The Scientist's Toolkit: Key Reagents for CRISPR-CISH
- dCas9 (dead Cas9): A catalytically inactive Cas9 protein that binds DNA but does not cut it. Often produced recombinantly with a hexahistidine tag for purification [9].
- crRNA (CRISPR RNA): A target-specific RNA that guides the dCas9 to the DNA sequence of interest.
- tracrRNA (trans-activating crRNA): A universal RNA that hybridizes with crRNA to form a mature guide RNA (gRNA). For CRISPR-CISH, the tracrRNA is labeled at the 3' end with biotin [9].
- Streptavidin-HRP or -AP: Enzyme conjugates that bind to the biotin on the tracrRNA. Horseradish peroxidase (HRP) or alkaline phosphatase (AP) then catalyze a chromogenic reaction [9].
- Chromogenic Substrates: DAB (for HRP, yields a brown precipitate) or NBT/BCIP (for AP, yields a blue/purple precipitate).
Workflow:
Procedure:
- Sample Preparation: Prepare metaphase chromosomes or nuclei from the target species (e.g., mouse, plant) using standard cytogenetic methods, including fixation with ethanol:acetic acid (3:1) [9].
- gRNA and RNP Complex Formation: Synthesize the target-specific crRNA. Hybridize it with the universal 3'-biotin-labeled tracrRNA to form a mature guide RNA (gRNA). Then, incubate the gRNA with the purified dCas9 protein to form the ribonucleoprotein (RNP) complex [9].
- Hybridization: Apply the RNP complex directly to the fixed sample on a glass slide. Incubate for 30-60 minutes at 37°C. Unlike conventional CISH, this step does not require high-temperature or formamide-induced DNA denaturation [9].
- Washing: Gently wash the slide to remove any unbound RNP complex.
- Signal Detection and Amplification: Apply streptavidin conjugated to HRP or AP, which binds to the biotin on the tracrRNA. Detect the bound enzyme with a suitable chromogenic substrate, such as DAB for HRP or NBT/BCIP for AP [9].
- Counterstaining and Analysis: Counterstain with an appropriate dye (e.g., nuclear fast red) to visualize cellular and chromosomal morphology. Analyze the slides under a bright-field microscope for the presence of localized chromogenic signals [9].
Advanced Techniques and Future Directions
The field of in situ hybridization is continuously evolving, with innovations aimed at improving sensitivity, multiplexing, and accessibility.
Signal Amplification and Sensitivity: Techniques like RNA Scope, PLISH, and SABER have been developed with significant improvements in accuracy and sensitivity for detecting low-abundance targets [24]. These methods often involve branched DNA probes or primer-based amplification to enhance the signal, pushing the boundaries of what is detectable.
Computational and AI-Assisted Analysis: The analysis of FISH images, particularly in complex spatial-omics datasets, has been revolutionized by deep learning tools. U-FISH is a recently developed deep learning method that acts as a universal spot detector. It transforms raw FISH images with variable backgrounds and signal intensities into enhanced, uniform images, enabling reliable spot detection without manual parameter tuning [25]. Trained on a massive dataset of over 4000 images and 1.6 million signal spots, U-FISH has demonstrated superior accuracy (F1 score ~0.924) and generalizability compared to other methods. Its compact size (163k parameters) allows for efficient processing, and its integration with large language models (LLMs) paves the way for AI-assisted FISH diagnostics [25].
Regulatory Landscape: The standardization and regulation of ISH-based tests are crucial for clinical diagnostics. The U.S. Food and Drug Administration (FDA) has classified FISH-based tests for detecting chromosomal abnormalities in patients with hematologic malignancies as class II medical devices with special controls [26]. This classification provides a regulatory framework that ensures reasonable assurance of safety and effectiveness while facilitating patient access to these beneficial tests.
Both CISH and FISH are powerful techniques for the in situ localization of nucleic acids, each with distinct advantages. FISH remains the gold standard for multiplexing and is widely used in research and clinical cytogenetics. However, CISH presents a compelling alternative, particularly for high-throughput diagnostic applications like HER2 testing, due to its use of standard bright-field microscopy, permanent slides, and easier correlation with tissue morphology. The high concordance between CISH and FISH, often exceeding 95-99%, validates CISH as a reliable and viable alternative within the diagnostic testing algorithm [7] [5].
The emergence of novel technologies like CRISPR-CISH, which simplifies the hybridization process and preserves native chromatin structure, and AI-powered analysis tools like U-FISH, which automates and standardizes signal detection, points toward a future of more accessible, robust, and highly sensitive in situ hybridization applications. The choice between CISH and FISH, therefore, depends on a balanced consideration of the specific research or diagnostic question, available infrastructure, and the required throughput.
Historical Context and Technological Evolution of ISH
In situ hybridization (ISH) is a powerful technique that allows for the precise localization of specific nucleic acid sequences within cells or tissue sections. This method has revolutionized molecular pathology and diagnostics by enabling the visualization of genetic alterations in their morphological context. The core principle involves the use of labeled complementary DNA or RNA probes to hybridize and detect specific DNA or RNA sequences within a biological sample. The evolution of ISH from its initial radioactive formats to modern chromogenic and fluorescent methods represents a significant technological advancement, driven by the parallel progress in molecular biology, microscopy, and detection chemistry. This document details the application notes and protocols central to a thesis comparing Chromogenic In Situ Hybridization (CISH) and Fluorescence In Situ Hybridization (FISH).
Historical Context and Technological Evolution
The history of technology, at its core, is the development over time of systematic techniques for making and doing things, a process that is deeply embodied in the evolution of ISH [27]. This evolution displays a form of combinatorial process, where newer technologies are built from the combination and refinement of older ones [28].
The earliest nucleic acid hybridization techniques, predecessors to ISH, relied on radioactive isotopes for detection. While highly sensitive, these methods posed significant safety hazards, required specialized facilities, and offered limited spatial resolution due to the scattering of radiation during signal detection. The pivotal transition began with the development of non-radioactive labeling and detection systems.
The invention of FISH in the 1980s marked a major breakthrough. By using fluorophore-labeled probes, FISH allowed for the simultaneous detection of multiple genetic targets through different fluorescent colors, a significant advantage over monochromatic radioisotopes [7]. However, FISH required expensive fluorescence microscopy, was prone to signal fading, and made it difficult to correlate genetic results with traditional histopathology.
The subsequent development of CISH addressed several of these limitations. CISH utilizes enzyme-based immunohistochemical detection, producing a permanent, colored chromogenic precipitate that can be viewed with a standard bright-field light microscope [5]. This innovation combined the genetic testing capability of FISH with the familiar workflow and morphology assessment of routine clinical immunohistochemistry, simplifying its integration into diagnostic pathology laboratories. The trajectory of ISH technology—from radioactive probes to FISH and CISH—exemplifies the cumulative nature of technological progress, where each new iteration builds upon and refines the last to better serve social and clinical needs [27] [28].
Experimental Protocols for Key ISH Assays
Protocol for Dual-Color FISH (e.g., HER2 Testing)
This protocol is adapted from methods used in comparative studies and follows established guidelines for HER2 FISH testing [7].
1. Sample Preparation:
- Use formalin-fixed, paraffin-embedded (FFPE) tissue sections cut at 4-5 µm thickness.
- Mount sections on positively charged adhesive slides and dry overnight at room temperature or for 1 hour at 60°C.
2. Deparaffinization and Hydration:
- Deparaffinize slides in xylene (3 changes, 10 minutes each).
- Hydrate through a graded ethanol series (100%, 95%, 70%; 2 minutes each).
- Rinse in deionized water.
3. Pretreatment and Protease Digestion:
- Immerse slides in a pre-warmed citrate-based target retrieval solution (e.g., 10 mM Citrate Buffer, pH 6.0).
- Heat in a steamer or water bath at 95-99°C for 15-40 minutes. Cool slides for 20 minutes at room temperature.
- Rinse with deionized water, then with wash buffer (e.g., 2x Saline-Sodium Citrate, SSC).
- Treat slides with a ready-to-use pepsin solution (0.5-1.0 mg/mL in HCl) for 8-15 minutes at 37°C to digest proteins and expose target DNA.
- Rinse with wash buffer and dehydrate through an ethanol series (70%, 85%, 100%; 2 minutes each). Air dry.
4. Probe Hybridization:
- Apply the dual-color FISH probe mix (e.g., HER2 SpectrumRed/Orange and CEP17 SpectrumGreen) to the target area.
- Seal the hybridized area with a coverslip using rubber cement.
- Co-denature the probe and target DNA simultaneously on a heated thermal cycler or hybridizer at 82-85°C for 5-10 minutes.
- Incubate slides in a humidified chamber at 37-45°C for 12-20 hours for hybridization.
5. Post-Hybridization Washing:
- Remove the coverslip and immerse slides in a stringent wash solution (e.g., 0.4x SSC/0.3% NP-40) at 72-75°C for 2-5 minutes.
- Rinse in room temperature wash buffer (e.g., 2x SSC/0.1% NP-40) for 1 minute. Air dry in darkness.
6. Counterstaining and Mounting:
- Apply a fluorescence-compatible counterstain and antifade mounting medium containing 4',6-diamidino-2-phenylindole (DAPI) to each slide.
- Apply a coverslip and seal. Store slides at -20°C or 4°C in the dark until analysis.
7. Analysis:
- Score signals using a fluorescence microscope equipped with appropriate filter sets (DAPI, FITC, Texas Red/Rhodamine).
- Count at least 60 non-overlapping interphase nuclei from the invasive tumor component.
- Calculate the HER2/CEP17 ratio. A ratio of ≥2.2 is considered amplified, <1.8 is non-amplified, and 1.8-2.2 is equivocal, per ASCO/CAP guidelines [7].
Protocol for Dual-Color CISH (e.g., HER2 Testing)
This protocol, validated against FISH, allows for bright-field microscopy analysis [5].
1. Sample Preparation, Deparaffinization, and Hydration:
- Identical to steps 3.1.1 and 3.1.2.
2. Pretreatment and Protease Digestion:
- Identical to step 3.1.3. Note: The pepsin digestion time of 8 minutes at room temperature has been successfully used in comparative studies [7].
3. Probe Denaturation and Hybridization:
- Apply the dual-color CISH probe mix (e.g., HER2 labeled with Digoxigenin/DNP and CEP17 labeled with Biotin) to the target area.
- Seal with a coverslip and rubber cement.
- Co-denature the probe and target DNA on a thermal cycler at 95-100°C for 5-10 minutes.
- Hybridize in a humidified chamber at 37-45°C for 12-20 hours.
4. Stringency Washing:
- Remove coverslips and wash slides in a stringent wash solution (e.g., 0.5x SSC) at 75-80°C for 5-10 minutes.
- Rinse with wash buffer (e.g., TBS/Tween 20) at room temperature.
5. Immunodetection:
- Blocking: Apply a protein block (e.g., casein or BSA in TBS) for 5-10 minutes at room temperature to reduce non-specific binding.
- HER2 Signal Detection: Apply a mouse anti-Digoxigenin/DNP primary antibody, followed by a horseradish peroxidase (HRP)-conjugated anti-mouse secondary antibody. Incubate each for 30-60 minutes at room temperature. Visualize with a red chromogen (e.g., Fast Red).
- CEP17 Signal Detection: Apply an AP-conjugated streptavidin secondary antibody for 30-60 minutes at room temperature. Visualize with a blue chromogen (e.g., BCIP/NBT).
- Rinse with wash buffer between each antibody step.
6. Counterstaining and Mounting:
- Counterstain lightly with hematoxylin.
- Rinse in deionized water, air dry for 30 minutes (avoiding xylene/ethanol to preserve faint signals [7]), and mount with a permanent mounting medium.
7. Analysis:
- Score signals using a standard bright-field microscope.
- Count at least 60 non-overlapping interphase nuclei from the invasive tumor area.
- Calculate the HER2/CEP17 ratio using the same cut-offs as FISH. The presence of large gene copy clusters is also a strong indicator of amplification [5].
Comparative Data Analysis
The following tables summarize key quantitative and qualitative data from comparative studies of CISH and FISH.
Table 1: Analytical Performance Comparison of HER2 Genetic Assays [7]
| Assay Characteristic | Dako FISH | Dako IQFISH | Dako CISH | ZytoVision FISH | ZytoVision CISH |
|---|---|---|---|---|---|
| Probe Type (Gene) | DNA | DNA | DNA | DNA (Repeat-free) | DNA |
| Probe Type (CEN17) | PNA | PNA | PNA | DNA | DNA |
| Gene Label Color | TexasRed | TexasRed | Red | FITC | Green |
| CEN17 Label Color | FITC | FITC | Blue | Rhodamine | Red |
| Visualization | Fluorescence | Fluorescence | Chromogenic | Fluorescence | Chromogenic |
| Blocking Reagent | alu-PNA | alu-PNA | alu-PNA | Not Required | Not Required |
| Hybridization Time | ~16-20 hrs | ~4 hrs | ~16-20 hrs | ~16-20 hrs | ~16-20 hrs |
Table 2: Concordance Study Results Between FISH and CISH [5]
| Patient Group (by IHC) | Number of Cases | Concordance Rate | Notes / Discordance Explanation |
|---|---|---|---|
| IHC 0/1+ (Negative) | 69 | 97% (67/69) | 2 cases discordant; 69/69 non-amplified by FISH |
| IHC 3+ (Positive) | 50 | 98% (46/50 FISH amp, 47/50 CISH amp) | 1 case discordant; 3 cases false-positive by IHC |
| IHC 2+ (Equivocal) | 135 | 93% (126/135) | 9 discordant cases had low/borderline FISH amplification |
| Overall Concordance | 254 | 95% (241/254) | Cohen κ coefficient: 0.9664 (excellent agreement) |
Table 3: Practical Workflow Comparison for Diagnostic Laboratories
| Parameter | Fluorescence ISH (FISH) | Chromogenic ISH (CISH) |
|---|---|---|
| Microscopy Requirements | Specialized fluorescence microscope with specific filters | Standard bright-field light microscope |
| Permanence of Signal | Prone to photobleaching; temporary | Permanent; does not fade |
| Morphology Correlation | Difficult; requires serial H&E staining for morphology | Easy; simultaneous viewing of signal and tissue morphology |
| Scanning & Throughput | Slow (e.g., 764 sec/mm² with z-stacking) [7] | Fast (e.g., 29 sec/mm²) [7] |
| Assay Time (Conventional) | ~2 days | ~2 days |
| Assay Time (Rapid) | IQFISH: ~4 hours [7] | Not commonly available |
| Multiplexing Potential | High (multiple colors) | Limited (typically 2 colors) |
Signaling Pathways and Workflow Visualizations
Diagram 1: Core ISH experimental workflow.
Diagram 2: CISH immunodetection and signal visualization.
The Scientist's Toolkit: Research Reagent Solutions
Table 4: Essential Reagents and Kits for ISH
| Item | Function / Description | Example Use Case |
|---|---|---|
| Dual-Color FISH Probe Kit | Pre-mixed DNA probes for target gene (e.g., HER2) and reference centromere (e.g., CEP17), labeled with different fluorophores. | Determining HER2 gene amplification status in breast cancer [7]. |
| Dual-Color CISH Probe Kit | Pre-mixed DNA probes for target and reference, labeled with haptens (e.g., DIG, DNP, Biotin) for chromogenic detection. | Bright-field, permanent assessment of HER2 status [5]. |
| Pepsin Solution | Proteolytic enzyme used to digest proteins, providing access to target nucleic acids in tissue. | Standard pre-treatment step for both FISH and CISH on FFPE tissue [7]. |
| Formamide-Free Hybridization Buffer (e.g., for IQFISH) | A polar aprotic solvent (e.g., ethylene carbonate) that replaces formamide to destabilize DNA, drastically reducing hybridization time. | Rapid FISH testing, reducing assay time from 2 days to 4 hours [7]. |
| Chromogenic Substrate (Fast Red/BCIP-NBT) | Enzyme substrates that produce a colored precipitate upon reaction with HRP (red) or Alkaline Phosphatase (blue). | Visualizing probe signals in CISH for single or dual-color analysis [7] [5]. |
| Fluorophore-Conjugated Antibodies & Antifade Mountant | Antibodies specific to probe haptens, conjugated to fluorophores. Antifade medium preserves fluorescence. | Detecting and preserving signals in FISH for microscopy [7]. |
| Stringent Wash Buffer | A buffer with precise salt concentration and temperature control to remove nonspecifically bound probes. | Critical post-hybridization step to ensure signal specificity in both FISH and CISH [7] [5]. |
Strategic Implementation: Choosing the Right Method for Your Application
Within molecular pathology, in situ hybridization (ISH) serves as a cornerstone technique for detecting specific DNA sequences in tissue samples. This article details the application of two principal ISH methodologies—Fluorescence ISH (FISH) and Chromogenic ISH (CISH)—in two critical diagnostic areas: determining HER2 status in breast cancer and 1p/19q co-deletion status in glioma. The choice between these techniques involves a careful consideration of factors including accuracy, throughput, cost, and integration into routine workflow. FISH, long considered the gold standard, offers high sensitivity and specificity but requires specialized and costly fluorescence microscopy. CISH has emerged as a practical alternative, enabling visualization of gene amplification using a standard bright-field microscope, thereby permitting easier correlation with tissue morphology. The following protocols and data provide a framework for the reliable implementation of these techniques in a clinical diagnostics setting.
HER2 Status in Breast Cancer
Clinical Significance
Amplification of the HER2 (human epidermal growth factor receptor 2) gene and overexpression of its protein product occur in approximately 15-20% of breast cancers and are important prognostic and predictive biomarkers [29] [30]. HER2-positive status is associated with more aggressive disease but also predicts response to targeted anti-HER2 therapies such as trastuzumab (Herceptin), making accurate assessment crucial for patient management [29] [31].
Comparative Performance Data
Studies consistently demonstrate a high concordance between CISH and FISH for detecting HER2 amplification, establishing CISH as a viable diagnostic tool.
Table 1: Concordance between CISH and FISH for HER2 Testing in Breast Cancer
| Study | Sample Size | Concordance | Sensitivity of CISH | Specificity of CISH | Key Findings |
|---|---|---|---|---|---|
| Sáez et al. (2006) [32] | 200 cases | 94.8% | 97.5% | 94% | Excellent interobserver agreement (97.5%) for CISH. |
| Dufour et al. (2013) [7] | 95 cases | 99% | N/R | N/R | High concordance supported by Cohen’s κ coefficient of 0.97. |
| Tanner et al. (2000) [31] | 38 cases | 100% | N/R | N/R | CISH and FISH results were fully concordant in discrepant cases. |
N/R: Not Reported
Immunohistochemistry (IHC) is often used as an initial screening test for HER2 protein expression. However, a 2022 study highlighted significant discrepancies between IHC and the more definitive FISH assay. The study found that while IHC identified 81.8% of samples as equivocal (IHC 2+), FISH reclassification showed 47.7% were positive and 52.3% were negative, underscoring the necessity of ISH testing for definitive results, particularly in IHC-equivocal cases [29].
Detailed Protocol: HER2 Testing by CISH
Title: HER2 CISH Protocol for Breast Cancer Application: Detection of HER2 gene amplification in formalin-fixed, paraffin-embedded (FFPE) breast cancer tissue sections. Principle: A digoxigenin-labeled HER2 DNA probe hybridizes to its target sequence within the nucleus. The hybridization is detected using an enzyme-conjugated antibody against digoxigenin and a chromogenic substrate, resulting in a visible color precipitate.
Materials & Reagents:
- FFPE tissue sections (4-5 μm thickness)
- HER2 DNA probe (e.g., Zymed)
- Hybridization buffer
- Pepsin solution for antigen retrieval
- Primary Anti-Digoxigenin-Peroxidase antibody
- DAB (3,3'-diaminobenzidine) chromogen substrate (produces a brown precipitate)
- Hematoxylin counterstain
Procedure:
- Deparaffinization and Hydration: Bake slides, then deparaffinize in xylene and hydrate through a graded ethanol series to water.
- Pretreatment and Proteolytic Digestion:
- Denaturation and Hybridization:
- Apply the HER2 DNA probe to the tissue section.
- Co-denature the probe and target DNA at 95°C for 5-10 minutes.
- Hybridize overnight in a humidified chamber at 37°C.
- Post-Hybridization Washes:
- Wash stringently with a saline-sodium citrate (SSC) buffer to remove unbound probe.
- Immunodetection:
- Counterstaining and Mounting:
- Counterstain lightly with hematoxylin to visualize cell nuclei.
- Dehydrate, clear, and mount slides with a permanent mounting medium.
Interpretation:
- Non-amplified (Negative): 1-2 distinct brown signals per nucleus, or small clusters (up to 4-5 signals) in cases of aneuploidy [31].
- Amplified (Positive): Large gene copy clusters or numerous individual signals (typically >6-10) in the nucleus [31].
1p/19q Co-deletion in Glioma
Clinical Significance
Co-deletion of the entire arms of chromosomes 1p and 19q is a defining genetic hallmark of oligodendroglioma and is associated with a better prognosis and increased sensitivity to chemotherapy and radiotherapy [33] [34]. It is critical to distinguish this whole-arm co-deletion, which results from an unbalanced translocation, from partial deletions of 1p and 19q, which lack the same diagnostic and prognostic significance [33].
Technical Considerations and Limitations of FISH
While FISH is a widely used method for detecting 1p/19q co-deletion, it has a critical limitation: it cannot distinguish whole-arm from partial deletions. FISH probes typically cover only small, specific regions of 1p36 and 19q13 (approximately 0.4-1.5% of the chromosome arms) [33]. A deletion detected by these probes is reported as a positive "codeletion," even if the rest of the chromosome arm is intact.
Table 2: False-Positive FISH 1p/19q Co-deletion in Diffuse Astrocytic Gliomas
| Parameter | Finding |
|---|---|
| Estimated False-Positive Rate | 3.6% (8/223 cases) [33] |
| Cause of False Positive | Partial deletions of 1p and/or 19q that are called positive by FISH [33] |
| Rate in IDH-mutant tumors | 4.6% (4/86 cases) [33] |
| Rate in IDH-wildtype tumors | 2.9% (4/137 cases) [33] |
| Recommended Solution | Use of chromosomal microarray (CMA), array CGH, or NGS to discriminate partial from whole-arm deletions [33] |
Detailed Protocol: 1p/19q Testing by FISH
Title: 1p/19q FISH Protocol for Glioma Application: Detection of 1p and 19q chromosomal deletions in FFPE glioma tissue sections. Principle: Dual-probe hybridization using locus-specific probes for 1p36/19q13 (labeled in SpectrumOrange) and control probes for 1q25/19p13 (labeled in SpectrumGreen). The ratio of target to control signals determines deletion status.
Materials & Reagents:
- FFPE tissue sections (4-5 μm thickness)
- Dual-color FISH probe sets (e.g., Abbott Molecular Vysis: 1p36(TP73)/1q25(ABL2) and 19p13(D19S221)/19q13.3(EHD2))
- Hybridization buffer
- DAPI II counterstain
- Rubber cement or coverslip sealant
Procedure:
- Slide Preparation: Bake, deparaffinize, and rehydrate slides as in the CISH protocol.
- Pretreatment:
- Perform proteolytic digestion with pepsin to permeabilize the tissue.
- Denaturation and Hybridization:
- Apply the probe mixture to the target area.
- Co-denature the probe and target DNA on a heated plate or hybridizer at 73°C for 5 minutes.
- Hybridize overnight in a humidified chamber at 37°C.
- Post-Hybridization Washes:
- Wash stringently with SSC buffer/Non-ionic detergent solution in the dark.
- Counterstaining and Mounting:
- Apply DAPI counterstain to visualize nuclei.
- Mount slides with an anti-fade mounting medium and seal with nail polish or a coverslip sealant.
Interpretation & Scoring:
- Two technologists independently score 50-100 non-overlapping tumor cell nuclei for each probe set [33].
- The result is reported as the ratio of the total number of orange (1p/19q) to green (1q/19p) signals.
- A ratio of <0.8-1.0 is typically considered indicative of a deletion for that probe set.
- Critical Note: A positive FISH result must be interpreted with caution, as it may represent a partial deletion. Correlation with IDH mutation status and histology is essential. In morphologically astrocytic tumors, especially those with ATRX loss or p53 overexpression, a positive FISH result should be confirmed with a whole-arm technique like CMA or NGS [33].
The Scientist's Toolkit: Key Research Reagent Solutions
Table 3: Essential Reagents for ISH-Based Diagnostic Assays
| Reagent / Kit | Function / Target | Application Context |
|---|---|---|
| PathVysion HER2 DNA Probe Kit (Abbott Molecular) | Dual-color FISH probe for HER2 gene and CEP17 | HER2 amplification testing in breast cancer [30] |
| HER2 CISH pharmDx Kit (Dako) | Chromogenic detection of HER2 gene amplification | HER2 testing with bright-field microscopy [7] |
| ZytoDot 2C SPEC Probe (ZytoVision) | CISH probe for HER2 and CEN17 | HER2 genetic testing with a chromogenic output [7] |
| Vysis 1p36/19q13 FISH Probe Set (Abbott Molecular) | Dual-probe for 1p/19q deletion analysis | Detection of 1p and 19q losses in glioma [33] |
| HercepTest (Dako) | IHC assay for HER2 protein overexpression | Initial screening for HER2 status in breast cancer [29] [31] |
| Pepsin | Proteolytic enzyme for antigen retrieval | Unmasking target DNA in FFPE tissues for ISH [29] [7] |
| DAB Chromogen | Enzyme substrate for peroxidase | Produces a brown precipitate for signal visualization in CISH [29] |
Both FISH and CISH are robust and reliable techniques for essential molecular diagnostics in oncology. For HER2 testing in breast cancer, CISH demonstrates excellent concordance with FISH and offers the practical advantage of a permanent slide that can be read with a standard microscope, making it a powerful tool for both clinical and research settings. For 1p/19q testing in glioma, FISH remains prevalent, but diagnosticians must be aware of its inherent limitation: the inability to distinguish the diagnostically critical whole-arm co-deletion from partial deletions. In cases where histological or immunohistochemical findings are ambiguous or discordant with FISH results, confirmation with a whole-genome method like Chromosomal Microarray (CMA) or Next-Generation Sequencing (NGS) is strongly recommended to ensure diagnostic accuracy. The choice of platform should be guided by the clinical question, available resources, and the requisite level of genomic resolution.
Within the context of a broader thesis comparing chromogenic (CISH) and fluorescent (FISH) in situ hybridization, this application note delineates the critical decision-making process for implementing high-throughput versus low-throughput workflows. The identification of Human Epidermal Growth Factor Receptor 2 (HER2) status in breast cancer represents a quintessential example, where accurate molecular profiling is paramount for therapeutic decisions regarding trastuzumab (Herceptin) therapy [6]. Tissue Microarray (TMA) technology is a pivotal innovation, enabling high-throughput molecular analysis by harvesting small tissue cores from hundreds of donor paraffin blocks and embedding them into a single recipient block [35]. This allows for the simultaneous profiling of vast tissue cohorts under standardized conditions, maximizing resource use and accelerating research [35] [6]. The choice between high-throughput and low-throughput (routine flow) strategies, and the concomitant selection of CISH or FISH, hinges on specific experimental and diagnostic requirements, including throughput needs, analytical precision, and available laboratory infrastructure.
Method Comparison: Core Techniques at a Glance
The selection of an in situ hybridization method is fundamental to workflow design. The table below summarizes the core characteristics of FISH and CISH, which are central to this comparison.
Table 1: Core Technique Comparison: FISH vs. CISH
| Feature | Fluorescence In Situ Hybridization (FISH) | Chromogenic In Situ Hybridization (CISH) |
|---|---|---|
| Detection Principle | Fluorescently labeled DNA probes [7] | Chromogenic, peroxidase-based reaction [6] |
| Signal Visualization | Fluorescence microscopy with multiband filters [6] | Conventional bright-field light microscopy [7] [6] |
| Probe Labeling | Fluorochromes (e.g., TexasRed, FITC, Rhodamine) [7] | Chromogens (e.g., 3,3'-Diaminobenzidine - DAB) [7] [36] |
| Permanent Slide Archiving | No (fluorophores fade over time) | Yes [6] |
| Compatibility with Tissue Morphology | Difficult (requires correlation with adjacent H&E stain) | Easy (direct correlation due to similar appearance to IHC) [6] |
| Throughput Suitability | Lower throughput, routine flow | Superior for high-throughput due to scanning speed [7] |
| Assay Time | Can be longer (e.g., overnight hybridization) [6] | Can be faster with novel kits (e.g., IQ-FISH reduces to 4 hours) [7] |
Workflow Design: High-Throughput vs. Low-Throughput (Routine Flow)
The integration of TMA technology defines the high-throughput pathway, whereas conventional analysis of individual tissue sections represents the low-throughput routine flow. The following diagram and subsequent breakdown outline the logical decision process and key characteristics of each approach.
Diagram 1: Workflow Selection Logic
High-Throughput Workflow (TMA-Based)
This workflow is characterized by its scalability and efficiency for large-scale studies.
- Core Technology: Tissue Microarray (TMA). TMAs are constructed by transferring cylindrical cores from multiple donor paraffin blocks into a single recipient block in a grid pattern [35] [6]. A single TMA block can contain hundreds of specimens, enabling parallel processing [35].
- Method of Choice: CISH is often superior for high-throughput settings. A key operational advantage is its fast digital scanning time. Studies report a mean scanning time of 29 seconds per mm² for CISH compared to 764 seconds per mm² for FISH (using z-stacking), making CISH dramatically more efficient for digitizing entire TMA slides [7].
- Typical Application: Generating HER2 amplification profiles across large cohorts of breast carcinoma with rapidity and accuracy [6].
Low-Throughput Workflow (Routine Flow)
This pathway is tailored for individual patient diagnostics or small-scale research.
- Core Technology: Conventional full tissue sections. Each sample is processed and analyzed individually.
- Method of Choice: FISH has been regarded as the "gold standard" for HER2 gene copy number determination [7]. It is ideal for low-throughput scenarios where maximum analytical power is needed, such as confirming HER2 status in IHC 2+ borderline cases [7]. Newer FISH variants like IQ-FISH, which reduces assay time to four hours, make it more competitive for routine flow [7].
- Typical Application: Providing individual HER2 results for clinical diagnostic purposes in a hospital pathology lab [7].
Experimental Protocols
Protocol A: High-Throughput TMA Construction and CISH
This protocol is adapted for processing large sample numbers [35] [6].
I. TMA Construction
- Donor Block Identification: Evaluate H&E-stained slides of donor paraffin blocks to mark areas of interest (e.g., tumor margin) by a pathologist [7].
- Recipient Block Preparation: Create a recipient block using purified agar or paraffin within a standard embedding mold [6].
- Core Transfer: Using an automated or manual tissue arrayer, punch a core (typically 0.6–2.0 mm in diameter) from the donor block and transfer it to a pre-defined coordinate in the recipient block [35] [6].
- Sectioning: Cut consecutive sections of 3.5–4 µm thickness from the completed TMA block using an adhesive-coated slide system to maintain array cohesion [6].
II. Chromogenic In Situ Hybridization (CISH)
- Deparaffinization and Pretreatment: Deparaffinize TMA slides in xylene and rehydrate through graded ethanols. Perform heat-induced epitope retrieval in pretreatment buffer (e.g., SPOT-Light) at 92–100°C for 15 minutes [6].
- Enzymatic Digestion: Apply a tissue pretreatment enzyme (e.g., pepsin) at 37°C for 5–10 minutes to permeabilize the tissue [7] [6].
- Hybridization: Apply a digoxigenin-labeled HER2/neu DNA probe, coverslip, and denature on a 95°C hot plate for 5–10 minutes. Incubate slides at 37°C for 16–24 hours in a humidified chamber for hybridization [6].
- Stringency Wash: Wash slides in a warm saline-sodium citrate (SSC) buffer to remove non-specifically bound probe [6].
- Signal Detection: a. Block endogenous peroxidase with 3% hydrogen peroxide for 10 minutes. b. Apply anti-digoxigenin antibody (e.g., FITC-sheep anti-digoxigenin) for 30–60 minutes. c. Apply HRP-conjugated anti-FITC antibody for 30–60 minutes. d. Develop the chromogenic signal with 3,3'-diaminobenzidine (DAB) for 20–30 minutes, yielding a brown precipitate [6].
- Counterstaining and Mounting: Counterstain lightly with hematoxylin, dehydrate, clear, and mount with a permanent mounting medium [6].
Protocol B: Low-Throughput FISH on Routine Tissue Sections
This protocol details the established FISH method for individual slides [7] [6].
- Slide Preparation and Pretreatment: Deparaffinize and air-dry full tissue sections. Treat with 0.2N HCl for 20 minutes, followed by a pretreatment solution at 80°C for 30 minutes [6].
- Protease Digestion: Digest sections with a protease solution (e.g., pepsin) at 37°C for 8–10 minutes to digest proteins and allow probe access [7] [6].
- Fixation: Post-fix in 10% buffered formalin for 10 minutes [6].
- Denaturation and Hybridization: Apply a dual-color probe (e.g., LSI HER2/CEP17 from Abbott Molecular) to the target area, coverslip, and seal. Co-denature slides and probe at 72°C for 5 minutes, then hybridize overnight at 37°C in a humidified chamber [6].
- Post-Hybridization Wash: Wash slides in a post-hybridization buffer at 72°C for 2 minutes to remove excess probe [6].
- Counterstaining and Mounting: Apply a counterstain such as 4,6-diamino-2-phenylindole (DAPI) to visualize nuclei, and mount with an anti-fade mounting medium [6].
- Analysis: Analyze slides using a fluorescence microscope equipped with appropriate excitation/emission filters for the fluorophores used (e.g., TexasRed, FITC) and DAPI [7] [6].
Performance Data and Analytical Comparison
The ultimate validation of any method lies in its analytical performance. The following table consolidates key quantitative findings from comparative studies.
Table 2: Analytical Performance: CISH vs. FISH
| Performance Metric | CISH Performance | FISH Performance | Context & Notes |
|---|---|---|---|
| Concordance with FISH | 94.1% [6] | (Reference) | Agreement on 177/188 breast carcinomas [6]. |
| Inter-Assay Concordance | 97.9% - 99.0% [7] | 97.9% - 99.0% [7] | Concordance between different CISH or FISH assays vs. a consensus [7]. |
| Success Rate | ~98.1% (2 failures out of 108 samples) [7] | ~89.8% (11 failures out of 108 samples) [7] | Failures due to scanning issues (autofocus, background) in FISH and physical defects in CISH [7]. |
| Digital Scanning Speed | 29 sec/mm² [7] | 764 sec/mm² [7] | Major factor favoring CISH in high-throughput digital pathology [7]. |
| HER2 Amplification Rate | 22.9% (43/188) [6] | 24.5% (46/188) [6] | Study on primary breast carcinomas [6]. |
The Scientist's Toolkit: Essential Research Reagents and Materials
Table 3: Key Research Reagent Solutions
| Item | Function in the Workflow |
|---|---|
| TMA Recipient Block | A paraffin or agar block with a predefined grid to receive and hold tissue cores, forming the foundation of the microarray [35]. |
| Manual/Automatic Tissue Arrayer | Instrument for punching precise cores from donor blocks and inserting them into the recipient block (e.g., ATA-27 from Beecher Instruments) [7] [35]. |
| Dual-Color HER2/CEP17 Probe | A mixture of two probes: one labeled for the HER2 gene locus and another for the centromere region of chromosome 17 (CEP17), allowing for ratio-based assessment of amplification [7] [6]. |
| Peptide Nucleic Acid (PNA) Probes | Synthetic probes used in some assays (e.g., Dako HER2 FISH) to block repetitive genomic sequences (e.g., Alu), reducing background noise [7]. |
| Formamide / Ethylene Carbonate | Chemicals used in the hybridization buffer. Formamide denatures DNA, while ethylene carbonate (in IQ-FISH) enables faster DNA helix destabilization, reducing assay time [7]. |
| Anti-Digoxigenin-FITC / HRP-anti-FITC | Key components of the CISH detection system. The first antibody binds the digoxigenin-labeled probe, and the second, enzyme-conjugated antibody catalyzes the chromogenic reaction [6]. |
| 3,3'-Diaminobenzidine (DAB) | Chromogen substrate for peroxidase (HRP). Upon reaction, it produces an insoluble brown precipitate that marks the location of the target DNA [6] [36]. |
| DAPI (4',6-Diamidino-2-Phenylindole) | Fluorescent counterstain that binds strongly to adenine-thymine-rich regions in DNA, staining cell nuclei blue in FISH assays [7] [6]. |
The ability to detect multiple genetic targets within a single sample—a process known as multiplexing—is a powerful capability in molecular pathology. For techniques like chromogenic in situ hybridization (CISH) and fluorescence in situ hybridization (FISH), multiplexing enables researchers to analyze complex genetic interactions, identify chromosomal rearrangements, and validate co-amplification events while conserving precious tissue samples. Within the broader comparison of CISH versus FISH, their inherent multiplexing capabilities present distinct advantages and limitations, influencing their application in research and diagnostic settings. FISH has traditionally dominated multiplexing applications due to the availability of multiple fluorophores with non-overlapping emission spectra [37]. In contrast, conventional CISH has been limited by its dependence on a single chromogenic signal [38]. However, recent methodological advances, including sequential staining approaches and CRISPR-based detection systems, are expanding the multiplexing potential of bright-field microscopy techniques [9]. This application note details the protocols and analytical frameworks necessary to implement effective multiplexing strategies for both FISH and CISH, providing researchers with practical guidance for simultaneous multi-target analysis.
The fundamental difference in detection chemistry between CISH and FISH directly impacts their multiplexing capabilities. FISH utilizes fluorophores with distinct emission spectra, enabling simultaneous detection of multiple targets within a single hybridization round [37]. Conventional CISH relies on enzymatic precipitation of a chromogen (typically DAB), producing a single color signal, which historically limited its multiplexing to sequential staining approaches [38].
Recent innovations are bridging this capability gap. The development of CRISPR-CISH combines CRISPR imaging with chromogenic detection, potentially enabling multiplexing through sequential rounds of probing and signal development [9]. Additionally, QuantISH, an image analysis framework, facilitates the deconvolution of superimposed signals in chromogenic images through computational approaches [38].
Table 1: Multiplexing Capabilities of FISH and CISH
| Feature | FISH | CISH |
|---|---|---|
| Maximum Simultaneous Targets | Limited mainly by spectral overlap of fluorophores; typically 3-5 with standard filters [37] | Typically one per chromogen; sequential approaches enable multiple targets [38] |
| Detection Method | Fluorescence microscopy [39] | Bright-field microscopy [4] |
| Signal Permanence | Fades over time; requires antifade mounting media [18] | Permanent; does not require special preservation [4] |
| Spatial Resolution | High, but can be affected by signal bloom [21] | High, with precise morphological correlation [40] |
| Image Analysis Complexity | Moderate; channel separation simplifies quantification [38] | High; requires color deconvolution for multiplexed signals [38] |
| Key Applications | Cancer genetics, gene rearrangements, chromosomal enumeration [37] [21] | HER2 testing, integration with routine histology [4] [40] [41] |
Table 2: Probe Types for Multiplexing Applications
| Probe Type | Primary Use in Multiplexing | Example Applications |
|---|---|---|
| Locus Specific Probes | Detection of specific genes or chromosomal regions [37] | HER2/neu amplification in breast cancer [4] [41] |
| Alphoid/Centromeric Repeat Probes | Chromosome enumeration [37] | Aneuploidy studies, chromosome 17 polysomy [41] |
| Whole Chromosome Probes | Painting of entire chromosomes [37] | Structural aberration identification [42] |
Experimental Protocols
Multiplex FISH for Concurrent Gene Amplification Analysis
This protocol enables simultaneous visualization of two or more genetic loci using spectrally distinct fluorophores, ideal for assessing co-amplification patterns or gene rearrangements.
Materials and Reagents
- Formalin-fixed, paraffin-embedded (FFPE) tissue sections (4-5 µm thickness)
- Locus-specific FISH probes (e.g., HER2/neu SpectrumOrange, CEP17 SpectrumGreen) [4]
- Hybridization buffer (50% formamide, 2× SSC, 10% dextran sulfate) [18]
- DAPI counterstain (0.5 µg/mL in antifade mounting medium) [18]
- Stringency wash buffer (0.3% NP-40 in 0.4× SSC or 2× SSC) [18]
- Protease digestion solution (0.5 mg/mL protease in PBS) [4]
Procedure
- Slide Preparation: Deparaffinize FFPE sections in fresh xylene (3×, 5 min each), dehydrate through ethanol series (100%, 95%, 70%), and air dry [4].
- Pretreatment: Incubate slides in pretreatment solution (1 M NaSCN) at 80°C for 30 min to unmask target sequences [4].
- Enzymatic Digestion: Treat slides with protease solution (0.5 mg/mL) at 37°C for 10 min to permeabilize tissues and reduce background [4].
- Probe Denaturation: Apply multicolor probe mixture to target area, coverslip, and seal with rubber cement. Denature at 74°C for 5 min in a humidified chamber [4].
- Hybridization: Incubate slides at 37°C for 16-24 hours to allow specific probe binding [4].
- Stringency Washes: Remove coverslips and wash slides in 0.4× SSC/0.3% NP-40 at 73°C for 2 min, followed by 2× SSC/0.1% NP-40 at room temperature [4].
- Counterstaining and Mounting: Apply DAPI counterstain (0.5 µg/mL) in antifade mounting medium to preserve fluorescence [4].
- Visualization: Analyze using a fluorescence microscope with appropriate filter sets for each fluorophore [39].
Analysis and Interpretation
- Count signals in at least 60 non-overlapping interphase nuclei [4].
- For HER2/CEP17 ratio, calculate HER2 signals to chromosome 17 centromere signals [21].
- Ratio >2.0 indicates gene amplification; <2.0 indicates no amplification [4].
- Use automated image analysis systems to reduce interobserver variability in multiplex FISH quantification [21].
Sequential Multiplex CISH for Bright-Field Microscopy
This protocol enables detection of multiple targets through sequential rounds of hybridization, detection, and image registration, bringing multiplexing capabilities to conventional bright-field microscopy.
Materials and Reagents
- Digoxigenin-labeled DNA probes (e.g., Zymed HER2/neu probe) [4]
- Biotin-labeled chromosome enumeration probes [41]
- Peroxidase-conjugated anti-DIG antibody and AP-conjugated streptavidin [41]
- Chromogenic substrates: DAB (brown) for peroxidase, NBT/BCIP (blue/red) for alkaline phosphatase [18]
- HIER buffer (10 mM citrate, pH 6.0) for antigen retrieval [4]
Procedure
Initial Hybridization: Follow standard CISH protocol for first probe using DIG-labeled HER2/neu probe [4]:
- Deparaffinize and pretreat slides as in FISH protocol
- Apply probe, denature at 74°C for 5 min, hybridize overnight at 37°C
- Detect with peroxidase-anti-DIG and develop with DAB (brown precipitate)
Image Documentation: Capture high-resolution images of CISH signals before proceeding to second round [38].
Signal Removal and Re-hybridization:
- Remove coverslips and incubate slides in 2× SSC at 95°C for 10 min to strip initial probe [38]
- Verify signal removal under microscope
Second Round Hybridization:
Image Registration:
- Align sequential images using computational methods
- Correlate signal patterns across multiple targets [38]
Analysis and Interpretation
- Identify amplification patterns (clustered signals vs. dispersed copies) [4]
- Low-level amplification: 6-10 signals/nucleus or small gene clusters
- High-level amplification: >10 signals/nucleus or large gene clusters [4]
- Use image analysis software with color deconvolution algorithms to separate superimposed chromogens [38]
The Scientist's Toolkit: Research Reagent Solutions
Successful multiplexing experiments require carefully selected reagents optimized for specificity and signal detection. The following table details essential materials and their functions:
Table 3: Essential Reagents for Multiplexing Applications
| Reagent/Category | Specific Examples | Function in Multiplexing |
|---|---|---|
| Nucleic Acid Probes | Locus-specific probes (HER2/neu), centromeric repeats (CEP17) [37] [41] | Target-specific binding for gene amplification or chromosome enumeration studies |
| Labeling Systems | Digoxigenin (DIG), Biotin, Fluorescent tags (SpectrumOrange, SpectrumGreen) [4] [41] | Provides detection handles for subsequent signal development; enables differential labeling of multiple targets |
| Detection Enzymes | Horseradish Peroxidase (HRP), Alkaline Phosphatase (AP) [9] [18] | Catalyzes chromogenic precipitation for signal generation; different enzymes enable sequential multiplexing |
| Chromogenic Substrates | DAB (brown), NBT/BCIP (blue/red) [41] [18] | Produces insoluble, colored precipitates at target sites; distinct colors enable target differentiation |
| Fluorophores | FITC, Cy3, Cy5, DAPI [4] [18] | Emits specific wavelengths upon excitation; multiple fluorophores enable simultaneous target detection |
| Hybridization Buffers | Formamide-based hybridization buffer [18] | Maintains optimal stringency during hybridization to ensure specific probe binding |
| Stringency Wash Buffers | SSC buffers with detergents (NP-40) [4] [18] | Removes non-specifically bound probes to reduce background and improve signal-to-noise ratio |
| Mounting Media | Antifade mounting medium (for FISH), aqueous mounting medium (for CISH) [18] | Preserves signals for microscopy; antifade compounds extend fluorescence signal longevity |
Advanced Applications and Emerging Technologies
CRISPR-CISH: A Novel Multiplexing Platform
The recently developed CRISPR-CISH method represents a significant advancement in chromogenic multiplexing by combining CRISPR/Cas9 precision with bright-field detection [9]. This system uses:
- dCas9 complexed with guide RNAs for sequence-specific targeting
- 3' biotin-labeled tracrRNA for signal generation
- Streptavidin-enzyme conjugates (HRP or AP) for chromogenic development
Unlike traditional CISH, CRISPR-CISH does not require global DNA denaturation, thereby preserving chromatin structure while enabling multicolor detection through sequential probing [9]. This method is particularly valuable for:
- Spatial genomics applications requiring intact nuclear architecture
- Educational settings where fluorescence microscopy is unavailable
- Long-term archiving of results without signal fading concerns [9]
Computational Approaches for Multiplexed Image Analysis
Advanced computational tools are essential for extracting quantitative data from multiplexed experiments:
QuantISH Framework: This open-source pipeline addresses the unique challenges of analyzing chromogenic multiplexing data through:
- Color deconvolution to separate superimposed chromogens
- Morphology-based cell classification to identify carcinoma, immune, and stromal cells
- Spatial expression analysis to characterize tumor heterogeneity [38]
Automated FISH Analysis: Digital pathology platforms now offer:
- Automated signal counting to reduce interobserver variability
- Tumor region identification through integration with H&E and IHC
- Cluster pattern recognition for high-level amplification detection [21]
Multiplexing capabilities represent a critical dimension in the comparative evaluation of CISH and FISH technologies. While FISH offers more straightforward simultaneous detection of multiple targets through spectral discrimination, advanced CISH methodologies are closing this gap through sequential hybridization approaches and computational image analysis. The choice between these techniques for multiplexing applications depends on specific research needs: FISH provides greater multiplexing efficiency for simultaneous detection, while CISH offers superior morphological context and permanent archival qualities. Emerging technologies like CRISPR-CISH and sophisticated analytical frameworks like QuantISH are expanding the multiplexing potential of both platforms, enabling researchers to address increasingly complex biological questions with spatial and molecular precision. As these methodologies continue to evolve, multiplexed in situ hybridization will undoubtedly play an expanding role in basic research, drug development, and clinical diagnostics.
Brightfield microscopy remains the cornerstone technique for pathological diagnosis in clinical and research settings, prized for its ability to reveal intricate tissue morphology through simple light transmission and absorption. In the context of comparing chromogenic and fluorescent in situ hybridization (CISH vs. FISH) techniques, brightfield microscopy is indispensable for CISH, allowing for the direct visualization of genetic alterations within the precise tissue architecture that pathologists are trained to interpret. This application note details the protocols and analytical frameworks for leveraging brightfield microscopy to correlate molecular data from CISH with tissue morphology, providing a critical bridge between genetic information and histological context.
Technical Comparison: CISH vs. FISH in Brightfield Microscopy
The choice between CISH and FISH has significant implications for workflow, data analysis, and integration with morphological assessment. The table below summarizes the core characteristics of each technique within a brightfield microscopy context.
Table 1: Comparative Analysis of CISH and FISH for Brightfield Microscopy Applications
| Feature | Chromogenic ISH (CISH) | Fluorescent ISH (FISH) |
|---|---|---|
| Detection Principle | Enzyme-based chromogenic deposition (e.g., DAB) [43] [44] | Fluorochrome emission at specific wavelengths [44] |
| Compatibility with Brightfield | Directly compatible; viewed with standard brightfield microscope [45] | Not directly compatible; requires fluorescence microscope or multispectral imaging for brightfield conversion [46] |
| Morphology Correlation | Excellent; permanent chromogen allows simultaneous viewing of gene signals and tissue structure; easily paired with hematoxylin counterstain [4] [45] | Challenging; tissue autofluorescence and signal separation can obscure morphological detail [45] |
| Multiplexing Capacity | Limited, typically 3-5 markers due to broad chromogen spectral absorption and color overlap [46] [45] | High, 5-10+ markers possible due to narrow emission spectra and spectral unmixing [46] [45] |
| Signal Permanence | High; chromogenic deposits are stable for years, allowing long-term archiving [45] | Low; fluorochromes are susceptible to photobleaching, signals fade over time [44] [45] |
| Quantitative Analysis | Basic; semi-quantitative scoring based on chromogen presence/absence [45] | Highly precise; enables accurate quantification of gene copy numbers and expression levels [45] |
| Instrumentation Cost | Lower; utilizes standard, widely available brightfield microscopes [45] | Higher; requires specialized and costly fluorescence microscopes or multispectral systems [45] |
| Best Application in Tissue Context | Routine clinical diagnostics, validation of single biomarkers, and precious sample preservation where morphology is paramount [4] [45] | Complex research, high-order multiplexing, and studies requiring precise, cell-level quantification [46] [45] |
A key validation study comparing CISH to FISH for HER2/neu amplification in 100 invasive breast carcinomas demonstrated 100% concordance between the two methods for the 88 interpretable cases. This underscores CISH's reliability for single- biomarker detection in a brightfield setting [4].
Advanced Brightfield Multiplexing with Multispectral Imaging
While conventional brightfield limits multiplexing, recent advances overcome this by combining new chromogens with multispectral imaging. This workflow uses covalently deposited chromogens (CDCs) with narrow absorbance bands, a monochrome camera, and sequential illumination with matched narrow wavelengths [46].
Diagram 1: Sequential CDC multiplex IHC workflow.
Spectral unmixing of the captured images then separates the signal from each CDC, allowing for clear identification of multiple biomarkers within the morphological context of the tissue [46]. This powerful approach merges the multiplexing capacity of fluorescence with the morphological familiarity and permanence of brightfield microscopy.
Protocol: Chromogenic ISH (CISH) for Brightfield Microscopy
This protocol provides a detailed methodology for detecting gene amplification (e.g., HER2/neu) in formalin-fixed paraffin-embedded (FFPE) breast tissue sections, optimized for brightfield microscopy analysis [4] [43].
Materials and Reagents
- Tissue Samples: FFPE tissue sections (4 µm thick) mounted on charged slides [4].
- Probes: Digoxigenin-labeled HER2/neu DNA probe [4].
- Antibodies: Mouse anti-digoxigenin primary antibody and HRP-polymer anti-mouse secondary antibody [4].
- Chromogen: 3,3'-Diaminobenzidine (DAB) [43] [44].
- Key Solutions:
Step-by-Step Procedure
Diagram 2: CISH experimental procedure workflow.
Dewaxing and Rehydration:
- Immerse slides in fresh xylene (3 times, 5 minutes each).
- Hydrate through a graded ethanol series (100%, 90%, 70%) and rinse in deionized water [4].
Pretreatment and Digestion:
- Incubate slides in preheated 1 M NaSCN solution at 80°C for 30 minutes to uncover target DNA.
- Digest with protease solution at 37°C for 2-10 minutes to permeabilize tissue and reduce background. Wash slides in deionized water after each step [4].
Probe Hybridization:
- Apply digoxigenin-labeled HER2/neu DNA probe to the tissue section.
- Denature the probe and tissue DNA at 74°C for 5 minutes.
- Hybridize overnight (~16-24 hours) in a humidified chamber at 37°C [4].
Post-Hybridization Washes:
- Perform stringent washes in 2× SSC/0.3% NP-40 at 73°C for 2 minutes to remove unbound probe [4].
Immunodetection:
- Block endogenous peroxidase activity by incubating with 3% H₂O₂ in methanol.
- Sequentially apply mouse anti-digoxigenin primary antibody (60 minutes), followed by an HRP-polymer conjugated anti-mouse secondary antibody (60 minutes) at room temperature. Rinse with wash buffer between steps [4].
Chromogenic Development and Counterstaining:
Microscopic Analysis:
Quantitative Analysis of Brightfield Images
Computational analysis of brightfield images is advancing rapidly, enabling high-throughput, objective quantification of morphological and molecular features.
Table 2: Computational Methods for Brightfield Image Analysis
| Method | Principle | Application in Tissue Context | Performance/Outcome |
|---|---|---|---|
| Convolutional Neural Networks (CNN) [47] | Deep learning algorithm that automatically learns features from images for classification or regression tasks. | Classification of different cell lineages and quantification of cell numbers in unstained brightfield (phase contrast) images. | Achieved 93% accuracy in classifying 8 distinct cell lineages using their inherent morphology [47]. |
| Spatial Autocorrelation Analysis [48] | Computes the local spatial correlation length from quantitative phase images to measure nanoscale morphological disorder. | Serves as an intrinsic cancer marker; shorter correlation length indicates higher morphological disorder associated with malignancy. | Successfully classified benign and malignant breast tissue microarray cores based on nanoscale cellular alterations [48]. |
| Integrated Morphometric Analysis [49] | Measures and categorizes objects based on morphometric parameters (shape, size, optical density). | Characterizing and classifying cells or tissue structures in brightfield images based on multiple quantitative features. | Enables automated, high-content analysis of tissue morphology, though specific accuracy data was not provided in the source [49]. |
The Scientist's Toolkit: Essential Research Reagent Solutions
Successful brightfield-based research relies on a suite of reliable reagents and tools. The following table catalogues key solutions for experiments in tissue morphology correlation.
Table 3: Essential Research Reagent Solutions for Brightfield IHC/ISH
| Item | Function | Example Application |
|---|---|---|
| Covalently Deposited Chromogens (CDCs) [46] | Enzyme-activated dyes that form stable, covalent bonds to tissue, enabling multiplexing with narrow absorbance bands. | Brightfield multiplex IHC for detecting 4-5 biomarkers in NSCLC and prostate cancer [46]. |
| Tyramide Signal Amplification (TSA) Kits [45] | Signal amplification systems that greatly enhance sensitivity for detecting low-abundance targets in both chromogenic and fluorescent IHC. | Boosting detection of weakly expressed biomarkers in FFPE tissues without increasing background [45]. |
| Cell and Tissue Staining Kits [43] | Comprehensive kits containing blocking reagents, biotinylated secondary antibodies, streptavidin-HRP, and chromogen (e.g., DAB, AEC). | Streamlined, optimized workflow for standard single-plex chromogenic IHC detection [43]. |
| Multiplex IHC Kits [45] | Pre-optimized panels of antibodies and CDCs for simultaneous detection of multiple biomarkers on a single tissue section. | Simplified workflow for brightfield multiplexing, such as immune cell profiling in the tumor microenvironment [45]. |
| Primary Antibodies (Validated for IHC) [46] | Antibodies specifically validated for reactivity and specificity in IHC applications on FFPE tissue. | Reliable detection of key diagnostic biomarkers (e.g., p40, TTF-1, CD8, Ki-67) in clinical and research samples [46]. |
Brightfield microscopy, when empowered by robust chromogenic techniques like CISH and advanced computational analysis, provides an unparalleled platform for interpreting genetic data within its rich tissue morphological context. For applications where the correlation of molecular findings with classic histopathology is non-negotiable—such as in clinical diagnostics and translational research—CISH and brightfield multiplexing offer a permanent, familiar, and highly effective solution. The continued development of novel chromogens, sensitive detection systems, and sophisticated AI-driven image analysis tools will further solidify the role of brightfield microscopy as an indispensable technology in the era of precision medicine.
Emerging Applications in Hematological Malignancies and Solid Tumors
In situ hybridization (ISH) has established itself as a cornerstone technology in diagnostic pathology and oncology research, enabling the precise localization of nucleic acid sequences within morphologically preserved tissue sections. The ongoing comparison between chromogenic (CISH) and fluorescence (FISH) methodologies represents a critical discourse in molecular pathology, driving technological refinements that expand their applications across diverse cancer types [50]. While both techniques share the fundamental principle of using labeled nucleic acid probes to hybridize with specific DNA or RNA targets within tissues or cells, their detection systems and operational requirements differ substantially, creating distinct advantages and limitations for specific clinical and research scenarios [51] [50].
The selection between CISH and FISH involves careful consideration of multiple factors, including target abundance, required sensitivity, equipment availability, cost constraints, and workflow integration. FISH, with its mature methodology and high sensitivity, remains the gold standard for many applications, particularly those requiring multiplexing capabilities [52] [50]. Conversely, CISH offers practical advantages for routine diagnostics through its compatibility with standard bright-field microscopy and permanent slide archiving [5] [4] [50]. This application note examines the emerging implementations of both technologies within hematological malignancies and solid tumors, providing structured experimental protocols and analytical frameworks to guide researchers and drug development professionals in their methodological selections.
Technical Comparative Analysis: CISH versus FISH
Fundamental Technical Principles and Operational Characteristics
Chromogenic In Situ Hybridization (CISH) merges immunohistochemical chromogenic methods with ISH, utilizing digoxigenin or biotin-labeled nucleic acid probes that hybridize with target nucleic acids in tissue cells. The resulting hybridized probes are typically detected using horseradish peroxidase (HRP) or alkaline phosphatase (AP) reactions with chromogenic substrates such as 3,3'-diaminobenzidine (DAB) or Fast Red, forming colored precipitates at the target sites observable under a standard bright-field microscope [50]. The permanent nature of these stained sections facilitates long-term storage and retrospective studies [4] [50].
Fluorescence In Situ Hybridization (FISH) employs fluorophore-labeled DNA probes that hybridize directly to complementary target sequences, with results visualized using epifluorescence microscopy equipped with specific filter sets [50]. Common fluorophores include Texas Red, FITC, and Rhodamine, often combined with DAPI counterstaining for nuclear visualization [7] [50]. The requirement for dark conditions during both processing and analysis, coupled with fluorescence signal quenching over time, presents distinct challenges for long-term sample preservation [50].
Table 1: Core Technical Characteristics and Implementation Requirements
| Characteristic | CISH | FISH |
|---|---|---|
| Detection System | Chromogenic precipitation (DAB, Fast Red) | Fluorescence emission (FITC, Texas Red, Rhodamine) |
| Microscopy Platform | Standard bright-field microscope | Epifluorescence microscope with specific filter sets |
| Signal Permanence | Permanent slides; long-term storage feasible | Signal fades over time (weeks to months); requires documentation |
| Morphology Correlation | Excellent; simultaneous viewing of tissue architecture and signals | Moderate; requires switching between fluorescence and bright-field |
| Multiplexing Capacity | Limited primarily to 1-2 targets with different chromogens | High; multiple targets detectable with different fluorophores |
| Operational Throughput | High scanning speed (mean: 29 sec/mm²) [7] | Lower scanning speed (mean: 764 sec/mm² with z-stacking) [7] |
| Sample Type Flexibility | Formalin-fixed paraffin-embedded (FFPE) tissues, TMAs | FFPE tissues, TMAs, cell suspensions, smears |
| Technical Sensitivity | Lower for low-abundance targets; challenging for low-level amplification [50] | High sensitivity and stability; suitable for low-copy targets [50] |
Performance Metrics in Clinical Validation Studies
Robust validation studies across multiple cancer types have demonstrated strong concordance between CISH and FISH methodologies. In HER2 testing for breast cancer, multiple investigations have reported 94-100% concordance between CISH and FISH results, establishing CISH as a viable alternative in diagnostic algorithms [6] [5] [4]. One comprehensive study of 100 invasive breast carcinomas found 100% concordance between FISH and CISH for both amplified and non-amplified cases [4]. Similarly, research utilizing tissue microarray technology demonstrated 94.1% concordance in HER2 status determination between the two methods [6].
The slightly reduced sensitivity of CISH becomes most apparent in borderline amplification cases or targets with low copy numbers, where FISH maintains superior detection capabilities [5] [50]. For high-abundance targets such as viral sequences (EBER in Epstein-Barr virus) or highly amplified oncogenes, both technologies demonstrate equivalent performance with the practical advantages of CISH becoming more pronounced [50].
Table 2: Performance Comparison in Validation Studies Across Tumor Types
| Study Context | Concordance Rate | Key Findings and Applications |
|---|---|---|
| HER2 in Breast Cancer (100 cases) | 100% [4] | Complete agreement for amplified and non-amplified cases; CISH effective for integration into routine testing |
| HER2 in Breast Cancer (188 cases) | 94.1% [6] | CISH identified as viable alternative with accuracy and relative low cost; suitable for TMA high-throughput analysis |
| HER2 IHC 2+ Equivocal Cases (135 cases) | 93% [5] | Discordance primarily in very low or borderline amplification cases; CISH reliable for definitive amplification status |
| HER2 IHC 0/1+ & 3+ Cases | 97-98% [5] | High concordance in clearly negative and positive cases; 3 IHC 3+ cases were FISH/CISH negative (IHC false positives) |
| Multi-Assay HER2 Comparison | 99% [7] | Comparison of 5 different HER2 genetic assays; CISH superior for high-throughput due to faster scanning speed |
| RNA Virus Detection | Variable [51] | FISH-RNA probe mix showed highest detection rate compared to CISH for various RNA viruses |
Emerging Applications in Solid Tumors
HER2 and Beyond: Expanding Biomarker Detection
The validation of CISH for HER2 gene amplification detection in breast cancer represents a paradigm for the integration of alternative ISH methodologies into solid tumor diagnostics. The high concordance rates with FISH (94-100%) across multiple studies have established CISH as a reliable approach for determining HER2 status, particularly in unequivocally positive or negative cases [6] [5] [4]. The preservation of tissue morphology with CISH enables precise correlation of genetic alterations with histological features, a critical advantage in heterogeneous tumors [41] [50].
Beyond HER2, both CISH and FISH applications are expanding to include other clinically relevant biomarkers in solid tumors. In pediatric solid malignancies, comprehensive molecular profiling including ISH techniques has demonstrated significant clinical impact, with broad-spectrum analyses showing higher therapeutic impact (57%) compared to targeted analyses (28%) [53]. The adaptability of ISH platforms for tissue microarray (TMA) technology enables high-throughput molecular profiling of large cancer cohorts, significantly accelerating research applications while maximizing limited tissue resources [7] [6].
Protocol: HER2 Gene Amplification Detection via CISH in Breast Cancer
Principle: This protocol details the detection of HER2 gene amplification using chromogenic in situ hybridization on formalin-fixed paraffin-embedded (FFPE) breast cancer tissue sections, providing a practical alternative to FISH with compatibility standard light microscopy [41] [5] [4].
Materials:
- FFPE tissue sections (4-5 µm thickness) mounted on charged slides
- DIG-labeled HER2 DNA probe (commercially available)
- Heat pretreatment buffer (1 M sodium isothiocyanate)
- Protease digestion solution
- Mouse anti-DIG antibody
- HRP-conjugated anti-mouse antibody
- DAB chromogenic substrate solution
- Hematoxylin counterstain
Procedure:
- Section Pretreatment:
- Deparaffinize slides in fresh xylene (3 × 5 min each) followed by dehydration in absolute ethanol (2 × 5 min each) and air drying.
- Perform heat-induced epitope retrieval in pretreatment buffer (1 M sodium isothiocyanate) at 80°C for 13 minutes [4] or 92-100°C for 15 minutes [6].
- Rinse slides briefly with deionized water.
- Apply protease digestion (e.g., pepsin) at 37°C for 2-8 minutes to permeabilize tissues [7] [4].
- Wash with deionized water, dehydrate through graded ethanols, and air dry.
Hybridization:
Post-Hybridization Washes:
- Remove coverslips carefully and wash slides in 2×SSC/0.3% NP-40 at 73°C for 2 minutes [4].
- Perform three additional washes in distilled water at room temperature.
Signal Detection:
- Block endogenous peroxidase with 3% H₂O₂ in absolute methanol for 10 minutes.
- Apply mouse anti-DIG antibody for 60 minutes at room temperature.
- Wash and apply polymerized HRP anti-mouse antibody for 60 minutes at room temperature.
- Develop color reaction with DAB substrate for 20-30 minutes [4].
- Counterstain with hematoxylin, dehydrate, clear, and mount.
Interpretation and Scoring:
- Non-amplified: 1-5 signals per nucleus in >50% of tumor cells
- Low-level amplification: 6-10 signals per nucleus or small gene clusters in >50% of tumor cells
- High-level amplification: Numerous (>10) signals per nucleus or large gene clusters in >50% of tumor cells [4]
Troubleshooting Notes:
- Inadequate signal may require optimization of protease digestion time.
- High background staining may result from insufficient post-hybridization washes.
- Tissue damage can occur from excessive protease treatment; titrate for each tissue type.
Advanced Implementation in Hematological Malignancies
Comprehensive Genetic Profiling in Hematologic Diagnostics
The role of ISH technologies in hematological malignancies has evolved significantly, with both CISH and FISH now integrated into complex diagnostic algorithms alongside chromosome banding analysis and emerging sequencing platforms. The European recommendations for quality assurance emphasize that "cytogenomic testing has become increasingly important in the clinical management of patients with haematological neoplasms," with detection of clonal abnormalities providing "important prognostic and therapeutic information" [52].
FISH maintains its position as the preferred ISH methodology for most hematological applications due to its superior sensitivity for detecting cryptic translocations and numerical abnormalities in a spectrum of disorders including myelodysplastic syndromes (MDS), acute leukemias, chronic lymphocytic leukemia (CLL), and multiple myeloma [52]. The ability to perform FISH on both metaphase and interphase nuclei from bone marrow, peripheral blood, or lymph node specimens provides flexibility in sample processing. For multiple myeloma specifically, the guidelines recommend that "genetic analysis should be performed on enriched CD138+ cells" to overcome the challenge of low plasma cell percentages in some patients [52].
While CISH applications in hematology are less extensively documented, emerging implementations include viral detection (EBER) in lymphomas and potential copy number assessment in specific genetic loci. The morphological preservation offered by CISH presents advantages for precisely correlating genetic abnormalities with specific cell populations in heterogeneous hematopoietic tissues [50].
Protocol: FISH Analysis for BCR::ABL1 Translocation in Chronic Myeloid Leukemia
Principle: Detection of the BCR::ABL1 fusion resulting from t(9;22)(q34;q11) using dual-color, dual-fusion FISH probes on bone marrow or peripheral blood specimens, providing critical diagnostic and prognostic information for CML management.
Materials:
- Bone marrow aspirate or peripheral blood sample with circulating blasts
- Heparinized collection tubes
- BCR::ABL1 dual-fusion DNA FISH probe set
- DAPI counterstain
- Antifade mounting medium
- 20× SSC buffer (pH 5.3)
- NP-40 detergent
Procedure:
- Sample Preparation:
- Collect bone marrow (0.5-1 ml minimum) in heparinized tubes; process within 24 hours.
- For suspended cells, cytocentrifuge preparations can be used.
- Apply specimens to charged slides and air dry.
Pretreatment:
Probe Denaturation and Hybridization:
- Apply 10 µL of BCR::ABL1 dual-fusion probe mixture to the target area.
- Cover with coverslip and seal with rubber cement.
- Co-denature slides and probe at 72°C for 5 minutes on a hot plate.
- Hybridize overnight (16-24 hours) in a humidified chamber at 37°C.
Post-Hybridization Washes:
- Remove coverslips and wash slides in 0.5× SSC (pH 5.3) at 72°C for 5 minutes.
- Transfer to room temperature 2× SSC/0.3% NP-40 for 1 minute.
- Air dry in darkness.
Counterstaining and Visualization:
- Apply 15 µL of DAPI antifade solution.
- Cover with coverslip and store in the dark at -20°C until analysis.
- Analyze using a fluorescence microscope with appropriate filter sets.
Scoring Criteria:
- Normal pattern: Two orange (ABL1) and two green (BCR) signals
- Positive for translocation: One orange, one green, and two fusion signals (indicating BCR::ABL1 fusion)
- Score at least 200 interphase nuclei with distinct, non-overlapping signals
Quality Control:
- Include normal control samples with each batch
- Establish laboratory-specific normal cutoff values
- Participate in external quality assessment schemes [52]
The Scientist's Toolkit: Essential Research Reagents and Platforms
Table 3: Key Research Reagent Solutions for ISH Applications
| Reagent Category | Specific Examples | Function and Application Notes |
|---|---|---|
| DNA Probes | HER2/CEP17 dual-color probes (ZytoVision, Dako) [7] | Target-specific hybridization; dual-color enables ratio-based amplification assessment |
| Labeling Systems | Digoxigenin (DIG)-labeled probes [41] [50] | Non-radioactive labeling compatible with both CISH and FISH detection |
| Biotin-labeled probes [50] | Alternative labeling system with streptavidin-based detection | |
| Fluorescein (FITC)-labeled probes [7] [41] | Direct fluorescence detection for FISH | |
| Detection Chemistry | Horseradish peroxidase (HRP) with DAB [4] | Chromogenic detection for CISH; produces brown precipitate |
| Alkaline phosphatase with Fast Red/NBT-BCIP [51] | Chromogenic/fluorescent detection; alternative color options | |
| Anti-DIG antibodies (mouse, rabbit) [4] | Immunological detection of digoxigenin-labeled probes | |
| Sample Processing | Protease digestion solutions (pepsin, proteinase K) [7] [6] | Tissue permeabilization for probe access; concentration and time critical |
| Pretreatment buffers (sodium isothiocyanate) [4] | Heat-mediated antigen retrieval for FFPE tissues | |
| Specialized Platforms | Tissue microarray technology [7] [6] | High-throughput analysis of multiple specimens simultaneously |
| Automated staining systems (Ventana, Leica) [53] | Standardized processing and staining for reproducibility | |
| Digital slide scanning systems [7] | Image capture and analysis for both CISH and FISH |
Future Directions and Regulatory Considerations
The regulatory landscape for ISH technologies continues to evolve, with recent developments indicating a transition toward streamlined classifications. The U.S. Food and Drug Administration has proposed to "reclassify in situ hybridization test systems indicated for use with a corresponding approved oncology therapeutic product from class III into class II, subject to premarket notification" [54]. This regulatory shift reflects the maturing validation status of ISH platforms and their established role in companion diagnostics.
Future applications of both CISH and FISH will increasingly focus on multiplexed analysis, with technologies like multiplex FISH enabling simultaneous detection of multiple genetic abnormalities in a single specimen [50]. The integration of ISH with complementary methodologies—including next-generation sequencing, immunohistochemistry, and computational pathology—will create comprehensive diagnostic pathways for complex malignancies [52] [53]. Emerging techniques such as RNAscope offer enhanced sensitivity for RNA detection with reduced background noise, potentially bridging the gap between traditional CISH and FISH capabilities [50].
The choice between CISH and FISH methodologies will continue to be guided by specific application requirements, with CISH offering practical advantages for high-throughput routine diagnostics and FISH maintaining superiority for low-abundance targets and complex rearrangement patterns. As both technologies evolve, their complementary roles in precision oncology will expand, providing researchers and clinicians with powerful tools for elucidating tumor biology and guiding therapeutic decisions.
Practical Challenges and Solutions for Robust ISH Assays
In the context of comparing chromogenic and fluorescent in situ hybridization (ISH) techniques, the choice of microscopy infrastructure is a critical determinant of experimental design, workflow, and data interpretation. Both ISH methods localize specific nucleic acid sequences within cells and tissues using complementary nucleotide probes, but they differ fundamentally in their detection and visualization systems [55]. Fluorescence in situ hybridization (FISH) employs fluorophore-labeled probes detected via fluorescence microscopy, while chromogenic in situ hybridization (CISH) utilizes enzyme-based chromogenic detection visualized with standard brightfield microscopy [56] [57]. This application note details the technical requirements, capabilities, and experimental protocols for both imaging platforms to guide researchers in selecting appropriate infrastructure for their diagnostic and research applications.
Technical Specifications and Comparative Analysis
Fundamental Operating Principles
Brightfield microscopy forms images by transmitting white light through the specimen, which absorbs, scatters, or deflects the light to generate contrast [58] [59]. For visualizing most cellular components and CISH signals, additional contrast-enhancing techniques are required, such as staining with dyes like hematoxylin and eosin or enzyme-based chromogenic precipitation [58] [56]. The microscope itself is a relatively simple system consisting of a light source, condenser, objective lenses, and eyepieces or a camera for detection.
Fluorescence microscopy operates on the principle of exciting fluorophores with specific high-energy wavelengths and detecting the resulting lower-energy, longer-wavelength emitted light [58] [59]. In epifluorescence microscopy, the most common configuration for FISH, the excitation light illuminates the sample through the same objective that collects the emission light. A critical component is the filter cube, which contains: (1) an excitation filter that selects specific wavelengths to excite the fluorophore, (2) a dichroic mirror that reflects excitation light toward the sample but transmits emitted light to the detector, and (3) an emission filter that blocks scattered excitation light while transmitting the desired fluorescence signal [59].
Equipment and Performance Comparison
Table 1: Comparative Analysis of Brightfield and Fluorescence Microscopy Systems
| Parameter | Standard Brightfield Microscopy | Fluorescence Microscopy |
|---|---|---|
| Detection Method | Transmitted light | Reflected/emitted light [58] |
| Light Source | Halogen or LED lamp | High-intensity source (mercury/xenon arc, LED) [58] |
| Detection Target | Chromogenic precipitates (e.g., DAB) | Fluorophores (e.g., FITC, Cy3, Cy5) [59] |
| Resolution Limit | ~200 nm (limited by visible light) | ~200 nm (limited by diffraction) [59] |
| Key Components | Köhler illumination, condenser, objectives | Filter cubes, specific objectives, darkroom conditions |
| Sample Compatibility | CISH, IHC, H&E stains, live cells | FISH, immunofluorescence, live-cell imaging |
| Multiplexing Capability | Limited (color-based separation) | High (multiple fluorophores with distinct spectra) [60] |
| Signal Permanence | Permanent (chromogenic precipitate) | Temporary (fluorophores fade over time) [56] [57] |
| Cell Morphology Assessment | Excellent (simultaneous with signal) | Limited (requires counterstaining) [56] [57] |
| Equipment Cost | Lower | Higher (2-5x brightfield cost) [56] |
| Infrastructure Needs | Standard lab environment | Darkroom conditions or light-tight enclosures |
Research Reagent Solutions for CISH and FISH
Table 2: Essential Research Reagents for In Situ Hybridization Techniques
| Reagent/Category | Function | CISH Applications | FISH Applications |
|---|---|---|---|
| Probe Types | Binds complementary target sequences | DNA probes labeled with biotin or digoxigenin [56] | DNA probes with direct fluorophore tags (FITC, Cy3) [57] |
| Detection Systems | Visualizes bound probes | Enzyme-conjugated (HRP/AP) antibodies with chromogenic substrates [56] | Direct fluorescence detection or antibody amplification [57] |
| Signal Substrates | Generates detectable signal | DAB (brown precipitate), Fast Red, NBT/BCIP [56] | Fluorophores (FITC, Texas Red, Cy3, Cy5, Quantum Dots) [59] |
| Counterstains | Provides cellular context | Hematoxylin (nuclear staining) [56] | DAPI, Hoechst (nuclear staining) [59] |
| Mounting Media | Preserves sample for imaging | Aqueous permanent mounting media | Antifade reagents to reduce photobleaching [57] |
| Sample Preparation | Prepares tissue for hybridization | Protease digestion, heat-induced epitope retrieval [56] | Protease digestion, denaturation [57] |
Experimental Protocols and Methodologies
CISH Protocol for Brightfield Microscopy
Principle: CISH detects specific DNA sequences using enzyme-labeled probes that generate permanent, visible chromogenic precipitates detectable with standard brightfield microscopy [56]. This protocol is adapted for detecting HER2/neu gene amplification in breast cancer samples but can be modified for other targets.
Materials:
- Formalin-fixed, paraffin-embedded (FFPE) tissue sections (4-5 μm)
- CISH probe (e.g., HER2/neu and centromere 17 control)
- Proteinase K solution
- Hybridization buffer
- Primary detection antibody (anti-digoxigenin or streptavidin-HRP)
- DAB (3,3'-diaminobenzidine) chromogen substrate
- Hematoxylin counterstain
- Brightfield microscope with 40x-60x objective [56]
Procedure:
- Tissue Preparation: Cut 4-5 μm sections from FFPE blocks and mount on charged slides. Bake slides at 60°C for 1 hour to ensure adhesion.
- Deparaffinization and Rehydration: Immerse slides in xylene (3 changes, 5 minutes each) followed by graded ethanol series (100%, 95%, 70%) and rinse in distilled water.
- Protease Digestion: Treat slides with proteinase K (25 μg/mL) at room temperature for 10-30 minutes to expose target nucleic acids. Optimize digestion time for each tissue type.
- Denaturation and Hybridization: Apply CISH probe to tissue, coverslip, and seal with rubber cement. Denature at 97°C for 5-10 minutes, then hybridize overnight (16-18 hours) at 37°C in a humidified chamber [56].
- Post-Hybridization Washes: Wash slides in stringency wash solution at 72°C for 5 minutes to remove unbound probe, then transfer to room temperature wash buffer.
- Signal Detection: Apply primary detection reagent (e.g., anti-digoxigenin-fluorescein for digoxigenin-labeled probes) for 30 minutes at room temperature. For biotin-labeled probes, apply HRP-conjugated streptavidin. After washing, incubate with DAB chromogen for 10-30 minutes until brown precipitate forms [56].
- Counterstaining and Mounting: Counterstain with hematoxylin for 1-2 minutes, dehydrate through graded ethanols and xylene, and mount with permanent mounting medium.
- Microscopy and Analysis: Visualize using brightfield microscopy at 40x-60x magnification. Gene amplification is indicated by large gene signal clusters or >5 signals per nucleus in >50% of tumor cells [56] [61].
Troubleshooting Notes:
- Excessive background may indicate insufficient washing or over-digestion with protease.
- Weak signal may result from under-digestion, inadequate denaturation, or probe degradation.
- Always include positive and negative control tissues in each run.
FISH Protocol for Fluorescence Microscopy
Principle: FISH detects specific DNA sequences using directly or indirectly labeled fluorescent probes that are visualized with fluorescence microscopy [57] [62]. This protocol is adapted for FFPE tissue sections.
Materials:
- FFPE tissue sections (4-5 μm)
- FISH probes (locus-specific, centromeric, or whole chromosome)
- Denaturation solution (70% formamide/2× SSC)
- Ethanol series (70%, 85%, 100%)
- DAPI counterstain with antifade mounting medium
- Fluorescence microscope with appropriate filter sets [57] [62]
Procedure:
- Tissue Preparation: Cut 4-5 μm sections from FFPE blocks, bake at 60°C for 1 hour, and process through xylene and ethanol series as in CISH protocol.
- Pretreatment: Immerse slides in citrate buffer (pH 6.0) and heat in microwave or steamers for 10-15 minutes for antigen retrieval. Cool to room temperature.
- Protease Digestion: Treat slides with pepsin or proteinase K (0.5-1 mg/mL) at 37°C for 10-30 minutes. Optimize concentration and time to balance tissue morphology and signal intensity.
- Denaturation: Denature slides in 70% formamide/2× SSC solution at 72°C-80°C for 5-10 minutes. Immediately dehydrate through cold ethanol series (70%, 85%, 100%) for 2 minutes each.
- Probe Denaturation and Hybridization: Denature FISH probe separately at 73°C-80°C for 5-10 minutes. Apply denatured probe to denatured tissue, coverslip, and seal with rubber cement. Hybridize overnight in a humidified chamber at 37°C-42°C [57].
- Post-Hybridization Washes: Wash slides in 0.4× SSC/0.3% NP-40 at 72°C for 2 minutes, then in 2× SSC/0.1% NP-40 at room temperature for 1 minute.
- Counterstaining and Mounting: Apply DAPI counterstain (125-250 ng/mL) in antifade mounting medium. Store slides in the dark at 4°C until imaging [57].
- Microscopy and Analysis: Visualize using fluorescence microscopy with appropriate filter sets. For HER2 FISH, calculate HER2/CEP17 ratio; ratio >2.2 indicates amplification [57] [62].
Troubleshooting Notes:
- High background fluorescence may indicate insufficient washing or probe concentration.
- Weak signals may result from incomplete denaturation, photobleaching, or inappropriate filter sets.
- Always include control probes and slides in each experiment.
Workflow and Signal Detection Pathways
The fundamental difference between CISH and FISH detection methodologies is illustrated in the following workflow diagrams, highlighting their distinct signal generation pathways and microscopy requirements.
CISH Detection Workflow: This diagram illustrates the chromogenic detection pathway for brightfield microscopy, culminating in enzyme-based signal generation.
FISH Detection Workflow: This diagram illustrates the fluorescent detection pathway requiring specialized fluorescence microscopy.
Advanced Applications and Multiplexing Strategies
Multiplex FISH Capabilities
Fluorescence microscopy enables sophisticated multiplexing approaches through spectral discrimination of multiple fluorophores. Multicolor FISH (M-FISH) techniques allow simultaneous visualization of all human chromosomes using differentially labeled chromosome painting probes [60]. Two primary M-FISH systems have been developed:
- Spectral Karyotyping (SKY): Identifies chromosomes based on their spectral properties across a continuous emission spectrum through Fourier spectroscopy [60].
- M-FISH: Differentiates chromosomes using multiple fluorochromes imaged through specific filter sets with combinatorial labeling [60].
These advanced applications reveal complex chromosomal rearrangements, translocations, and marker chromosome origins that would require multiple sequential experiments with single-color FISH or CISH approaches.
CISH Variations for Enhanced Detection
While standard CISH is primarily a single-plex technique, variations have been developed to address specific diagnostic needs:
- DuoCISH: Enables simultaneous detection of target and reference genes using two different enzyme systems (e.g., HRP and alkaline phosphatase) producing distinct colored precipitates (brown and red) [56]. This allows differentiation between true gene amplification and chromosomal aneuploidy.
- Silver-enhanced ISH (SISH): Uses silver precipitation to generate black signals, providing an alternative chromogen for multiplexing or enhancing signal intensity [56].
The choice between fluorescence and brightfield microscopy for ISH applications involves balancing multiple factors including diagnostic needs, infrastructure, technical expertise, and budgetary constraints. Fluorescence microscopy offers superior multiplexing capabilities, quantitative signal detection, and established clinical validation as the gold standard for many applications [57] [62]. Brightfield microscopy for CISH provides advantages in permanent specimen archiving, simultaneous assessment of morphology and genetic alterations, and lower infrastructure costs [56] [61].
For laboratories establishing ISH capabilities, the decision should be guided by clinical or research requirements. Laboratories with existing brightfield microscopy infrastructure may find CISH a cost-effective alternative for established single-analyte tests, while centers focusing on complex cytogenetic analyses or developing novel multiplex assays will benefit from investing in fluorescence microscopy systems. As both technologies continue to evolve, hybrid approaches that leverage the strengths of both detection modalities may offer the most comprehensive solutions for molecular pathology and targeted therapy selection.
A critical decision in any molecular pathology or research laboratory utilizing in situ hybridization (ISH) technologies is the choice of detection system. This choice fundamentally influences the longevity of experimental results, the ease of interpretation, and the integration into archival systems. The core dichotomy lies between fluorescence in situ hybridization (FISH), which employs fluorescently-labeled probes, and chromogenic in situ hybridization (CISH), which uses enzyme-based reactions to produce a permanent, colored precipitate [63]. Within the context of a broader thesis comparing these methodologies, this application note provides a detailed examination of their relative performance concerning signal permanence and archiving, supported by quantitative data and actionable protocols.
Quantitative Comparison: FISH vs. CISH
The technical differences between FISH and CISH translate into distinct practical advantages and limitations. The table below summarizes the key characteristics based on comparative studies.
Table 1: Technical and Practical Comparison of FISH and CISH
| Characteristic | Fluorescence ISH (FISH) | Chromogenic ISH (CISH) |
|---|---|---|
| Signal Type | Fluorescent emission [7] | Chromogenic precipitate (e.g., DAB, Fast Red) [41] [64] |
| Detection Method | Fluorescence microscope [7] [63] | Standard bright-field microscope [41] [63] |
| Signal Permanence | Low; signals are prone to photobleaching and fade over time, requiring immediate analysis and imaging for permanent record [63]. | High; stained slides are permanent, do not fade, and can be stored for decades like standard histology slides [41] [65]. |
| Archival Compatibility | Poor; fading prevents long-term storage of primary data [63]. | Excellent; fully compatible with routine histopathology archives [41]. |
| Morphology Correlation | Difficult; requires switching between fluorescence and bright-field microscopes or complex merging software to correlate signals with tissue structure [7] [41]. | Easy; gene signals and tissue morphology (via hematoxylin counterstain) are visualized simultaneously under a standard microscope [41] [66]. |
| Throughput & Speed | Slower; imaging requires z-stacking and is time-consuming (e.g., 764 sec/mm² reported) [7]. | Faster; digital scanning is rapid (e.g., 29 sec/mm² reported) and suitable for high-throughput workflows [7]. |
| Primary Application | Often considered the "gold standard," especially for quantitative gene copy number assessment [7] [64]. | Accurate, practical, and economical screening; ideal for confirming ambiguous IHC results [41] [63]. |
The following diagram illustrates the fundamental workflow differences and key decision points leading to the characteristic outcomes for signal permanence in FISH and CISH.
Experimental Validation and Data
Comparative studies consistently demonstrate high concordance between FISH and CISH for clinical diagnostics, such as determining HER2 amplification status in breast cancer.
Table 2: Performance Concordance Between CISH and FISH from Validation Studies
| Study Focus | Number of Cases | Concordance with FISH | Key Findings |
|---|---|---|---|
| HER2 CISH vs. FISH (Modern Pathology, 2002) [41] | 62 breast carcinomas | 100% | CISH is an accurate, practical, and economical approach for screening HER2 status, allowing simultaneous observation of morphology and gene signals. |
| Multi-Assay HER2 Comparison (PMC, 2013) [7] | 95 breast carcinomas (after exclusions) | 99% (94/95 cases) | High concordance (κ = 0.97) was found between mean HER2 ratios from CISH and FISH. CISH technology was noted as superior for high-throughput testing due to scanning speed. |
| AI-Assisted Dual BF ISH (Bioengineering, 2025) [64] | 10 breast carcinomas | Protocols with optimal resolution (0.12 µm/pixel, 0.17 µm/pixel with extended focus) showed consistency with manual FISH. | Highlighted the importance of optimized scanning parameters for reliable automated analysis of bright-field ISH, underscoring its viability as a permanent, analyzable record. |
Detailed Protocols
Protocol: Chromogenic ISH (CISH) for HER2 Detection
This protocol is adapted from established methods for HER2 detection using the VENTANA HER2 Dual ISH assay [64] and related CISH procedures [7] [41].
1. Tissue Preparation and Pretreatment:
- Cut formalin-fixed, paraffin-embedded (FFPE) tissue sections to a thickness of 4–5 µm and mount on charged slides.
- Bake slides at 60°C for 20 minutes to 1 hour to ensure tissue adhesion.
- Deparaffinize slides in xylene and rehydrate through a graded series of ethanol to distilled water.
- Perform heat-induced epitope retrieval in a suitable buffer (e.g., citrate-based, EDTA) using a pressurized decloaking chamber or water bath.
- Digest tissue with pepsin (e.g., 8 minutes at room temperature) to expose target nucleic acids [7].
2. Hybridization:
- Apply a dual-probe cocktail containing a dinitrophenyl (DNP)-labeled HER2 DNA probe and a digoxigenin (DIG)-labeled chromosome 17 centromere (CEN17) probe [41] [64].
- Co-denature probe and target DNA at a specified temperature (e.g., 95°C) for 5-10 minutes.
- Allow hybridization to proceed for 2-16 hours at 37°C in a humidified chamber or automated instrument.
3. Post-Hybridization Washes:
- Wash slides in a stringent buffer (e.g., 2x SSC with 0.1% Triton X-100) to remove unbound and mismatched probes.
- Perform washes at a defined temperature (e.g., 72°C) to ensure specificity [63].
4. Chromogenic Detection:
- HER2 Signal (DNP-labeled probe): Detect using an anti-DNP primary antibody conjugated to horseradish peroxidase (HRP). Apply a silver chromogen substrate, which produces a black, metallic precipitate [64].
- CEN17 Signal (DIG-labeled probe): Detect using an anti-DIG primary antibody conjugated to alkaline phosphatase (AP). Apply a Fast Red substrate, which produces a red precipitate [64].
- Note: Other probe systems may use different labels (e.g., FITC) detected with peroxidase-anti-FITC and DAB, yielding a brown precipitate [7] [41].
5. Counterstaining and Mounting:
- Counterstain lightly with hematoxylin to visualize nuclear morphology.
- Rinse slides in water, air-dry thoroughly and coverslip using a non-aqueous, permanent mounting medium [64].
Protocol: Fluorescence ISH (FISH) and Signal Preservation
This protocol outlines a standard FISH procedure, with special emphasis on steps to mitigate signal fading [7].
1. Tissue Preparation, Pretreatment, and Hybridization:
- Steps are largely analogous to the CISH protocol (Sections 4.1.1-4.1.3).
- Probes are directly labeled with fluorophores (e.g., TexasRed for HER2, FITC for CEN17) or haptens (e.g., DNP, DIG) that are subsequently detected with fluorescently-labeled antibodies [7].
- Hybridization can be accelerated using novel systems like IQ-FISH, which uses ethylene carbonate instead of formamide, reducing assay time from two days to four hours [7].
2. Counterstaining and Mounting for Fluorescence:
- Apply a DAPI (4',6-diamidino-2-phenylindole) counterstain to visualize cell nuclei.
- Mount slides in a commercial anti-fade mounting medium. This is critical for retarding photobleaching.
- Seal the edges of the coverslip with clear nail polish or a proprietary sealant to prevent the medium from drying out and oxygen diffusion, which accelerates fading.
3. Imaging and Archiving (Critical for FISH Permanence):
- Image slides immediately after processing.
- Use a fluorescence microscope equipped with high-quality filters and a high-sensitivity digital camera.
- For quantitative analysis, capture images using consistent exposure settings across all samples.
- Use z-stacking (capturing multiple focal planes) to ensure all signals in a thick nucleus are captured [7].
- The digital image becomes the permanent record. Store images in a secure, backed-up digital repository. The physical slide is not a reliable long-term data source.
The Scientist's Toolkit: Essential Research Reagent Solutions
The following table lists key reagents and their critical functions in performing robust and reliable CISH and FISH assays.
Table 3: Essential Reagents for ISH Assays
| Reagent/Material | Function in Assay | Key Considerations |
|---|---|---|
| Formalin-Fixed Paraffin-Embedded (FFPE) Tissue Sections | The standard biospecimen for archival tissue analysis. | Fixation time must be standardized; over-fixation can mask nucleic acid targets [66]. |
| DNA Probes (HER2, CEN17) | Bind specifically to complementary DNA target sequences. | Can be directly labeled with fluorophores (FISH) or haptens (CISH). "Repeat-free" designs can lower background [7]. |
| Peptide Nucleic Acid (PNA) Probes | Synthetic probes used as alternatives to DNA probes. | More robust binding and resistance to nucleases; often used for centromere repeat probes [7]. |
| Formamide (or Ethylene Carbonate) | Chemical denaturant used in hybridization buffer. | Facilitates DNA strand separation for probe access. Ethylene carbonate allows for faster hybridization [7]. |
| Horseradish Peroxidase (HRP) & Diaminobenzidine (DAB) | Enzyme-substrate pair for chromogenic detection. | HRP-conjugated antibodies bind to probe haptens; DAB produces a stable, brown precipitate [41]. |
| Anti-Fade Mounting Medium | Preserves fluorescence signal in FISH. | Contains compounds that scavenge free radicals, slowing photobleaching. Essential for any FISH application. |
| Automated Slide Scanner | Creates high-resolution digital whole-slide images (WSIs). | For CISH, bright-field scanners with 20x-40x magnification are optimal [64]. For FISH, fluorescence scanners with z-stacking capability are required [7]. |
In the fields of oncology research and diagnostic pathology, fluorescence in situ hybridization (FISH) has established itself as a gold standard technique for detecting genetic abnormalities, particularly in HER2 testing for breast cancer [7] [6]. However, traditional FISH protocols present significant limitations in workflow efficiency, typically requiring overnight hybridization periods that extend turnaround times to 24-48 hours [7]. This procedural bottleneck impacts clinical decision-making timelines and laboratory throughput capacity. The development of rapid FISH technologies, such as the HER2 IQFISH pharmDx Kit, addresses these constraints by substantially reducing processing time while maintaining analytical performance [7] [67]. This application note provides a comparative analysis of standard FISH protocols versus rapid kits, with specific focus on assay time, throughput considerations, and implementation protocols for research and drug development applications.
Comparative Performance Metrics
Quantitative Comparison of Assay Parameters
Table 1: Direct comparison of key parameters between standard FISH and rapid IQFISH technologies
| Parameter | Standard FISH Protocols | Rapid IQFISH Kits |
|---|---|---|
| Total Assay Time | Approximately 24-48 hours [7] | ~3.5 hours [67] |
| Hybridization Time | Overnight (16-24 hours) [7] [6] | 1-4 hours [7] |
| Hybridization Reagent | Formamide [7] | Ethylene carbonate [7] |
| Mechanism of DNA Denaturation | Attacks hydrophilic hydrogen bonds between bases [7] | Breaks hydrophobic forces in DNA helix used in base stacking [7] |
| Repetitive Sequence Blocking | Requires blocking (e.g., alu-PNA) [7] | Not required due to faster reannealing [7] |
| Concordance with Standard FISH | Reference method | 100% demonstrated in validation studies [67] |
Throughput Considerations for Laboratory Workflow
The implementation of rapid FISH technologies significantly impacts laboratory workflow efficiency and throughput capacity:
- Scanning Efficiency: While CISH scanning requires approximately 29 seconds per mm², traditional FISH with z-stacking necessitates 764 seconds per mm², creating substantial bottlenecks in high-volume settings [7].
- Processing Flexibility: The reduced turnaround time of rapid FISH (~3.5 hours) enables same-day results and greater flexibility in laboratory scheduling compared to standard protocols requiring multiple days [67].
- Resource Optimization: The elimination of repetitive sequence blocking steps in IQFISH reduces reagent costs and handling time while maintaining signal specificity [7].
- Integration with Automated Platforms: Recent technological advances have facilitated the development of automated ISH platforms that further enhance throughput and reproducibility for both standard and rapid protocols [68] [69].
Experimental Protocols
Standard FISH Protocol for HER2 Detection
The following protocol details the standard fluorescence in situ hybridization methodology for HER2 gene amplification analysis based on established laboratory procedures [7] [6]:
Sample Preparation:
- Cut 3.5-μm thick sections from formalin-fixed, paraffin-embedded (FFPE) tissue blocks.
- Mount sections on adhesive-coated slides and dry overnight at 56°C.
- Deparaffinize slides by immersion in xylene (3 × 10 minutes).
- Rehydrate through ethanol series (100%, 85%, 70%) for 2 minutes each.
- Rinse in purified water and air dry.
Pretreatment and Denaturation:
- Immerse slides in 0.2N HCl for 20 minutes at room temperature.
- Rinse with wash buffer (2 × 5 minutes).
- Apply pretreatment solution (80°C) for 30 minutes, then rinse with purified water.
- Treat with protease solution (37°C) for 10 minutes.
- Rinse with wash buffer (45-50°C) and air dry.
- Fix slides in 10% buffered formalin for 10 minutes.
- Rinse with wash buffer and dehydrate through ethanol series (70%, 85%, 100%).
- Denature slides in denaturation solution (72°C) for 5 minutes.
- Immediately dehydrate through cold ethanol series (70%, 85%, 100%) and air dry.
Hybridization and Detection:
- Apply 20 μL of LSI HER2/CEP17 probe mixture to target area.
- Apply coverslip and seal with rubber cement.
- Incubate slides in humidified chamber at 37°C for 16-24 hours (overnight).
- Remove coverslip and immerse in post-hybridization wash buffer (72°C) for 2 minutes.
- Air dry in darkness.
- Apply 20 μL of DAPI counterstain and apply coverslip.
- Store in darkness until visualization by fluorescence microscopy.
Rapid IQFISH Protocol for HER2 Detection
The following protocol outlines the rapid IQFISH methodology for HER2 gene amplification analysis [7] [67]:
Sample Preparation:
- Cut 3.5-μm thick sections from FFPE tissue blocks.
- Mount sections on adhesive-coated slides and dry for 1 hour at 56°C.
- Deparaffinize and rehydrate using standard methods (as in Section 3.1).
- Treat slides with pepsin for 8 minutes at room temperature [7].
Pretreatment and Denaturation:
- Apply pretreatment solution containing ethylene carbonate to target area.
- Apply coverslip and place on 95°C hot plate for 5-10 minutes [6].
- Remove from heat and maintain at 37°C for 1-4 hours in humidified chamber [7].
Hybridization and Detection:
- Remove coverslip and wash slides in 0.5× sodium chloride citrate for 5 minutes.
- Rinse with phosphate-buffered saline/Tween solution.
- Apply 100 μL of FITC-conjugated anti-digoxigenin antibody for 30-60 minutes.
- Rinse with phosphate-buffered saline.
- Apply 100 μL of HRP-conjugated anti-FITC antibody for 30-60 minutes.
- Rinse with phosphate-buffered saline.
- Apply 150 μL of 3,3-diaminobenzidine tetrahydrochloride (DAB) for 20-30 minutes.
- Rinse with purified water.
- Counterstain with hematoxylin and eosin.
- Dehydrate, clear, and mount for bright-field microscopy.
Workflow Visualization
Key Technological Differentiators
The fundamental differences between standard FISH and rapid IQFISH technologies extend beyond processing time to encompass distinct biochemical mechanisms:
- DNA Denaturation Chemistry: Standard FISH employs formamide to attack hydrophilic hydrogen bonds between DNA bases, while IQFISH utilizes ethylene carbonate to break hydrophobic forces in the DNA helix used in base stacking [7].
- Repetitive Sequence Management: The faster reannealing of internal genomic repetitive sequences with polar aprotic solvents in IQFISH eliminates the need for separate blocking steps required in standard FISH protocols [7].
- Signal Detection Methodology: While standard FISH relies on direct fluorescence detection, IQFISH incorporates chromogenic detection through peroxidase-based reactions, enabling bright-field microscopy [7].
- Probe Technology: Standard FISH typically utilizes DNA-based probes with fluorochrome labeling (TexasRed, FITC), while rapid FISH may employ peptide nucleic acid (PNA) probes for enhanced hybridization efficiency [7].
Research Reagent Solutions
Table 2: Essential research reagents and materials for FISH-based HER2 analysis
| Reagent/Material | Function | Example Products/Formats |
|---|---|---|
| DNA Probes | Specific detection of target DNA sequences through complementary base pairing | HER2/CEP17 probe mixtures (LSI HER2/CEP17, PathVysion) [7] [6] |
| PNA Probes | Enhanced hybridization efficiency and stability for centromere reference | CEN17 PNA probes [7] |
| Hybridization Buffers | Maintain optimal pH and ionic strength for specific probe binding | Formamide-based buffers (standard), ethylene carbonate buffers (rapid) [7] |
| Blocking Reagents | Reduce non-specific background signal | alu-PNA for repeated sequence blocking (standard FISH) [7] |
| Detection Systems | Visualization of hybridized probes | Fluorochrome conjugates (FITC, TexasRed), enzyme conjugates (HRP) with chromogenic substrates (DAB) [7] |
| Counterstains | Nuclear visualization for signal enumeration | DAPI (fluorescence), hematoxylin (bright-field) [7] [6] |
| Mounting Media | Preserve signals and optimize microscopy | Anti-fade mounting media (fluorescence), permanent mounting media (bright-field) |
The comparative analysis demonstrates that rapid FISH technologies, particularly IQFISH, offer significant advantages in processing time without compromising analytical performance. The 3.5-hour protocol achieves 100% concordance with standard FISH while eliminating the overnight hybridization requirement [67]. For research and drug development applications, the implementation strategy should consider:
- Throughput Requirements: High-volume laboratories should prioritize rapid FISH technologies to maximize equipment utilization and personnel efficiency.
- Existing Infrastructure: Laboratories with established fluorescence microscopy may prefer standard FISH, while those with primarily bright-field capabilities may favor chromogenic detection formats.
- Experimental Flexibility: The reduced turnaround time of rapid FISH enables faster iterative experiments in drug development workflows.
- Cost-Benefit Analysis: While reagent costs may vary, the substantial reduction in hands-on time and faster results delivery typically justifies the implementation of rapid technologies.
The continued evolution of FISH technologies, including increased automation and multiplexing capabilities, will further enhance throughput and expand applications in both basic research and clinical drug development [68] [69].
The analysis of genetic aberrations in Formalin-Fixed Paraffin-Embedded (FFPE) tissues represents a cornerstone of modern molecular pathology, enabling crucial diagnostic, prognostic, and therapeutic investigations. The core challenge lies in balancing the need for long-term tissue preservation with maintaining macromolecular integrity for accurate in situ hybridization (ISH) assays. Fixation-induced cross-links, while preserving tissue architecture, can mask target antigens and nucleic acids, and introduce significant autofluorescence, which severely compromises the signal-to-noise ratio in fluorescence-based techniques [70] [71].
This application note details standardized protocols for managing these complexities within a broader research framework comparing chromogenic (CISH) and fluorescent (FISH) in situ hybridization. We provide detailed methodologies for mitigating autofluorescence and quantitative image analysis, providing researchers with the tools to ensure reliable and reproducible data from precious FFPE samples.
Quantitative Comparison: CISH vs. FISH in FFPE Tissues
The choice between CISH and FISH involves trade-offs between multiplexing capability, resolution, and practicality for the diagnostic laboratory. The table below summarizes their key characteristics based on comparative studies.
Table 1: Comparative Analysis of FISH and CISH for Genetic Analysis in FFPE Tissues
| Feature | FISH (Fluorescence ISH) | CISH (Chromogenic ISH) |
|---|---|---|
| Microscope Type | Fluorescence microscope [71] | Standard bright-field microscope [72] [71] |
| Signal Permanence | Fluorophores prone to photobleaching; signals fade over time [71] | Chromogenic precipitates are stable; permanent slides for archiving [72] |
| Multiplexing Capability | High; multiple targets can be detected simultaneously with different fluorophores [71] | Low; typically limited to 1-2 targets due to chromogen overlap on a single channel [66] |
| Spatial Resolution | High, but can be hampered by tissue autofluorescence [70] [71] | High; allows for precise correlation of signal with tissue morphology [72] [71] |
| Probe Design & Application | Probes labeled with fluorophores; used for whole chromosomes, centromeres, or specific loci [71] | Probes labeled with biotin or digoxigenin; detected via enzymatic reaction [72] [71] |
| Analysis & Interpretation | Requires counting signals in multiple focal planes; skilled interpretation needed [71] | Analysis is similar to IHC; easier integration into pathology workflow [72] [66] |
| Concordance with Other Methods | High concordance with PCR-based methods (e.g., 88.1% with qPCR in one study) [72] | High concordance with FISH and PCR-based methods [72] |
Experimental Protocols
Protocol 1: White LED Photobleaching for Autofluorescence Reduction
A major obstacle in FISH of FFPE tissues, especially aged or neuronal samples, is lipofuscin autofluorescence. This protocol describes a simple, cost-effective pre-treatment method to quench this background using high-intensity white light [73] [74].
- Primary Reagents: Tris-buffered Saline (TBS), Sodium Azide [73].
- Equipment: White phosphor LED desk lamp, transparent square petri dish, scaffold, forceps, reflective dome [73].
Step-by-Step Procedure:
- Apparatus Setup: Construct a slide chamber using a 100 mm x 100 mm transparent petri dish. Build a scaffold to elevate the chamber, allowing the lamp head to fit underneath. Remove any diffusers from a white LED desk lamp and orient it upwards. A reflective dome can be constructed by lining a box with aluminum foil [73].
- Solution Preparation: Prepare a bleaching solution of 0.05% sodium azide in 1x TBS. Caution: Sodium azide is highly toxic; wear appropriate personal protective equipment and handle with care [73].
- Photobleaching: In a 4 °C cold room, pour 50 mL of the azide-TBS solution into the slide chamber. Submerge the slide-mounted FFPE tissue sections in the solution. Cover the apparatus with the reflective dome and turn on the LED lamp. Incubate for 48 hours at 4 °C [73] [74].
- Post-Treatment: Following photobleaching, proceed with standard immunofluorescence or FISH staining protocols. The treatment does not adversely affect target signal or tissue integrity [73] [74].
Protocol 2: FISH on FFPE Tissue Sections
This robust protocol is adapted for detecting genetic aberrations in FFPE tissue sections, including Tissue Microarrays (TMAs) [75] [71].
- Primary Reagents: FISH probes specific to target, Formalin-fixed Paraffin-Embedded (FFPE) tissue sections, Hematoxylin and Eosin (H&E) stain, Ethanol series (70%, 85%, 100%), Xylene, 2x Saline-Sodium Citrate (SSC) buffer, Formalin [75] [71].
- Equipment: Fluorescence microscope, slide warmer, humidified hybridization chamber, heated plate, coplin jars [75] [71].
Step-by-Step Procedure:
- Slide Preparation: Cut 4-5 μm thick sections from the FFPE block and mount on glass slides. Incubate slides at 60°C for 30-60 minutes to melt the paraffin and ensure tissue adhesion [71].
- Deparaffinization and Hydration: Deparaffinize slides in xylene (2 changes, 10 minutes each). Hydrate through a graded ethanol series (100%, 85%, 70%, 2 minutes each) and rinse in distilled water [75] [71].
- Pretreatment and Proteolysis: Immerse slides in a pre-warmed citric acid-based antigen retrieval buffer (pH 6.0-6.2). Heat in a water bath or steamer at 90-95°C for 10-30 minutes and cool. Treat with a proteinase digesting enzyme (e.g., pepsin) at 37°C for 5-30 minutes to expose nucleic acids [73] [71].
- Denaturation and Hybridization: Apply the desired FISH probe to the target area, cover with a coverslip, and seal with rubber cement. Co-denature probe and specimen DNA on a heated plate at 75-80°C for 5-10 minutes. Incubate slides in a humidified, dark chamber at 37°C overnight (or for 12-16 hours) to allow for hybridization [71].
- Post-Hybridization Washing: Remove the coverslip and wash slides in a solution of 2x SSC at 72°C for 2-5 minutes to remove unbound probe [71].
- Counterstaining and Mounting: Apply a counterstain, such as DAPI (4',6-diamidino-2-phenylindole), to visualize cell nuclei. Mount slides with an anti-fade mounting medium [71].
- Signal Analysis: Analyze signals using a fluorescence microscope equipped with appropriate filters. Score at least 50-100 non-overlapping, intact interphase nuclei from the marked tumor area. The definition of a positive result (e.g., gene amplification) is probe-specific [72] [71].
The Scientist's Toolkit: Essential Research Reagents
Table 2: Key Reagents for ISH in FFPE Tissues
| Reagent / Solution | Function / Purpose |
|---|---|
| Formalin-Fixed Paraffin-Embedded (FFPE) Tissue | Preserves tissue morphology and nucleic acids for long-term storage at room temperature; the standard sample source in pathology [72] [71]. |
| FISH Probes (e.g., Locus-Specific, Centromeric) | Labeled nucleic acids that bind complementary target sequences to visualize specific genetic loci or entire chromosomes [71]. |
| Chromogenic Probes (Biotin/Digoxigenin) | Hapten-labeled probes detected by enzyme-conjugated antibodies that produce a permanent, visible precipitate [72] [71]. |
| Sodium Borohydride | Chemical reducing agent that can decrease aldehyde-induced autofluorescence, though with variable efficacy [70]. |
| Sudan Black B or Eriochrome Black T | Lipophilic dyes that quench autofluorescence from endogenous pigments like lipofuscin [70]. |
| Proteinase K / Pepsin | Enzymes used for antigen retrieval to digest proteins and unmask target nucleic acids cross-linked by formalin [71]. |
| DAPI (4',6-diamidino-2-phenylindole) | Fluorescent nuclear counterstain that binds to adenine-thymine-rich regions of DNA, allowing visualization of cell nuclei [71]. |
| Antifade Mounting Medium | Preserves fluorescence by reducing photobleaching during microscopy and storage [71]. |
Visualization and Analysis Workflows
Experimental Workflow for FFPE ISH Analysis
The following diagram outlines the core decision-making and experimental pathway for successfully conducting and analyzing ISH on FFPE tissues.
Probe Design and Signal Interpretation Strategy
Different FISH probe designs are used to detect specific types of genetic abnormalities. The diagram below illustrates the two main designs for identifying gene rearrangements.
Successfully navigating the challenges of autofluorescence and background in FFPE tissues is paramount for obtaining reliable data in both CISH and FISH assays. While FISH offers superior multiplexing capabilities, its utility can be hampered by fixation-induced artifacts and endogenous fluorescence. The protocols detailed herein, particularly the white LED photobleaching technique, provide a robust and accessible means to mitigate these issues. The choice between CISH and FISH ultimately depends on the specific research question, weighing the need for multiplexing and resolution against the advantages of permanence and integration into standard pathology workflows. By applying these standardized methods and analytical frameworks, researchers can confidently leverage the power of ISH in complex FFPE samples to advance our understanding of disease genetics.
The accurate determination of biomarker status is a critical component of modern pathology, directly influencing diagnosis, prognosis, and treatment selection in oncology and other fields. Within this context, the comparison between chromogenic in situ hybridization (CISH) and fluorescence in situ hybridization (FISH) represents a significant methodological consideration for researchers and drug development professionals. Both techniques are essential for evaluating genetic alterations, such as HER-2/neu gene amplification in breast cancer, but differ substantially in their practical application, analysis requirements, and associated pitfalls [76] [4]. This application note provides a detailed framework for the scoring and analysis of CISH and FISH, focusing on digital imaging approaches, manual counting protocols, and strategies to avoid common analytical errors. The guidance is framed within a broader research thesis comparing these two fundamental in situ hybridization methodologies.
Quantitative Comparison of CISH and FISH
A solid understanding of the performance characteristics of CISH and FISH is prerequisite to selecting an appropriate methodology and interpreting results accurately. The following table summarizes key comparative data from validation studies.
Table 1: Performance Comparison Between CISH and FISH from Validation Studies
| Parameter | CISH Performance | FISH Performance | Study Details |
|---|---|---|---|
| Overall Concordance | 94.8% - 100% [76] [4] | Gold Standard | Based on 200+ cases of invasive breast carcinoma [76] [4] |
| Sensitivity | 97.5% [76] | 100% (Reference) | |
| Specificity | 94% [76] | 100% (Reference) | |
| Interobserver Agreement | 97.5% [76] | Not Specified | Higher than IHC (84%) [76] |
| Microscope Requirement | Conventional bright-field [76] | Fluorescence microscope with specific filters [76] [77] | CISH allows for permanent slides and easier morphological assessment [76] |
| Key Limitation | Difficult multiplexing, narrower dynamic range [44] [78] | Signal fades, requires darkroom, difficult morphology [76] [77] | FISH is often considered the gold standard but has practical drawbacks [76] |
These data demonstrate that CISH is a highly accurate and practical alternative to FISH for determining gene amplification, such as HER-2 status, with the significant advantage of using standard laboratory microscopy.
Experimental Protocols for Scoring and Analysis
Protocol for Manual CISH Scoring and Analysis
Principle: CISH detects gene amplification using a peroxidase-based reaction visible under a standard light microscope. The DNA probe is labeled with digoxigenin and detected with an anti-DIG antibody conjugated to horseradish peroxidase (HRP), followed by a chromogenic reaction with DAB to produce a brown precipitate [4].
Materials:
- HER-2/neu DNA Probe: Digoxigenin-labeled (e.g., Zymed) [4]
- Detection System: Mouse anti-DIG antibody and polymerized HRP anti-mouse antibody [4]
- Chromogen: 3,3'-Diaminobenzidine (DAB) [4]
- Counterstain: Mayer's Hematoxylin [4]
- Microscope: Standard bright-field microscope
Procedure:
- Hybridization: After deparaffinizing, pretreating, and dehydrating the FFPE tissue sections, apply the digoxigenin-labeled HER-2/neu probe. Denature at 74°C for 5 minutes and hybridize overnight at 37°C [4].
- Detection: Wash stringently and sequentially apply the mouse anti-DIG antibody and the polymerized HRP anti-mouse antibody, with appropriate rinses between steps [4].
- Visualization: Apply DAB chromogen to develop the signal, then counterstain lightly with hematoxylin [4].
- Scoring: Evaluate under a 40x objective. Scan the entire tumor area and score signals in at least 60 representative tumor cells [76] [4].
Troubleshooting Pitfalls:
- Pitfall: Over-counterstaining with hematoxylin can obscure CISH signals.
- Solution: Perform a brief (approximately 10-second) hematoxylin counterstain and differentiate properly to ensure nuclear details are clear without masking the brown DAB signal [79].
- Pitfall: Focal amplification can be missed.
- Solution: Systemically scan the entire tumor area to ensure a representative assessment is made.
Protocol for Manual FISH Scoring and Analysis
Principle: FISH uses fluorescently labeled DNA probes to hybridize to specific genomic sequences. The signals are visualized using a fluorescence microscope equipped with specific filters. A common approach for HER-2 uses a dual-probe system (HER-2/neu in SpectrumOrange and chromosome 17 centromere, CEP17, in SpectrumGreen) to calculate a ratio and control for aneuploidy [76] [4].
Materials:
- Dual-Probe Assay: HER-2/neu-specific (SpectrumOrange) and CEP17-specific (SpectrumGreen) DNA probes (e.g., PathVysion, Vysis) [76] [4]
- Counterstain: DAPI (4',6-diamidino-2-phenylindole) [4]
- Microscope: Epifluorescence microscope with appropriate filters for DAPI, SpectrumOrange, and SpectrumGreen [76] [77]
Procedure:
- Hybridization: Deparaffinize and pretreat FFPE sections. Apply the probe mixture, denature, and hybridize for 16-24 hours at 37°C in a humidified chamber [4].
- Post-Hybridization Wash: Wash slides in 0.05x SSC or a similar stringent buffer at 42°C to remove unbound probe [4].
- Mounting: Apply mounting medium containing DAPI for nuclear counterstaining [4].
- Scoring: Store slides in the dark at -20°C until analysis. Using the fluorescence microscope, score at least 60 non-overlapping interphase tumor cell nuclei. Record the number of orange (HER-2) and green (CEP17) signals for each cell [4].
- Calculation: Calculate the average HER-2 signals per nucleus and the average CEP17 signals per nucleus. Then, compute the HER-2/CEP17 ratio.
Troubleshooting Pitfalls:
- Pitfall: Rapid photobleaching of fluorescent signals.
- Solution: Analyze slides promptly, use an anti-fade mounting medium, and minimize the duration of light exposure during analysis [76] [78].
- Pitfall: Difficulty in distinguishing tumor cells from stromal cells due to lack of morphological context.
- Solution: Refer to a corresponding H&E-stained section to accurately identify the tumor areas before FISH scoring [76].
Visualization of Experimental Workflows
The following diagrams illustrate the core workflows and logical decision points for CISH and FISH analyses, providing a clear visual guide for laboratory implementation.
CISH Scoring Workflow
FISH Scoring Logic
The Scientist's Toolkit: Essential Research Reagent Solutions
The following table details key reagents and their critical functions for successfully performing CISH and FISH experiments, based on cited methodologies.
Table 2: Essential Research Reagents for CISH and FISH Analysis
| Reagent / Solution | Function / Purpose | Example / Specification |
|---|---|---|
| Formalin-Fixed Paraffin-Embedded (FFPE) Tissue Sections | Standard specimen type for diagnostic IHC and ISH; requires pre-treatment for probe access [79] | 4 µm thickness is typical for analysis [4] |
| HER-2/neu DNA Probe | Binds specifically to the HER-2/neu gene target sequence for visualization | Digoxigenin-labeled for CISH (Zymed) [4]; SpectrumOrange-labeled for FISH (Vysis) [76] [4] |
| Chromosome 17 Probe (CEP17) | Serves as a reference probe to control for chromosome 17 copy number in dual-probe FISH assays [4] | SpectrumGreen-labeled DNA probe (Vysis) [76] [4] |
| Detection System (CISH) | Immunohistochemical detection of the hapten-labeled DNA probe | Mouse anti-DIG antibody + HRP-polymer anti-mouse + DAB chromogen [4] |
| Counterstain | Provides nuclear context for signal enumeration | Mayer's Hematoxylin (CISH) [79] [4]; DAPI (FISH) [4] |
| Stringent Wash Buffer | Removes unbound and nonspecifically bound probe to reduce background | 0.05x SSC or 2x SSC/0.3% NP-40 at specific temperatures [4] |
| Protease Pre-treatment Solution | Digests proteins surrounding DNA to enable probe access to target sequences | e.g., Protease from Vysis, 10 min at 37°C [4] |
The choice between CISH and FISH involves a careful consideration of technical requirements, analytical capabilities, and practical laboratory constraints. For many applications, particularly HER-2 testing in breast cancer, CISH demonstrates excellent concordance with the gold-standard FISH while offering the significant advantages of bright-field microscopy, permanent slide archiving, and easier integration into routine histopathology workflow [76] [4]. However, FISH remains indispensable for its ability to easily multiplex and its established role as a reference standard [77] [80]. Adherence to the detailed scoring protocols, awareness of common pitfalls, and utilization of the appropriate reagents outlined in this document will ensure the generation of robust, reliable, and actionable genetic data for research and diagnostic purposes.
Head-to-Head: Analytical Performance and Clinical Concordance
The accurate assessment of biomarker status is a cornerstone of modern precision oncology, directly influencing diagnosis, prognosis, and therapeutic selection. Fluorescence in situ hybridization (FISH) has long been a gold standard technique for detecting genetic alterations such as gene amplification and deletion. However, the emergence of brightfield in situ hybridization techniques, notably chromogenic ISH (CISH), presents alternatives that offer advantages in terms of cost, slide permanence, and morphological correlation [81]. This review systematically examines the concordance rates and technical methodologies for two critical biomarkers assessed via in situ hybridization: HER2 in breast cancer and 1p/19q codeletion in oligodendrogliomas. By framing this analysis within a broader comparison of FISH and CISH, we aim to provide researchers and drug development professionals with a consolidated resource of quantitative data and standardized protocols to inform assay selection and validation in clinical and research settings.
The evaluation of biomarker assays relies on understanding their performance characteristics, including concordance with other methods and diagnostic accuracy. The tables below summarize key quantitative findings from clinical studies on HER2 and 1p/19q testing.
Table 1: Concordance Rates and Performance of HER2 Testing Methods (Node-Positive Breast Cancer)
| Testing Method | HER2 Positivity Rate | Concordance with Other Methods (Kappa Statistic) | Clinical Predictive Value |
|---|---|---|---|
| Immunohistochemistry (IHC) | 24% | Moderate concordance with FISH (κ = 64.8%) [82] | Predicted benefit from dose-intense adjuvant doxorubicin-based therapy in HER2-positive patients [82] |
| Fluorescence ISH (FISH) | 17% | Moderate concordance with IHC (κ = 64.8%) and PCR [82] | Reliable predictor of clinical outcome after adjuvant doxorubicin-based therapy [82] |
| Polymerase Chain Reaction (PCR) | 18% | Moderate concordance with IHC and FISH [82] | Predicted benefit from dose-intense adjuvant doxorubicin-based therapy in HER2-positive patients [82] |
Table 2: Diagnostic Performance of FISH Analysis for 1p/19q Status in Oligodendroglial Tumors
| Analysis Method | Number of Tumor Cells Analyzed | Concordance Rate (Manual vs. Automated) | Key Findings and Algorithm Details |
|---|---|---|---|
| Automated FISH (Algorithm 2) | 100 cells | 91% for 1p, 89% for 19q [83] | Algorithm utilizes 24 green/red (G/R) probe combinations, excluding common but non-informative patterns like 1/1 and 3/2 [83] |
| Automated FISH (Algorithm 2) | 200 cells | 100% for both 1p and 19q [83] | Analysis of 200 cells achieves perfect concordance, highlighting the value of automated analysis in identifying cases requiring larger cell counts [83] |
| External Validation | Not Specified | 89% (κ = 0.8) [83] | Validation on an external series of 36 gliomas confirmed the algorithm's robustness for multicentric evaluation [83] |
Table 3: Diagnostic Performance of Advanced MRI Diffusion Models for Predicting Glioma Molecular Status
| Diffusion Model | Parameter | Molecular Marker | Area Under Curve (AUC) | Threshold | Sensitivity | Specificity |
|---|---|---|---|---|---|---|
| Continuous-Time Random Walk (CTRW) | CTRW_α | IDH Status | 0.761 [34] | 0.855 [34] | 0.651 [34] | 0.846 [34] |
| Continuous-Time Random Walk (CTRW) | CTRW_α | 1p/19q Status (in IDH-mutant gliomas) | 0.790 [34] | 0.886 [34] | 0.750 [34] | 0.903 [34] |
Experimental Protocols for Key Assays
Protocol: Automated FISH Analysis for 1p/19q Codeletion in Oligodendrogliomas
This protocol is adapted from a study that developed an algorithm for automated FISH analysis to standardize the assessment of 1p and 19q status in oligodendroglial tumors [83].
1. Sample Preparation:
- Use Formalin-Fixed, Paraffin-Embedded (FFPE) tissue sections from brain tumor biopsies or surgical resections [83].
- Prepare slides according to standard FISH procedures for FFPE tissue using commercially available probes for the 1p36 and 19q13 regions, along with corresponding reference probes (e.g., for 1q and 19p) [83].
2. Automated Imaging and Signal Enumeration:
- Acquire images using an automated fluorescence microscope and associated FISH analysis software.
- The software automatically identifies interphase nuclei and enumerates the green (G, reference probe) and red (R, marker probe) signals for each cell [83].
3. Algorithmic Classification (Algorithm 2):
- Apply a defined algorithm (Algorithm 2) that utilizes 24 specific G/R signal combinations, representing the most statistically significant patterns [83].
- This algorithm excludes some common but non-informative combinations (e.g., 1/1, 3/2) and reclassifies others. For instance, it defines a 1/2 combination as normal and patterns like 3/3, 4/4, and 5/5 as indicative of an imbalanced chromosomal status [83].
- Classify the chromosomal status (deleted, normal, or imbalanced) for each cell based on its G/R combination.
4. Data Analysis and Interpretation:
- Analyze a minimum of 100 to 200 tumor cells [83].
- Use the combination + ratio method to determine the final status for the 1p and 19q arms. This method provides the best concordance between manual and automated analysis [83].
- A case is classified as having a codeletion if both 1p and 19q show a deleted status.
Protocol: HER2 FISH Testing in Breast Cancer
This protocol outlines the standard methodology for determining HER2 amplification status via FISH in breast cancer, as per common clinical practice [81].
1. Sample Preparation:
- Use FFPE tissue sections from breast carcinoma specimens. Adherence to pre-analytical conditions is critical, including time to fixation (less than 1 hour) and duration of fixation (between 6 and 72 hours) [81].
- Hybridize the tissue with a FDA-approved FISH probe kit, such as the PathVysion HER2 DNA Probe Kit, which includes a HER2 gene probe (labeled in a specific color, e.g., black in reports) and a CEP17 chromosome enumeration probe (labeled in another color, e.g., red) [81].
2. Manual Signal Enumeration:
- A technologist or pathologist examines the slide under a fluorescence microscope.
- Count the number of HER2 and CEP17 signals in at least 20 non-overlapping interphase nuclei from two separate areas of invasive tumor (at least 10 cells per area) [81].
3. Calculation and Interpretation:
- Calculate the average HER2 copy number per cell (total HER2 signals / number of cells analyzed).
- Calculate the average CEP17 copy number per cell (total CEP17 signals / number of cells analyzed).
- Calculate the HER2/CEP17 ratio (average HER2 copy number / average CEP17 copy number).
- Interpret results according to ASCO/CAP guidelines. For example, a case is considered HER2-positive (amplified) if the HER2/CEP17 ratio is ≥ 2.0 and the average HER2 copy number is ≥ 4.0 signals/cell [81].
Signaling Pathways and Experimental Workflows
Diagram: ISH Workflow Comparison
Diagram: 1p/19q Clinical Significance
The Scientist's Toolkit: Research Reagent Solutions
Table 4: Essential Reagents and Materials for ISH-Based Biomarker Testing
| Item | Function/Description | Example Applications |
|---|---|---|
| Formalin-Fixed, Paraffin-Embedded (FFPE) Tissue | The standard specimen type for ISH assays in clinical diagnostics; allows for morphological correlation and archiving [83] [81]. | Universal for HER2 (breast) and 1p/19q (glioma) testing [83] [81]. |
| Locus-Specific Identifier (LSI) Probes | Fluorescent or chromogenic DNA probes that bind to specific gene regions of interest (e.g., HER2, 1p36, 19q13) [81]. | HER2 Probe (for 17q11.2-q12); 1p36/1q25 and 19q13/19p13 probe sets [83] [81]. |
| Chromosome Enumeration Probes (CEP) | Probes that bind to the centromeric region of a chromosome (e.g., CEP17) to assess chromosome number and calculate ratios [81]. | CEP17 is used as a reference in HER2 FISH to calculate the HER2/CEP17 ratio [81]. |
| Fluorescence Microscope | Microscope equipped with specific filters and a camera to visualize and capture fluorescent probe signals [81]. | Essential for FISH analysis of HER2 and 1p/19q [83] [81]. |
| Automated FISH Analysis Software | Software that automates the identification of nuclei and the counting of probe signals, improving throughput and standardization [83]. | Used for automated analysis of 1p/19q status in oligodendrogliomas [83]. |
| Break-Apart FISH Probes | A probe design where two differently colored probes flank a gene breakpoint; separation of colors indicates a rearrangement [81]. | Used for detecting gene translocations (e.g., EWSR1, ALK) [81]. |
| Fusion FISH Probes | A probe design where two differently colored probes are located on two different genes; fusion is indicated by the juxtaposition or overlap of signals [81]. | Used for detecting specific gene fusions (e.g., EWSR1::FLI1) [81]. |
Within the context of a broader comparison between chromogenic and fluorescent in situ hybridization, the accurate detection of gene amplifications and deletions is a cornerstone of molecular pathology, directly influencing cancer diagnosis, prognosis, and treatment selection. This assessment hinges on the sensitivity and specificity of the employed techniques. Fluorescence In Situ Hybridization (FISH) is often considered the gold standard for detecting these genetic alterations due to its robust performance [84]. However, Chromogenic In Situ Hybridization (CISH) has emerged as a powerful alternative, offering comparable accuracy with the practical advantage of bright-field microscopy [76] [6]. This application note details the protocols and performance metrics for using CISH in the detection of gene amplifications, using HER2 testing in breast cancer as a key model, and provides a framework for its validation against FISH.
Performance Data: CISH vs. FISH
Extensive validation studies have demonstrated that CISH exhibits high sensitivity and specificity when compared to FISH for the detection of HER2 gene amplification. The table below summarizes key performance data from multiple studies.
Table 1: Concordance Studies Between CISH and FISH for HER2 Amplification Detection in Breast Cancer
| Study Cohort Size | Concordance Rate | Sensitivity of CISH | Specificity of CISH | Citation |
|---|---|---|---|---|
| 100 cases | 100% (88 interpretable cases) | Not specified | Not specified | [4] |
| 200 cases | 94.8% | 97.5% | 94.0% | [76] |
| 188 cases | 94.1% | Not specified | Not specified | [6] |
| 80 cases | 91.3% (73/80 cases) | Not specified | Not specified | [84] |
The high concordance is further supported by excellent interobserver reproducibility. One study reported an overall interobserver agreement of 97.5% for CISH, which was higher than the 84% agreement observed for immunohistochemistry (IHC) in the same study, underscoring its reliability [76]. Another study found that three pathologists agreed on the CISH-determined HER2 status in 91% of cases, with all concordant cases matching the FISH results [84].
Detailed Experimental Protocols
Chromogenic In Situ Hybridization (CISH) for Gene Amplification
This protocol is adapted from methods used in multiple validation studies for detecting HER2 amplification in formalin-fixed, paraffin-embedded (FFPE) breast carcinoma tissues [4] [84]. The workflow for this procedure is summarized in the diagram below.
Materials & Reagents:
- FFPE tissue sections (4-5 µm thick) on charged slides.
- Xylene and graded ethanol series (100%, 95%, 70%).
- Heat pretreatment buffer (e.g., 1 M Sodium Isothiocyanate or Zymed SPOT-Light buffer).
- Protease solution (e.g., Zymed SPOT-Light Enzyme or Vysis Protease).
- Digoxigenin (DIG)-labeled HER2/neu DNA probe (e.g., from Zymed).
- Phosphate-Buffered Saline (PBS) and PBS/Tween.
- Blocking reagent (e.g., CAS-Block from Zymed or 3% H2O2 in methanol).
- Primary antibody: Mouse anti-DIG.
- Secondary detection: Polymerized Horseradish Peroxidase (HRP) anti-mouse antibody.
- Chromogen: 3,3'-Diaminobenzidine (DAB).
- Hematoxylin counterstain.
Procedure:
- Sectioning and Deparaffinization: Cut 4-5 µm sections from the FFPE block and mount onto slides. Deparaffinize in three changes of fresh xylene (3-5 min each), followed by rehydration in graded ethanols (100%, 95%, 70%) and a final rinse in distilled water [4] [84].
- Heat Pretreatment: Incubate slides in a preheated pretreatment buffer (e.g., 1 M NaSCN) at 80°C for 13-30 minutes to expose the target DNA. Rinse thoroughly with distilled water [4] [84].
- Protease Digestion: Apply pretreatment enzyme (e.g., Protease from Vysis or Zymed) and incubate at 37°C for 5-13 minutes to digest surrounding proteins and allow probe access. Rinse with distilled water and dehydrate in graded ethanols [4] [6] [84].
- Probe Application and Hybridization: Apply 15-20 µL of the DIG-labeled HER2 probe to the tissue section, apply a coverslip, and seal with rubber cement. Co-denature the probe and target DNA on a hot plate or hybridizer at 74-95°C for 5-10 minutes. Subsequently, hybridize overnight (16-24 hours) in a humidified chamber at 37°C [4] [6] [84].
- Stringency Washes: Remove the coverslip and wash the slides in a post-hybridization buffer (e.g., 0.5x SSC or 2x SSC/0.3% NP-40) at 73-75°C for 2-5 minutes, followed by several washes in room temperature PBS or distilled water [4] [84].
- Immunodetection:
- Quench endogenous peroxidase activity by incubating in 3% H₂O₂ in methanol for 10 minutes [6] [84].
- Apply a blocking reagent for 10 minutes at ambient temperature.
- Incubate with mouse anti-DIG antibody for 30-60 minutes at room temperature [4] [84].
- Incubate with polymerized HRP anti-mouse antibody for 30-60 minutes at room temperature [4] [84].
- Signal Development and Counterstaining: Apply DAB chromogen substrate for 20-30 minutes. Monitor signal development under a microscope. Rinse slides with distilled water. Counterstain with hematoxylin, dehydrate, and mount with a permanent mounting medium [4] [6] [84].
Fluorescence In Situ Hybridization (FISH) as Reference Method
This protocol outlines the reference FISH method, against which CISH is often validated [4] [84].
Materials & Reagents:
- FFPE tissue sections (4-5 µm thick).
- Denaturation and hybridization system (e.g., Vysis Hybrite).
- LSI HER2/CEP 17 dual-color FISH probe (SpectrumOrange-labeled HER2 probe and SpectrumGreen-labeled CEP17 probe).
- DAPI (4,6-diamidino-2-phenylindole) counterstain.
Procedure:
- Slide Pretreatment: Follow a similar deparaffinization, rehydration, and pretreatment regimen as described in the CISH protocol (Sections 3.1, steps 1-3) [4].
- Probe Denaturation and Hybridization: Apply the dual-color FISH probe mixture to the target area. Denature and hybridize using a controlled system, typically at 73°C for 5 minutes (denaturation) followed by 37°C for 16 hours (hybridization) [4] [84].
- Post-Hybridization Washes: Wash slides in a stringent buffer (e.g., 2x SSC/0.3% NP-40) at 73°C for 2 minutes to remove unbound probe [4].
- Counterstaining and Visualization: Apply DAPI counterstain and a coverslip. Analyze signals using a fluorescence microscope equipped with appropriate filters (e.g., DAPI, SpectrumOrange, SpectrumGreen) [4] [84].
Interpretation and Analysis
CISH Scoring Criteria
CISH results are interpreted using a standard bright-field microscope. The interpretation pathway for gene amplification status is illustrated below.
- Non-Amplified: Defined as one to five distinct brown intranuclear signals per nucleus on average. This range accounts for diploid (1-2 signals) and polypoid (3-5 signals) cell populations [4] [84].
- Low-Level Amplification: Defined as six to ten discrete signals per nucleus in more than 50% of the tumor cells, or the presence of small gene clusters [4].
- High-Level Amplification: Defined as more than ten signals per nucleus, or the presence of large, confluent gene clusters in more than 50% of the tumor cells [4] [84]. Both low and high-level amplification are considered positive for gene amplification.
FISH Scoring Criteria
FISH is typically scored by calculating the ratio of HER2 signals (orange) to chromosome 17 centromere (CEP17) signals (green) in at least 60 tumor cell nuclei.
- Non-Amplified: HER2/CEP17 ratio < 2.0 [4] [84].
- Amplified: HER2/CEP17 ratio ≥ 2.0 [4] [84]. Polysomy of chromosome 17 is suspected when three or more CEP17 signals are present in a significant proportion of cells (>6%) [84].
The Scientist's Toolkit
Table 2: Essential Research Reagent Solutions for CISH
| Reagent / Solution | Function / Purpose | Example |
|---|---|---|
| DIG-Labeled DNA Probe | Binds specifically to the target DNA sequence (e.g., HER2 gene) for detection. | Zymed HER2/neu Probe [4] [6] |
| Heat Pretreatment Buffer | Unmasks target DNA sequences by breaking protein crosslinks formed during fixation. | 1 M Sodium Isothiocyanate [4] [84] |
| Protease Solution | Digests proteins surrounding the DNA, enabling probe access to the target. | Vysis / Zymed Protease [4] [6] |
| Anti-DIG-HRP Conjugate | Antibody that binds to the DIG hapten on the probe, conjugated to HRP for signal generation. | Mouse anti-DIG, then HRP anti-mouse [4] [84] |
| DAB Chromogen | Substrate for HRP. Produces an insoluble brown precipitate at the site of probe hybridization. | 3,3'-Diaminobenzidine [4] [6] |
| Stringent Wash Buffer | Removes unbound and nonspecifically bound probe, reducing background. | 2x SSC / 0.3% NP-40 [4] [84] |
Troubleshooting and Optimization
Common challenges in CISH and their solutions include:
- High Background: Increase the stringency of post-hybridization washes (e.g., adjust temperature or salt concentration). Ensure adequate blocking and consider an acetylation step to block positively charged amines [18].
- Weak or No Signal: Optimize protease digestion time and concentration, as over-digestion damages tissue and under-digestion prevents probe access. Check probe integrity and increase probe concentration if necessary [84] [18].
- Uneven Staining: Ensure the probe and all solutions are evenly distributed across the tissue section. Use a properly sealed humidified chamber to prevent evaporation during hybridization [18].
- Interpretation Difficulty in Borderline Cases: Cases with 4-6 signals per nucleus can be challenging. In such scenarios, it is recommended to confirm the result with FISH, which provides a precise ratio and can account for chromosome 17 polysomy [84].
Chromogenic in situ hybridization (CISH) is an established molecular technique that provides a practical and sensitive method for detecting specific DNA sequences within nuclei and chromosomes. This application note details the distinct advantages of CISH over fluorescence in situ hybridization (FISH), focusing specifically on its rapid workflow, signal permanence, and compatibility with familiar bright-field microscopy. We present validated protocols for both conventional CISH and the novel CRISPR-CISH method, along with quantitative performance data to assist researchers and drug development professionals in implementing this technique for diagnostic and research applications.
In situ hybridization (ISH) is a cornerstone technique for localizing specific nucleic acid sequences directly within cells and tissues, providing essential spatial context that other methods lack [85]. While fluorescence in situ hybridization (FISH) has been widely adopted, it presents challenges including signal fading over time and the requirement for specialized fluorescence microscopy equipment [80] [31].
Chromogenic in situ hybridization (CISH) has emerged as a powerful alternative that addresses these limitations. CISH combines the molecular specificity of DNA hybridization with chromogenic detection that yields permanent, easily interpretable signals visible with standard bright-field microscopy [9] [31]. This technique is particularly valuable in resource-limited settings and for long-term archival of samples where result verification may be needed years after initial testing.
Recent advancements, including CRISPR-CISH, have further enhanced this methodology by eliminating the need for global DNA denaturation, thereby preserving chromatin structure and accelerating the hybridization process [9]. This application note explores the technical advantages of CISH technologies and provides detailed protocols for their implementation in research and diagnostic settings.
Key Advantages of CISH
Speed and Workflow Efficiency
The CISH workflow offers significant time savings compared to conventional FISH. The elimination of fluorescence quenching concerns and complex imaging setups streamlines the process from sample to result.
CRISPR-CISH represents a particularly rapid approach. Unlike standard in situ hybridization methods that require high temperatures or formamide treatments to denature DNA—processes that can extend over hours—CRISPR-CISH activates rapidly at a broad temperature range (4–37°C) and can detect repetitive DNA sequences within seconds to minutes [9]. This speed enables same-day results rather than multi-day procedures.
CISH Workflow: The streamlined CISH process from sample preparation to analysis.
Signal Permanence and Archival Stability
A paramount advantage of CISH is the permanence of its chromogenic signals. Unlike fluorescent signals that photobleach and fade over time, CISH generates stable, precipitate-based signals that remain visible indefinitely [31]. This permits long-term slide storage and retrospective analysis, which is invaluable for clinical diagnostics, legal applications, and longitudinal research studies.
The permanent nature of CISH slides allows them to be incorporated into patient pathology archives alongside traditional H&E and immunohistochemistry slides, creating a comprehensive histopathological record. This characteristic also facilitates result verification, inter-laboratory comparisons, and educational use without concern for signal degradation.
Familiar Workflow and Accessibility
CISH integrates seamlessly into laboratories already performing immunohistochemistry, utilizing similar detection systems, instrumentation, and evaluation expertise. The technique employs conventional bright-field microscopy rather than requiring expensive fluorescence microscopes with specialized filters and light sources [9] [31]. This significantly reduces implementation costs and training requirements.
The accessibility of bright-field microscopy makes CISH particularly valuable for resource-limited laboratories, point-of-care testing facilities, and educational institutions [9]. Additionally, the ability to use common histological counterstains (e.g., hematoxylin) provides superior morphological context compared to FISH, allowing for more precise correlation of genetic changes with tissue architecture.
Quantitative Comparison: CISH vs. FISH
The table below summarizes key performance characteristics between CISH and FISH based on published comparative studies:
Table 1: Performance comparison between CISH and FISH techniques
| Parameter | CISH | FISH | Notes |
|---|---|---|---|
| Signal permanence | Permanent, no fading [31] | Temporary, fades over time | CISH permits long-term archiving |
| Microscope requirements | Standard bright-field [9] [31] | Fluorescence with specific filters | Bright-field more accessible |
| Morphology context | Excellent with hematoxylin [9] | Limited by nuclear counterstains | CISH provides better tissue context |
| Sample processing | Rapid hybridization [9] | Often requires longer procedures | CRISPR-CISH especially fast |
| DNA denaturation | Not required (CRISPR-CISH) [9] | Typically required | CRISPR preserves chromatin structure |
| Concordance with FISH | 100% (in HER2 studies) [31] | Reference standard | Excellent methodological agreement |
Table 2: Concordance rates between CISH and other methods for HER2 detection in breast carcinoma
| Comparison | Concordance Rate | Cases Assessed | Statistical Agreement |
|---|---|---|---|
| CISH vs. IHC (HercepTest) | 95.9% | 171/173 | κ = 0.878 (excellent) [31] |
| CISH vs. FISH (PathVysion) | 100% | 38/38 | Perfect agreement [31] |
| dPCR vs. IHC | 85.0% | 147/173 | κ = 0.482 (moderate) [31] |
Experimental Protocols
Conventional CISH for HER2 Detection
This protocol adapts the method described by Tanner et al. (2002) for detecting HER2 amplification in formalin-fixed, paraffin-embedded breast carcinoma tissue [31].
Materials and Reagents:
- HER2-specific DNA probe (digoxigenin-labeled)
- Formalin-fixed, paraffin-embedded tissue sections (4-5 µm)
- Hybridization buffer
- Anti-digoxigenin-HRP conjugate
- DAB chromogen substrate
- Hematoxylin counterstain
- Ethanol dehydration series (70%, 90%, 100%)
- Xylene
Procedure:
- Deparaffinization and Pretreatment:
- Bake slides at 60°C for 60 minutes
- Deparaffinize in xylene (3 × 10 minutes)
- Rehydrate through ethanol series (100%, 90%, 70%) to distilled water
- Apply heat-induced epitope retrieval in citrate buffer (pH 6.0)
Hybridization:
- Apply HER2 probe to tissue section
- Denature at 94°C for 3 minutes
- Hybridize at 37°C overnight in humidified chamber
Stringency Washes:
- Wash in 2× SSC at 72°C for 5 minutes
- Rinse in PBS at room temperature
Signal Detection:
- Block endogenous peroxidase with 3% H₂O₂ for 10 minutes
- Incubate with anti-digoxigenin-HRP conjugate for 60 minutes
- Develop with DAB chromogen for 10-15 minutes
- Counterstain with hematoxylin for 1-2 minutes
Dehydration and Mounting:
- Dehydrate through ethanol series (70%, 90%, 100%)
- Clear in xylene and mount with permanent mounting medium
Interpretation:
- Amplified: Large gene copy clusters or numerous individual signals per nucleus
- Not Amplified: 1-2 discrete signals per nucleus in most cells
CRISPR-CISH for Repetitive DNA Sequences
This protocol describes the novel CRISPR-CISH method for detecting high-copy repeats in fixed cells and chromosomes, adapted from Potlapalli et al. (2025) [9].
Materials and Reagents:
- Recombinant dCas9 protein with hexahistidine tag
- 3' biotin-labeled tracrRNA
- Target-specific crRNA
- Streptavidin-alkaline phosphatase (AP) or horseradish peroxidase (HRP)
- NBT/BCIP or DAB chromogenic substrate
- Formaldehyde-fixed nuclei or chromosome preparations
- LB01 buffer (15 mM Tris-HCl pH 7.5, 2 mM Na₂-EDTA, 0.5 mM spermin, 80 mM KCl, 20 mM NaCl)
- Ethanol:acetic acid (3:1) fixative
Procedure:
- Sample Preparation:
- Fix young leaf tissue or root tips in formaldehyde (2-4%) under vacuum for 5 min
- Continue fixation for 25 min on ice without vacuum
- Chop tissue in LB01 buffer and filter through 35 µm cell strainer
- Spin onto glass slides using cytocentrifuge (700 rpm for 5 min)
gRNA Complex Formation:
- Combine 3' biotin-labeled tracrRNA with target-specific crRNA
- Heat mixture at 95°C for 2 minutes, then cool to room temperature
dCas9-gRNA Complex Assembly:
- Incubate recombinant dCas9 protein with mature gRNA for 15-30 minutes at 37°C
Hybridization and Detection:
- Apply dCas9-gRNA complex to fixed samples
- Incubate at 37°C for 30-60 minutes
- Wash with PBS to remove unbound complex
- Apply streptavidin-AP or streptavidin-HRP conjugate
- Develop with appropriate chromogenic substrate (NBT/BCIP for AP, DAB for HRP)
- Counterstain with appropriate chromatin stain
- Dehydrate, clear, and mount with permanent medium
CRISPR-CISH Process: Novel method leveraging CRISPR technology for targeted DNA detection.
The Scientist's Toolkit: Essential Research Reagents
Table 3: Essential reagents and materials for CISH experiments
| Reagent/Material | Function | Example Specifications |
|---|---|---|
| dCas9 protein | Binds target DNA without cleavage; CRISPR-CISH core component | Recombinant S. pyogenes dCas9 with D10A and H840A mutations, C-terminal His-tag [9] |
| Biotinylated tracrRNA | Forms functional gRNA with crRNA; provides detection handle | 3' end biotin modification for streptavidin binding [9] |
| Target-specific crRNA | Provides targeting specificity to genomic locus | Designed complementary to repetitive DNA sequences [9] |
| Chromogenic substrates | Generates visible signal at target sites | DAB (brown) for HRP; NBT/BCIP (purple/blue) for AP [9] [31] |
| Streptavidin-enzyme conjugates | Links biotin to signal generation system | Streptavidin-HRP or streptavidin-AP [9] |
| Nuclear counterstains | Provides cellular and nuclear context | Hematoxylin, DAPI, or other chromatin-specific stains [9] |
| Fixation buffers | Preserves cellular structure and chromatin | Formaldehyde (2-4%) in Tris buffer; ethanol:acetic acid (3:1) [9] |
Discussion and Implementation Considerations
The quantitative data and protocols presented herein demonstrate that CISH provides a robust, accessible alternative to FISH with particular advantages in speed, signal permanence, and workflow familiarity. The 100% concordance between CISH and FISH for HER2 detection [31] validates its reliability for critical diagnostic applications.
For laboratories considering implementation, CISH offers the most significant benefits when:
- Long-term sample archiving is required
- Bright-field microscopy is available but fluorescence microscopy is not
- Integration with existing immunohistochemistry workflows is desirable
- Rapid results are needed (particularly with CRISPR-CISH methodology)
The recent development of CRISPR-CISH addresses the major limitation of standard in situ hybridization methods by eliminating DNA denaturation requirements, thereby preserving chromatin structure and significantly accelerating the hybridization process [9]. This advancement makes CISH an even more attractive option for both research and clinical applications.
When implementing CISH, researchers should validate their assays against established standards, particularly for clinical applications. Appropriate controls, including both positive and negative samples, should be included in each run to ensure assay performance. With proper validation and quality control, CISH provides a powerful tool for genomic localization studies that balances technical sophistication with practical implementation.
Within the framework of comparing chromogenic (CISH) and fluorescence in situ hybridization (FISH), understanding the distinct advantages of FISH is crucial for researchers and drug development professionals selecting the optimal technique for their specific applications. FISH employs fluorescently labeled nucleic acid probes to visualize specific DNA or RNA sequences within fixed cells and tissues, enabling the precise localization and quantification of nucleic acid targets [2]. This article details the core strengths of FISH—exceptional sensitivity, superior multiplexing capabilities, and the provision of precise positional information—within the context of a broader methodological comparison. We provide a structured quantitative comparison and detailed experimental protocols to guide researchers in leveraging these advantages for advanced spatial biology research.
Core Advantages and Quantitative Comparison
The performance of FISH can be evaluated through three key metrics: sensitivity, which determines the ability to detect low-abundance targets; multiplexing, which defines the number of distinct targets that can be visualized simultaneously; and the quality of positional information, which is critical for understanding cellular and subcellular context. The tables below summarize how FISH excels in these areas compared to CISH and other common techniques.
Table 1: Overall Technique Comparison: FISH vs. CISH & IHC
| Feature | FISH | CISH | IHC |
|---|---|---|---|
| Target Molecule | DNA or RNA [2] | DNA or RNA [2] | Proteins [2] |
| Detection Principle | Fluorescence [2] | Chromogenic enzymatic reaction [2] | Chromogenic or fluorescent detection [2] |
| Sensitivity | Exceptional, surpasses IHC and CISH [2] | High [2] | Moderate to High [2] |
| Multiplexing Capability | Excels; allows multicolor visualization of multiple targets [2] | Supported, but constrained by substrate limitations [2] | Supported, but limited by spectral/substrate constraints [2] |
| Positional Information | High-resolution, subcellular localization [86] | Preserves tissue architecture [5] | Provides tissue-level localization [2] |
| Required Instrumentation | Fluorescence microscope [2] | Standard bright-field microscope [2] | Bright-field or fluorescence microscope [2] |
| Key Advantage | High-throughput, sensitivity, and multiplexing | Permanent slides, familiar pathology workflow | Direct protein detection and localization |
Table 2: Quantitative Performance of Advanced FISH Methods
| FISH Method | Key Feature | Signal Strength / Speed | Short RNA Detection | Probe Requirements |
|---|---|---|---|---|
| TDDN-FISH | Enzyme-free DNA nanostructure amplification | ~8x faster per round than HCR-FISH; stronger signal than smFISH [86] | Enabled (e.g., miR-21) [86] | Minimal (e.g., 3 primary probes for ACTB mRNA) [86] |
| smFISH | Single-molecule resolution | Standard speed and sensitivity [87] | Challenging | High (e.g., 48 primary probes) [86] |
| HCR-FISH | Enzyme-free hybridization chain reaction | Slower (≥8 h amplification) [86] | Limited | Varies |
| smiFISH | Cost-effective smFISH | Reduced cost [87] | Information Missing | Lower than smFISH [87] |
The following diagram illustrates the logical relationship between the core technical features of FISH, the enhancement strategies they enable, and the resulting experimental advantages.
Diagram 1: FISH technical features and enhancement strategies leading to key advantages.
Detailed Experimental Protocols
Protocol: Iterative RNA FISH for Multiplexed Analysis
This protocol, adapted from a 2025 community method, enables high-throughput, multiplexed RNA detection through iterative rounds of hybridization, imaging, and signal cleavage [88]. It is suitable for both single-molecule RNA FISH and identity barcoding (e.g., MERFISH) in cells and gel-embedded tissues.
I. Materials and Reagents
- Wash Buffer A (40% Formamide Wash Buffer): 2x SSC Buffer, 1% Tween 20, 40% Formamide in nuclease-free water. Note: Formamide is a teratogen; always work in a fume hood. [88]
- Encoding Hybridization Buffer: 2x SSC Buffer, 40% Formamide, 0.1% Yeast tRNA, 1% Murine RNase Inhibitor, 1% Tween 20, 10% Dextran sulfate. Add encoding probes at 5-200 µM final concentration on demand. [88]
- Cleavage Buffer: 2x SSC Buffer, 50mM TCEP (Tris(2-carboxyethyl) phosphine). Prepare on demand. [88]
- Readout Hybridization Buffer (RHB): 2x SSC buffer, 10% ethylene carbonate, 0.1% Murine RNase Inhibitor. Add readout probes at 3 nM final concentration. [88]
- Polyacrylamide (PA) Monomer Solution: 4% 19:1 acrylamide/bis-acrylamide, 60mM Tris-HCl pH8, 0.3M NaCl in nuclease-free water. De-gas before use. [88]
II. Step-by-Step Procedure
- Sample Preparation and Gel Embedding:
- Fix cells or tissues according to standard protocols.
- Permeabilize samples in Permeabilization Buffer (1x PBS, 0.5% Triton X-100).
- Embed samples in a thin polyacrylamide gel (PA Monomer Solution with 0.03% ammonium persulfate and 0.15% TEMED) to maintain structural integrity. Optional: Include fluorescent beads for image registration. [88]
Primary Probe Hybridization (Encoding):
- Apply the Encoding Hybridization Buffer (containing the primary, unlabeled encoding probes) to the sample.
- Incubate in a humidified chamber at 37°C overnight. [88]
Post-Hybridization Washes:
- Rinse the sample with Encoding Buffer Rinse (2x SSC, 0.1% tween 20).
- Wash the sample with pre-warmed Wash Buffer A (40% Formamide) at 37°C for 20-30 minutes.
- Perform a final wash with Wash Buffer B (2x SSC). [88]
Readout and Imaging:
- Apply the Readout Hybridization Buffer containing fluorescently labeled readout probes that bind to the primary encoding probes.
- Incubate at 37°C for 30-60 minutes.
- Wash with Readout Wash Buffer (2x SSC, 10% ethylene carbonate, 0.1% Triton X-100).
- Mount the sample in an appropriate imaging buffer (e.g., Trolox Quinone Imaging Buffer) and acquire images using a fluorescence microscope. [88]
Signal Cleavage and Iteration:
- To proceed to the next round of hybridization, incubate the sample in Cleavage Buffer (containing TCEP) at room temperature for 1 hour to cleave the disulfide-linked fluorophores.
- Wash the sample thoroughly with Wash Buffer B.
- Repeat steps 2-5 for the desired number of iterative rounds. [88]
The workflow for this iterative FISH protocol, from sample preparation through multiple rounds of hybridization and imaging, is depicted below.
Diagram 2: Iterative FISH protocol workflow for multiplexed RNA detection.
Protocol: TDDN-FISH for Enhanced Sensitivity
Tetrahedral DNA Dendritic Nanostructure–Enhanced FISH (TDDN-FISH) is a rapid, enzyme-free method that uses self-assembling DNA nanostructures for significant signal amplification, enabling the detection of short RNAs and low-abundance targets [86].
I. Materials and Reagents
- Tetrahedral DNA Monomers (T0, T1, T2): Self-assembled from four complementary oligonucleotide strands (17 bp side length). T0 is functionalized with sticky ends for primary probe conjugation and dendritic growth initiation [86].
- Primary Bifunctional Probe: Comprises a target-specific sequence for binding endogenous mRNA and a readout sequence for TDDN attachment [86].
- Fluorophore-labeled Oligonucleotides: Complementary to sticky ends on the T2 monomer for final signal output [86].
- Hybridization Buffer (Optimized): Typically contains 10-30% formamide; concentration and incubation temperature (37–42°C) require systematic optimization for specific targets [86].
II. Step-by-Step Procedure
- TDDN Self-Assembly:
- Assemble the dendritic nanostructure in a layer-by-layer (Shell-0 + Shell-1 + Shell-2) fashion from purified T0, T1, and T2 tetrahedral DNA monomers. Validate successful assembly using agarose gel electrophoresis or AFM imaging [86].
Sample Preparation and Primary Probe Hybridization:
- Culture and fix cells (e.g., HeLa cells) using standard methods.
- Hybridize the primary bifunctional probe to the cellular mRNA target (e.g., ACTB mRNA) under optimized conditions [86].
Signal Amplification with TDDN:
- Introduce the pre-assembled TDDN to the sample. The TDDN is designed to specifically bind to the readout sequence of the primary probe via complementary sticky ends.
- Incubate to allow for hybridization, resulting in the attachment of the large, fluorophore-loaded nanostructure to the target mRNA [86].
Imaging and Analysis:
- Perform confocal imaging. The dendritic structure provides exponential signal amplification, generating significantly stronger fluorescence intensity than methods like smFISH or HCR-FISH, and enabling rapid imaging at low magnification [86].
The Scientist's Toolkit: Key Research Reagent Solutions
Successful implementation of advanced FISH assays relies on a suite of specialized reagents. The table below lists essential materials and their functions for setting up these experiments.
Table 3: Essential Reagents for Advanced FISH Protocols
| Reagent / Material | Function / Application | Example Use-Case |
|---|---|---|
| Encoding Probes | Primary, unlabeled DNA probes that specifically bind to the target RNA sequence. | Target recognition in iterative FISH [88]. |
| Readout Probes | Fluorescently labeled probes that bind to the encoding probes, often via a cleavable linker. | Signal generation and erasure in multiplexed FISH [88]. |
| Tetrahedral DNA Dendritic Nanostructure (TDDN) | A engineered, branched DNA nanostructure for exponential signal amplification without enzymes. | High-sensitivity detection of short RNAs and low-abundance mRNAs in TDDN-FISH [86]. |
| Formamide | A denaturing agent used in hybridization buffers to control stringency and reduce background. | Standard component in Wash Buffer A for iterative FISH [88]. |
| Ethylene Carbonate | A polar aprotic solvent used as a faster alternative to formamide for DNA denaturation. | Key component in Readout Hybridization and Wash Buffers for IQ-FISH [7] [88]. |
| Murine RNase Inhibitor | Protects RNA targets from degradation during the experimental workflow. | Added to hybridization and storage buffers to preserve sample RNA integrity [88]. |
| Dextran Sulfate | A volume-excluding polymer that increases effective probe concentration and hybridization efficiency. | Component of hybridization buffers to accelerate probe binding [88]. |
| Tris(2-carboxyethyl)phosphine (TCEP) | A reducing agent that cleaves disulfide bonds. | Cleaves fluorophores from readout probes between imaging rounds in iterative FISH [88]. |
Comparative Analysis with Other Genomic Tools (aCGH, NGS, Karyotyping)
The accurate detection of genetic alterations is fundamental to both diagnostic pathology and drug development research. Chromogenic in situ hybridization (CISH) has emerged as a powerful technique that bridges the gap between traditional molecular diagnostics and modern genomic technologies. Within the broader context of comparing chromogenic and fluorescent in situ hybridization (FISH) methodologies, this application note positions CISH within the contemporary genomic toolkit. We provide a detailed comparative analysis of CISH against array comparative genomic hybridization (aCGH), next-generation sequencing (NGS), and conventional karyotyping, focusing on their respective applications, limitations, and complementarity in research and diagnostic settings. This framework enables researchers to make informed decisions about technology selection based on specific project requirements including resolution, throughput, cost, and infrastructure needs.
Technical Comparison of Major Genomic Platforms
Key Characteristics and Applications
Table 1: Comparative analysis of CISH against other major genomic technologies.
| Technology | Optimal Resolution | Primary Applications | Key Advantages | Major Limitations |
|---|---|---|---|---|
| CISH | Single gene/probe level | HER2/neu status validation [4] [89], viral detection [51] | Bright-field microscopy, permanent slides, morphology correlation [89] [40] | Limited multiplexing, targeted analysis only [51] |
| FISH | Single gene/probe level | HER2/neu validation [40], prenatal aneuploidy detection [90] | High sensitivity/specificity, clinical gold standard [40] | Fluorescence fading, specialized microscopy required [89] |
| Karyotyping | >5-10 Mb | Product of conception analysis [91], constitutional disorders | Genome-wide, detects balanced rearrangements | Low resolution, requires cell culture [91] |
| aCGH/CMA | 10-100 kb [92] | Neurodevelopmental disorders [93] [92], CNV detection | Genome-wide, high-resolution CNV detection [93] [92] | Cannot detect balanced rearrangements, low-level mosaicism [93] |
| NGS | Single nucleotide | PGT-A [90], neurology [92], clinical exome sequencing [93] | Base-pair resolution, high multiplexing capability [93] [90] | Higher cost, complex data analysis, bioinformatics dependency [93] |
Diagnostic Performance Metrics
Table 2: Diagnostic performance comparison across genomic platforms in specific applications.
| Technology | Application Context | Diagnostic Yield/Performance | Concordance with Reference Standard |
|---|---|---|---|
| CISH | HER2 testing in breast cancer (IHC 2+ equivocal cases) | 93% concordance with FISH in equivocal cases [89] | 95.3% overall concordance with FISH across all IHC groups [89] |
| aCGH | Neurodevelopmental Disorders (NDD) | 5.7% solved cases in NDD cohort [93] | Superior to karyotyping; inferior to clinical exome sequencing (20% yield) [93] |
| Clinical Exome Sequencing | Neurodevelopmental Disorders (NDD) | 20% solved cases in NDD cohort [93] | Superior to aCGH for all NDD categories except isolated ASD [93] |
| NGS-based lcWGS | Product of conception (POC) analysis | Equivalent diagnosis between Illumina and Thermo Fisher platforms [91] | 100% concordance between two NGS platforms (Illumina VeriSeq & Ion S5) [91] |
Detailed Experimental Protocols
CISH Protocol for HER2/neu Detection
Sample Preparation:
- Use 4μm thick formalin-fixed paraffin-embedded (FFPE) tissue sections mounted on charged slides
- Deparaffinize in three changes of fresh xylene for 5 minutes each
- Hydrate through graded ethanol series (100%, 95%, 70%) to distilled water [4] [89]
Pretreatment and Proteolytic Digestion:
- Incubate slides in pretreatment buffer (1 M sodium isothiocyanate) at 80°C for 10-30 minutes [89] [84]
- Rinse slides in distilled water for 2 minutes
- Perform enzymatic digestion with pepsin solution (0.5-3 mg/mL) at 37°C for 2-15 minutes [89] [84]
- Optimal digestion time depends on fixation duration and tissue type
Hybridization and Detection:
- Apply digoxigenin-labeled HER2/neu probe to tissue sections
- Codenature specimen and probe at 73-74°C for 5-10 minutes [89] [84]
- Hybridize overnight at 37°C in a humidified chamber
- Remove coverslips and wash stringently with 2×SSC/0.3% NP-40 at 73°C for 2-5 minutes [89] [84]
- Perform immunodetection sequentially with:
- Counterstain with hematoxylin, dehydrate, and mount
Scoring and Interpretation:
- Evaluate using standard bright-field microscopy at 40× objective
- Non-amplified: 1-5 signals per nucleus
- Low-level amplification: 6-10 signals per nucleus in >50% of tumor cells
- High-level amplification: >10 signals or large clusters in >50% of tumor cells [89] [84]
- For HER2/neu, assess minimum of 60 tumor cells in areas of invasive carcinoma
NGS-Based Low-Coverage Whole Genome Sequencing for POC Analysis
DNA Extraction:
- Extract genomic DNA from chorionic villi using Gentra Puregene Tissue Kit
- Carefully remove maternal decidua under microscopy to prevent contamination [91]
Whole Genome Amplification:
- Perform WGA using SurePlex WGA Kit (Illumina) or Ion Reproseq PGS kit (Thermo Fisher)
- Follow manufacturer's instructions for optimal amplification [91]
Library Preparation and Sequencing:
- For Illumina platform: Prepare Nextera libraries, sequence with VeriSeq PGS on MiSeq
- For Ion S5 platform: Use Ion Chef for template preparation, sequence on Ion S5 XL
- Analyze data with BlueFuse Multi (Illumina) or IonReporter (Thermo Fisher) [91]
Quality Control and Data Interpretation:
- Maintain sequencing coverage at 0.1-0.5× for low-pass whole genome analysis
- Implement unique molecular index (UMI) tracking to minimize amplification biases
- Normalize sequence read counts by GC content and mappability
- Use circular binary segmentation for CNV detection with minimum 10-20 Mb resolution [91]
Figure 1: CISH experimental workflow with key decision points highlighted.
Research Reagent Solutions
Table 3: Essential research reagents and materials for CISH experimentation.
| Reagent/Material | Manufacturer/Example | Function in Protocol |
|---|---|---|
| HER2/neu DNA Probe | Zymed/PathVysion | Target-specific hybridization for gene amplification detection [89] [84] |
| Digoxigenin Labeling System | Roche DIG Labeling Kit | Non-radioactive probe labeling for bright-field detection [51] |
| Anti-Digoxigenin Antibody | Mouse monoclonal anti-DIG | Primary antibody for probe detection [89] [84] |
| HRP-Conjugated Secondary | Polymerized HRP anti-mouse | Enzyme conjugation for signal amplification [89] |
| DAB Substrate | 3,3'-Diaminobenzidine | Chromogenic enzyme substrate producing brown precipitate [89] [84] |
| Protease Solution | Pepsin/Trypsin | Tissue digestion for probe accessibility [89] [84] |
| Hybridization Buffer | Zymed CISH Hybridization Buffer | Optimal environment for probe-target hybridization [89] |
| Stringent Wash Buffer | SSC/NP-40 Solution | Removal of non-specifically bound probe [89] [84] |
Integrated Analysis Framework and Clinical Applications
Strategic Technology Selection
Figure 2: Decision framework for selecting appropriate genomic technology based on research requirements.
Resolution and Application Space Mapping
Each genomic technology occupies a distinct space in the resolution-application landscape. CISH provides intermediate resolution at the single-gene level with the unique advantage of direct morphological correlation, making it indispensable for solid tumor analysis where tumor heterogeneity must be assessed within specific histological contexts [89] [40]. The technology's validation in HER2/neu testing with >95% concordance to FISH establishes its reliability for clinical applications where bright-field microscopy offers practical advantages [89] [84].
aCGH delivers higher resolution (10-100 kb) for genome-wide copy number variant detection without the need for cell culture, overcoming a significant limitation of conventional karyotyping [92]. However, its inability to detect balanced chromosomal rearrangements and low-level mosaicism represents a diagnostic gap, particularly in prenatal and constitutional genetic testing [93].
NGS platforms provide the highest resolution down to single nucleotide level, with demonstrated diagnostic superiority in heterogeneous conditions like neurodevelopmental disorders where aCGH yield is only 5.7% compared to 20% for clinical exome sequencing [93]. The equivalence between different NGS platforms (Illumina VeriSeq and Thermo Fisher ReproSeq) in product of conception analysis further validates the robustness of this technology [91].
Artifact Recognition and Technical Limitations
Each technology presents characteristic artifacts that researchers must recognize. CISH may show equivocal or borderline signals against high background, particularly challenging in cases with chromosome 17 polysomy [40] [84]. NGS-based approaches demonstrate reduced X chromosome sequence reads in female samples, initially suggesting monosomy X but subsequently identified as technical artifacts related to X chromosome inactivation and differential methylation patterns [91]. aCGH generates variants of uncertain significance (VOUS) in approximately 9.9% of cases, creating interpretation challenges without parental samples for segregation analysis [93].
The comparative analysis of genomic technologies reveals a complementary rather than competitive relationship between CISH, aCGH, NGS, and karyotyping. CISH maintains a crucial niche in morphological correlation of genetic alterations, particularly for solid tumor analysis, while NGS and aCGH provide progressively higher resolution for genome-wide interrogation. The integration of multiple technologies in a sequential or parallel approach maximizes diagnostic yield, as demonstrated by the 20% solution rate for neurodevelopmental disorders when combining aCGH and clinical exome sequencing [93]. For research and drug development applications, strategic technology selection should be guided by resolution requirements, sample type, infrastructure availability, and the specific biological question, with CISH representing a robust and accessible solution for targeted genetic analysis in morphological context.
The accurate assessment of molecular targets, particularly in oncology and drug development, relies heavily on robust and reliable laboratory techniques. For the detection of gene amplification, fluorescence in situ hybridization (FISH) has long been considered the reference standard method, especially in HER2 testing for breast cancer patients who may benefit from targeted therapies like trastuzumab [94] [5]. However, FISH presents several practical challenges in routine laboratory practice, including requirements for specialized equipment, technical expertise, and higher operational costs. In response to these limitations, chromogenic in situ hybridization (CISH) has emerged as a viable alternative that maintains the core principles of in situ hybridization while offering practical advantages for implementation in diverse laboratory settings [95] [96].
This application note provides a comprehensive decision framework to guide researchers, scientists, and drug development professionals in selecting the most appropriate ISH methodology for their specific projects. By comparing technical requirements, performance characteristics, and practical implementation considerations, we aim to equip investigators with the necessary information to make informed decisions that align with their research objectives, resource constraints, and application requirements. The data and protocols presented herein draw from multicenter validation studies and technical analyses to ensure evidence-based recommendations for method selection.
Technical Comparison: CISH versus FISH
Fundamental Methodological Differences
Both FISH and CISH operate on the same fundamental principle of using nucleic acid probes with high sequence complementarity to target specific DNA sequences within cells. The critical distinction lies in their detection and visualization methods. FISH employs fluorescently labeled probes detected using fluorescence microscopy, while CISH uses an immunoperoxidase-based color reaction visible under a standard brightfield microscope [97] [98].
FISH may utilize either direct labeling (with fluorescent dyes attached to the probe) or indirect labeling (with probes labeled with biotin or digoxigenin detected with fluorescently labeled streptavidin or antibodies). In contrast, CISH is typically performed using indirect labeling followed by enzymatic detection that produces a permanent chromogenic precipitate [97] [98]. This fundamental difference in detection methodology drives many of the practical distinctions between the two techniques, including equipment requirements, reagent stability, and sample permanence.
Performance Characteristics and Concordance
Multiple studies have demonstrated excellent concordance between CISH and FISH across various applications. A large multicenter study analyzing 840 breast cancer cases reported a 98% concordance between CISH and FISH when based on the HER2/CEN17 ratio [94] [8]. Another study focusing on HER2 testing found 93-98% concordance across different immunohistochemistry groups, with the highest agreement in unequivocally positive or negative cases [5]. The sensitivity and specificity of CISH have been shown to be comparable to FISH, making it a reliable alternative for determining gene amplification status in clinical and research settings [94].
Table 1: Performance Comparison Between CISH and FISH Based on Multicenter Studies
| Parameter | CISH Performance | FISH Performance | Concordance |
|---|---|---|---|
| HER2/CEN17 Ratio (n=108) | 98% agreement with reference | Reference standard | 98% [94] [8] |
| Analytical Sensitivity | 99-100% [94] | Reference standard | High |
| Analytical Specificity | 97% [94] | Reference standard | High |
| Success Rate | 95-100% [95] [96] | >95% | Comparable |
| IHC 2+ Concordance | 89-100% [94] [5] | Reference standard | Variable by study |
Practical Implementation Considerations
From an implementation perspective, CISH offers several distinct advantages for research and diagnostic laboratories. The requirement for only a standard brightfield microscope rather than specialized fluorescence microscopy equipment significantly reduces initial capital investment and ongoing maintenance costs [97] [96]. CISH reagents demonstrate greater stability compared to fluorescent reagents, allowing for repeated examination of the same sample over time without signal degradation [97]. The permanent staining nature of CISH slides facilitates archiving and retrospective studies, and the simultaneous assessment of gene amplification alongside tissue morphology is particularly valuable for pathological evaluation [95] [98].
FISH maintains advantages in certain applications, particularly those requiring multicolor visualization of multiple genetic targets simultaneously. The greater spectral flexibility, sensitivity, and spatial resolution of fluorochromes make FISH more suitable for complex cytogenetic analyses involving multiple probes [98]. Additionally, while CISH probe availability has expanded, FISH still offers a broader range of commercially available probes for various genetic targets.
Table 2: Practical Implementation Considerations for CISH and FISH
| Consideration | CISH | FISH |
|---|---|---|
| Microscope Requirements | Standard brightfield microscope | Fluorescence microscope with specific filters |
| Signal Permanence | Permanent, can be archived | Fades over time, requires digital capture |
| Cell Morphology Assessment | Easily assessed simultaneously | Difficult to assess simultaneously |
| Multiplexing Capacity | Limited, primarily single-color | Excellent, multiple colors possible |
| Technical Expertise | Familiar to most lab personnel | Requires cytogenetic training |
| Commercial Probe Availability | Growing but limited | Extensive |
| Cost per Test | Lower [96] | Higher [94] |
| Throughput Capacity | Higher for screening [97] | Lower due to analysis time |
Experimental Protocols
CISH Protocol for Formalin-Fixed Paraffin-Embedded Tissue
The following protocol is adapted from established CISH methodologies for detecting gene amplification in FFPE tissue sections [96]:
Sample Preparation:
- Cut 4-5 μm thick sections from FFPE tissue blocks and mount on Histogrip-treated microscope slides.
- Dry slides at 37°C for 1 hour, then bake for 2-4 hours at 60°C.
- Deparaffinize slides by immersing in xylene (3 changes, 15 minutes each).
- Hydrate through graded ethanol series (100%, 95%, 85%, 70%) for 2 minutes each.
- Rinse in distilled water and place in phosphate-buffered saline (PBS).
Heat Pretreatment and Enzymatic Digestion:
- Immerse slides in preheated SPOT-Light Tissue Heat Pretreatment Buffer (or citrate buffer).
- Microwave for 10 minutes at 92-100°C, then cool for 20 minutes at room temperature.
- Wash in PBS (2 changes, 3 minutes each).
- Apply 100 μl of SPOT-Light Tissue Pretreatment Enzyme (or pepsin solution).
- Incubate for 10 minutes at 37°C, then wash in PBS (3 changes, 2 minutes each).
- Dehydrate through ethanol series (70%, 85%, 95%, 100%) for 2 minutes each, then air dry.
Hybridization:
- Apply 15 μl of denatured probe to the center of each sample.
- Cover with 24×32 mm coverslip, seal with rubber cement to prevent evaporation.
- Denature at 94°C for 3 minutes on a heat block.
- Transfer to a humidified chamber and hybridize for 16-24 hours at 37°C.
Post-Hybridization Washes and Detection:
- Remove rubber cement and coverslips carefully.
- Wash in 0.5×SSC buffer for 5 minutes at 75°C.
- Rinse in PBS-Tween 20 (3 changes, 2 minutes each).
- Quench endogenous peroxidase with 3% H₂O₂ in methanol for 10 minutes.
- Wash in PBS (3 changes, 2 minutes each).
- Apply fluorescein isothiocyanate-labeled anti-digoxigenin (100 μl).
- Incubate for 30 minutes at room temperature, wash in PBS-Tween.
- Apply horseradish peroxidase-labeled anti-fluorescein isothiocyanate (100 μl).
- Incubate for 30 minutes at room temperature, wash in PBS-Tween.
- Develop with diaminobenzidine chromogen for 15-30 minutes.
- Counterstain with Gill-2 hematoxylin for 3 minutes.
- Dehydrate through ethanol series, clear in xylene, and mount with coverslip.
FISH Protocol for Formalin-Fixed Paraffin-Embedded Tissue
The following protocol outlines the standard FISH procedure for FFPE tissue sections [99]:
Sample Preparation and Pretreatment:
- Cut 4-5 μm thick sections from FFPE tissue blocks and mount on charged slides.
- Dry slides at room temperature, then bake at 56-60°C for 2-4 hours.
- Deparaffinize in xylene (3 changes, 10 minutes each).
- Hydrate through graded ethanol series (100%, 95%, 70%) for 2 minutes each.
- Air dry slides completely.
- Immerse in pretreatment solution (usually sodium thiocyanate) at 80°C for 10-30 minutes.
- Rinse in distilled water, then in 2×SSC.
- Digest with proteinase K solution (0.25 mg/ml) at 37°C for 10-30 minutes.
- Rinse in 2×SSC, then dehydrate through ethanol series (70%, 85%, 100%) for 2 minutes each.
- Air dry slides completely.
Probe Denaturation and Hybridization:
- Apply denatured probe mixture (10 μl) to target area.
- Cover with coverslip and seal with rubber cement.
- Denature at 73-80°C for 5-10 minutes on a heat block.
- Transfer to humidified chamber and hybridize at 37-45°C for 12-24 hours.
Post-Hybridization Washes and Detection:
- Remove coverslips carefully.
- Wash in 0.3-0.4×SSC/0.1% NP-40 at 72-75°C for 2-5 minutes.
- Rinse in 2×SSC/0.1% NP-40 at room temperature for 1 minute.
- Air dry slides in darkness.
- Counterstain with DAPI (125-250 ng/ml in antifade solution).
- Apply coverslip and store in dark at -20°C until analysis.
Visualization and Analysis:
- Analyze using fluorescence microscope with appropriate filters.
- Capture images digitally for permanent record.
- Score appropriate number of cells based on specific assay requirements.
The Scientist's Toolkit: Essential Research Reagent Solutions
Table 3: Essential Research Reagents for CISH and FISH Experiments
| Reagent/Category | Function/Purpose | Specific Examples | Technical Notes |
|---|---|---|---|
| Specific DNA Probes | Hybridize to complementary target sequences | HER2, EGFR, CCND1, MYC probes [98] | Selection depends on research target |
| Chromogenic Detection System | Visualize hybridized probes in CISH | Peroxidase-based detection with DAB [97] [96] | Produces permanent brown precipitate |
| Fluorescent Detection System | Visualize hybridized probes in FISH | Fluorochrome-labeled antibodies/streptavidin [99] | Multiple colors possible |
| Hybridization Buffer | Create optimal hybridization conditions | 0.7 M NaCl, 0.1 M Tris, 0.1% SDS, 10 mM EDTA [99] | Maintains pH and stringency |
| Stringency Wash Solutions | Remove nonspecifically bound probes | SSC buffers at varying concentrations [96] [99] | Critical for signal-to-noise ratio |
| Pretreatment Solutions | Unmask target sequences in FFPE tissue | Proteinase K, sodium thiocyanate [96] [99] | Optimization required per tissue type |
| Counterstains | Visualize cell morphology/nuclei | Hematoxylin (CISH), DAPI (FISH) [96] [99] | Contrast with signal color |
| Mounting Media | Preserve and protect samples | Antifade mounting media (FISH) [99] | Prevents signal fading |
Decision Framework: Selecting the Appropriate Methodology
Key Selection Criteria
The choice between CISH and FISH should be guided by specific research requirements, available resources, and application priorities. The following decision framework provides guidance for selecting the optimal methodology based on key project parameters:
Select CISH when:
- Your laboratory primarily operates with brightfield microscopy equipment
- Budget constraints necessitate lower cost per test [96]
- High-throughput screening is required [97]
- Permanent record-keeping without digital capture is preferred
- Simultaneous assessment of tissue morphology and genetic alteration is critical [95]
- Technical staff are more familiar with immunohistochemistry than fluorescence techniques
- Commercial probes are available for your specific genetic target of interest
Select FISH when:
- Multicolor analysis of multiple genetic targets is required [98]
- Maximum analytical sensitivity is paramount
- The target represents a novel genetic region without established CISH probes
- Quantitative analysis requiring high spatial resolution is needed
- Equipment and expertise for fluorescence microscopy are readily available
- Research protocols have been previously validated using FISH methodology
Special Considerations for Specific Applications
HER2 Testing in Breast Cancer: For HER2 amplification assessment, both CISH and FISH show excellent concordance (98%) [94] [8]. CISH presents a cost-effective alternative for laboratories with high testing volumes, while FISH remains valuable for cases with borderline amplification levels where precise quantification is critical.
Clinical Trial Applications: In drug development contexts, consider the regulatory environment and existing validation data. While FISH has longer-established validation, CISH has demonstrated sufficient performance characteristics for inclusion in testing algorithms [5].
Archival Tissue Studies: For retrospective studies utilizing biobanked samples, CISH offers advantages due to the permanent nature of stained slides, which can be re-evaluated alongside morphology years after initial staining [97].
Multicenter Studies: When designing multicenter trials, CISH may offer advantages in standardization across sites with varying equipment resources, as brightfield microscopy is more universally available than specialized fluorescence systems.
Both CISH and FISH represent powerful techniques for detecting gene amplification in research and diagnostic applications. The selection between these methodologies should be guided by specific project requirements, available resources, and application priorities. CISH offers practical advantages in terms of cost, equipment requirements, and integration with routine histopathology assessment, while FISH maintains strengths in multiplexing capacity, spatial resolution, and established validation in certain regulatory contexts.
The excellent concordance between CISH and FISH demonstrated in multiple studies (93-98%) supports CISH as a viable alternative to FISH in many research scenarios [94] [5] [8]. By applying the decision framework outlined in this application note, researchers can systematically evaluate their specific needs and select the optimal ISH methodology to advance their scientific objectives. As both technologies continue to evolve, with expanding probe availability and protocol refinements, their complementary roles in molecular research and diagnostics will continue to provide valuable tools for scientific discovery and drug development.
Conclusion
Both CISH and FISH are robust, highly concordant techniques for in situ genetic analysis, each with distinct advantages. CISH emerges as a superior choice for high-throughput, routine clinical diagnostics due to its faster scanning, use of standard brightfield microscopy, and permanent, archivable slides, making it ideal for validated single-target assays. FISH remains the gold standard for applications requiring high sensitivity, multiplexing, and the detection of complex rearrangements or fusion genes, despite its need for specialized equipment and issues with signal fading. The choice between them hinges on specific project requirements: throughput, need for multiplexing, available infrastructure, and analytical goals. Future directions will likely see increased integration of digital pathology for both methods and the contextual use of these targeted techniques alongside broader genomic approaches like NGS to provide a comprehensive molecular profile.
References
- 1. Fluorescence In Situ Hybridization (FISH) and Its Applications [https://pmc.ncbi.nlm.nih.gov/articles/PMC7122835/]
- 2. Comprehensive Comparison of IHC, CISH, and FISH ... [https://www.creative-bioarray.com/support/comprehensive-comparison-of-ihc-cish-and-fish-techniques.htm]
- 3. In Situ Hybridization (ISH), CISH, and FISH Reagents [https://www.thermofisher.com/us/en/home/life-science/cell-analysis/cellular-imaging/in-situ-hybridization-ish.html]
- 4. Comparison of Chromogenic In Situ Hybridisation with ... [https://pmc.ncbi.nlm.nih.gov/articles/PMC2447915/]
- 5. a viable alternative to fluorescence in-situ hybridization ... [https://www.sciencedirect.com/science/article/pii/S0893395222033762]
- 6. Comparing Fluorescence In Situ Hybridization and ... [https://www.nature.com/articles/3880868]
- 7. Comparison of Fluorescence In Situ Hybridization and ... [https://pmc.ncbi.nlm.nih.gov/articles/PMC3870126/]
- 8. SISH/CISH or qPCR as alternative techniques to FISH for ... [https://bmccancer.biomedcentral.com/articles/10.1186/1471-2407-13-351]
- 9. CRISPR-CISH: an in situ chromogenic DNA repeat ... [https://pmc.ncbi.nlm.nih.gov/articles/PMC12011966/]
- 10. Fluorescent vs. Chromogenic Detection in Immunohistochemistry – ... [https://blog.biossusa.com/blogs/iggy-the-bioss-dragon/fluorescent-vs-chromogenic-detection-ihc]
- 11. Chromogenic IHC and ISH Resources [https://diagnostics.roche.com/us/en/products/product-category/immunohistochemistry--ihc-/chromogenic-resources.html]
- 12. Choosing Detection Techniques for IHC/ISH: Fluorescence vs Chromogenic [https://www.leicabiosystems.com/us/educational-resources/webinars/selecting-the-right-detection-for-your-ihcish-project-fluorescence/]
- 13. Quantitative Image Analysis for Tissue Biomarker Use [https://pmc.ncbi.nlm.nih.gov/articles/PMC8354563/]
- 14. Automation of fluorescent in situ hybridization (FISH) ... [https://pubmed.ncbi.nlm.nih.gov/40962484/]
- 15. Comparison of Fluorescence In Situ Hybridization, Next- ... [https://www.sciencedirect.com/science/article/pii/S0023683725000789]
- 16. Review of In Situ Hybridization (ISH) Stain Images Using ... [https://pmc.ncbi.nlm.nih.gov/articles/PMC11430898/]
- 17. Integration of Chromogenic RNAscope In Situ ... [https://pubmed.ncbi.nlm.nih.gov/39829073/]
- 18. ISH Protocol [https://www.bostonbioproducts.com/resources/ish-protocol/]
- 19. Chromogenic in situ hybridisation [https://www.protocols.io/view/chromogenic-in-situ-hybridisation-dgjp3umn.html]
- 20. Overview of In Situ Hybridization [https://www.creative-bioarray.com/support/ish-fish.htm]
- 21. HER2 FISH for Breast Cancer: Advances in Quantitative ... [https://www.lidsen.com/journals/genetics/genetics-04-02-109/1000]
- 22. Silver and chromogenic in situ hybridization (SISH and CISH) [https://bio-protocol.org/exchange/minidetail?id=417119&type=30]
- 23. CRISPR-CISH: an in situ chromogenic DNA repeat ... [https://pubmed.ncbi.nlm.nih.gov/40259121/]
- 24. Technical innovations of signal amplification in ... [https://pubmed.ncbi.nlm.nih.gov/40578770/]
- 25. U-FISH: a fluorescent spot detector for imaging-based spatial ... [https://genomebiology.biomedcentral.com/articles/10.1186/s13059-025-03736-x]
- 26. Classification of the Fluorescence In Situ Hybridization- ... [https://www.federalregister.gov/documents/2025/06/26/2025-11793/medical-devices-hematology-and-pathology-devices-classification-of-the-fluorescence-in-situ]
- 27. History of technology | Evolution, Ages, & Facts [https://www.britannica.com/technology/history-of-technology]
- 28. Technology in deep time: How it evolves alongside us [https://www.bbc.com/future/article/20190207-technology-in-deep-time-how-it-evolves-alongside-us]
- 29. Comparison of Immunohistochemical Methods (IHC) and ... [https://pmc.ncbi.nlm.nih.gov/articles/PMC9985809/]
- 30. Concordance of HER2 Immunohistochemistry and ... [https://ar.iiarjournals.org/content/37/6/3323]
- 31. Chromogenic In Situ Hybridization: A Novel Approach to ... [https://www.nature.com/articles/3780502]
- 32. HER-2 gene amplification by chromogenic in situ ... [https://pubmed.ncbi.nlm.nih.gov/16290155/]
- 33. Frequency of false-positive FISH 1p/19q codeletion in adult ... [https://pmc.ncbi.nlm.nih.gov/articles/PMC7654379/]
- 34. Predicting IDH and 1p/19q molecular status of gliomas ... - PMC [https://pmc.ncbi.nlm.nih.gov/articles/PMC12344946/]
- 35. Overview on Techniques to Construct Tissue Arrays with ... [https://pmc.ncbi.nlm.nih.gov/articles/PMC5003444/]
- 36. Automated measurement of estrogen receptor in breast ... [https://www.sciencedirect.com/science/article/pii/S0023683722011916]
- 37. Fluorescent in Situ Hybridization (FISH) Probe Market Report [https://www.imarcgroup.com/fluorescent-situ-hybridization-probe-market]
- 38. QuantISH: RNA in situ hybridization image analysis framework ... [https://pmc.ncbi.nlm.nih.gov/articles/PMC9249626/]
- 39. Fluorescence In Situ Hybridization (FISH) [https://link.springer.com/book/10.1007/978-1-0716-3766-1]
- 40. Reliability of chromogenic in situ hybridization for detecting ... [https://www.sciencedirect.com/science/article/pii/S0893395222045719]
- 41. Article Determination of HER2 Gene Amplification by ... [https://www.sciencedirect.com/science/article/pii/S0893395222048670]
- 42. Effect of fluorescence in situ hybridization detection ... [https://www.sciencedirect.com/science/article/pii/S2214552425000598]
- 43. Chromogenic IHC Staining Protocol of Paraffin-embedded ... [https://www.rndsystems.com/resources/protocols/protocol-preparation-and-chromogenic-ihc-staining-paraffin-embedded-tissue]
- 44. IHC detection systems: Advantages and Disadvantages [https://www.bio-techne.com/applications/imaging/immunohistochemistry/ihc-detection]
- 45. Chromogenic vs. Fluorescent Techniques [https://www.celnovte.com/solution/multiplex-immunohistochemistry-chromogenic-vs-fluorescent-techniques/]
- 46. Brightfield multiplex immunohistochemistry with ... [https://www.nature.com/articles/s41374-020-0429-0]
- 47. Classification and counting of cells in brightfield ... [https://www.nature.com/articles/s41598-024-59625-z]
- 48. Tissue spatial correlation as cancer marker - PMC [https://pmc.ncbi.nlm.nih.gov/articles/PMC6985696/]
- 49. MetaMorph Microscopy, Microscope Imaging Software [https://www.moleculardevices.com/products/cellular-imaging-systems/high-content-analysis/metamorph-microscopy]
- 50. CACA Technical guidelines for holistic integrative ... [https://link.springer.com/article/10.1007/s44178-025-00149-5]
- 51. Comparison of Different In Situ Hybridization Techniques ... [https://www.mdpi.com/1999-4915/10/7/384]
- 52. European recommendations and quality assurance for ... [https://www.nature.com/articles/s41375-019-0378-z]
- 53. Clinical impact of large genomic explorations at diagnosis in ... [https://pmc.ncbi.nlm.nih.gov/articles/PMC11492794/]
- 54. Reclassification of In Situ Hybridization Test Systems ... [https://www.federalregister.gov/documents/2025/06/11/2025-10549/hematology-and-pathology-devices-reclassification-of-in-situ-hybridization-test-systems-for-use-with]
- 55. Review of In Situ Hybridization Techniques for Drug Research ... [https://pmc.ncbi.nlm.nih.gov/articles/PMC10467011/]
- 56. Chromogenic in situ hybridization [https://en.wikipedia.org/wiki/Chromogenic_in_situ_hybridization]
- 57. Use of Fluorescence In Situ Hybridization (FISH) in Diagnosis ... [https://pmc.ncbi.nlm.nih.gov/articles/PMC7221545/]
- 58. Fluorescence Microscopy vs. Light Microscopy [https://www.news-medical.net/life-sciences/Fluorescence-Microscopy-vs-Light-Microscopy.aspx]
- 59. A quick guide to light microscopy in cell biology - PMC [https://pmc.ncbi.nlm.nih.gov/articles/PMC4713126/]
- 60. Multi-color FISH techniques [https://pubmed.ncbi.nlm.nih.gov/18228456/]
- 61. Validation of chromogenic in situ hybridization for detection ... [https://www.sciencedirect.com/science/article/pii/S0893395222032537]
- 62. Genomic aberration detection by fluorescence in situ ... [https://www.sciencedirect.com/science/article/abs/pii/S0046817725001935]
- 63. Review of In Situ Hybridization (ISH) Stain Images Using ... [https://www.mdpi.com/2075-4418/14/18/2089]
- 64. Optimization of Scanning Protocol for AI-Integrated ... [https://www.mdpi.com/2306-5354/12/6/569]
- 65. CRISPR-CISH: an in situ chromogenic DNA repeat ... [https://link.springer.com/article/10.1007/s10577-025-09767-1]
- 66. QuantISH: RNA in situ hybridization image analysis ... [https://www.nature.com/articles/s41374-022-00743-5]
- 67. Rapid fluorescence in situ hybridisation (FISH)... [https://www.ovid.com/journals/jcpa/fulltext/10.1136/jclinpath-2014-202787~rapid-fluorescence-in-situ-hybridisation-fish-for-her2-erbb2]
- 68. In-Situ Hybridization Market Size to Hit USD ... [https://www.precedenceresearch.com/in-situ-hybridization-market]
- 69. In Situ Hybridization Market: Growth, Size, Share, and Trends [https://www.marketsandmarkets.com/Market-Reports/in-situ-hybridization-market-212028829.html]
- 70. How to reduce autofluorescence [https://www.ptglab.com/news/blog/how-to-reduce-autofluorescence/?srsltid=AfmBOorMG75tHDL9Dzw6kylpHK_mMjDZt7mpqBjzFu83Szn0MVfTurf4]
- 71. In situ hybridisation in tissue sections [https://www.sciencedirect.com/science/article/abs/pii/S1756231720301560]
- 72. Chromogenic in situ Hybridization Compared with Real ... [https://pmc.ncbi.nlm.nih.gov/articles/PMC5831068/]
- 73. Simple Elimination of Background Fluorescence in ... [https://pmc.ncbi.nlm.nih.gov/articles/PMC5614400/]
- 74. Efficient removal of naturally-occurring lipofuscin ... [https://www.sciencedirect.com/science/article/pii/S1526590025005863]
- 75. Fluorescence and chromogenic in situ hybridization to ... [https://www.semanticscholar.org/paper/Fluorescence-and-chromogenic-in-situ-hybridization-Summersgill-Clark/933dd71d318bf6fe5d2cadb448191838ecb213b8]
- 76. HER-2 gene amplification by chromogenic in situ ... [https://www.sciencedirect.com/science/article/abs/pii/S0960977605002511]
- 77. Fluorescence in situ hybridization (FISH): History ... [https://www.sciencedirect.com/science/article/pii/S259000721830008X]
- 78. Fluorescent vs. Chromogenic Detection in ... [https://www.biossusa.com/blogs/news/fluorescent-vs-chromogenic-detection-ihc?srsltid=AfmBOopb2QzhMETSE7tj-YcAqb6vNHJ3QCUlC0yY4vWd04rwpqjlrtpq]
- 79. Pitfalls and Caveats in Applying Chromogenic ... [https://pmc.ncbi.nlm.nih.gov/articles/PMC8232789/]
- 80. Pros and Cons for Fluorescent in Situ Hybridization ... [https://pmc.ncbi.nlm.nih.gov/articles/PMC8009570/]
- 81. FISH overview - Molecular markers [https://www.pathologyoutlines.com/topic/molecularpathfishgeneral.html]
- 82. Comparison of HER2 status by fluorescence in situ ... - PubMed [https://pubmed.ncbi.nlm.nih.gov/15994142/]
- 83. Automated Analysis of 1p/19q Status by FISH in ... [https://pmc.ncbi.nlm.nih.gov/articles/PMC4489714/]
- 84. Reliability of chromogenic in situ hybridization for detecting ... [https://www.nature.com/articles/3800432]
- 85. ISH In Situ Hybridization: Techniques, Applications & Benefits [https://www.betalifesci.com/blogs/news/ish-in-situ-hybridization?srsltid=AfmBOorddjOUo7iihDMMQAFGKPuQm0pms0rCzWI0potaNql5wpaKaysq]
- 86. Tetrahedral DNA dendritic nanostructure-enhanced FISH ... [https://www.nature.com/articles/s41467-025-64294-1]
- 87. High-content enhancement strategies for fluorescence in ... [https://www.sciencedirect.com/science/article/abs/pii/S0165993625002225]
- 88. Iterative RNA FISH Experimental Protocol SOP002.v.4.6 [https://www.protocols.io/view/iterative-rna-fish-experimental-protocol-sop002-v-hadhb2a37.html]
- 89. Chromogenic in-situ hybridization: a viable alternative to ... [https://www.nature.com/articles/3800555]
- 90. Changes in sequencing technology used for ... [https://link.springer.com/article/10.1007/s10815-025-03576-5]
- 91. Comparative Analysis of Two NGS-Based Platforms for ... [https://www.mdpi.com/2073-4425/15/8/1100]
- 92. Advances in chromosomal microarray analysis: Transforming ... [https://pmc.ncbi.nlm.nih.gov/articles/PMC11847126/]
- 93. Comparison of the diagnostic yield of aCGH and genome- ... [https://www.nature.com/articles/s41525-021-00188-7]
- 94. SISH/CISH or qPCR as alternative techniques to FISH for ... [https://pmc.ncbi.nlm.nih.gov/articles/PMC3729815/]
- 95. Agreement between chromogenic in situ hybridisation (CISH ... [https://pmc.ncbi.nlm.nih.gov/articles/PMC2377115/]
- 96. Chromogenic in situ hybridization (CISH) - PubMed Central [https://pmc.ncbi.nlm.nih.gov/articles/PMC549176/]
- 97. Chromogenic In Situ Hybridization [https://fish.creative-bioarray.com/chromogenic-in-situ-hybridization.htm]
- 98. CISH - an overview | ScienceDirect Topics [https://www.sciencedirect.com/topics/medicine-and-dentistry/cish]
- 99. Fluorescence In Situ Hybridization (FISH) protocol [https://www.creativebiomart.net/resource/principle-protocol-fluorescence-in-situ-hybridization-fish-protocol-342.htm]