FISH vs. Next-Generation Sequencing: Assessing Concordance in Modern Clinical Diagnostics
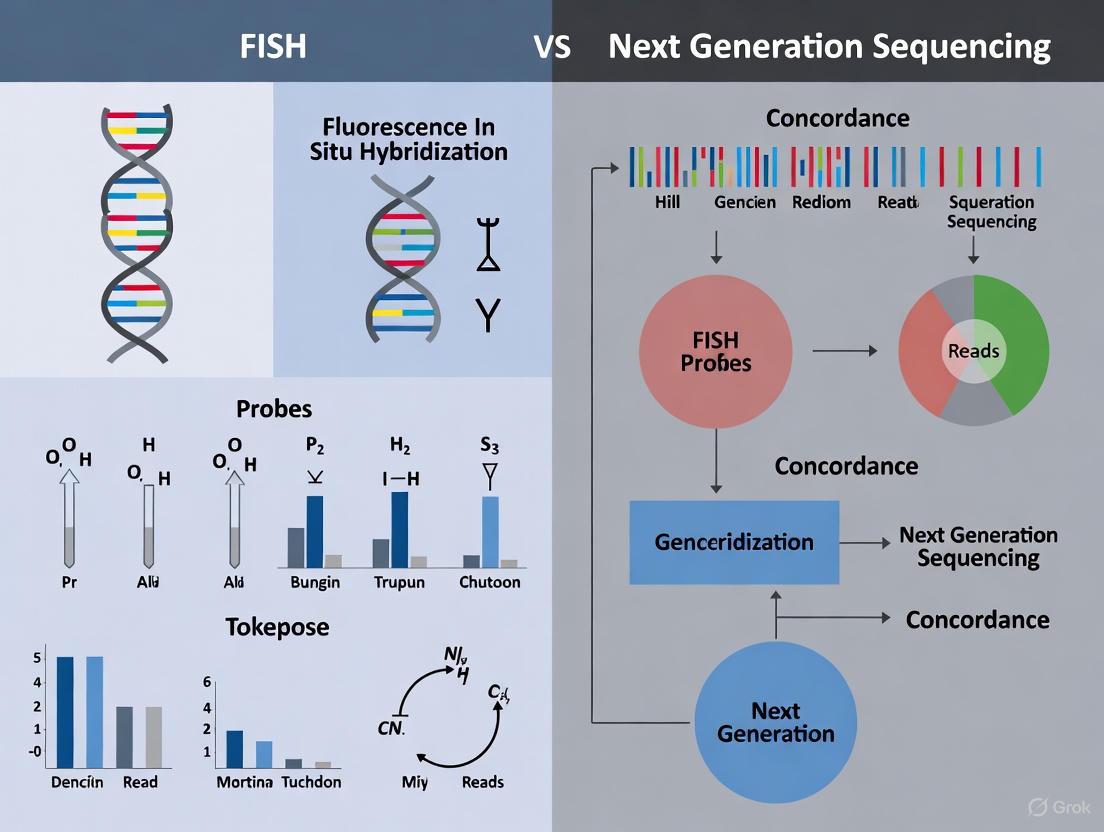
This article provides a comprehensive analysis of the concordance between Fluorescence In Situ Hybridization (FISH) and Next-Generation Sequencing (NGS) for genomic alteration detection in clinical diagnostics.
FISH vs. Next-Generation Sequencing: Assessing Concordance in Modern Clinical Diagnostics
Abstract
This article provides a comprehensive analysis of the concordance between Fluorescence In Situ Hybridization (FISH) and Next-Generation Sequencing (NGS) for genomic alteration detection in clinical diagnostics. Targeting researchers and drug development professionals, it explores the foundational principles of both technologies, examines their comparative performance across various cancer types including gliomas, leukemias, and lung cancers, and discusses methodological applications for optimal integration into diagnostic workflows. The content further addresses troubleshooting discordant results and optimization strategies, culminating in validation frameworks and future directions for multi-platform genomic testing in precision oncology.
Understanding FISH and NGS: Core Technologies in Genomic Analysis
Fluorescence in situ hybridization (FISH) represents a pivotal molecular cytogenetics technique that utilizes fluorescent probes designed to bind to specific complementary nucleic acid sequences. Since its development in the 1970s, FISH has revolutionized the field of cytogenetics by allowing researchers to visualize and map genetic material directly on chromosomes, enabling the identification of specific genes or chromosomal regions with high precision [1]. The technique evolved from earlier in situ hybridization (ISH) methods, with a landmark transition occurring when researchers replaced radioactive labels with fluorescent labels in hybridization probes, thereby significantly improving safety and detection capabilities [1]. The fundamental FISH procedure involves three critical steps: denaturation of both target DNA and probe DNA, hybridization where the probe binds to its complementary target sequence, and detection of probe signals using fluorescence microscopy [1]. This robust methodology has established FISH as the gold standard for diagnosing, prognosticating, and monitoring many cancer types, maintaining its relevance even as newer genomic technologies emerge [1].
Traditional FISH Methodology and Technical Principles
Core Protocol and Workflow
The experimental workflow for FISH involves a series of meticulously optimized steps to ensure accurate and reproducible results. The process begins with sample preparation, where metaphase chromosomes or interphase nuclei are fixed on glass slides. The target DNA and the fluorescently labeled probe DNA are then co-denatured using heat treatment to separate the DNA strands into single-stranded molecules [1]. During the hybridization phase, which typically occurs over 4-16 hours, the probe binds specifically to its complementary DNA sequence. Post-hybridization washes remove any unbound or nonspecifically bound probes to reduce background noise. Finally, the prepared slides are examined under a fluorescence microscope equipped with appropriate filters to detect and visualize the fluorescent signals [1]. For consistent results, this workflow requires careful optimization of multiple parameters including probe concentration, hybridization temperature and duration, and stringency of washes.
Research Reagent Solutions
The following table details essential reagents and their specific functions in a standard FISH protocol:
Table 1: Key Research Reagents in FISH Protocols
| Reagent Type | Specific Function | Application Examples |
|---|---|---|
| Fluorescently Labeled DNA Probes | Binds to complementary target sequences for visualization | Locus-specific probes (e.g., for HER2, ALK); Chromosome enumeration probes (e.g., CEP17) [1] [2] |
| DAPI (4',6-diamidino-2-phenylindole) | Counterstain that binds to AT-rich regions, staining the nuclear material | Provides chromosomal morphology and orientation for signal localization [3] |
| Formamide | Denaturant that lowers the melting temperature of DNA | Used in hybridization buffer to enable denaturation at lower, less damaging temperatures [1] |
| Dextran Sulfate | Macromolecular crowding agent | Accelerates hybridization kinetics in the hybridization buffer [1] |
| Saline-Sodium Citrate (SSC) Buffer | Sets and maintains ionic strength and pH | Used for post-hybridization stringency washes to remove nonspecifically bound probes [1] |
FISH in Clinical and Research Applications
Established Diagnostic and Prognostic Applications
FISH has become an indispensable tool in clinical oncology, with well-established roles in diagnosis, prognosis, and therapeutic monitoring across numerous malignancies [1]. In hematologic oncology, FISH assays significantly increase detection capacity compared to conventional cytogenetics. For instance, in acute myeloid leukemia (AML), where 33-50% of positive specimens present with a normal karyotype, FISH enables high-resolution analysis of recurrent structural chromosomal rearrangements recognized by the World Health Organization as distinct disease entities [1]. Furthermore, FISH serves critical prognostic functions; detection of TP53 (tumor protein p53) deletions often indicates poor outcomes and can mark disease progression or secondary disease in AML and myelodysplastic syndromes (MDS) [1]. The technique also plays a vital role in therapeutic surveillance, where effective treatment typically correlates with reduced abnormal cells in patient samples, while persistent chromosomal abnormalities may indicate residual disease [1].
In solid tumors, FISH provides essential biomarker information that guides targeted therapy decisions. A prominent example is the assessment of HER2 (ERBB2) gene amplification at chromosome band 17q12, which occurs in 20-30% of breast cancers [1]. Patients with HER2 amplification may respond to HER2 inhibitors such as trastuzumab (Herceptin), making FISH identification crucial for treatment selection [1]. Similar applications exist for ALK, ROS1, and RET rearrangements in lung cancer, where FISH testing helps identify patients eligible for specific kinase inhibitors [4].
Technical Advancements and Automation
Recent technological advancements have significantly enhanced FISH methodologies, particularly through the incorporation of automation at various stages of the workflow. Automated systems are now available for suspension harvesting, in situ harvesting, cell separation, specimen dropping onto slides, staining, slide scanning, and even FISH hybridization processing [3]. These automated solutions offer substantial benefits, including reduced technologist hands-on time (approximately 20 minutes for automated harvesting versus 2-3 hours for manual processing), decreased variability in processing steps, lower error risk, and reduced inter-technologist quality complaints [3]. For specialized applications such as plasma cell neoplasm testing, automated cell separation systems can simultaneously process multiple samples for CD138+ plasma cell isolation, significantly improving detection sensitivity for genetic aberrations [3]. While these automated platforms require validation and parameter optimization, they represent a significant step toward standardizing FISH methodologies across laboratories.
Comparative Performance: FISH Versus Next-Generation Sequencing
Concordance Analysis Across Malignancies
The emergence of next-generation sequencing (NGS) as a comprehensive genomic profiling tool has prompted numerous studies comparing its performance with established FISH methodologies. The concordance between these platforms varies depending on the genomic alteration type and specific cancer context. The following table summarizes key comparative performance metrics from recent studies:
Table 2: Concordance Between FISH and Next-Generation Sequencing Across Studies
| Cancer Type | Genetic Alteration | Concordance with FISH | Study Details |
|---|---|---|---|
| Glioma [5] | EGFR, CDKN2A/B, 1p, 19q, chr7, chr10 | High for EGFR; Lower for other markers | 104 patients; FISH showed relatively low concordance with NGS/DNA methylation microarray for most parameters |
| Neuroblastoma [6] | 1p deletion, 11q deletion, 17q gain | Matched for SCAs | 35 patients; NGS identified additional subsegmental 17q gains |
| Chronic Lymphocytic Leukemia [7] | del(17p), del(11q), trisomy 12, del(13q) | Sensitivity >86%, Specificity >95% | 509 patients; targeted sequencing compared to FISH |
| Various Solid Tumors [2] | MET amplification | 91% concordance after optimization | >50,000 tumors; required read depth and focality analyses |
| Non-Small Cell Lung Cancer [4] | EGFR mutations | 93% sensitivity, 97% specificity (tissue) | Meta-analysis of 56 studies |
| Non-Small Cell Lung Cancer [4] | ALK rearrangements | 99% sensitivity, 98% specificity (tissue) | Meta-analysis of 56 studies |
The comparative data reveal that while FISH and NGS generally show strong agreement for many alterations, specific contexts and genomic regions demonstrate notable discrepancies. In glioma diagnostics, for instance, while all three methods (FISH, NGS, and DNA methylation microarray) showed high consistency in EGFR assessment, FISH demonstrated relatively low concordance with NGS in detecting other parameters such as CDKN2A/B alterations and chromosomal arms 1p, 19q, 7, and 10 [5]. Importantly, these discordant cases were associated with high-grade gliomas and high genomic instability, suggesting that tumor biological characteristics influence methodological performance [5].
Diagram 1: Method selection based on genetic alteration type. The optimal choice between FISH and NGS depends on the specific alteration being investigated, with each method having distinct advantages.
Advantages and Limitations in Clinical Practice
Both FISH and NGS present distinctive advantages and limitations that influence their appropriate application in clinical and research settings. FISH offers several unique benefits, including rapid turnaround times (particularly critical for time-sensitive clinical decisions), the ability to analyze genetic alterations in the context of intact cells and tissue morphology, and high sensitivity for detecting specific structural rearrangements even in heterogeneous samples [1]. However, FISH is fundamentally limited by its requirement for prior knowledge of the target abnormality, relatively low multiplexing capability (typically analyzing only a few genetic targets simultaneously), and limited resolution for detecting small genomic alterations [1].
In contrast, NGS provides a comprehensive genomic profile from a single assay, capable of detecting point mutations, insertions/deletions, copy number alterations, gene fusions, and genomic signatures like tumor mutation burden and microsatellite instability [8] [4]. This technique excels in analyzing complex genomic landscapes without requiring predetermined targets and demonstrates superior capability in capturing overall amplification status in heterogeneous tumors [2]. However, NGS has limitations including longer turnaround times in some settings (though liquid biopsy NGS has significantly shorter TAT than tissue testing), higher bioinformatic complexity, inability to provide spatial context within tissues, and potentially lower sensitivity for detecting certain structural rearrangements in liquid biopsies [4].
Integrated Diagnostic Approaches and Future Directions
Complementary Roles in Modern Pathology
Rather than existing as mutually exclusive alternatives, FISH and NGS increasingly function as complementary technologies in comprehensive tumor profiling. This integrated approach leverages the respective strengths of each method to provide a more complete molecular characterization of malignancies [1] [6]. The sequential application of these technologies represents a practical diagnostic strategy in many clinical scenarios. FISH frequently serves as an effective first-line test due to its rapid turnaround and established validation, particularly when clinical suspicion points toward specific, known abnormalities [1]. When FISH results are negative or inconclusive despite strong clinical indication, or when tumor heterogeneity is suspected, NGS offers a valuable follow-up approach to profile a broader genetic landscape [1] [2].
This complementary relationship is particularly evident in neuroblastoma diagnostics, where NGS has demonstrated capability as a sensitive complementary and alternative method to conventional FISH for detecting segmental chromosomal aberrations (SCAs) [6]. In this context, NGS not only matched FISH results for 1p deletion, 11q deletion, and 17q gain but also identified additional subsegmental gains of 17q that were not detected by FISH [6]. Conversely, FISH demonstrated the ability to detect 11q deletion and 17q gain in a small subset of tumor cells in two cases that were not detected by NGS, highlighting scenarios where cellular context and tumor heterogeneity favor FISH application [6].
Methodological Workflows and Technical Considerations
Diagram 2: FISH experimental workflow with automation integration points. Modern FISH protocols incorporate automation at multiple stages to improve efficiency and standardization.
Technical protocols for FISH and NGS continue to evolve, with each method incorporating advancements to address previous limitations. For FISH, these improvements include expanded probe availability, with companies now offering custom probe design services capable of producing fully quality-assured FISH probes for virtually any sequence in the entire human genome [1]. Additionally, automated workflows and artificial intelligence-assisted analysis are strengthening FISH's position in modern laboratories by reducing technologist hands-on time, decreasing variability, and lowering error risks [3]. For NGS, ongoing refinements in bioinformatic approaches have enhanced its performance for detecting copy number alterations. In MET amplification testing, for instance, incorporating read depth and focality analyses achieved 91% concordance with FISH, with 97% sensitivity and 89% specificity [2]. Tumor heterogeneity, neoplastic cell proportions, and genomic focality were identified as critical factors affecting amplification assessment, areas where NGS methodology showed superiority in capturing overall amplification status in heterogeneous tumors [2].
FISH maintains a crucial role in modern cytogenetics and molecular pathology, particularly for applications requiring rapid turnaround, spatial context within tissues, and detection of specific structural rearrangements. While NGS offers undeniable advantages in comprehensive genomic profiling and detection of novel alterations, the relationship between these technologies is increasingly complementary rather than competitive. The concordance between FISH and NGS varies significantly based on the specific genetic alteration, tumor type, and technical methodologies employed. Future diagnostic paradigms will likely continue to leverage the respective strengths of both platforms, with FISH remaining the gold standard for many established applications while NGS expands the scope of detectable genomic alterations. The ongoing integration of both technologies, supported by automation and advanced bioinformatic tools, promises to enhance the precision and comprehensiveness of molecular diagnostics across an expanding spectrum of malignancies.
For decades, fluorescence in situ hybridization (FISH) has been a cornerstone technique in clinical cytogenetics, providing crucial information about genetic abnormalities through the visual detection of specific DNA sequences. However, the emergence of next-generation sequencing (NGS) has revolutionized genomic analysis, offering unprecedented scalability and multiplexing capabilities. This guide objectively compares the performance of these technologies, focusing on their concordance across various applications to inform researchers, scientists, and drug development professionals about their respective strengths and limitations.
The fundamental difference between these technologies lies in their approach: FISH is a targeted technique that detects specific, known abnormalities through fluorescence microscopy, while NGS is a comprehensive method that sequences millions of DNA fragments in parallel, enabling the discovery of both known and novel variants. Understanding their performance characteristics is essential for selecting the appropriate technology for specific research or clinical applications.
Performance Comparison: FISH vs. NGS Across Applications
Extensive research has directly compared the performance of FISH and NGS across various cancer types and genetic abnormalities. The table below summarizes key concordance data and performance metrics from recent studies.
Table 1: Performance Comparison of FISH and NGS Across Various Applications
| Application/Cancer Type | Genetic Alteration | Concordance Rate | Key Findings | Reference |
|---|---|---|---|---|
| Uterine Serous Carcinoma | HER2/ERBB2 | 81-85% | Correlation improved to 85% when tests performed on same tissue block; WES identified additional patients missed by IHC/FISH [9]. | |
| Glioma | EGFR, CDKN2A/B, 1p, 19q | Variable | FISH showed relatively low concordance with NGS/DMM for most parameters; discordancies associated with high-grade tumors [5]. | |
| Multiple Myeloma | Translocations, Copy Number Alterations | >93% (Balanced Accuracy) | UMA NGS panel demonstrated high concordance with FISH for CNA and t-IgH in risk stratification [10]. | |
| NSCLC (Cytological Samples) | ALK rearrangements | ICC: 79% sens/91% specFISH: 100% sens/100% spec | Compared to NGS, FISH showed perfect sensitivity and specificity for ALK detection [11]. | |
| NSCLC (Cytological Samples) | ROS1 rearrangements | ICC: 100% sens/87% specFISH: 100% sens/100% spec | Compared to NGS, FISH showed perfect sensitivity and specificity for ROS1 detection [11]. |
The concordance between FISH and NGS varies significantly depending on the specific genetic alteration being tested and the tissue type. In uterine serous carcinoma, the overall correlation between IHC/FISH and NGS for HER2 status was 81%, improving to 85% when both methods were performed on the same tissue block [9]. Whole exome sequencing demonstrated potential for identifying additional treatment-eligible patients that were missed by conventional IHC/FISH approaches.
In glioma diagnostics, significant discrepancies emerge between these technologies. While all three methods (FISH, NGS, and DNA methylation microarray) showed high consistency in EGFR assessment, FISH demonstrated relatively low concordance with NGS in detecting other parameters such as CDKN2A/B, 1p, 19q, and chromosome 7 and 10 alterations [5]. Notably, discordant cases were associated with high-grade gliomas and high genomic instability, suggesting limitations of FISH in genomically complex tumors.
For fusion detection in NSCLC cytological samples, FISH showed perfect sensitivity and specificity (100%) for both ALK and ROS1 rearrangements when compared to NGS as the reference method [11]. This demonstrates that while NGS provides comprehensive genomic profiling, FISH remains a highly accurate method for detecting specific rearrangements in limited tissue samples.
Key Experimental Protocols and Methodologies
Protocol: Concordance Study in HER2 Testing
A retrospective analysis of 152 uterine serous carcinoma patients compared HER2 testing methods using rigorously validated protocols [9]:
Sample Preparation:
- Formalin-fixed, paraffin-embedded (FFPE) tumor tissue sections
- Matched samples for IHC, FISH, and NGS analysis
- Same tissue block used for improved correlation
IHC/FISH Protocol:
- Clinical HER2 positivity defined as 3+ IHC staining or 2+ IHC with reflex FISH amplification
- Standardized antibody staining and scoring criteria
- Fluorescence microscopy with specific probe sets
NGS Analysis:
- Commercial NGS platform (Foundation Medicine) and whole exome sequencing
- DNA extraction and library preparation according to manufacturer protocols
- ERBB2 amplifications identified through copy number analysis
- Sequencing performed at Yale Center for Genome Analysis
Concordance Assessment:
- Statistical analysis of agreement between methods
- Calculation of correlation coefficients and p-values
- Identification of discrepant cases
Protocol: Targeted NGS Panel Validation
The development and validation of targeted NGS panels follows rigorous analytical processes, as demonstrated by the TTSH-oncopanel validation [12]:
Panel Design:
- Hybridization-capture based target enrichment
- 61 cancer-associated gene panel
- Custom biotinylated oligonucleotides for regions of interest
Library Preparation and Sequencing:
- Automated MGI SP-100RS library preparation system
- DNA input requirement: ≥50ng
- MGI DNBSEQ-G50RS sequencer with cPAS technology
- Median read coverage: 1671× (range: 469×-2320×)
Analytical Validation:
- Limit of detection: 2.9% variant allele frequency (VAF)
- Sensitivity: 98.23% (95% CI)
- Specificity: 99.99% (95% CI)
- Reproducibility: 99.99% (inter-run precision)
Performance Metrics:
- Percentage of target regions with coverage ≥100×: >98%
- Median coverage uniformity: >99%
- Variant calling using Sophia DDM software with machine learning algorithms
Technical Workflow: From Sample to Analysis
The following diagram illustrates the key steps in the FISH and NGS workflows, highlighting their fundamental technological differences:
Essential Research Reagent Solutions
Successful implementation of NGS and FISH requires specific reagent systems and tools. The table below details key solutions and their functions in genomic analysis workflows.
Table 2: Essential Research Reagent Solutions for Genomic Analysis
| Category | Specific Product/Technology | Primary Function | Application Context |
|---|---|---|---|
| Target Enrichment | TruSight Rapid Capture Kit [13] | Hybridization-based target capture | Disease-focused panels (e.g., inherited diseases) |
| Target Enrichment | Ion AmpliSeq Library Kit 2.0 [13] | Amplicon-based target enrichment | Disease-focused panels (e.g., inherited diseases) |
| NGS Library Prep | Sophia Genetics Library Kit [12] | Automated library preparation | Compatible with MGI SP-100RS system |
| NGS Panel | AVENIO ctDNA Expanded Kit [14] | ctDNA analysis for liquid biopsy | Targets 77 genes; detects SNVs, indels, CNVs, fusions |
| NGS Panel | Unique Molecular Assay (UMA) Panel [10] | Targeted DNA-sequencing for myeloma | Captures translocations, CNA, mutations in 82 genes |
| Sequencing Platform | MGI DNBSEQ-G50RS [12] | Sequencing with cPAS technology | Medium-throughput sequencing applications |
| Bioinformatic Tools | Sophia DDM [12] | Variant analysis with machine learning | Clinical interpretation and visualization |
| Reference Materials | GIAB Reference Materials [13] | Assay validation and benchmarking | Performance metrics for targeted panels |
Critical NGS Performance Metrics and Their Interpretation
Understanding key NGS performance metrics is essential for evaluating data quality and making informed decisions about sequencing approaches. The table below outlines critical metrics and their implications for assay performance.
Table 3: Key NGS Performance Metrics and Interpretation Guidelines
| Performance Metric | Definition | Impact on Data Quality | Optimal Range/Target |
|---|---|---|---|
| Coverage Depth | Number of times a base is sequenced [15] | Higher depth increases confidence in variant calling [16] | Varies by application: 30-50× for WGS, 100× for WES [15] |
| On-target Rate | Percentage of reads mapping to target regions [16] | Higher rates indicate better specificity and efficiency [16] | Typically >70-80% for hybrid capture panels |
| Coverage Uniformity | Evenness of sequencing coverage across targets [16] | Poor uniformity may miss variants in low-coverage regions [16] | Fold-80 base penalty closer to 1.0 indicates better uniformity [16] |
| Duplicate Rate | Percentage of identical sequencing reads [16] | High rates indicate PCR over-amplification or limited diversity [16] | Minimized through optimized PCR cycles and input DNA |
| VAF Sensitivity | Lowest detectable variant allele frequency [12] | Lower VAF enables detection of subclonal variants [12] | As low as 2.9% for validated panels [12] |
The concordance research between FISH and NGS reveals a nuanced landscape where each technology maintains distinct advantages. FISH continues to offer high sensitivity and specificity for detecting specific rearrangements, particularly in ALK and ROS1 testing in NSCLC, with the benefit of visual confirmation and established clinical validation [11]. However, NGS provides comprehensive genomic profiling that can identify additional clinically relevant alterations beyond the scope of targeted FISH assays [9] [14].
For researchers and drug development professionals, the choice between these technologies should be guided by specific research questions, sample availability, and required throughput. FISH remains valuable for focused analysis of specific genetic alterations, while NGS offers unparalleled capabilities for discovery and comprehensive biomarker assessment. The integration of both technologies in validation workflows can leverage their complementary strengths, ensuring robust genomic analysis in both basic research and clinical translation.
The consistent and precise detection of genomic alterations is a cornerstone of modern precision oncology. For years, fluorescence in situ hybridization (FISH) has been a gold standard in clinical laboratories for identifying copy number variations (CNVs), gene amplifications, and structural rearrangements. The advent of next-generation sequencing (NGS) has introduced a powerful, high-throughput alternative. This guide provides an objective comparison of the performance of FISH and NGS across key operational parameters—resolution, throughput, and bias—synthesized from contemporary concordance research. The data presented herein are intended to aid researchers, scientists, and drug development professionals in selecting and optimizing genomic profiling methods for both research and clinical applications.
Performance Comparison: FISH vs. NGS
The table below summarizes the comparative performance of FISH and NGS across critical technical dimensions, drawing from direct comparative studies.
Table 1: Direct comparison of FISH and NGS across key performance metrics.
| Metric | Fluorescence In Situ Hybridization (FISH) | Next-Generation Sequencing (NGS) |
|---|---|---|
| Resolution | Limited to the size of probes used (typically >50 kb); cannot resolve subsegmental alterations. [6] | Single-base-pair resolution for SNVs; can detect focal CNVs and subsegmental alterations (e.g., <1 Mb). [6] [17] |
| Throughput | Low; limited number of probes per assay (typically 1-4); requires separate tests for different alterations. [18] [17] | High; can simultaneously interrogate hundreds of genes for SNVs, CNVs, and rearrangements in a single assay. [6] [18] |
| Tissue Requirements | Preserves tissue architecture; allows for visual assessment of heterogeneity and tumor cell proportion. [2] | Requires DNA/RNA extraction; loses spatial context. Tumor purity and clonality are assessed bioinformatically. [2] |
| Genomic Focality Assessment | Can distinguish focal amplification from polysomy using ratio metrics (e.g., MET:CEP7). [2] | Superior for defining amplification focality and segment size within a heterogeneous genomic landscape. [2] |
| Key Limitations | Provides no sequence-level information (e.g., cannot distinguish mutation subtypes). Prone to false negatives in highly heterogeneous samples. [5] [6] | Susceptible to artifacts from DNA degradation and PCR. Detection of low-level CNVs and rearrangements in low-purity samples can be challenging. [2] [4] |
| Typical Concordance with NGS/FISH | Shows relatively low concordance with NGS/DMM for some CNV parameters (e.g., CDKN2A/B, 1p, 19q) in gliomas. [5] | Exhibits strong concordance with DNA methylation microarray (DMM) and high sensitivity/specificity (>90% for many CNAs) vs. FISH. [5] [7] |
Experimental Data from Key Comparative Studies
Recent studies have quantitatively evaluated the concordance between FISH and NGS across various cancer types. The following table compiles key findings from these investigations.
Table 2: Summary of quantitative concordance data from published studies.
| Study Focus (Citation) | Key Finding | Quantitative Result |
|---|---|---|
| Glioma CNV Assessment [5] | Concordance between FISH, NGS, and DNA Methylation Microarray (DMM). | FISH showed low concordance with NGS/DMM for CDKN2A/B, 1p, 19q. NGS and DMM exhibited strong concordance for all 6 parameters tested. |
| Neuroblastoma SCAs [6] | Detection of 1p deletion, 11q deletion, and 17q gain. | NGS and FISH results were matched. NGS detected additional subsegmental 17q gains missed by FISH. |
| MET Amplification [2] | Concordance after optimizing NGS bioinformatics. | 91% concordance, 97% sensitivity, and 89% specificity for NGS vs. FISH. |
| ERBB2 Amplification in Breast Cancer [19] | Agreement on HER2 status. | Substantial agreement (Cohen’s kappa = 0.57). |
| CLL Copy Number Alterations [7] | Detection of del(17p), del(11q), trisomy 12, and del(13q). | Specificity >95%, sensitivity >86%, PPV >90%, NPV >84% for targeted NGS vs. FISH. |
Detailed Experimental Protocols from Cited Studies
This protocol compares FISH and targeted NGS for detecting segmental chromosomal aberrations (SCAs), which are critical prognostic markers in neuroblastoma.
- Sample Preparation: Formalin-fixed, paraffin-embedded (FFPE) tumor tissues from 35 patients were used. For FISH, tissue sections were prepared and hybridized with locus-specific probes for 1p36, 11q22, and 17q21. For NGS, genomic DNA was extracted from FFPE samples.
- FISH Method: Commercially available probes (ZytoLight SPEC 1p36/1q25 and Vysis probes for 11q and 17q) were used. A minimum of 50-100 interphase nuclei were scored for each probe. Deletion was defined as a probe/control ratio <0.67, and gain as a ratio >1.3, per International Neuroblastoma Risk Group guidelines.
- Targeted NGS Method: The study used two customized panels: CancerSCAN (381 genes) and PedSCAN (353 genes). Library preparation involved hybridization capture. Sequencing was performed on an Illumina platform. For CNV analysis, sequencing coverage was normalized, GC bias was corrected, and the log2 copy ratio was adjusted for tumor purity. An arm-level segment exceeding the diploid reference for more than one-third of the chromosomal arm was called as a gain or deletion.
- Data Analysis: McNemar's test was used to compare the detection rates of FISH and NGS. Linear regression correlated copy number ratios between the two methods.
This study outlines a sophisticated NGS methodology for detecting MET amplification, validated against FISH, and highlights how bioinformatic adjustments can optimize performance.
- Sample Cohorts: The study utilized three cohorts: a landscape cohort of >50,000 solid tumors sequenced by MSK-IMPACT, a FISH validation cohort with paired NGS and FISH data, and a treatment cohort.
- NGS and Copy Number Determination: The MSK-IMPACT targeted sequencing panel was used. Two independent methods determined copy number:
- Read-Depth Analysis: Copy number was based on normalized read-depth of target regions compared to a normal control, expressed as a fold-change (fc). Amplification was defined as fc ≥2.0.
- Allele-Specific Copy Number (FACETS): This algorithm uses matched tumor-normal pairs to estimate tumor purity, ploidy, and integer copy number states, providing a more robust assessment in impure samples.
- Bioinformatic Optimization: The analysis incorporated read-depth, tumor purity (from FACETS), and genomic focality to distinguish high-level focal amplifications from broad chromosomal gains. This integrated approach was key to achieving high concordance with FISH.
- FISH Method: MET FISH was performed using a MET-specific probe and a chromosome 7 centromere probe (CEP7). Amplification was defined by MET:CEP7 ratio cutoffs (e.g., ≥1.8 to ≤2.2 for low-level, ≥5 for high-level) and mean MET copies per cell (e.g., ≥5).
- Concordance Assessment: NGS results were compared against FISH as the reference standard to calculate sensitivity, specificity, and concordance.
Signaling Pathways and Workflow Visualization
The following diagram illustrates the core bioinformatic workflow for detecting copy number variations from targeted NGS data, a process critical to the studies cited above.
Diagram 1: NGS CNV detection workflow.
This workflow underpins the NGS methodologies described in the protocols. The key differentiator in advanced applications, as in the MET study [2], is the incorporation of the purity and ploidy adjustment step (E), which significantly improves accuracy in heterogeneous tumor samples.
The Scientist's Toolkit: Key Research Reagents and Materials
The table below details essential reagents and materials used in the comparative experiments cited, along with their critical functions.
Table 3: Key research reagent solutions for FISH and NGS concordance studies.
| Reagent / Material | Function in Experiment | Specific Example / Note |
|---|---|---|
| Locus-Specific FISH Probes | Bind to complementary DNA sequences to visualize specific genomic loci under a fluorescence microscope. | ZytoLight SPEC 1p36/1q25 probe [6]; Vysis MET/CEP7 probe [2]. |
| Targeted NGS Panel | A set of DNA or RNA baits that enrich specific genomic regions of interest prior to sequencing, enabling high-depth coverage. | MSK-IMPACT (341-505 genes) [2]; CancerSCAN/PedSCAN (~350 genes) [6]. |
| Bioinformatic CNV Calling Algorithm | Software that analyzes sequencing coverage depth to identify regions of copy number gain or loss. | PatternCNV [7]; FACETS (for allele-specific copy number) [2]; Custom pipelines for read-depth analysis [6] [2]. |
| FFPE DNA Extraction Kit | Isolate DNA from formalin-fixed, paraffin-embedded tissue, the most common clinical specimen type. | QIAamp DNA FFPE Tissue Kit [18]. Critical for ensuring DNA quality from archived samples. |
| Tumor Purity Assessment Tool | Estimate the proportion of cancer cells in a sample, which is essential for accurate CNV calling in NGS. | FACETS algorithm [2]; Pathologist estimation from H&E slide (for FISH). |
The body of concordance research demonstrates that while FISH retains unique advantages in visualizing spatial genomic organization and distinguishing focal amplification from polysomy, NGS offers superior resolution, throughput, and comprehensiveness. The choice between these technologies is context-dependent. For high-throughput profiling of a wide range of genomic alterations in a single assay, NGS is increasingly the more powerful and efficient tool, especially when coupled with advanced bioinformatic correction for tumor purity and bias. However, for validating specific, known alterations or when tissue architecture is paramount, FISH remains a vital component of the genomic toolkit. Future directions will likely involve integrated workflows that leverage the complementary strengths of both platforms for the most accurate molecular diagnosis.
The identification of key genomic alterations, including copy number variations (CNVs), gene fusions, and amplifications, has become fundamental to cancer diagnosis, prognosis, and therapeutic decision-making. These structural variations serve as critical biomarkers for tumor classification and enable personalized treatment strategies through targeted therapies. The accurate detection of these alterations is therefore paramount in clinical oncology. This has established two principal technological approaches in diagnostic pathology: traditional methods like fluorescence in situ hybridization (FISH) and modern next-generation sequencing (NGS)-based techniques. A growing body of concordance research systematically compares these platforms, revealing distinct performance characteristics, strengths, and limitations across different genomic targets and cancer types. Understanding this evidence base is essential for researchers, scientists, and drug development professionals seeking to implement optimal molecular diagnostic strategies.
Performance Comparison of FISH and NGS Methodologies
Extensive comparative studies have evaluated the concordance between FISH and NGS across various genomic targets and cancer types. The table below summarizes key quantitative findings from recent research.
Table 1: Comparative Performance of FISH and NGS Across Genomic Alterations and Cancer Types
| Genomic Alteration | Cancer Type | Concordance Rate | Key Findings | Citation |
|---|---|---|---|---|
| CDKN2A Deletion (CNV) | Non-Small Cell Lung Cancer | 88.2% | FISH confirmed 45 of 51 NGS-identified deletions; false positives occurred with intermediate CN values and unstable baselines. | [20] |
| EGFR, CDKN2A/B, 1p, 19q, Chr7, Chr10 (CNV) | Glioma | High for EGFR; Lower for others | NGS and DNA methylation microarray showed strong concordance; FISH showed relatively low concordance with NGS. | [5] |
| Gene Fusions (Known Partners) | Multiple Advanced Cancers | 89.3% (25/28) | NGS reliably detected fusions with known partners, confirmed by FISH/IHC in most cases. | [21] |
| Gene Fusions (Unknown Partners) | Multiple Advanced Cancers | 4.8% (1/21) | NGS was less accurate for fusions with unknown partners; most were not confirmed by FISH/IHC. | [21] |
| HER2 Amplification | Uterine Serous Carcinoma | 81-85% | Correlation improved when IHC/FISH and NGS were performed on the same tissue block. | [9] |
| ALK, ROS1, RET Fusions | Lung Adenocarcinoma | >90% | Overall high concordance; RNA-based NGS was highly efficient for multiplexed fusion detection. | [22] |
Analysis of Comparative Performance Data
The aggregated data reveals several critical trends. For copy number variations, NGS generally demonstrates high accuracy, though verification by FISH may be warranted in specific contexts. For instance, in NSCLC, while NGS reliably identifies CDKN2A deletions, a subset of calls (particularly those with intermediate copy number values or from samples with low tumor purity) may represent false positives, highlighting a scenario where FISH provides essential validation [20]. In gliomas, the concordance between FISH and NGS is variable, high for some targets like EGFR but lower for others such as CDKN2A/B and chromosomal arms 1p/19q. Notably, discordant cases are often associated with high-grade tumors and increased genomic instability, suggesting that technological limitations are more pronounced in complex genomes [5].
For gene fusions, the performance of amplicon-based NGS is highly dependent on prior knowledge of the fusion partners. It shows excellent concordance with FISH and IHC for fusions with known partners [21]. However, its performance drops significantly when the fusion partner is unknown or indeterminate, a situation where FISH, with its targeted probe design, can crucially contribute to completing the molecular characterization [21] [22]. Furthermore, emerging technologies like Hi-C sequencing are demonstrating the ability to overcome limitations of both FISH and conventional NGS by providing unbiased, genome-wide detection of structural variations, including atypical breakpoints and novel fusion partners in lymphomas [23].
For gene amplifications, such as HER2, studies show a strong but imperfect correlation (~80-85%) between IHC/FISH and NGS methods. This correlation strengthens when all tests are performed on the same tissue block, underscoring the impact of tumor heterogeneity on results. Comprehensive sequencing methods like whole exome sequencing (WES) may identify additional amplification-positive cases missed by standard IHC/FISH or commercial NGS panels [9].
Experimental Protocols for Key Comparative Studies
Protocol 1: CNV Detection in Glioma
A retrospective cohort study of 104 glioma patients provided a direct comparison of FISH, NGS, and DNA methylation microarray (DMM) for CNV assessment [5].
- Sample Preparation: Formalin-fixed paraffin-embedded (FFPE) tumor samples were used.
- FISH Methodology: Break-apart and dual-fusion probes were employed to detect CNVs in targets including EGFR, CDKN2A/B, 1p, 19q, chromosome 7, and chromosome 10. A minimum of 50-100 interphase nuclei were scored for abnormal signal patterns (e.g., split signals for rearrangements) using fluorescence microscopy.
- NGS Methodology: Library preparation was performed on extracted DNA, followed by sequencing on a next-generation sequencing platform. Bioinformatic pipelines for CNV calling analyzed read depth and structural variations against a reference genome (GRCh38).
- DMM Methodology: DNA was subjected to bisulfite conversion and hybridized to a methylation array platform. CNV profiles were inferred from the intensity data of the microarray.
- Statistical Analysis: Concordance between methods was calculated. Associations between discordant results and clinical factors (tumor grade, genomic instability) were tested using statistical methods (P < .05 considered significant).
Protocol 2: Gene Fusion Detection in Lymphoma
A study on five diffuse large B-cell lymphoma (DLBCL) cases with atypical FISH results employed a novel Hi-C-based assay [23].
- Sample Selection: Cases were selected based on atypical or inconclusive FISH results for standard B-cell lymphoma panels (MYC, BCL2, BCL6).
- FISH Analysis: Performed on FFPE tissue using break-apart probes (MYC, BCL2, BCL6) and dual-fusion probes (IGH::MYC, IGH::BCL2). A minimum of 100 interphase nuclei were evaluated by two technologists. A positive result was defined by established cutoffs (e.g., ≥10% nuclei with split signals for break-apart probes).
- Hi-C Sequencing: FFPE tissue from unstained slides was processed using the Arima HiC+ for FFPE kit. High-resolution paired-end sequencing was conducted on a platform like the Element Biosciences Aviti, capturing ~100 million read pairs to map genome-wide chromatin interactions.
- Bioinformatic Analysis: A custom pipeline (Arima-SV-Pipeline v1.3) was used to identify structural variants, annotating breakpoints and fusion partners against the GRCh38 reference genome.
Protocol 3: Fusion Detection in Lung Adenocarcinoma
A study of 210 NSCLC samples compared RNA-based NGS with traditional methods [22].
- Sample Cohort: FFPE samples from stage IV lung adenocarcinoma patients were selected, with tumor content >50% confirmed by pathologists.
- FISH: Performed using break-apart probes for ALK, ROS1, RET, and NTRK1/2/3. A sample was considered positive if ≥15% of tumor nuclei showed split signals.
- IHC: For ALK, the VENTANA ALK (D5F3) CDx Kit was used. Strong granular cytoplasmic staining in any tumor cells was considered positive.
- RNA Extraction: Total RNA was extracted from macrodissected FFPE samples.
- Targeted RNA-based NGS: Libraries were prepared from RNA and sequenced on a platform like the Illumina MiSeq. The analysis focused on detecting known and novel fusion transcripts.
Visualizing Experimental Workflows and Biological Pathways
Workflow for Comparative Genomic Analysis
The following diagram illustrates the typical integrated workflow for comparing FISH and NGS in a concordance study, from sample processing to data integration.
Signaling Pathways of Key Oncogenic Fusions
Oncogenic fusions drive cancer by constitutively activating critical growth and survival pathways. The diagram below illustrates the common signaling cascades activated by receptor tyrosine kinase (RTK) fusions.
The Scientist's Toolkit: Essential Research Reagents and Materials
The following table catalogs key reagents and materials essential for conducting comparative genomic studies of CNVs, fusions, and amplifications.
Table 2: Essential Research Reagents and Solutions for Genomic Alteration Detection
| Reagent/Material | Function | Example Use Case | Citation |
|---|---|---|---|
| Break-Apart FISH Probes | Detect gene rearrangements by separating fluorophores upon breakage of the target gene. | Standard detection of ALK, ROS1, RET, MYC, BCL2, BCL6 rearrangements in lymphoma and NSCLC. | [23] [22] |
| Dual-Fusion FISH Probes | Confirm specific translocations by generating fusion signals from two different genes. | Detecting IGH::MYC and IGH::BCL2 fusions in lymphoma. | [23] |
| DNA/RNA Extraction Kits (FFPE-optimized) | Isolate high-quality nucleic acids from archived, cross-linked tissue samples. | Preparing input material for both NGS library preparation and RT-PCR from the same FFPE block. | [22] |
| Targeted NGS Panels (DNA/RNA) | Simultaneously interrogate multiple genes of interest for mutations, CNVs, and fusions in a single assay. | Comprehensive molecular profiling of lung cancer using panels covering key oncogenes and tumor suppressors. | [21] [22] |
| Hi-C Kit for FFPE | Preserve and analyze 3D chromatin architecture to enable genome-wide detection of structural variations. | Unbiased discovery of complex rearrangements and novel fusion partners in lymphoma. | [23] |
| Bioinformatic Tools (e.g., SplitFusion, IGV) | Analyze sequencing data to identify, visualize, and validate structural variants and fusion events. | Clinical-grade fusion detection from RNA-Seq data; visual confirmation of called variants. | [24] [25] |
The concordance research between FISH and NGS underscores a paradigm shift in molecular diagnostics from a single-alteration, targeted approach to a comprehensive, multi-analyte profiling strategy. While FISH remains a valuable and sometimes necessary gold standard for validating specific alterations, especially in cases of low tumor purity, atypical fusions, or ambiguous NGS findings, NGS technologies offer unparalleled throughput and multiplexing capabilities. The choice between them, or the decision to use them in an integrated manner, depends on the specific clinical or research question, the required throughput, available tissue, and economic considerations. For the future, the ongoing development of even more powerful technologies like Hi-C and enhanced bioinformatic tools like SplitFusion promises to further improve the sensitivity and scope of genomic alteration detection, ultimately advancing personalized cancer medicine.
The field of molecular diagnostics is undergoing a profound transformation, moving away from traditional single-gene testing approaches toward comprehensive genomic analysis. This evolution is primarily driven by the adoption of next-generation sequencing (NGS), which enables simultaneous assessment of multiple genomic alterations across numerous genes from a single patient sample. For researchers and drug development professionals, this shift presents both opportunities and challenges in biomarker detection, clinical trial design, and therapeutic development.
The cornerstone of this transition lies in establishing concordance between established methodologies like fluorescence in situ hybridization (FISH) and emerging NGS platforms. Understanding the strengths, limitations, and complementary nature of these technologies is essential for advancing precision medicine initiatives across various malignancies, from non-small cell lung cancer (NSCLC) to neuroblastoma and other solid tumours.
Methodological Comparison: FISH vs. NGS Technologies
Fundamental Technical Principles
FISH operates through fluorescently labeled DNA probes that bind to specific chromosomal sequences, allowing visual enumeration of gene copies under a fluorescence microscope. In MET amplification testing, for instance, FISH typically uses MET/CEN7 dual-color probes, with amplification defined as a MET:CEN7 ratio ≥2:1, and copy number gain (CNG) as a ratio of 1-2:1 [26]. This methodology provides direct visualization of genetic alterations within individual cells and preserves tissue architecture context.
NGS employs massively parallel sequencing of fragmented DNA from tumor samples. For copy number variation detection, two primary computational approaches are utilized: read-depth analysis that normalizes sequence coverage to GC content and compares it to normal controls, and allele-specific copy number analysis using algorithms like FACETS that employ matched patient-normal comparisons [2]. The NGS output generates digital data that requires sophisticated bioinformatic processing but offers genome-wide insights beyond targeted regions.
Experimental Protocols in Practice
A typical NGS validation workflow for solid tumour analysis involves several critical steps. The TTSH-oncopanel development, which targets 61 cancer-associated genes, demonstrates a standardized approach: DNA extraction from formalin-fixed paraffin-embedded (FFPE) samples with input ≥50 ng, library preparation using hybridization-capture based target enrichment, sequencing on platforms like MGI DNBSEQ-G50RS, and variant analysis with specialized software (Sophia DDM) that employs machine learning for variant classification [12].
For MET amplification analysis specifically, the MSK-IMPACT assay protocol incorporates: hybridization-capture targeting 341-505 genes plus intergenic SNPs, paired tumor-normal sequencing to distinguish somatic variants, dual copy number analysis methods (read-depth and FACETS), and RNA-based fusion testing in selected cases to capture transcriptional alterations [2].
Concordance Data: Quantitative Comparisons Across Studies
Table 1: MET Amplification Concordance Between FISH and NGS in NSCLC
| Study | Sample Size | Concordance Rate | Sensitivity (NGS) | Specificity (NGS) | Key Findings |
|---|---|---|---|---|---|
| INSIGHT-2 Trial Analysis [26] | 33 samples | 71% (5/7 amplified samples) | 97% (after optimization) | 89% (after optimization) | NGS confidently identifies FISH-validated MET amplification; recommends FISH only for NGS non-amplified cases with low tumor content |
| Bioinformatically Expanded NGS Study [2] | >50,000 tumors (landscape) | 91% (after bioinformatic optimization) | 97% | 89% | Incorporation of read depth and focality analyses improved concordance; NGS superior for capturing amplification status in heterogeneous tumors |
| Neuroblastoma SCA Detection [6] | 35 patients | High concordance for 1p deletion and 11q deletion | N/A | N/A | Most 17q gain mismatches represented subsegmental gains detected by NGS alone; NGS sensitive for segmental chromosomal aberrations |
Table 2: Multi-Gene Alteration Detection in NSCLC (107 Cases)
| Detection Method | EGFR Mutation Detection | ALK Rearrangement | ROS1 Rearrangement | Other Gene Alterations | Tissue Requirement |
|---|---|---|---|---|---|
| NGS Platform | Comprehensive exon coverage | Increased positive rate | Decreased false positives | 9 additional lung cancer genes (KRAS, NRAS, BRAF, ERBB2, RET, MET, FGFR1, PIK3CA, TP53) | Single test, minimal tissue |
| IHC/FISH/ARMS Combination | Limited to specific hotspots (L858R, E746-A750del) | Subject to false positives by IHC | Subject to false positives by IHC | Requires multiple additional tests | Multiple tests, significant tissue consumption |
The concordance data reveals that while NGS shows strong overall agreement with FISH, certain limitations persist. In the INSIGHT-2 trial analysis, 33% (11/33) of samples failed MET FISH testing, while only 14% (1/7) of FISH-amplified cases showed equivocal NGS results, primarily attributed to low tumor content [26]. This highlights the sample quality considerations essential for test selection.
In neuroblastoma, NGS demonstrated particular value in detecting subsegmental chromosomal gains that FISH missed, though FISH identified 11q deletion and 17q gain in limited tumor cells in two cases that NGS did not detect [6]. This underscores the complementary sensitivity profiles of each method.
Technological Workflows and Signaling Pathways
Diagram 1: Comparative Workflows: FISH vs. NGS Technologies. This flowchart illustrates the divergent technical pathways of FISH (yellow) and NGS (green) methodologies from sample preparation to final clinical report (red).
Diagram 2: MET Signaling Pathway and Oncogenic Activation. This diagram shows the normal MET signaling pathway (blue) and how specific alterations (red) like amplification and exon 14 skipping lead to constitutive pathway activation, promoting oncogenesis. Key pathway components are highlighted in green.
The Scientist's Toolkit: Essential Research Reagents
Table 3: Key Research Reagent Solutions for FISH and NGS Platforms
| Reagent/Kit | Application | Function | Example Use Cases |
|---|---|---|---|
| Zytovision MET/CEN7 Probe [26] | FISH MET Amplification Detection | Dual-color probe for MET gene and chromosome 7 centromere | Distinguishing focal amplification from polysomy in NSCLC |
| MSK-IMPACT Assay [2] | Hybridization-Capture NGS | Targets 341-505 genes plus genome-wide SNPs | Comprehensive genomic profiling in solid tumors |
| Oncomine Precision Assay GX [27] | Multi-modal NGS | Simultaneous detection of SNVs, CNVs, and fusions in 50 genes | Integrated genomic profiling in NSCLC |
| Sophia DDM Software [12] | NGS Data Analysis | Machine learning-based variant calling and visualization | Automated variant classification and clinical interpretation |
| QIAamp DNA FFPE Tissue Kit [18] | Nucleic Acid Extraction | High-quality DNA extraction from challenging FFPE samples | Pre-analytical processing of archival clinical specimens |
| FACETS Algorithm [2] | Copy Number Analysis | Allele-specific copy number estimation from NGS data | Tumor purity-adjusted MET integer copy number determination |
Clinical Implications and Diagnostic Integration
The evolving diagnostic landscape has substantial implications for clinical trial design and patient stratification. The INSIGHT-2 trial demonstrated MET amplification as a therapeutic target for combination tepotinib-osimertinib in EGFR-mutated NSCLC, validating its clinical relevance [26]. The ability to reliably detect these amplifications through NGS rather than requiring separate FISH testing streamlines patient identification.
The superior ability of hybrid capture-based NGS assays to detect certain alteration types is particularly notable. In comparative studies of liquid biopsy platforms, hybrid capture-based assays detected 7-8 gene fusions, while amplicon-based assays detected only 2 each. Similarly, one hybrid capture assay identified 12 MET amplifications, five of which were confirmed by FISH but missed by tissue-based NGS [27]. This has direct implications for assay selection in clinical trials.
For drug development professionals, the reduced turnaround time of modern NGS platforms presents significant advantages. The development of the TTSH-oncopanel reduced reporting time from approximately 3 weeks with external testing to just 4 days with in-house testing [12], enabling more rapid therapeutic decision-making in time-sensitive clinical contexts.
The evidence from multiple concordance studies supports a transitional diagnostic model where NGS serves as the primary comprehensive genomic profiling tool, with FISH remaining valuable for specific challenging cases. This integrated approach maximizes diagnostic accuracy while conserving precious tissue resources.
For the research community, continued refinement of bioinformatic approaches for copy number detection, standardization of reporting criteria, and development of validated thresholds for clinical actionability will be essential to fully realize the potential of genome-wide analysis. The evolving diagnostic landscape promises not only more efficient biomarker detection but fundamentally enhanced understanding of cancer genomics that will drive the next generation of targeted therapeutics.
Clinical Applications and Performance Across Disease Contexts
The molecular classification of gliomas has undergone a paradigm shift with the integration of copy number variation (CNV) assessment into diagnostic workflows. The World Health Organization's 2021 classification of central nervous system (CNS) tumors prioritizes molecular biomarkers alongside histology, requiring precise detection of chromosomal alterations for accurate diagnosis, prognosis, and therapeutic decision-making [28] [29]. Key CNV events in glioma include 1p/19q codeletion for oligodendroglioma classification, CDKN2A/B homozygous deletion for astrocytoma grading, and chromosome 7 gain/10 loss for glioblastoma diagnosis [28] [30] [29].
Three primary technologies—fluorescence in situ hybridization (FISH), next-generation sequencing (NGS), and DNA methylation microarray—have emerged as key approaches for CNV detection in clinical and research settings. This guide provides an objective comparison of their performance characteristics, supported by recent experimental data, to inform researchers, scientists, and drug development professionals working in neuro-oncology.
Technology Comparison: Performance Metrics and Experimental Data
Table 1: Technical and Performance Characteristics of CNV Detection Methods
| Parameter | FISH | Targeted NGS | DNA Methylation Microarray |
|---|---|---|---|
| Resolution | ~50 kb - 1 Mb (probe-dependent) | ~Exon-level | Single CpG site [31] |
| Multiplexing Capability | Limited (typically 2-4 targets) | Moderate (dozens of targets) | Genome-wide (>450,000 CpG sites) [32] [33] |
| 1p/19q Codeletion Concordance | 94-100% (with validation) [32] | >95% [30] | 100% (after re-evaluation) [32] |
| CDKN2A HD Sensitivity | 73.3% (potential false negatives) [31] | 100% [31] | 100% [31] |
| DNA Input | Tissue sections | 30-100 ng DNA [30] | 250 ng DNA [34] |
| Turnaround Time | 1-2 days | 3-7 days | 5-10 days [35] |
| Primary Advantage | Tissue context preservation | Targeted comprehensive profiling | Unbiased classification + CNV |
| Key Limitation | Limited targets, subjective interpretation | Targeted approach, complex bioinformatics | Cost, specialized analysis |
Table 2: Diagnostic Impact in Clinical Study Cohorts
| Study Population | FISH Performance | NGS Performance | Methylation Performance |
|---|---|---|---|
| Adult DLGG (n=166) | 1p/19q concordance: 94% (pre-revision) [32] | High concordance for SNVs/indels [30] | 76% classified (score ≥0.84); 100% 1p/19q concordance [32] |
| Pediatric CNS (n=1,200) | Not specifically reported | 47% with therapeutically relevant variants [35] | 50% diagnostic refinement; 30% discrepancy with histology [35] |
| Mixed CNS (n=1,921) | Not specifically reported | Used for mutation confirmation [36] | 14% diagnostic mismatch identified; 86% descriptive diagnoses resolved [36] |
| BRAF-altered Gliomas (n=25) | 5/15 false negatives for CDKN2A HD [31] | 100% concordance with methylation [31] | Reference standard for CNV; identified FISH probe issue [31] |
Experimental Protocols and Methodologies
DNA Methylation Profiling for CNV Analysis
The DNA methylation microarray protocol has been standardized across multiple studies [34] [35] [32]. DNA is extracted from formalin-fixed paraffin-embedded (FFPE) tumor tissues using kits such as the QIAamp DNA FFPE Tissue Kit, with a minimum input of 250 ng DNA recommended [34]. The process utilizes the Illumina Infinium Human Methylation EPIC (850k) or 450K BeadChip arrays following manufacturer instructions [34] [32].
After quality control, raw data files (IDAT format) are processed using bioinformatic tools such as the "conumee" R package for CNV analysis [31] [33]. The analysis involves normalization against reference normal brain tissue samples, with chromosomal copy number variation profiles generated at single-CpG-site resolution [31]. Samples are typically classified using the Heidelberg classifier (www.molecularneuropathology.org), with a calibrated score ≥0.9 considered a confident match to a methylation class [33] [36].
Targeted NGS Approaches for CNV Detection
NGS panels for glioma diagnostics employ targeted amplification approaches [30]. The Glio-DNA panel exemplar protocol begins with DNA extraction from FFPE tissue (30-100 ng) using systems such as the QIAsymphony DNA Mini Kit [30]. Library preparation utilizes custom primer panels (e.g., Ion AmpliSeq Designer) covering coding regions of 65 glioma-associated genes and SNPs for detecting 1p/19q codeletion, chromosome 7 gain, and chromosome 10 loss [30].
Sequencing is performed on platforms such as the Ion Torrent PGM with 318 chips, followed by alignment to reference genome (hg19) and variant calling [30]. For CNV analysis, read depth ratios are calculated and compared to normal controls, with thresholds established for homozygous deletions (CDKN2A/B) and chromosomal arm-level changes (1p/19q) [30].
FISH Assay Methodology
The FISH protocol for glioma CNV detection involves 4-5μm FFPE tissue sections [31]. Dual-color probe systems are utilized, such as the ZytoLight SPEC CDKN2A/CEN 9 probe targeting 9p21.3 (315 kb covering MTAP and CDKN2A/B) with chromosome 9 centromere control [31]. After hybridization, signals are counted in 50-100 non-overlapping tumor cell nuclei. For CDKN2A homozygous deletion, cells without green signals (CDKN2A) but with red signals (CEN9) are scored, with >15% deleted nuclei considered positive [31]. Critical interpretation requires careful probe selection, as probes targeting large genomic regions may yield false negatives due to non-specific hybridization [31].
Concordance Studies: FISH vs. NGS vs. Methylation
Recent studies have directly compared these technologies, revealing important concordance patterns. In BRAF-altered gliomas, significant discrepancies in CDKN2A homozygous deletion detection were observed, with FISH showing 33% false negatives (5/15 cases) compared to methylation profiling and NGS [31]. Bioinformatic investigation revealed that large FISH probes targeting the entire 9p21 region can hybridize non-specifically to undeleted areas, causing false negatives [31].
For 1p/19q codeletion assessment in diffuse lower-grade gliomas, DNA methylation profiling demonstrated 100% concordance with integrated diagnosis after discrepant case re-evaluation, while initial FISH interpretations showed 94% concordance [32]. Targeted NGS approaches incorporating SNP-based loss of heterozygosity analysis have shown >95% concordance with reference methods for 1p/19q status [30].
DNA methylation profiling has demonstrated particular utility in resolving diagnostically challenging cases, with studies reporting 12-17% diagnostic mismatches compared to histology alone [36]. In pediatric CNS tumors, multi-omic integration (methylation + NGS) increased diagnostic accuracy through methylation class refinement (50% of cases) and detection of therapeutically relevant genetic alterations (47% of cases) [35].
Research Reagent Solutions
Table 3: Essential Research Reagents and Platforms
| Reagent/Platform | Primary Function | Example Products |
|---|---|---|
| Methylation BeadChip | Genome-wide methylation profiling | Illumina Infinium MethylationEPIC v2.0 [34] |
| CNV Analysis Software | Copy number profiling from methylation data | Conumee R package [31] [33] |
| Targeted NGS Panels | Multi-gene mutation and CNV detection | Glio-DNA panel (65 genes) [30] |
| FISH Probe Systems | Chromosomal alteration visualization | ZytoLight SPEC CDKN2A/CEN 9 [31] |
| DNA Extraction Kits | Nucleic acid isolation from FFPE | QIAamp DNA FFPE Tissue Kit [34] |
| Methylation Classifier | CNS tumor classification | Heidelberg Brain Tumor Classifier v12.8 [34] |
The concordance research between FISH, NGS, and DNA methylation microarray reveals a evolving landscape in glioma CNV assessment. While FISH provides tissue context and rapid turnaround, its limitations in multiplexing and potential false negatives support the transition to genome-wide approaches. DNA methylation profiling offers the unique advantage of simultaneous classification and CNV analysis, serving as an effective reference standard, particularly for diagnostically challenging cases [31] [36].
For clinical trials and drug development, integrated molecular profiling combining methylation-based classification with NGS confirmation provides the most comprehensive assessment, ensuring accurate patient stratification based on CNV markers with both diagnostic and prognostic significance [35] [33]. As these technologies continue to evolve, standardization of analytical pipelines and interpretation criteria will be essential for maximizing concordance across platforms and institutions.
This guide objectively compares the performance of Fluorescence In Situ Hybridization (FISH) and Next-Generation Sequencing (NGS) for genomic profiling in Acute Lymphoblastic Leukemia (ALL) and Multiple Myeloma (MM), synthesizing current concordance research to inform experimental and clinical decision-making.
The accurate detection of genetic abnormalities is a cornerstone for the diagnosis, risk stratification, and treatment of hematologic malignancies. For years, FISH has been a gold standard technique, providing a targeted approach to identify specific chromosomal rearrangements, amplifications, and deletions. With the advent of high-throughput methods, NGS has emerged as a powerful alternative, offering a comprehensive view of the genomic landscape from a single test. Understanding the concordance between these methods is critical for validating NGS in clinical practice and for appreciating the unique insights each method can provide. This guide compares their performance in ALL and MM, supported by recent experimental data and detailed methodologies.
Performance Comparison: FISH vs. NGS
The concordance between FISH and NGS varies across different genetic abnormalities and disease contexts. The following tables summarize key quantitative findings from recent studies.
Table 1: Overall Diagnostic Yield and Concordance in Hematologic Malignancies
| Malignancy | Study Cohort | FISH Positive Yield | Alternative Method Positive Yield | Concordance Rate | Key Findings |
|---|---|---|---|---|---|
| Multiple Myeloma | 130 patients (Concordance Cohort) [37] | 50.8% (66/130) | 50.8% (66/130) by PCE-NGS | 100% (for t(11;14)) | 100% concordance between PCE-FISH and PCE-NGS for t(11;14) detection. |
| Multiple Myeloma | 150 patients [10] [38] | N/A | N/A | >93% Balanced Accuracy | UMA NGS panel showed >93% balanced accuracy for CNA and translocations vs. FISH. |
| Various HMs | 201 cases (CLL, ALL, MM, MDS) [39] | 39.8% (80/201) | 17.9% (36/201) by CCS | 58.7% Overall Concordance | FISH had a higher diagnostic yield than conventional cytogenetics (CCS). |
Table 2: Technology-Specific Advantages and Limitations
| Technology | Advantages | Limitations | Ideal Use Case |
|---|---|---|---|
| FISH | - High sensitivity for specific, known abnormalities [39]- Rapid turnaround for targeted questions- Works on interphase nuclei [39] | - Targeted; limited genome-wide view [40]- May miss complex rearrangements [40]- Requires prior knowledge of target | - Rapid confirmation of specific prognostic translocations (e.g., IGH in MM [40])- Testing when only a specific biomarker is needed |
| NGS | - Genome-wide screening for mutations, CNAs, and SVs [10]- Identifies novel fusion partners and complex events [40]- Single assay for multiple aberration types | - Higher cost and bioinformatics burden [10]- Can miss abnormalities in low tumor purity samples [26] | - Comprehensive risk stratification at diagnosis [10]- Identifying mechanisms of resistance- Discovery of novel biomarkers |
| OGM | - Genome-wide detection of SVs/CNVs without complex bioinformatics [40]- High resolution for complex rearrangements [40] | - Emerging technology; not yet standard in clinics- Requires high-molecular-weight DNA | - Clarifying complex cytogenetic findings from FISH [40]- Research into catastrophic complex rearrangements |
Table 3: Disease-Specific Performance in ALL and MM
| Disease | Genetic Abnormality | Concordance Findings | Clinical/Research Implications |
|---|---|---|---|
| Multiple Myeloma | t(11;14) | 100% concordance between FISH and NGS in a 130-patient cohort [37]. Status is stable from diagnosis to relapse [37]. | Robust biomarker for venetoclax therapy; either method is reliable for detection. |
| Multiple Myeloma | IgH Translocations & CNAs | High concordance (>93%) for canonical IgH translocations and copy number alterations with the UMA NGS panel [10]. | Validates NGS as a comprehensive tool for MM risk stratification per R2-ISS. |
| Acute Lymphoblastic Leukemia (ALL) | Various (e.g., RUNX1 amplification) | One study found CCS detected abnormalities in 47.6% of ALL patients, a population in which it provided significant benefit over a targeted FISH panel [39]. | Highlights the potential value of genome-wide methods (CCS or NGS) over targeted FISH in ALL. |
Detailed Experimental Protocols
To ensure the reproducibility of concordance studies, the following sections detail the standard methodologies for FISH and NGS as applied in the cited research.
FISH Testing Protocol
The FISH protocol is critical for reliable detection of chromosomal abnormalities. Key steps include cell enrichment, hybridization, and stringent scoring.
Table 4: Key Research Reagent Solutions for FISH Testing
| Research Reagent | Function/Description | Example Product (from cited studies) |
|---|---|---|
| Plasma Cell Enrichment Kit | Isolates and enriches clonal plasma cells from heterogeneous bone marrow aspirates, drastically improving detection sensitivity. | Magnetic beads (Miltenyi Biotec) [37] |
| FISH Probe Kit | Labeled DNA sequences designed to bind specific genomic loci. Dual-color probes can detect translocations via fusion signals. | Vysis IGH/CCND1 XT DF FISH Probe Kit (Abbott Molecular) [37] |
| Hybridization System | A controlled environment for the denaturation and hybridization of probes to target DNA. | ThermoBrite hybridization chamber (Statspin) [39] |
| Fluorescence Microscope & Software | For visualizing fluorescent signals and scoring a sufficient number of nuclei. | Zeiss Axio fluorescence microscope with ISIS software (MetaSystems) [39] |
Workflow Diagram: FISH Testing for Hematologic Malignancies
Detailed Methodology:
- Sample Preparation & Plasma Cell Enrichment (PCE): Bone marrow or peripheral blood samples are collected. For multiple myeloma, PCE is often critical. This is performed using magnetic beads (e.g., from Miltenyi Biotec) conjugated with antibodies against CD138 to isolate clonal plasma cells, significantly improving sensitivity and reducing background noise from non-clonal cells [37].
- Slide Preparation & Denaturation: Fixed cells are dropped onto microscopic slides and aged. The slides and the targeted FISH probes (e.g., for IGH and CCND1) are co-denatured at a high temperature (e.g., 75°C for 5 minutes) to separate DNA strands [39].
- Hybridization: Denatured probes are applied to the denatured sample on the slide. The slide is sealed and incubated overnight at 37°C in a humidified hybridization chamber to allow the probes to bind to their complementary DNA sequences [39].
- Post-Hybridization Washes: Slides undergo stringent washes (e.g., in 0.4X SSC at 70°C) to remove any excess or non-specifically bound probes, reducing background fluorescence [39].
- Counterstaining and Analysis: Slides are counterstained with DAPI to visualize nuclei. A fluorescence microscope (e.g., Zeiss Axio) is used to score a predetermined number of interphase nuclei (typically 100-200) by two independent cytogeneticists. The cutoff for positivity is defined per abnormality (e.g., >30% of cells with an abnormal fusion signal for t(11;14)) [37] [39].
NGS Testing Protocol
NGS protocols for genomic profiling involve DNA extraction, library preparation, sequencing, and sophisticated bioinformatic analysis.
Workflow Diagram: NGS-Based Genomic Profiling
Detailed Methodology:
- DNA Extraction from Enriched Cells: DNA is extracted from CD138+ plasma cells (or other sample types) that have been enriched. Studies emphasize using samples with high plasma cell purity (>80%) after PCE for reliable results. DNA is extracted using commercial kits (e.g., AllPrep DNA/RNA/miRNA kit or NucleoSpin Tissue kit) [37] [10].
- Library Preparation & Target Capture: The extracted DNA is used to prepare sequencing libraries. Targeted panels like the Unique Molecular Assay (UMA) are used for efficient capture of relevant genomic alterations. The UMA panel, for example, is designed to capture:
- Translocations: Targeted regions within the IgH locus (92.9 kbp footprint) to capture canonical translocations [10] [38].
- Copy Number Alterations (CNA): Leverages both on-target and off-target reads to call genome-wide CNAs without needing thousands of SNP probes [10].
- Gene Mutations: Targets 82 genes known to be drivers in multiple myeloma [10].
- Sequencing & Data Analysis: Libraries are sequenced on platforms like the Illumina NextSeq to a high median coverage (e.g., 233X). A customized bioinformatics pipeline is then used to identify single nucleotide variants, insertions/deletions, CNAs, and structural variants from the raw sequencing data [37] [10].
Clinical and Research Implications
The high concordance between FISH and NGS for specific, stable abnormalities like t(11;14) in MM validates NGS as a reliable clinical tool [37]. This stability across the disease course is crucial for using it as a predictive biomarker for therapies like venetoclax.
NGS offers a more comprehensive profile, capturing not just targeted abnormalities but also complex rearrangements and mutations that FISH cannot detect. For instance, one study noted that FISH failed to detect approximately 70% of all MYC structural variant subtypes that were identifiable by NGS [40]. This comprehensive capability makes NGS particularly valuable for initial diagnosis and complete risk stratification according to systems like R2-ISS [10].
The choice between FISH and NGS depends on the clinical question. FISH remains a rapid, cost-effective solution for confirming a single, known biomarker. In contrast, NGS is the superior tool for a comprehensive genomic landscape analysis, which is increasingly important in the era of targeted and immunotherapies.
The treatment of epidermal growth factor receptor (EGFR)-mutant non-small cell lung cancer (NSCLC) with tyrosine kinase inhibitors (TKIs) represents a landmark achievement in precision oncology. However, acquired resistance remains a significant clinical challenge, with MET amplification emerging as a critical resistance mechanism. This oncogenic bypass occurs in approximately 5-22% of patients resistant to first-generation EGFR-TKIs and appears at an increased rate of 5-50% in those resistant to third-generation agents like osimertinib [41] [42]. MET amplification activates downstream signaling through ErbB3 and the PI3K/AKT pathway, maintaining survival signals despite EGFR inhibition [42]. Accurate detection of this alteration is therefore paramount for selecting appropriate subsequent therapies, particularly combination regimens targeting both EGFR and MET.
The diagnostic landscape is currently divided between traditional fluorescence in situ hybridization (FISH) and emerging next-generation sequencing (NGS) platforms. This comparison guide objectively evaluates their performance characteristics, methodologies, and clinical utility within the broader research context of FISH versus NGS concordance, providing researchers and drug development professionals with evidence-based insights for method selection.
Methodological Comparison: FISH vs. NGS
Fluorescence In Situ Hybridization (FISH): The Established Standard
Experimental Protocol: The standard FISH protocol for MET amplification detection utilizes dual-color probes targeting the MET gene locus (7q31) and the centromere of chromosome 7 (CEP7) [41] [43]. Formalin-fixed, paraffin-embedded (FFPE) tissue sections of 4-μm thickness are deparaffinized and subjected to hybridization with these probes. Analysis involves enumerating signals in at least 50 non-overlapping tumor cell nuclei to calculate two key parameters: the mean MET gene copy number (GCN) and the MET/CEP7 ratio [41].
Interpretation Criteria: MET amplification is traditionally defined by a MET/CEP7 ratio ≥ 2.0 and/or a mean MET GCN > 5 [43]. Polysomy (multiple copies of chromosome 7) is distinguished from true focal amplification by a GCN ≥ 5 with a MET/CEP7 ratio < 2 [41]. This distinction is clinically relevant, as focal amplification is more likely to represent a true oncogenic driver [2].
Next-Generation Sequencing (NGS): The Comprehensive Genomic Tool
Experimental Protocol: NGS methodologies begin with DNA extraction from FFPE tissue samples using kits such as the QIAamp FFPE DNA Tissue Kit [41]. Following quality control, libraries are prepared through fragmentation, end-repair, adapter ligation, and PCR amplification. Target enrichment is achieved using hybrid-capture panels covering MET and other relevant genes. Sequencing is performed on platforms such as Illumina's Novaseq, with a recommended sequencing depth of ≥500x for reliable copy number detection [43].
Bioinformatic Analysis: Copy number variation is determined through read-depth analysis, where normalized read counts from tumor samples are compared to a baseline from normal controls. The FACETS algorithm is often employed for allele-specific copy number estimation and tumor purity adjustment [2]. MET amplification is typically called when the gene copy number (GCN) meets or exceeds a defined threshold, commonly GCN ≥ 5 [43]. Advanced models incorporate additional biomarkers, such as the GCN of genes like BRAF, CDK6, and CYP3A4 on chromosome 7, to better distinguish focal amplification from polysomy [41].
Table 1: Key Methodological Characteristics of FISH and NGS for MET Amplification Detection
| Characteristic | FISH | NGS |
|---|---|---|
| Sample Requirement | FFPE tissue sections | FFPE tissue or cell-free DNA |
| Probe/Target Design | MET and CEP7 probes | Hybrid-capture panels (e.g., 84-505 genes) |
| Key Output Metrics | MET/CEP7 ratio, Mean MET GCN | MET Gene Copy Number (GCN), Fold-change |
| Definition of Amplification | MET/CEP7 ratio ≥ 2.0 and/or GCN > 5 | GCN ≥ 5 (thresholds vary by platform) |
| Tumor Cell Requirement | Direct visualization allows selective counting | Requires sufficient tumor purity (e.g., ≥10%) |
| Ability to Distinguish Focal Amp vs. Polysomy | Yes, via MET/CEP7 ratio | Yes, with advanced bioinformatic models |
Performance and Concordance Data
Analytical Performance from Clinical Studies
Recent prospective and retrospective studies directly comparing FISH and NGS reveal a complex picture of concordance. A 2024 prospective multicenter study in China evaluating EGFR TKI-resistant NSCLC patients reported the sensitivity of NGS (in tissue) for detecting MET amplification, using FISH as a reference, at 39.5% (17/43), with a high specificity of 98.6% (72/73). The overall agreement between the two methods was 76.7% (89/116) [44]. However, performance varied significantly by amplification subtype. For focal MET amplification, the sensitivity of NGS in tissue increased to 66.7% (16/24), with an agreement of 90.7% (88/97) [44].
Another 2024 study constructed an optimal bioinformatic model based on the GCN of MET, BRAF, CDK6, and CYP3A4, achieving a 74.0% overall agreement with FISH. This model demonstrated a sensitivity of 85.7% and specificity of 93.9% for identifying true MET amplification, excluding polysomy cases [41]. Discordances often occurred in samples with polysomy, whereas cases with MET GCN ≥ 5 were reliably identified by NGS [41].
Table 2: Comparative Performance of FISH and NGS in Detecting MET Amplification
| Performance Metric | FISH (Reference) | NGS (Tissue) | NGS (Plasma) |
|---|---|---|---|
| Sensitivity (Overall) | - | 39.5% - 85.7% [44] [41] | 29.2% [44] |
| Specificity | - | 93.9% - 98.6% [44] [41] | 94.5% [44] |
| Overall Agreement with FISH | - | 74.0% - 90.7% [44] [41] | - |
| Positive Predictive Value for TKI Response | Strong (PFS 5.4 vs 1.0 mos, p<0.001) [43] | Moderate (PFS 4.8 vs 2.2 mos, p=0.357) [43] | - |
| Strength in Detection | Polysomy, spatial heterogeneity | Focal amplification, co-occurring alterations | Non-invasive monitoring |
Clinical Utility and Predictive Value
The ultimate validation of any biomarker test lies in its ability to predict patient response to targeted therapy. A 2021 study directly addressed this question by correlating MET amplification status determined by both methods with patient outcomes following MET-TKI treatment. MET amplification identified by FISH showed a superior predictive value. The partial response (PR) rate was 68.0% (17/25) in FISH-positive patients versus 6.7% (1/15) in FISH-negative patients. The median progression-free survival (PFS) was 5.4 months versus 1.0 months (P < 0.001) [43].
In the same cohort, MET amplification identified by NGS (GCN ≥ 5) failed to distinguish significant clinical outcomes. The PR rate was 60.0% (6/10) versus 40.0% (12/30) for NGS-positive and negative patients, respectively, and the median PFS was 4.8 months versus 2.2 months (P = 0.357) [43]. However, when NGS was used to identify focal amplification specifically, the clinical predictive value improved, with a PR rate of 68.8% (11/16) and a median PFS of 4.8 months [43], suggesting that refinement of NGS analysis and interpretation can enhance its clinical utility.
Signaling Pathway and Experimental Workflow
The diagram below illustrates the HGF/MET signaling pathway and its role in mediating resistance to EGFR TKIs, as well as the parallel testing pathways of FISH and NGS.
The Scientist's Toolkit: Essential Research Reagents
Table 3: Key Research Reagents for MET Amplification Detection
| Reagent / Solution | Function / Application | Example Product / Specification |
|---|---|---|
| MET/CEP7 FISH Probe | Dual-color probe for simultaneous visualization of MET gene and chromosome 7 centromere on FFPE sections. | Vysis MET/CEP7 Probe (Abbott Laboratories) [41] [43] |
| FFPE DNA Extraction Kit | Isolation of high-quality genomic DNA from formalin-fixed, paraffin-embedded tissue samples for NGS. | QIAamp FFPE DNA Tissue Kit (Qiagen) [41] |
| Hybrid-Capture NGS Panel | Target enrichment of MET and other cancer-related genes for comprehensive genomic profiling. | Custom panels (e.g., 84-505 genes); MSK-IMPACT [41] [2] |
| FACETS Algorithm | Bioinformatic tool for allele-specific copy number analysis and tumor purity adjustment from NGS data. | R package "FACETS" for tumor ploidy and purity assessment [2] |
| CD138 Magnetic Beads | Purification of plasma cells from bone marrow for multiple myeloma genomic studies; exemplifies cell enrichment prior to nucleic acid extraction. | CD138 (Syndecan-1) MicroBeads [38] |
Integrated Discussion and Future Directions
The data presented reveal that FISH and NGS offer complementary strengths for MET amplification detection. FISH remains the gold standard for its robust predictive value for therapy response and unique ability to distinguish amplification patterns at the single-cell level, even in heterogeneous samples [43]. However, NGS provides a compelling alternative with its comprehensive genomic profiling capability, high specificity, and improving concordance for focal amplification, especially when enhanced by sophisticated bioinformatic models [41] [2].
A critical challenge for NGS is the standardization of thresholds and analytical methods across different platforms. The definition of MET amplification by NGS varies, with GCN cutoffs ranging from 2.3 to 10 [41] [43]. Furthermore, distinguishing clinically significant focal amplification from polysomy requires additional analytical steps, such as assessing the GCN of neighboring genes on chromosome 7 [41] [2]. For drug development professionals, these methodological nuances are essential, as clinical trial data suggest that high-level amplification (e.g., GCN ≥ 6 or MET/CEP7 ≥ 5) is a stronger predictor of response to MET inhibitors [43] [42].
Future efforts should focus on harmonizing NGS reporting standards and validating these against clinical outcomes in larger cohorts. The integration of NGS and FISH, where NGS serves as an initial comprehensive screen and FISH confirms ambiguous or critical results, may represent the most effective diagnostic pathway. As combinatorial therapies targeting EGFR and MET become more established, the precise and reliable detection of MET amplification will only grow in importance for personalizing treatment strategies in EGFR TKI-resistant NSCLC.
The differentiation between pulmonary infections and malignancies presents a significant diagnostic challenge in respiratory medicine. Metagenomic next-generation sequencing (mNGS) has emerged as a powerful diagnostic tool that can simultaneously detect pathogens and analyze host-derived chromosomal alterations, notably copy number variations (CNVs), from the same bronchoalveolar lavage fluid (BALF) sample. This capability is particularly valuable for patients with overlapping symptoms of infection and cancer. This review comprehensively compares the diagnostic performance of mNGS against conventional methods including microbial culture, fluorescence in situ hybridization (FISH), and targeted NGS approaches, with a specific focus on pulmonary applications. We present quantitative performance data, detailed experimental methodologies, and analytical frameworks that demonstrate mNGS provides superior sensitivity for pathogen detection while maintaining the unique capability to concurrently identify malignancy-associated CNVs, offering a dual-diagnostic solution from a single test.
In clinical practice, patients with lung lesions are often suspected of having either malignant neoplasms or infectious diseases, with frequently overlapping symptoms that complicate diagnosis [45]. Traditional diagnostic measures to differentiate between lung tumors and infections include culture, multiplex polymerase chain reaction (PCR) analysis, and biopsy of lung tissues or respiratory secretions. However, these methods have significant limitations: culture and biopsy can be time-consuming, and prior antibiotic exposure markedly reduces the sensitivity of culture-based methods [46] [45].
Metagenomic next-generation sequencing (mNGS) has revolutionized the diagnostic landscape by enabling unbiased pathogen detection, particularly in respiratory infections [45]. Simultaneously, the majority of sequencing reads actually derive from the host, harboring valuable diagnostic information for tumors [45]. Copy number variations (CNVs)—duplications or deletions of DNA segments—play crucial roles in the physiological and pathological processes of cancer, and mNGS has the potential to detect these chromosomal abnormalities, providing diagnostic insights into both infections and malignancies [45].
This review examines the dual diagnostic capability of mNGS in pulmonary diagnostics, comparing its performance against established techniques including microbial culture, FISH, and targeted NGS. We provide comprehensive experimental protocols, performance metrics, and analytical frameworks to guide researchers and clinicians in optimizing pulmonary diagnostic strategies.
Performance Comparison of Diagnostic Technologies
The diagnostic performance of mNGS must be evaluated against established technologies across multiple clinical scenarios. The tables below summarize key comparative studies in pulmonary and other infectious disease diagnostics.
Table 1: Comparative Diagnostic Performance in Febrile Patients (n=368) [46]
| Diagnostic Metric | mNGS | Conventional Culture | P-value |
|---|---|---|---|
| Sensitivity | 58.01% | 21.65% | < 0.001 |
| Specificity | 85.40% | 99.27% | < 0.001 |
| Positive Predictive Value | 87.01% | 98.84% | - |
| Negative Predictive Value | 54.67% | 42.90% | - |
Table 2: Comparison of NGS Platforms for Lower Respiratory Tract Infections [47]
| Parameter | mNGS | Capture-based tNGS | Amplification-based tNGS |
|---|---|---|---|
| Number of Species Identified | 80 | 71 | 65 |
| Cost per Test | $840 | Not specified | Not specified |
| Turnaround Time | 20 hours | Shorter than mNGS | Shorter than mNGS |
| Overall Accuracy | Lower than tNGS | 93.17% | Lower than capture-based |
| Gram-positive Bacteria Sensitivity | Not specified | Not specified | 40.23% |
| Gram-negative Bacteria Sensitivity | Not specified | Not specified | 71.74% |
Table 3: Dual Diagnostic Capability of mNGS in Lung Lesions (n=45) [45]
| Diagnostic Application | Sensitivity | Specificity | Comparative Method |
|---|---|---|---|
| Infection Diagnosis | 56.5% | - | CMTs (39.1%) |
| Malignancy Detection via CNVs | 38.9% | 100% | Histopathology |
| Combined CNVs with BALF Cytology | 55.6% | - | Histopathology alone |
Table 4: FISH vs. NGS Concordance in Glioma CNV Detection (n=104) [5]
| Chromosomal Target | FISH-NGS Concordance | FISH-DMM Concordance | NGS-DMM Concordance |
|---|---|---|---|
| EGFR | High | High | High |
| CDKN2A/B | Low | Low | High |
| 1p | Low | Low | High |
| 19q | Low | Low | High |
| Chromosome 7 | Low | Low | High |
| Chromosome 10 | Low | Low | High |
Experimental Protocols and Methodologies
mNGS for Simultaneous Pathogen and CNV Detection
The dual application of mNGS for concurrent pathogen detection and host CNV analysis represents a significant advancement in pulmonary diagnostics. The following protocol is adapted from a prospective study investigating lung lesions [45]:
Sample Collection and Processing:
- Collect bronchoalveolar lavage fluid (BALF, >5 mL) and immediately transport on dry ice
- Store samples at -20°C or process immediately for DNA extraction
- Use sterile deionized water as negative template control (NTC)
DNA Extraction and Library Preparation:
- Extract DNA using nucleic acid extraction kits (e.g., MatriDx Nucleic Acid Extraction Kit, Cat. MD013)
- Utilize automated library preparation systems (e.g., NGS Automatic Library Preparation System, Cat. MAR002)
- Employ total DNA library preparation kits (e.g., MatriDx Total DNA Library Preparation Kit, Cat. MD001T)
- Sequence on Illumina platforms (NextSeq500 or similar) to generate 10-20 million reads per sample
Bioinformatic Analysis:
- Pathogen Detection:
- Remove human sequences by alignment to reference genome (hg19)
- Align non-human reads to curated microbial database using Kraken2 (confidence = 0.5)
- Validate classified reads using Bowtie2
- Perform BLAST alignment for discordant classifications
- Categorize detected species as definite, probable, possible, or unlikely based on clinical correlation
- CNV Analysis:
- Align sequencing reads to human reference genome (hg19) using unique mapped reads
- Segment reference genome into fixed-length windows
- Calculate read depth for each window and normalize against total read count
- Determine copy number ratios by comparing normalized read depth to reference dataset
- Apply fused lasso method to log2-transformed copy number ratios
- Annotate segments with chromosome positions and average ratios
- Apply neural network models (20 models in cited study) to predict cancer presence
Conventional Microbiological Culture
Traditional culture methods remain the benchmark for pathogen identification despite limitations:
Sample Processing:
- Inoculate BALF samples onto blood agar plates and Sabouraud agar plates
- Incubate at 35°C for 24-48 hours for bacteria and 7 days for fungi
- Identify positive cultures using MALDI-TOF mass spectrometry
- Perform antibiotic susceptibility testing using VITEK II compact system with AST-GN334, AST-GN335, and AST-GP639 drug sensitivity cards
- Interpret results according to Clinical and Laboratory Standards Institute (CLSI) guidelines [46]
Limitations:
- Significantly reduced sensitivity in patients with prior antibiotic exposure
- Inability to cultivate fastidious or slow-growing organisms
- Lengthy turnaround time (1-5 days for most bacteria, longer for fungi and mycobacteria)
Fluorescence In Situ Hybridization (FISH)
FISH remains valuable for specific applications but has limitations in comprehensive profiling:
General Principles:
- Employ fluorescently labeled probes directed against DNA or mRNA targets
- Utilize locked nucleic acids (LNAs) and peptide nucleic acids (PNAs) for enhanced stability
- Perform hybridization under optimized temperature conditions
- Visualize using fluorescence microscopy or flow cytometry (Flow-FISH)
Technical Variations:
- Single-probe FISH: Uses single high-specificity probes, often LNA or PNA-based
- Multiple-probe FISH: Utilizes sets of 20-nucleotide oligos for enhanced sensitivity
- Branched signal amplification: Employs sequential hybridization for signal amplification
Applications in Pulmonary Diagnostics:
- Detection of intracellular pathogens
- Identification of specific microbial strains in mixed cultures
- Limited utility for comprehensive pathogen screening compared to NGS
Research Reagent Solutions
Table 5: Essential Research Reagents for mNGS Implementation
| Reagent/Kit | Manufacturer | Primary Function | Application Notes |
|---|---|---|---|
| QIAamp UCP Pathogen DNA Kit | Qiagen | DNA extraction from BALF | Includes human DNA removal with Benzonase |
| TIANamp Micro DNA Kit | TIANGEN BIOTECH | DNA extraction from difficult samples | Suitable for tissue homogenates |
| Total DNA Library Preparation Kit | MatriDx | Library preparation for mNGS | Compatible with automated systems |
| Illumina NextSeq 500/550 | Illumina | High-throughput sequencing | 75-bp single-end reads typical |
| NuGEN Ovation System | NuGEN | RNA sequencing | For RNA pathogen detection |
| Bioinformatic Databases | NCBI, Custom | Pathogen identification | Kraken2, Bowtie2, BLAST |
Analytical Frameworks for Result Interpretation
Pathogen Detection Criteria
Establishing robust criteria for pathogen identification is crucial for clinical utility:
mNGS Positive Findings:
- For pathogens with background in negative controls: RPM ratio (RPMsample/RPMNTC) ≥ 10
- For pathogens without background in negative controls: RPM threshold ≥ 0.05
- Species categorized as "definite" or "probable" based on clinical correlation
- Consideration of clinical presentation, radiographic findings, and supporting laboratory data
Culture Positive Findings:
- Growth of compatible pathogens in culture media
- Confirmation by MALDI-TOF mass spectrometry
- Correlation with clinical presentation
CNV Analysis for Malignancy Detection
Host DNA analysis from BALF samples provides valuable oncological insights:
Analytical Approach:
- Normalize read depth against total read count
- Calculate copy number ratios for genomic windows
- Identify significant deviations from normal diploid state
- Apply machine learning algorithms for malignancy prediction
- Integrate with cytological findings for enhanced sensitivity
Performance Considerations:
- Higher sensitivity (50%) when bronchoscopy reveals direct signs of neoplasia
- Specificity approaches 100% for confirmed malignancies
- Complementary to conventional cytology and histopathology
mNGS represents a transformative technology in pulmonary diagnostics, offering unprecedented dual capability for simultaneous pathogen detection and host malignancy analysis. While conventional methods including culture and FISH maintain specific advantages in particular clinical scenarios, the comprehensive profiling ability, superior sensitivity, and expanding applications of mNGS position it as an increasingly indispensable tool. The integration of mNGS into standard diagnostic workflows for complex pulmonary cases provides opportunities for more precise pathogen identification, earlier malignancy detection, and ultimately improved patient management. Future developments in sequencing technologies, bioinformatic analysis, and standardized interpretation frameworks will further enhance the clinical utility of mNGS in respiratory medicine.
The quest for precision medicine has ushered in an era where comprehensive genomic analysis is paramount for both research and clinical diagnostics. Within this landscape, the detection of structural variants (SVs)—genomic alterations larger than 50 base pairs encompassing deletions, duplications, insertions, inversions, and translocations—remains a significant challenge. Structural variants are crucial drivers in a plethora of diseases, including cancer and constitutional disorders. Historically, cytogenetic techniques such as chromosome banding analysis (CBA), fluorescence in situ hybridization (FISH), and chromosomal microarrays (CMA) have been the standard tools for SV assessment. However, these methods have well-documented diagnostic blind spots, including limited resolution, the need for prior knowledge of the target for FISH probes, and the inability of CMA to detect balanced rearrangements [48] [49]. Next-generation sequencing (NGS) has improved the detection of single nucleotide variants and small insertions/deletions, but its ability to resolve complex SVs, particularly in repetitive regions that constitute a large portion of the genome, is often limited [50]. This technological gap has spurred the development of two powerful, yet fundamentally distinct, emerging technologies: Optical Genome Mapping (OGM) and Hi-C. This guide provides an objective comparison of their performance, methodologies, and applications within the broader context of advancing beyond traditional FISH and NGS concordance studies.
Optical Genome Mapping (OGM)
Principle: OGM is an imaging-based, non-sequencing technology designed for high-resolution, genome-wide profiling of SVs. It utilizes ultra-high molecular weight (UHMW) DNA, typically >150-300 kbp in size, which is extracted using specialized protocols to minimize shearing [49] [51]. In a single enzymatic reaction, a specific 6-bp sequence motif (CTTAAG) is covalently labeled with a fluorescent dye, creating a unique, sequence-specific barcode pattern along the DNA molecule [48] [51]. These labeled molecules are linearized in nanochannel arrays on a chip, imaged, and the fluorescence patterns are digitized. Bioinformatic algorithms then align the collected barcode patterns to a reference genome, with changes in the expected pattern (missing, extra, or rearranged labels) revealing the presence and nature of SVs [48] [49]. A key advantage is that SVs are observed directly from the pattern on the long DNA molecules, rather than being inferred from short sequencing reads, allowing it to resolve complex regions that are challenging for NGS [51].
Hi-C and Its Advanced Derivative, Micro-C-ChIP
Principle: Hi-C and its more recent evolution, Micro-C, are sequencing-based methods designed to map the 3D architecture of chromatin within the nucleus. The core process involves crosslinking chromatin to preserve spatial interactions, digesting the DNA with a restriction enzyme (Hi-C) or micrococcal nuclease (Micro-C, for nucleosome-level resolution), and then performing proximity ligation to join spatially co-located DNA fragments [52]. The resulting chimeric DNA molecules are sequenced, and bioinformatic pipelines are used to identify regions of the genome that are in close physical proximity, generating genome-wide interaction maps. These maps reveal features such as topologically associating domains (TADs) and A/B compartments [52]. While its primary purpose is the study of 3D genome organization, the data can also be used to infer large-scale SVs, as rearrangements disrupt the normal pattern of chromatin interactions.
A significant recent advancement is Micro-C-ChIP, which combines the high resolution of Micro-C with chromatin immunoprecipitation (ChIP) for specific histone modifications (e.g., H3K4me3 for active promoters, H3K27me3 for Polycomb-repressed regions) [52]. This enrichment allows for deep sequencing of functionally relevant genomic regions at a lower cost and with higher resolution for focal interactions, such as enhancer-promoter loops [52].
Comparative Performance and Experimental Data
The performance of OGM and Hi-C/Micro-C-ChIP differs significantly due to their distinct technological bases and primary objectives. The table below summarizes a direct comparison of their capabilities based on recent studies.
Table 1: Direct Comparison of OGM and Hi-C/Micro-C Technologies
| Feature | Optical Genome Mapping (OGM) | Hi-C / Micro-C-ChIP |
|---|---|---|
| Primary Purpose | Genome-wide structural variant (SV) detection [48] [49] | 3D chromatin architecture and organization [52] |
| Technology Base | Imaging of fluorescently labeled long DNA molecules [51] | Proximity ligation followed by sequencing [52] |
| Theoretical Resolution | ~500 bp for germline, >5 kbp for somatic SVs [48] [49] | Nucleosome-level for Micro-C-ChIP in targeted regions [52] |
| Detects Balanced SVs | Yes (inversions, translocations) [49] | Can be inferred from disrupted interaction maps |
| Effective Coverage | ~80x (germline) to >300x (somatic) [48] | Varies greatly with sequencing depth; Micro-C-ChIP reduces burden by targeting [52] |
| Variant Allele Frequency Sensitivity | ~5% in somatic settings [49] | Dependent on sequencing depth and analysis pipeline |
| Key Advantage | Single assay for all SV types; excels in repetitive regions [51] [50] | Provides functional context of chromatin state and interactions [52] |
| Major Limitation | No base-pair resolution; requires viable cells for UHMW DNA [49] | SV detection is indirect and inferential; high sequencing cost for high resolution [52] |
Quantitative data from validation studies highlight the clinical potential of OGM. In a landmark study of 101 myelodysplastic syndrome (MDS) patients, OGM detected 383 clinically significant SVs. Crucially, 51% of these SVs (across 34% of patients) were cryptic and missed by standard chromosome banding analysis. This included high-impact rearrangements involving genes like MECOM and NUP98, and KMT2A partial tandem duplications. This enhanced detection changed the risk category for 17-21% of patients, providing a more accurate prognosis [50]. Another study comparing OGM to long-read sequencing platforms (PacBio, ONT) found that ~99% of translocations and ~80% of deletions identified by OGM were confirmed by these sequencing technologies [53].
For Hi-C, performance metrics for SV detection are less commonly reported than for chromatin features. However, the development of Micro-C-ChIP demonstrates a significant improvement in efficiency. One study reported that Micro-C-ChIP maintained a high fraction of "informative reads" (42%), comparable to genome-wide Micro-C (37%), while other ChIP-based protocols depleted this fraction to as low as 4% [52]. This allows it to reveal genuine 3D contacts, such as promoter-promoter networks, with a much lower sequencing burden than required for whole-genome Hi-C [52].
Table 2: Concordance of OGM with Other Technologies in Detecting Structural Variants (Selected Studies)
| Study Context | Comparison Technology | Key Concordance Finding | Citation |
|---|---|---|---|
| MDS Cohort (n=101) | Chromosome Banding Analysis (CBA) | OGM detected all SVs found by CBA plus an additional 51% that were cryptic. | [50] |
| SKBR3 Cell Line | Long-Read Sequencing (PacBio, ONT) | ~99% of OGM-called translocations and ~80% of deletions were confirmed. | [53] |
| General Cytogenomics | FISH / CMA / Karyotype | OGM showed >95% concordance with standard-of-care tests, with discordances often due to low-level mosaicism. | [49] |
Detailed Experimental Protocols
Optical Genome Mapping Workflow
The following diagram illustrates the core, multi-day workflow for an OGM assay, from sample preparation to final data analysis.
Key Steps in OGM Protocol [49] [51] [50]:
- Sample Preparation: Requires viable cells or frozen cell pellets (e.g., from blood, bone marrow, cultured cells). Fixed samples are not suitable as they compromise DNA integrity.
- UHMW DNA Extraction: This is a critical first step. Cells are lysed, and DNA is purified using a paramagnetic disk to gently trap and wash the DNA, minimizing mechanical shearing forces. This yields DNA fragments with an average size of 150-300 kbp, which is essential for spanning large SVs.
- Direct Labeling and Staining: Approximately 750 ng of UHMW DNA is labeled in an enzymatic reaction using a direct label enzyme (e.g., DLE-1) that recognizes the CTTAAG motif and covalently attaches a fluorophore. This creates a specific label pattern approximately every 6-15 kbp across the genome. The DNA backbone is then stained with a second dye for visualization.
- Linearization and Imaging: The labeled DNA is loaded onto a chip containing nanochannels. Electrophoresis drives individual DNA molecules into the channels, where they are linearized. A high-resolution camera captures images of the fluorescent patterns as the molecules flow through.
- Data Analysis and SV Calling: Software converts the raw images into digital label maps (barcodes). These are aligned to an in silico generated reference map. SVs are identified based on discrepancies in label pattern, such as:
- Deletion: A gap of missing labels in the sample compared to the reference.
- Insertion/Repeat Expansion: An unexpected stretch of extra labels.
- Inversion/Translocation: A local or global change in the order of labels.
Micro-C-ChIP Workflow
The protocol for Micro-C-ChIP, which focuses on mapping 3D interactions for specific chromatin marks, involves several key steps as illustrated below.
Key Steps in Micro-C-ChIP Protocol [52]:
- Dual Crosslinking: Cells are treated with a crosslinking agent (e.g., formaldehyde followed by DSG) to freeze chromatin interactions in their native 3D state.
- MNase Digestion: Chromatin is fragmented using Micrococcal Nuclease (MNase), which preferentially cleaves linker DNA between nucleosomes. This provides nucleosome-level resolution, a significant improvement over restriction enzyme-based Hi-C.
- End Repair and Biotinylation: The digested DNA ends are repaired and marked with biotin.
- Proximity Ligation: Under dilute conditions, the biotinylated ends of spatially proximal DNA fragments are ligated together, creating chimeric molecules representing chromatin interactions.
- Chromatin Immunoprecipitation (ChIP): The ligated chromatin is solubilized by sonication and subjected to immunoprecipitation with an antibody specific to a histone modification of interest (e.g., H3K4me3). This enriches for ligation products originating from regions marked by that histone PTM.
- Library Preparation and Sequencing: The enriched DNA is processed into a sequencing library, and the biotin-containing ligation junctions are captured to ensure only informative molecules are sequenced.
- Bioinformatic Analysis: Sequenced reads are mapped to the genome, and interaction matrices are constructed. Normalization strategies specific to enrichment-based methods are applied to distinguish true interactions from background.
The Scientist's Toolkit: Essential Research Reagents and Materials
The successful implementation of these technologies relies on a suite of specialized reagents and instruments.
Table 3: Essential Research Reagent Solutions for OGM and Hi-C/Micro-C
| Item | Technology | Function | Example / Note |
|---|---|---|---|
| UHMW DNA Isolation Kit | OGM | Isolves long, intact DNA molecules (>150 kbp) with minimal shearing. | Bionano Prep SP Blood and Cell DNA Isolation Kit [50]. Critical for data quality. |
| Direct Labeling Enzyme (DLE) | OGM | Recognizes a specific 6-bp sequence motif and attaches a fluorescent label. | DLE-1 (recognizes CTTAAG) is used to create the genomic barcode [51] [50]. |
| Nanochannel Chip | OGM | Linearizes single DNA molecules for consistent imaging. | Saphyr chip G2.3 [50]. Throughput is determined by the number of chips and flow cells. |
| Crosslinking Reagents | Hi-C / Micro-C | Preserves in vivo chromatin interactions before digestion. | Formaldehyde and Disuccinimidyl Glutarate (DSG) for dual crosslinking [52]. |
| MNase Enzyme | Micro-C-ChIP | Fragments chromatin at nucleosome resolution for high-resolution interaction mapping. | Superior to restriction enzymes for detecting short-range features like enhancer-promoter loops [52]. |
| Validated ChIP-Grade Antibodies | Micro-C-ChIP | Enriches for ligation products from specific chromatin states. | Antibodies against H3K4me3, H3K27me3, etc. Specificity is crucial for low-background data [52]. |
| Biotin Labeling Kit | Hi-C / Micro-C | Marks ligation junctions for pulldown of informative chimeric molecules. | e.g., Nick Translation DNA labeling system [54]. Reduces sequencing of non-informative fragments. |
Optical Genome Mapping and Hi-C/Micro-C-ChIP represent two powerful but distinct pillars of modern genomic analysis. OGM excels as a dedicated cytogenomic tool for comprehensive SV detection, offering a unified, high-resolution alternative to the traditional combination of karyotyping, FISH, and CMA. Its ability to directly visualize SVs in complex genomic regions makes it particularly valuable for clinical diagnostics and cancer genomics, where accurate SV profiling directly impacts diagnosis and prognosis [49] [50]. In contrast, Hi-C and its advanced derivative Micro-C-ChIP are premier technologies for decoding the spatial organization of the genome, providing functional insights into gene regulation. While they can infer SVs, this is a secondary application derived from disruptions in interaction maps [52].
The choice between these technologies is not a matter of superiority but is dictated by the research or clinical question. For a cytogenetics laboratory focused on maximizing SV detection yield in hematological malignancies or constitutional disorders, OGM currently provides a more direct and cost-effective solution [48] [49]. For a research group investigating the role of 3D genome architecture in gene regulation or cellular differentiation, Micro-C-ChIP offers unparalleled, targeted insights. Looking forward, the integration of these technologies with each other and with long-read sequencing promises a more complete picture of the genome, where the full sequence context, comprehensive SV landscape, and spatial chromatin organization are resolved simultaneously, driving the next wave of discovery in genomics and personalized medicine.
Resolving Discordance and Optimizing Diagnostic Workflows
The accurate detection of genomic alterations is a cornerstone of precision oncology, directly influencing diagnosis, prognosis, and treatment selection. For years, fluorescence in situ hybridization (FISH) has been the established gold standard for identifying copy number alterations (CNAs) and gene rearrangements in many clinical settings [5] [41] [55]. The advent of next-generation sequencing (NGS) has introduced a powerful, high-throughput alternative capable of profiling a vast array of genetic abnormalities simultaneously. While these methods often show strong concordance, discordant results are not uncommon, presenting significant clinical challenges. This guide objectively compares the performance of FISH and NGS, framing the analysis within the broader thesis that observed discordances stem from a combination of inherent technical limitations and underlying biological complexity. Understanding these sources is critical for researchers and clinicians to correctly interpret diagnostic data and optimize testing strategies.
Technical Limitations of FISH and NGS
The fundamental principles of FISH and NGS lead to distinct technical strengths and weaknesses. A comparative analysis of their core characteristics is summarized in the table below.
Table 1: Fundamental Technical Comparison of FISH and NGS
| Feature | Fluorescence In Situ Hybridization (FISH) | Next-Generation Sequencing (NGS) |
|---|---|---|
| Primary Principle | Hybridization of fluorescently-labeled DNA probes to complementary target sequences on chromosomes [6]. | Massively parallel sequencing of DNA fragments, with bioinformatic mapping to a reference genome [6] [10]. |
| Throughput | Low; limited number of probes per assay [6] [7]. | High; capable ofinterrogating hundreds of genes or the whole genome in a single run [6] [7]. |
| Resolution | Limited to the size of the probes used (typically large, cytogenetic-scale alterations) [10]. | High; can detect single nucleotide variants and focal CNAs [10]. |
| Tumor Purity & Heterogeneity | Preserves spatial context; allows for visual assessment of heterogeneity and analysis of individual cells [6] [56]. | Requires bioinformatic deconvolution; results represent an average across the sampled cell population [6] [41]. |
| Key Technical Challenges | Subjectivity in signal interpretation [41] [57]; inability to detect unknown fusions [58]. | Requires high-quality DNA/RNA; complex data analysis; challenges with low tumor purity [6] [41]. |
Probe Specificity vs. Genome-Wide View: FISH is highly specific for the targeted loci but provides no information about other genomic regions. NGS, especially with comprehensive panels, can detect unexpected alterations. For instance, in neuroblastoma, NGS detected subsegmental 17q gains that were missed by targeted FISH probes, illustrating NGS's ability to reveal finer structural details [6].
Subjectivity vs. Computational Quantification: FISH relies on manual counting of fluorescent signals, introducing a risk of inter-observer variability [41]. In ALK testing in NSCLC, complex FISH patterns (e.g., coexisting split signals, deletions, and polysomy) can be challenging to interpret consistently [56] [57]. NGS provides a quantitative and objective measure, such as a log2 copy ratio for CNAs or a specific read count for fusions [6] [7].
Tumor Heterogeneity and Sampling: FISH's cell-by-cell analysis can identify small subclones if present in the section analyzed. One neuroblastoma study noted that FISH detected 11q deletion and 17q gain in a few tumor cells in two cases, which were not detected by NGS, likely due to the assay's dilution effect by non-tumor DNA [6]. Conversely, NGS might miss alterations present in only a minor subset of cells.
Biological Complexity Underlying Discordant Results
Beyond technical factors, the biological nature of genomic alterations is a major source of discordance. The same genetic anomaly can manifest differently at the DNA, RNA, and protein levels, and each assay measures a different facet of this complex picture.
Case Study: ALK Rearrangements in NSCLC
ALK status discordance provides a powerful illustration of biological complexity. Studies consistently report cases that are FISH-positive/IHC-negative ("positive discordant") and FISH-negative/IHC-positive ("negative discordant") [56] [57].
Complex Rearrangements and Protein Expression: Research reveals that a significant proportion of FISH-positive/IHC-negative cases harbor atypical or complex patterns of ALK rearrangement. One study found that these discordant cases frequently featured multiple FISH signal patterns (e.g., coexisting split and deletion patterns) and a higher incidence of ALK copy number gains or polysomy [56] [57]. In such cases, the complex genetic alteration may not lead to the production of a stable fusion protein detectable by IHC. When investigated by NGS, which can directly sequence fusion transcripts, many of these FISH-positive/IHC-negative cases were not confirmed to have a functional ALK fusion, and critically, patients with this profile did not respond to ALK inhibitor therapy [56]. This suggests FISH may be detecting genomic scars or non-functional rearrangements.
Atypical Fusions and Assay Limits: FISH can also miss certain rearrangements. "Negative discordant" (FISH-negative/IHC-positive) cases can sometimes be resolved by NGS, which identifies an ALK fusion that was not detected by the break-apart FISH probe, potentially due to a variant or "short" breakpoint pattern [57] [58]. In these instances, IHC and NGS concordantly detect the biologically active alteration.
The diagram below synthesizes the pathway from ALK genetic alteration to patient treatment, highlighting key decision points and sources of discordance.
Figure 1. Diagnostic Pathway and Discordance in ALK Fusion Detection. This workflow illustrates how a single genetic alteration can lead to different results based on the assay used. Complex FISH patterns may not produce a stable protein detectable by IHC, and NGS can serve as a decisive method to identify functional fusions and predict patient response to targeted therapy [56] [57] [58].
The Challenge of Polysomy vs. Focal Amplification
Another clear example of biologically-driven discordance is the differentiation between true focal gene amplification and chromosomal polysomy (gain of an entire chromosome). This is critically important in biomarkers like MET amplification in NSCLC resistant to EGFR TKIs [41] [55].
The Biological Difference: Focal MET amplification involves multiple copies of the MET gene itself and is a recognized oncogenic driver. In contrast, polysomy of chromosome 7 results in an increase in the MET gene copy number (GCN) simply because there are more copies of the entire chromosome. The former is a specific, targeted event, while the latter is a broader genomic instability.
How Assays Discern This: The gold-standard FISH assay uses a MET/CEP7 ratio (CEP7 being a probe for the chromosome 7 centromere) to distinguish the two. A high MET GCN with a MET/CEP7 ratio ≥2 defines amplification, while a high GCN with a ratio <2 indicates polysomy [41] [55]. NGS, however, typically reports only a total MET GCN. Without an internal control for chromosome 7 ploidy, it can be difficult for NGS to differentiate between these two biologically distinct states. This leads to a significant portion of discordance, where NGS may classify a polysomy case as amplified based on GCN alone [41] [55]. Advanced NGS bioinformatic models that incorporate the copy number of other genes on chromosome 7 (e.g., BRAF, CYP3A4) are being developed to overcome this limitation and improve concordance with FISH [41].
Comparative Performance Data Across Cancers
The concordance between FISH and NGS has been systematically evaluated across various malignancies. The following table synthesizes quantitative performance data from key studies.
Table 2: Quantitative Concordance Data Between FISH and NGS Across Cancer Types
| Cancer Type | Genetic Alteration | Concordance Rate | Key Study Findings | Citation |
|---|---|---|---|---|
| Neuroblastoma | 1p deletion, 11q deletion, 17q gain | High (Matched results) | NGS detected additional subsegmental gains; FISH detected low-level aberrations in a few cells missed by NGS. | [6] |
| Glioma | EGFR, CDKN2A/B, 1p, 19q | High (NGS vs. DNA Methylation Microarray) | FISH showed relatively low concordance with NGS and DNA methylation microarray, especially in high-grade tumors. | [5] |
| NSCLC (ALK) | ALK rearrangements | Variable | Discordance often involved complex FISH patterns. NGS confirmation aligned with IHC and predicted TKI response. | [56] [57] [58] |
| NSCLC (MET) | MET amplification | 74% - 90.7%* | Discordance primarily due to polysomy cases. Concordance high for true focal amplification. | [41] [55] |
| Chronic Lymphocytic Leukemia (CLL) | del(17p), del(11q), trisomy 12, del(13q) | >90% (Specificity >95%) | Targeted sequencing showed high accuracy for prognostic CNA detection compared to clinical FISH. | [7] |
| Multiple Myeloma (MM) | IgH translocations, Copy Number Alterations | >93% (Balanced Accuracy) | The UMA NGS panel was validated against FISH and SNP arrays for clinical-grade accuracy. | [10] |
*The range reflects different studies and definitions of MET amplification. The higher value (90.7%) is achieved when excluding polysomy cases from the analysis [55].
Essential Research Reagents and Experimental Protocols
To ensure the validity and reproducibility of comparative studies, detailed methodologies are crucial. Below is a summary of key experimental protocols and reagents derived from the cited literature.
Standard FISH Protocol
The FISH procedures referenced in the studies generally follow a consistent workflow [6] [56] [41]:
- Sample Preparation: 3-4 μm sections are cut from Formalin-Fixed Paraffin-Embedded (FFPE) tissue blocks.
- Pretreatment: Slides are deparaffinized and subjected to a pretreatment solution to allow probe access, followed by proteolytic digestion.
- Probe Hybridization: Fluorescently labeled locus-specific probes (e.g., for ALK, MET, 1p36) are applied to the target area. The slide is then co-denatured and incubated overnight for hybridization.
- Post-Hybridization Wash: Stringent washes are performed to remove unbound probe.
- Counterstaining and Visualization: Nuclei are counterstained with DAPI, and signals are enumerated using a fluorescence microscope by a trained technologist or pathologist.
Table 3: Key Research Reagent Solutions for FISH and NGS
| Reagent / Solution | Function | Example Products / Components |
|---|---|---|
| Locus-Specific FISH Probes | To bind and visualize specific genomic regions of interest. | Vysis ALK Break Apart Probe [56], ZytoLight SPEC 1p36/1q25 Probe [6], MET/CEP7 Dual Color Probe [41] [55] |
| Hybridization Buffer | To create the correct chemical environment for precise probe binding. | Included in commercial probe kits (e.g., from Abbott Molecular, Zytovision) |
| Stringent Wash Buffer | To remove excess and non-specifically bound probes, reducing background noise. | Saline-sodium citrate (SSC) buffer at specific concentrations and temperatures |
| NGS Hybridization Capture Panel | To selectively enrich genomic libraries for target regions prior to sequencing. | CancerSCAN [6], PedSCAN [6], UMA Panel for myeloma [10], Custom 59-gene panel for CLL [7] |
| NGS Library Prep Kit | To fragment DNA and attach adapter sequences for sequencing. | Kits from manufacturers (e.g., Illumina) compatible with the chosen sequencing platform. |
| Bioinformatic CNA Tools | To analyze sequencing coverage and call copy number alterations. | PatternCNV [7], GATK DepthOfCoverage [6], FACETS [55] |
Targeted NGS and Copy Number Variation Analysis
The NGS methodologies from the studies involve a multi-step process with both wet-lab and computational phases [6] [10] [7]:
- DNA Extraction: Genomic DNA is isolated from FFPE tissue or purified cell populations.
- Library Preparation: DNA is fragmented, and sequencing libraries are constructed with the ligation of adapter sequences.
- Target Enrichment: Hybridization-based capture is performed using custom panels (e.g., CancerSCAN, UMA Panel) designed to target hundreds of cancer-related genes and regions of interest for CNAs.
- Sequencing: Enriched libraries are sequenced on a high-throughput platform (e.g., Illumina NovaSeq) to a high median coverage (>1000x is often ideal for sensitive CNA detection).
- Bioinformatic Analysis for CNAs:
- Alignment: Sequenced reads are aligned to a reference genome.
- Coverage Calculation: Normalized sequencing coverage is calculated for each target region.
- Copy Ratio Estimation: The log2 copy ratio is determined by comparing tumor sample coverage to a pattern-matched normal reference, often with correction for tumor purity and GC-content bias [6] [7].
- CNA Calling: Aberrations are called based on segmental deviations that exceed defined thresholds in log2 ratio and span a significant portion of the chromosomal arm [6].
Tumor Heterogeneity and Clonal Evolution Impact on Assay Concordance
Tumor heterogeneity and continuous clonal evolution present fundamental challenges in molecular diagnostics. Intra-tumoral heterogeneity (ITH), defined as the coexistence of multiple genetically distinct subclones within a single tumor, results from somatic evolution and clonal diversification [59]. This heterogeneity manifests both spatially (across different tumor regions) and temporally (as tumors evolve under treatment pressures) [60]. Consequently, genomic assays that sample different portions of a tumor or sample at different timepoints may yield discordant results, potentially impacting clinical decision-making. Understanding how conventional methods like fluorescence in situ hybridization (FISH) and advanced next-generation sequencing (NGS) techniques navigate this complexity is crucial for diagnostic accuracy and therapeutic selection in oncology.
The implications of this heterogeneity extend directly to clinical outcomes. Studies have demonstrated that spatial heterogeneity in neoantigen expression can enable certain subclones to escape immune surveillance, while temporal evolution through therapy can lead to acquired resistance [60]. This biological reality necessitates technologies capable of capturing comprehensive genomic landscapes rather than mere snapshots of tumor biology.
Technological Foundations: FISH and NGS
Fluorescence In Situ Hybridization (FISH)
FISH represents a cornerstone of cancer cytogenetics, utilizing fluorescently labeled DNA probes to detect specific chromosomal abnormalities through microscopy. This technique allows for the visualization of chromosomal gains, deletions, and translocations within individual cells, providing information about cellular heterogeneity within a sample [6] [61]. Traditional FISH testing is limited by its targeted nature—typically analyzing only a few genetic loci simultaneously—and its resolution threshold of several megabases [62]. Despite these limitations, FISH remains widely used for detecting well-characterized abnormalities in various cancers, with established guidelines for interpretation [6].
Next-Generation Sequencing (NGS)
NGS technologies represent a paradigm shift in genomic analysis, enabling massive parallel sequencing of millions of DNA fragments. Multiple NGS approaches exist for cancer genomics:
- Whole-genome sequencing (WGS) provides comprehensive analysis of the entire genome
- Whole-exome sequencing (WES) focuses on protein-coding regions
- Targeted gene panels concentrate on clinically relevant cancer genes for more cost-effective analysis [63]
Unlike FISH, NGS can simultaneously detect single nucleotide variants (SNVs), insertions/deletions (indels), copy number alterations (CNAs), and structural variants across hundreds of genes [6]. The technology has evolved through generations, with second-generation platforms (short-read sequencing) dominating current clinical applications, and third-generation technologies (long-read sequencing) emerging for improved detection of structural variants [63].
Table 1: Fundamental Characteristics of FISH and NGS Technologies
| Feature | FISH | NGS |
|---|---|---|
| Principle | Hybridization of fluorescent probes to specific DNA sequences | Massive parallel sequencing of DNA fragments |
| Genomic Scope | Targeted (typically 1-5 loci per assay) | Targeted to comprehensive (panels, exomes, whole genomes) |
| Variant Detection | Large chromosomal abnormalities (deletions, amplifications, translocations) | SNVs, indels, CNAs, structural variants, fusions |
| Resolution | ~1-5 Mb | Single nucleotide |
| Throughput | Low (limited probes per assay) | High (multiple samples, multiple genes simultaneously) |
| Tumor Heterogeneity Assessment | Semi-quantitative through cell counting | Computational subclonal reconstruction |
Direct Comparative Evidence in Cancer Diagnostics
Neuroblastoma: SCA Detection Concordance
A 2021 study directly compared FISH and targeted NGS for detecting segmental chromosomal aberrations (SCAs) in 35 neuroblastoma patients [6]. The researchers evaluated three well-established predictive markers: 1p deletion, 11q deletion, and 17q gain. The study utilized customized targeted NGS panels (CancerSCAN and PedSCAN) designed to detect copy number alterations across entire chromosomal regions alongside mutations in hundreds of cancer-related genes.
Table 2: FISH vs. NGS for Detecting Segmental Chromosomal Aberrations in Neuroblastoma
| Aberration Type | Concordance Rate | Discordant Cases | Key Findings |
|---|---|---|---|
| 1p deletion | High | Minimal | NGS and FISH results showed strong correlation |
| 11q deletion | High | 1 case (FISH detected in few cells, missed by NGS) | NGS may miss low cellular prevalence abnormalities |
| 17q gain | High | Multiple cases | NGS detected additional subsegmental gains missed by FISH |
The investigation revealed that NGS could identify subsegmental gains of 17q that were not detectable by conventional FISH analysis, demonstrating NGS's enhanced resolution for precise mapping of copy number changes [6]. However, in one case, FISH detected 11q deletion in a small subpopulation of tumor cells that NGS missed, highlighting FISH's potential advantage in detecting highly focal heterogeneity when the aberrant cell population is limited [6].
Glioma: Multiplatform CNV Assessment
A comprehensive 2025 retrospective study of 104 glioma patients compared FISH, NGS, and DNA methylation microarray (DMM) for evaluating six copy number variation (CNV) parameters with diagnostic and prognostic significance [5]. The assessed markers included EGFR amplification, CDKN2A/B deletion, 1p/19q co-deletion, and whole chromosome 7/10 abnormalities.
Table 3: Method Concordance in Glioma CNV Detection
| Parameter | FISH-NGS Concordance | FISH-DMM Concordance | NGS-DMM Concordance | Clinical Implications |
|---|---|---|---|---|
| EGFR amplification | High | High | High | All methods reliable for EGFR assessment |
| CDKN2A/B deletion | Low | Low | High | FISH limitations in complex regions |
| 1p/19q co-deletion | Low | Low | High | Critical for oligodendroglioma diagnosis |
| Chromosome 7/10 | Low | Low | High | Important for glioblastoma prognostication |
The study found that discordant cases were significantly associated with high-grade gliomas (grade 3/4) and elevated fraction of genome altered, suggesting that genomic instability and complexity in aggressive tumors drive technological discordance [5]. The investigators concluded that NGS and DMM showed strong concordance across all parameters, while FISH demonstrated relatively low concordance with the other methods for most markers except EGFR.
Tumor Heterogeneity as a Source of Assay Discordance
Spatial Heterogeneity and Sampling Limitations
Spatial heterogeneity represents a fundamental challenge for tumor molecular profiling. Different geographical regions of a tumor can evolve distinct genomic alterations due to selective pressures and genomic instability. A 2025 proteomic study of high-grade serous ovarian cancer (HGSC) demonstrated substantial anatomical site-to-site variation between ovarian tumors and omental metastases [64]. The research identified 1,651 proteins with stable expression within individuals but variable between individuals, highlighting how sampling different sites could yield different molecular portraits.
The impact of this spatial heterogeneity on assay concordance is particularly evident when comparing localized FISH analysis to broader NGS profiling. While FISH typically analyzes specific regions within a tissue section, NGS extracts DNA from a larger sample area, potentially capturing more comprehensive heterogeneity but averaging subclonal populations in the process.
Temporal Heterogeneity and Clonal Evolution
Temporal heterogeneity through clonal evolution represents another dimension of complexity. Single-cell DNA sequencing studies of core-binding factor acute myeloid leukemia (CBF AML) have revealed intricate clonal architectures and evolutionary trajectories under chemotherapy pressure [59]. One investigation analyzed samples from 8 patients at diagnosis, integrating bulk and single-cell DNA sequencing to reconstruct tumor phylogenies.
Clonal Evolution Under Therapy. This diagram illustrates how therapeutic pressure selects for resistant subclones that may be missed by single-timepoint sampling.
The research demonstrated that residual tumor clones persisted in complete remission samples for all patients analyzed, with these cells harboring various combinations of fusion genes and mutations [59]. In one patient, the dominant clone at diagnosis harboring FLT3 D835 mutations was eradicated by therapy, while the founding clone with RUNX1::RUNX1T1 fusion persisted and acquired new mutations at relapse [59]. This evolutionary process directly impacts assay concordance when samples are obtained at different timepoints, as the genomic landscape fundamentally changes under therapeutic pressure.
Methodological Considerations and Protocols
Experimental Workflows
FISH Protocol for SCAs in Neuroblastoma
The FISH methodology employed in the neuroblastoma comparison study followed established guidelines [6]:
- Sample Preparation: Paraffin-embedded tumor tissues were sectioned and pretreated with appropriate enzymes for antigen retrieval.
- Probe Hybridization: Commercial probes specific for 1p36/1q25 (ZytoLight SPEC), 11q22/CEP11 (Vysis LSI ATM), and 17q21/CEP17 (Vysis TOP2A) were applied to slides.
- Stringency Washes: Non-specific hybridization was removed through controlled wash conditions.
- Signal Detection: Fluorescent signals were quantified using fluorescence microscopy.
- Interpretation Criteria: Deletions were defined by probe ratio thresholds <0.67, while gains required ratios >1.3, following International Neuroblastoma Risk Group guidelines.
Targeted NGS Protocol for CNV Detection
The NGS methodology for copy number analysis involved [6]:
- DNA Extraction: Isolation of high-quality genomic DNA from tumor specimens.
- Library Preparation: Fragmentation, end-repair, adapter ligation, and PCR amplification using customized panels (CancerSCAN v2 or PedSCAN).
- Sequencing: Massively parallel sequencing on appropriate platforms to achieve sufficient coverage.
- Bioinformatic Analysis:
- Alignment to reference genome (e.g., hg19/GRCh37)
- Coverage calculation using tools like GATK DepthOfCoverage
- GC bias correction via LOESS regression
- Tumor purity estimation and log2 copy ratio adjustment
- Segmentation analysis to identify regions with significant copy number alterations
Targeted NGS CNV Analysis Workflow. This diagram outlines the key steps in processing samples for copy number variation detection using next-generation sequencing.
Single-Cell Resolution for Heterogeneity Analysis
Advanced single-cell DNA sequencing (scDNA-seq) protocols enable unprecedented resolution of clonal architecture [59]:
- Single-Cell Isolation: Tumor cells are dissociated and individually isolated using microfluidics or droplet-based platforms.
- Whole Genome Amplification: Genome-wide amplification of individual cells using methods like MALBAC or DOP-PCR.
- Library Preparation: Construction of sequencing libraries from amplified DNA with unique molecular identifiers.
- Targeted Sequencing: Deep sequencing of patient-specific panels covering somatic variants, copy number alterations, and fusion genes.
- Phylogenetic Reconstruction: Computational inference of evolutionary relationships between subclones using tools like COMPASS.
This approach allows researchers to resolve subclonal somatic copy number alterations (SCNAs) that are missed by conventional bulk sequencing, providing a more comprehensive picture of intra-tumor heterogeneity [59].
Research Reagent Solutions
Table 4: Essential Research Reagents and Platforms for Heterogeneity Studies
| Reagent/Platform | Function | Application Examples |
|---|---|---|
| ZytoLight FISH Probes | Locus-specific detection of chromosomal aberrations | Neuroblastoma (1p, 11q, 17q) [6] |
| CancerSCAN & PedSCAN | Hybridization capture-based NGS panels | Targeted sequencing of cancer-related genes [6] |
| COMPASS Algorithm | Phylogenetic tree inference from single-cell data | Reconstruction of clonal evolution in AML [59] |
| Ion PGM Dx System | Semiconductor-based NGS platform | Liquid biopsy analysis with molecular barcodes [65] |
| TaqMan dPCR Assays | Absolute quantification of rare variants | EGFR mutation detection in liquid biopsy [65] |
| Cytogenomics Software | Array CGH data analysis | CNV detection in clinical genetics [61] |
Clinical Implications and Future Directions
The discordance between FISH and NGS resulting from tumor heterogeneity has direct clinical ramifications. In neuroblastoma, the detection of subsegmental 17q gains by NGS that were missed by FISH could potentially impact risk stratification and treatment decisions [6]. Similarly, in glioma, the superior performance of NGS for detecting CDKN2A/B deletions and 1p/19q co-deletion directly affects diagnostic accuracy and therapeutic planning [5].
Emerging approaches to address these challenges include:
- Liquid Biopsy: Analysis of circulating tumor DNA (ctDNA) potentially captures heterogeneity across multiple tumor sites, overcoming spatial sampling limitations [60] [65].
- Single-Cell Genomics: Technologies like scDNA-seq provide unprecedented resolution of clonal architecture and rare subpopulations [59].
- Multiregion Sequencing: Sampling multiple tumor regions to better characterize spatial heterogeneity.
- Longitudinal Monitoring: Repeated sampling over time to track clonal evolution and therapy resistance.
The integration of these advanced approaches with traditional methodologies offers a path toward more comprehensive tumor profiling, ultimately enabling more precise and personalized cancer therapeutics. As these technologies evolve, standardization of analytical methods and interpretation criteria will be essential for translating complex genomic data into clinically actionable information.
Copy number variations (CNVs)—genomic regions exhibiting gains or losses—are crucial structural variants associated with cancer and genetic disorders. The detection and accurate interpretation of CNVs have evolved significantly with technological advancements. Fluorescence in situ hybridization (FISH) has traditionally been the cornerstone for CNV detection in clinical diagnostics, providing targeted analysis of specific chromosomal aberrations. However, next-generation sequencing (NGS) technologies have emerged as powerful alternatives, offering genome-wide coverage and higher throughput. Emerging research consistently demonstrates that while FISH and NGS show high consistency for some targets like EGFR, FISH demonstrates relatively low concordance with NGS and DNA methylation microarray (DMM) in detecting other parameters such as CDKN2A/B, 1p, 19q, and whole chromosomes [5]. Discordant cases are significantly associated with high-grade gliomas and genomic instability, highlighting the critical need for optimized bioinformatic approaches to CNV calling from NGS data [5]. This guide provides a comprehensive comparison of CNV calling algorithms and experimental frameworks for threshold refinement to enhance concordance between traditional and modern CNV detection methodologies.
Comparative Performance of CNV Calling Algorithms
Algorithm Classifications and Methodological Approaches
CNV detection tools utilize diverse computational strategies, which can be broadly categorized based on their primary signal detection mechanisms and analytical models. Read-depth (RD) methods operate on the principle that the number of sequencing reads aligning to a genomic region is proportional to its copy number. Split-read (SR) methods identify breakpoints at base-pair resolution by detecting reads that split across CNV boundaries. Read-pair (RP) methods rely on discordant insert sizes between paired-end reads to signal structural variations. Recent approaches like MSCNV integrate multiple strategies (RD, SR, RP) with machine learning models such as one-class support vector machines (OCSVM) to improve detection accuracy and breakpoint precision [66].
Table 1: Classification of CNV Calling Algorithms by Methodology and Application
| Algorithm | Primary Strategy | Statistical Model | Optimal Application | Key Features |
|---|---|---|---|---|
| InferCNV [67] | Gene Expression | Hidden Markov Model (HMM) | scRNA-seq data | Identifies subclones with same CNV profile |
| Numbat [67] | Expression + Allele Frequency | HMM | Large droplet-based scRNA-seq | Uses minor allele frequency information |
| MSCNV [66] | RD, SR, RP Integration | OCSVM Machine Learning | Whole-genome sequencing | Detects tandem/interpersed duplications |
| ichorCNA [68] | Read Depth | HMM | Low-coverage WGS (≥50% purity) | Optimized for ultra-low-pass sequencing |
| Control-FREEC [68] | Read Depth | GC correction + segmentation | Deep-coverage WGS/WES | Includes matched normal sample requirement |
| CNVkit [68] [69] | Read Depth | CBS segmentation | WES and WGS data | Adaptable for targeted sequencing |
| FACETS [69] | Allele-Specific | Fraction & allele-specific modeling | WGS, WES, targeted panels | Estimates tumor heterogeneity |
| HATCHet [69] | Joint Analysis | Multi-sample comparison | Multi-sample tumor analysis | Analyzes variants across tumor samples |
Performance Benchmarking Across Platforms
Independent benchmarking studies reveal significant performance variations among CNV callers across different sequencing platforms and experimental conditions. A comprehensive 2025 evaluation of six popular single-cell RNA-seq CNV callers discovered dataset-specific factors strongly influence performance, including dataset size, the number and type of CNVs in the sample, and reference dataset selection. Methods incorporating allelic information (CaSpER, Numbat) performed more robustly for large droplet-based datasets but required higher computational runtime [67].
For low-coverage whole-genome sequencing (lcWGS), a 2025 benchmarking study demonstrated that ichorCNA outperformed other tools in precision and runtime at high tumor purity (≥50%), making it the optimal choice for lcWGS-based workflows [68]. However, prolonged formalin-fixed paraffin-embedded (FFPE) fixation induced artifactual short-segment CNVs due to formalin-driven DNA fragmentation—a bias none of the evaluated tools could computationally correct, necessitating strict fixation time control or prioritization of fresh-frozen samples [68].
Table 2: Performance Metrics of CNV Callers Across Sequencing Platforms
| Algorithm | Sensitivity | Precision | F1-Score | Optimal Coverage | Platform | Tumor Purity Requirement |
|---|---|---|---|---|---|---|
| ichorCNA [68] | High | High | 0.89 | 0.1-10× | lcWGS | ≥50% |
| MSCNV [66] | 0.94 | 0.92 | 0.93 | 30-50× | WGS | Not specified |
| Control-FREEC [68] | Medium | Medium | 0.76 | 30-50× | WGS/WES | Matched normal |
| CNVkit [68] | Medium | Medium | 0.74 | 30-50× | WES/WGS | Adaptable |
| ACE [68] | Low | Medium | 0.65 | 0.1-10× | lcWGS | Not specified |
| ASCAT.sc [68] | Medium | Low | 0.61 | 0.1-10× | lcWGS/sc | Not specified |
Threshold Refinement for Enhanced CNV Detection
CNV Size Threshold Optimization
The establishment of optimal size thresholds represents a critical refinement parameter in CNV detection. Pan-cancer analyses reveal that CNVs exhibit "size-dependence" regarding their prognostic value across multiple cancer types. A 2024 study analyzing 565 meningiomas and 9,885 TCGA tumors demonstrated that chromosome-specific CNV size thresholds significantly improve risk-stratification models compared to uniform thresholds [70].
In meningioma, for example, the performance of established CNV-based risk models (integrated grade and integrated score) degraded significantly with varying CNV size thresholds. Integrated grade reached a maximum AUC for 5-year local freedom from recurrence of 0.78 at a uniform CNV threshold of 20% of the chromosome arm, compared to lower performance at higher or lower thresholds [70]. Similar size-dependence was observed across nine cancer types in TCGA, comprising approximately half of all samples analyzed, with focal areas of deletion or amplification on size-dependent CNVs [70].
CNV Co-occurrence Patterns
Beyond individual CNV detection, co-occurrence patterns of multiple CNVs provide additional prognostic information. Regularized Cox regression models using co-occurrent CNV pairs have identified specific combinations with clinical significance. In meningioma, 1p/22q and 9p/14q co-deletion emerged as important predictors of postoperative outcomes, remaining significant even when accounting for total CNV burden [70]. Similarly, in glioblastoma, concurrent 16q loss and 7p gain was associated with worse overall survival than these CNVs in isolation, while cervical squamous cell carcinoma showed prognostic significance for concurrent 13q gain and 19p loss, as well as 19p/21q co-deletion [70].
Experimental Protocols for Method Validation
Benchmarking Framework for scRNA-seq CNV Callers
A comprehensive benchmarking pipeline for scRNA-seq CNV callers evaluated six popular methods (InferCNV, copyKat, SCEVAN, CONICSmat, CaSpER, and Numbat) across 21 datasets comprising cancer cell lines and primary tumors [67]. The protocol included:
Dataset Preparation: 13 human cancer cell lines (gastric, colorectal, breast, melanoma), six human primary tumor samples (leukemia, basal cell carcinoma, multiple myeloma), one mouse primary tumor, and one human diploid dataset (PBMCs), representing both droplet-based and plate-based technologies.
Ground Truth Establishment: Orthogonal CNV measurements from single-cell or bulk whole-genome sequencing (WGS) or whole exome sequencing (WES) provided reference data.
Performance Metrics: Evaluation included threshold-independent metrics (correlation, area under the curve) and threshold-dependent metrics (F1 scores, sensitivity, specificity), with separate analysis for gain versus all and loss versus all.
Reference Dataset Impact Assessment: Testing different reference euploid datasets to evaluate normalization effects.
Euploid Detection Capability: Assessing method performance on completely euploid datasets (PBMCs) using mean square error deviation compared to diploid reference.
This benchmarking revealed that methods produced substantially different results depending on reference selection, with allelic-information methods showing more robust performance for large datasets but requiring greater computational resources [67].
FISH-NGS Concordance Testing Protocol
A systematic comparison of FISH, NGS, and DNA methylation microarray for CNV assessment in glioma employed this experimental protocol [5]:
Patient Cohort: 104 patients diagnosed with glioma with available tissue for all three platforms.
Targeted CNV Assessment: Six CNV-related diagnostic/prognostic parameters evaluated: EGFR, CDKN2A/B, 1p, 19q, chromosome 7, and chromosome 10.
FISH Protocol:
- Tissue sections (4-5μm) from formalin-fixed paraffin-embedded blocks
- Probe hybridization using standard protocols (ZytoLight SPEC 1p36/1q25, Vysis LSI ATM/CEP11, Vysis TOP2A/CEP17)
- Definition of deletions: 1p36/1q25 and 11q22/CEP11 ratio <0.67; gain: 17q21/CEP17 ratio >1.3
NGS Analysis:
- DNA extraction and library preparation using targeted panels
- Sequencing on Illumina platforms with minimum 100x coverage
- CNV calling using read-depth analysis with GC correction and segmentation
Concordance Assessment:
- Calculation of percentage agreement between platforms
- Statistical analysis of discordant cases association with clinical and pathological features
This study found high consistency for EGFR assessment across all three methods, but relatively low FISH concordance with NGS/DMM for other parameters, with discordant cases associated with high-grade tumors and genomic instability [5].
Visualization of CNV Detection Workflows
Multi-Strategy CNV Detection Framework
Figure 1: MSCNV Multi-Strategy CNV Detection Workflow. This framework integrates read depth, mapping quality, read pair, and split read signals with machine learning for comprehensive CNV detection [66].
Benchmarking Pipeline for scRNA-seq CNV Callers
Figure 2: scRNA-seq CNV Caller Benchmarking Pipeline. This systematic evaluation framework assesses multiple performance dimensions across diverse datasets [67].
Table 3: Essential Research Reagents and Computational Tools for CNV Analysis
| Resource Category | Specific Tool/Reagent | Function/Application | Key Considerations |
|---|---|---|---|
| Sequencing Platforms | Illumina NGS Systems | High-throughput DNA sequencing | Platform choice affects error profiles and coverage uniformity |
| Reference Materials | NA12878 (GIAB) | Benchmarking and validation | Highly characterized genome for method validation [71] [68] |
| CNV Calling Software | CNVkit, Control-FREEC, ichorCNA | Detection of copy number variations | Selection depends on sequencing platform and coverage [68] [69] |
| FISH Probes | ZytoLight SPEC 1p36/1q25, Vysis LSI ATM/CEP11 | Targeted CNV validation | Essential for orthologous confirmation of NGS findings [5] |
| Data Resources | TCGA, 1000 Genomes | Reference datasets and controls | Provide population-level CNV frequency data [70] [68] |
| Benchmarking Pipelines | benchmarkscrnaseqcnv_callers | Reproducible method evaluation | Snakemake pipeline for standardized comparisons [67] |
| Analysis Environments | R/Bioconductor, Python | Statistical analysis and visualization | Flexible environments for custom analytical workflows |
The evolving landscape of CNV detection emphasizes the continued importance of both traditional and emerging technologies. While FISH maintains relevance for targeted validation, NGS approaches offer comprehensive genome-wide analysis with increasingly refined bioinformatic interpretation. Critical considerations for optimal CNV detection include context-specific algorithm selection, tumor purity assessment, appropriate threshold refinement, and understanding platform-specific limitations. The integration of multiple computational approaches—rather than reliance on a single tool—provides the most robust framework for accurate CNV detection in both research and clinical applications [69]. Future directions will likely focus on standardized benchmarking, machine learning integration, and the development of consensus guidelines for multi-platform CNV interpretation in precision oncology.
The advancement of precision oncology is fundamentally reliant on high-quality molecular profiling data, making sample selection a critical first step in any genomic study. Formalin-fixed paraffin-embedded (FFPE) tissues represent the most widely available biospecimens in clinical practice due to their routine use in histopathological diagnosis and advantages in storage. However, the formalin fixation process introduces molecular artifacts that can compromise genomic analysis. Fresh-frozen (FF) or cryopreserved (CP) tissues and liquid biopsies present alternative sources with potential quality advantages. This guide objectively compares the performance of these sample types within the context of comprehensive genomic profiling, with a specific focus on concordance studies between fluorescence in situ hybridization (FISH) and next-generation sequencing (NGS).
Comparative Performance of Sample Types
DNA Quality and Sequencing Metrics
The quality of nucleic acids extracted from different sample types directly impacts downstream sequencing performance and data reliability.
Table 1: Pre-sequencing Quality Metrics Across Sample Types
| Quality Metric | FFPE Tissue | Fresh-Frozen (FF) / Cryopreserved (CP) Tissue | Liquid Biopsy (cfDNA) |
|---|---|---|---|
| DNA Concentration | 12.5 ng/µL [72] | 85.2 ng/µL [72] | Variable (dependent on tumor fraction) |
| DNA Integrity Number (DIN) | 4.7 [72] | 8.4 [72] | High for fragmented cfDNA |
| Average Fragment Size | 391-444 bp [73] [72] | 477-645 bp [73] [72] | ~167 bp (natural fragmentation) |
| Chimeric Read Percentage | 0.51% [73] | 0.26% [73] | Not applicable |
| Mapping Rate | 93.4% [73] | 94.1% [73] | Platform-dependent |
Table 2: Sequencing Performance and Variant Detection
| Sequencing Metric | FFPE Tissue | Fresh-Frozen (FF) / Cryopreserved (CP) Tissue | Liquid Biopsy (cfDNA) |
|---|---|---|---|
| Mean Read Depth | 34.6× [72] | 54.2× [72] | Typically high to detect low VAF |
| Tumor Mutation Burden | Artificially elevated (13.7 vs 6.4 mutations/Mb in paired CP) [72] | More accurate representation (6.4 mutations/Mb) [72] | Correlates with tissue TMB when tumor fraction sufficient |
| Variant Call Concordance | 43.5% overlap with paired CP [72] | Reference standard in comparisons [72] | 77.6% concordance with tissue for NCCN-recommended alterations [55] |
| Structural Variant Detection | Compromised [72] | Superior detection [72] | Limited to clones releasing ctDNA |
| Insertion/Deletion Burden | Significantly elevated [73] | Baseline level [73] | Baseline level with sufficient coverage |
Concordance with FISH for Specific Alterations
The comparison between NGS and FISH is particularly relevant for detecting specific genomic alterations like MET amplification in non-small cell lung cancer (NSCLC), where FISH has historically been the gold standard.
Table 3: NGS vs. FISH Concordance for MET Amplification Detection in NSCLC
| Performance Metric | Tissue NGS (vs. FISH) | Liquid Biopsy NGS (vs. Tissue FISH) |
|---|---|---|
| Overall Agreement | 90.7% for focal amplification [55] | Lower than tissue-based NGS [55] |
| Sensitivity | 66.7-85.7% [41] [55] | Reduced sensitivity for subclonal alterations |
| Specificity | 93.9-98.6% [41] [55] | High specificity when detected |
| Polysomy Detection | Challenging (31.6% sensitivity) [55] | Limited ability to distinguish |
| Optimal NGS Cutoff | MET GCN ≥5 reliably detects amplification [41] | Higher thresholds often required |
Experimental Protocols for Sample Processing
FFPE Sample Processing Protocol
The processing of FFPE samples for NGS requires careful attention to minimize artifacts introduced during fixation and embedding.
Nucleic Acid Extraction from FFPE Samples:
- Sectioning: Cut 4-20 µm sections using a microtome [74] [18]
- Deparaffinization: Use deparaffinization solution with incubation at 56°C for 3 minutes [74]
- Nucleic Acid Extraction: Employ specialized kits designed for FFPE tissues (e.g., AllPrep DNA/RNA FFPE Kit) [74]
- DNA Quantification: Use fluorometric methods (e.g., Qubit dsDNA BR Assay) [74]
- DNA Quality Assessment: Perform with FFPE-specific QC kits (e.g., Illumina FFPE QC kit; ΔCq ≤5 threshold) or bioanalyzer [74]
- RNA Quality Assessment: Determine DV200 value (>30% accepted) using Bioanalyzer [74]
Library Preparation Considerations:
- Input Material: 70 ng DNA and 80 ng RNA for hybrid-capture assays (e.g., Illumina TSO 500) [74]
- DNA Shearing: May be required (e.g., using Covaris ML 230 instrument) [74]
Fresh-Frozen/Cryopreserved Sample Protocol
Nucleic Acid Extraction from Frozen Tissues:
- Tissue Processing: Submerge tissue (~3.4 mm³) in RNAprotect Tissue Reagent and store at -80°C [74]
- Nucleic Acid Extraction: Use simultaneous DNA/RNA extraction kits (e.g., AllPrep DNA/RNA Micro kit) [74]
- DNA Quantification: Fluorometric methods (e.g., Qubit dsDNA BR Assay) [74]
- DNA Quality Assessment: Analyze with Bioanalyzer (average fragment size ≥4,500 bp acceptable) [74]
- RNA Quality Assessment: Determine DV200 value (>30% accepted) using Bioanalyzer [74]
Liquid Biopsy Processing Protocol
Cell-Free DNA Extraction:
- Blood Collection: Draw blood into specialized tubes (e.g., Streck Cell-Free DNA BCT)
- Plasma Separation: Two-step centrifugation (1,600-3,000 × g for 10-20 minutes, then 10,000-20,000 × g for 10-20 minutes)
- cfDNA Extraction: Use commercial cfDNA extraction kits (e.g., QIAamp Circulating Nucleic Acid Kit)
- Quantification: Use fluorometric methods sensitive to low concentrations
Visualizing Sample Processing Workflows and Decision Pathways
Sample Processing and Analysis Workflow
Sample Selection Decision Pathway
The Scientist's Toolkit: Essential Research Reagents
Table 4: Key Reagents and Kits for Sample Processing and Analysis
| Product Category | Specific Examples | Primary Function | Considerations |
|---|---|---|---|
| Nucleic Acid Extraction Kits | AllPrep DNA/RNA FFPE Kit [74], QIAamp DNA FFPE Tissue Kit [18], AllPrep DNA/RNA Micro Kit (for frozen) [74] | Simultaneous DNA/RNA extraction from limited samples | FFPE-specific kits include deparaffinization steps |
| DNA Quantification | Qubit dsDNA BR Assay [74], Qubit RNA HS Assay [74] | Accurate quantification of double-stranded DNA and RNA | Fluorometric methods preferred over spectrophotometry |
| DNA Quality Assessment | Illumina FFPE QC Kit [74], Agilent DNA 12000 Kit [74] | Determine DNA integrity and fragment size | ΔCq ≤5 threshold for FFPE DNA quality [74] |
| RNA Quality Assessment | Agilent RNA 6000 Nano Kit [74] | Determine RNA integrity (DV200 >30% acceptable) | Critical for fusion and expression analysis |
| NGS Library Preparation | Illumina TruSight Oncology 500 [74] [75], TruSeq Nano Library Prep Kit [72] | Target capture and library preparation for sequencing | Hybrid-capture requires higher input than amplicon-based |
| Automated Systems | Covaris ML 230 [74], Agilent 2100 Bioanalyzer [74] | DNA shearing and quality control | Standardization improves reproducibility |
The selection of sample type represents a critical methodological consideration in genomic studies, particularly those evaluating concordance between NGS and established techniques like FISH. FFPE tissues, while clinically abundant and convenient, demonstrate consistent limitations in DNA quality that elevate artifact burden and reduce variant call concordance. Fresh-frozen or cryopreserved tissues provide superior nucleic acid quality and represent the gold standard for comprehensive genomic analyses, including whole genome sequencing and structural variant detection. Liquid biopsies offer a complementary approach for longitudinal monitoring and assessing heterogeneity, though sensitivity limitations remain for subclonal alterations. Optimal study design often incorporates multiple sample types when feasible, leveraging their complementary strengths to maximize both clinical applicability and data quality.
The comparative analysis of Fluorescence In Situ Hybridization (FISH) and Next-Generation Sequencing (NGS) represents a critical frontier in diagnostic oncology and genetic research. As precision medicine demands increasingly accurate genomic profiling, understanding the concordance between these established and emerging technologies becomes paramount. FISH has long served as the gold standard for detecting copy number alterations and structural variants in clinical diagnostics, particularly in cancer genomics [7]. However, comprehensive NGS panels are now demonstrating remarkable capability in simultaneously identifying point mutations, copy number variations, and structural rearrangements in a single assay [4]. This technological evolution occurs alongside increasing automation in both methodologies, promising enhanced reproducibility while potentially reducing operational costs [76] [77]. Within this context, this guide objectively compares the performance of these platforms through published experimental data, focusing on their concordance across various clinical applications.
Quantitative Performance Comparison: FISH versus NGS
Extensive validation studies across multiple cancer types provide robust data on the diagnostic concordance between FISH and NGS methodologies. The tables below summarize key performance metrics from recent clinical studies.
Table 1: Overall Concordance Rates Between FISH and NGS Across Applications
| Cancer Type | Genomic Alteration | Concordance Rate | Sensitivity | Specificity | Study |
|---|---|---|---|---|---|
| Chronic Lymphocytic Leukemia | del(17p) | >95% | >86% | >95% | [7] |
| Chronic Lymphocytic Leukemia | del(11q) | >95% | >86% | >95% | [7] |
| Chronic Lymphocytic Leukemia | trisomy 12 | >95% | >86% | >95% | [7] |
| Chronic Lymphocytic Leukemia | del(13q) | >95% | >86% | >95% | [7] |
| Breast Cancer | HER2 amplification | 98% | 95% | 97% | [76] |
| Gastric Cancer | HER2 amplification | 100% | 100% | 100% | [76] |
| NSCLC | MET amplification | 91% | 97% | 89% | [2] |
| Gliomas | EGFR assessment | High consistency | N/A | N/A | [5] |
Table 2: Advanced NSCLC Biomarker Detection via NGS in Tissue
| Biomarker | Alteration Type | NGS Sensitivity | NGS Specificity | Reference Standard |
|---|---|---|---|---|
| EGFR | Mutation | 93% | 97% | PCR-based methods |
| ALK | Rearrangement | 99% | 98% | FISH/IHC |
| BRAF V600E | Mutation | 80% | 99% | PCR-based methods |
| KRAS G12C | Mutation | 80% | 99% | PCR-based methods |
| HER2 | Mutation | 80% | 99% | PCR-based methods |
The high concordance rates demonstrated across studies support NGS as a viable alternative to FISH for detecting copy number alterations in clinical practice [7] [4]. However, the performance varies depending on the specific genomic alteration and disease context, highlighting the importance of context-specific validation.
Experimental Protocols and Methodologies
FISH Automation Protocol
Recent advances have enabled the automation of traditionally manual FISH protocols. The following methodology was validated for HER2 testing in breast and gastro-oesophageal carcinomas:
- Platform: Leica BOND-III automated staining platform
- Comparator: Manual FISH (Agilent HER2 IQFISH pharmDx)
- Sample Set: 77 breast cancer cases and 8 gastric cancer cases
- Validation Metrics: Sensitivity, specificity, and concordance with manual method
- Hands-on Time: Significantly decreased technical hands-on time
- Cost Analysis: Reduced overall supply costs for the laboratory [76]
The automated platform maintained high sensitivity (95% for breast cancer, 100% for gastric cancer) and specificity (97% for breast cancer, 100% for gastric cancer) while improving standardization across operators and runs [76].
Targeted NGS for CNA Detection
A robust protocol for detecting chronic lymphocytic leukemia (CLL) copy number alterations via targeted sequencing:
- Sample Preparation: DNA extracted from peripheral blood mononuclear cells (PBMC) with tumor purity ≥80%, or CD5+/CD19+ magnetic bead enrichment for lower purity samples
- Sequencing Panel: Custom-designed panel covering exons of 59 recurrently mutated genes in CLL plus additional amplicons across regions affected by clinically relevant CNAs
- Sequencing Parameters: Median coverage depth of 1799× per sample, enabling detection of variants with allelic fraction as low as 1%
- CNA Calling: PatternCNV algorithm with coverage standardization across samples, principal component analysis for batch effect correction, and quality control using median absolute deviation (samples with DiffMAD >0.3 excluded)
- Validation: Blinded comparison to FISH results as gold standard [7]
Bioinformatically Expanded NGS for MET Amplification
A specialized approach for detecting MET amplifications in solid tumors:
- Platform: MSK-IMPACT hybridization-capture-based NGS
- Methodology: Two independent copy number determination methods:
- Read-depth approach: Determines copy number based on target region read-depth normalized to GC content and compared to normal control
- Allele-specific copy number: Uses FACETS algorithm employing matched patient normal control
- Analysis Incorporation: Read depth and focality analyses to address tumor heterogeneity
- Thresholds: Copy number changes expressed as fold change (fc) with amplification defined as fc ≥2.0, and CNG/borderline as fc ≥1.5 but <2, with p-values <0.05 considered significant [2]
Visualizing Technological Workflows
The diagram below illustrates the key methodological workflows for both FISH and NGS approaches in detecting genomic alterations, highlighting points of automation and standardization.
Figure 1. Comparative Workflows of FISH and NGS Technologies. The diagram highlights automated steps in green, demonstrating opportunities for standardization in both methodologies. The FISH pathway shows the integration of automated staining platforms, while the NGS pathway features automated bioinformatic analysis as key standardization points.
The Scientist's Toolkit: Essential Research Reagents and Platforms
Table 3: Key Research Reagent Solutions for FISH and NGS Applications
| Reagent/Platform | Function | Application Context |
|---|---|---|
| Leica BOND-III | Automated staining platform | FISH automation for HER2 testing in breast and gastric cancers |
| Agilent HER2 IQFISH pharmDx | HER2-specific FISH probes | Manual FISH testing for HER2 amplification status |
| MSK-IMPACT | Hybridization-capture based NGS panel | Targeted sequencing of 341-505 genes for solid tumor profiling |
| PatternCNV | CNV-calling algorithm | Detection of copy number alterations from targeted sequencing data |
| FACETS Algorithm | Allele-specific copy number estimation | Tumor purity-adjusted integer copy number analysis from NGS data |
| TrueProbes | Probe design software platform | Computational design of high-specificity FISH probes |
| Sterivex-GP Cartridge Filters | 0.45μm filtration | Environmental DNA collection from seawater for ecological studies |
Discussion: Clinical Implications and Economic Considerations
The accumulating evidence demonstrates strong concordance between FISH and NGS methodologies across various clinical applications, supporting the integration of NGS into diagnostic pathways. The automation of FISH processes addresses traditional limitations of inter-operator variability and technical hands-on time while maintaining diagnostic accuracy [76]. Concurrently, expanded NGS applications demonstrate capacity not only for mutation detection but also for reliable copy number alteration assessment, enabling more comprehensive genomic profiling from limited specimen material [2] [7].
The economic considerations of implementing these technologies extend beyond simple reagent costs. While targeted sequencing approaches offer a cost-effective alternative to multiple single-gene tests [7], the comprehensive nature of NGS may reduce overall diagnostic costs by consolidating multiple biomarker assessments into a single assay. Furthermore, automation in both platforms demonstrates potential for significant operational cost savings through reduced technical hands-on time and improved workflow efficiency [76] [77].
For clinical implementation, the choice between methodologies should consider specific clinical contexts. While NGS shows superior performance in capturing overall amplification status in heterogeneous tumors and defining amplification focality [2], automated FISH retains value in specific scenarios requiring rapid turnaround for single biomarkers or when tissue constraints limit comprehensive sequencing approaches.
Validation Frameworks and Comparative Diagnostic Performance
The evolution of precision oncology hinges on the accurate detection of genomic alterations that inform targeted therapy and prognostic stratification. For years, fluorescence in situ hybridization (FISH) has served as a gold standard technique for identifying copy number alterations and gene rearrangements in various cancers. However, the emergence of next-generation sequencing (NGS) technologies has introduced a paradigm shift in molecular diagnostics, enabling comprehensive genomic profiling from limited tissue samples. This guide objectively compares the performance of these two methodologies through analytical validation metrics, focusing on sensitivity, specificity, and concordance across multiple cancer types. The transition from FISH to NGS represents not merely a technological upgrade but a fundamental change in diagnostic approach, with significant implications for clinical research and therapeutic development. Understanding the concordance between these platforms is essential for researchers and drug development professionals seeking to implement robust genomic profiling strategies in their workflows.
Methodological Approaches in Comparative Studies
Experimental Designs for Concordance Assessment
Comparative studies evaluating FISH and NGS methodologies employ rigorous experimental designs to ensure statistically meaningful results. Typically, these investigations utilize retrospective cohorts with archived formalin-fixed, paraffin-embedded (FFPE) tissue specimens from well-characterized patient populations. For instance, a study assessing HER2 testing in uterine serous carcinoma collected IHC and FISH results from 152 patients and compared them with matched NGS data from commercial platforms and whole exome sequencing (WES) [9]. Similarly, a chronic lymphocytic leukemia (CLL) investigation sequenced DNA from 509 individuals with CLL or monoclonal B-cell lymphocytosis using a targeted panel and compared results with existing FISH data [78].
The analytical validation process requires meticulous attention to tissue quality controls. Studies typically extract DNA from FFPE tumor tissues using specialized kits, with quantification performed using fluorometric methods. For sequencing approaches, the DNA mass requirement varies but generally exceeds 20ng, with fragment sizes above 500bp considered suitable for library preparation [18]. Tumor purity assessment is critical, with some studies employing magnetic bead enrichment for specific cell populations when tumor purity falls below 80% [78].
Bioinformatics Pipelines for Variant Calling
The analytical performance of NGS platforms depends significantly on the bioinformatics pipelines employed for variant calling. In comparative studies, these pipelines typically include read mapping against reference genomes, quality control metrics, variant calling, and functional annotation. For copy number alteration detection in CLL, the PatternCNV algorithm provides CNV estimates based on coverage and variability patterns, standardizing coverage across samples and smoothing multiple bins within exons to generate maximum likelihood estimations [78].
Tumor mutation burden calculation requires specialized bioinformatic approaches. The PGDx elio tissue complete assay, for instance, assesses candidate single-nucleotide variants and insertions/deletions through an automated pipeline, excluding variants that don't meet acceptance criteria [8]. Common germline variants annotated in dbSNP and Exome Aggregation Consortium databases are removed, while synonymous and nonsynonymous sequence variants at >5% variant allele frequency are included, with common drivers removed from TMB consideration [8].
Table 1: Key Experimental Parameters in Comparative Studies
| Cancer Type | Sample Size | FISH Targets | NGS Approach | Quality Control Measures |
|---|---|---|---|---|
| Uterine Serous Carcinoma [9] | 152 patients | HER2 | Commercial NGS panel (Foundation Medicine) & Whole Exome Sequencing | Testing performed on same tissue block for improved correlation |
| Gliomas [5] | 104 patients | EGFR, CDKN2A/B, 1p, 19q, chromosome 7, 10 | Targeted NGS & DNA Methylation Microarray | Comparison of three methods for CNV detection |
| Chronic Lymphocytic Leukemia [78] | 509 patients | del(17p), del(11q), del(13q), trisomy 12 | Targeted sequencing (59 genes) | DiffMAD score <0.3 for quality assurance; tumor purity assessment |
| Non-Small Cell Lung Cancer [18] | 107 cases | ALK, ROS1 | Integrated NGS platform (10 genes) | DNA quantity >20ng; A260/280 ratio 1.9-2.0 for RNA |
Concordance Metrics Across Cancer Types
Solid Tumors: Uterine Serous Carcinoma and NSCLC
In uterine serous carcinoma, the correlation between HER2 status determined by IHC/FISH and NGS ranges between 80-85%, with improved concordance observed when testing is performed on the same tissue block [9]. The overall correlation was 81% (p<0.001) between IHC/FISH and commercial NGS platforms, improving to 85% (p<0.001) when performed on the same pathology tissue block. Whole exome sequencing demonstrated similar overall correlation at 82% (p<0.001) but captured 11 additional patients not identified by IHC/FISH, suggesting enhanced sensitivity for detecting HER2 treatment-eligible patients [9].
For non-small cell lung cancer, integrated NGS platforms demonstrate particular value in detecting gene rearrangements and mutations with reduced experimental time and tissue requirements compared to multiple IHC staining experiments [18]. NGS increased the positive rate of ALK rearrangement and decreased false positive results of ROS1 rearrangements detected by IHC staining alone. The technology proved especially valuable for EGFR gene alteration assessment, particularly in exon 19 regions where it provided more informative and reliable results than IHC [18].
Hematologic Malignancies and Central Nervous System Tumors
In chronic lymphocytic leukemia, targeted sequencing shows high accuracy for detecting clinically relevant copy number alterations compared to FISH. Using FISH as the gold standard, targeted sequencing demonstrated >95% specificity, >86% sensitivity, >90% positive predictive value, and >84% negative predictive value across clinically relevant CNAs including del(17p), del(11q), del(13q), and trisomy 12 [78]. The sequencing approach additionally identified other CLL-associated CNAs like del(6q), del(14q), and gain 8q, along with complex karyotypes in 26 patients.
For glioma diagnostics, all three methods (FISH, NGS, and DNA methylation microarray) show high consistency in EGFR assessment, but FISH demonstrates relatively low concordance with NGS/DMM in detecting other parameters like CDKN2A/B, 1p, 19q, chromosome 7, and chromosome 10 [5]. In contrast, NGS and DMM exhibit strong concordance across all six parameters evaluated. Discordant cases associate with high-grade gliomas and high fractions of genome altered, indicating heightened malignancy and genomic instability in these cases [5].
Table 2: Concordance Metrics Across Cancer Types
| Cancer Type | Concordance Rate | Sensitivity | Specificity | Additional Findings |
|---|---|---|---|---|
| Uterine Serous Carcinoma [9] | 81-85% | NGS: Identified 1 additional patientWES: Identified 11 additional patients | Not specified | Improved correlation with same-tissue block testing |
| Chronic Lymphocytic Leukemia [78] | Not specified | >86% | >95% | PPV >90%; NPV >84% |
| Multiple Myeloma [79] | >93% balanced accuracy | Not specified | Not specified | Robust inter-laboratory validation |
| Glioma [5] | High for EGFR; variable for other markers | Not specified | Not specified | Discordance associated with high-grade tumors |
Technical Considerations and Limitations
Analytical Sensitivity and Tumor Content Requirements
The comparative performance of FISH and NGS is influenced by several technical factors, including tumor content requirements and analytical sensitivity thresholds. FISH assays typically require a lower percentage of tumor cells (often 20-30%) compared to sequencing approaches, which may need higher tumor purity for reliable mutation detection, particularly for subclonal alterations. In the CLL study, when tumor purity was below 80%, researchers employed CD5+/CD19+ magnetic bead enrichment to ensure adequate detection sensitivity [78].
The minimum variant allele frequency detection threshold varies significantly between platforms. Targeted sequencing approaches in CLL achieved a median coverage depth of 1799×, with 83% of samples having median depth >1000×, enabling detection of mutations with variant allelic fraction as low as 1% [78]. This sensitivity exceeds that of conventional FISH, particularly for emerging resistant subclones that may impact treatment outcomes but are present below the detection threshold of traditional methodologies.
Comprehensive Genomic Profiling Beyond FISH Targets
A significant advantage of NGS approaches lies in their ability to detect genomic alterations beyond traditional FISH targets. In CLL, targeted sequencing identified not only the clinically relevant FISH abnormalities but also additional CNAs like del(6q), del(14q), and gain 8q, along with complex karyotypes defined as ≥3 chromosomal abnormalities [78]. Similarly, in NSCLC, integrated NGS platforms simultaneously assessed EGFR mutations, ALK rearrangement, ROS1 rearrangement, and alterations in nine other lung cancer-related genes from a single platform [18].
The comprehensive nature of NGS also facilitates novel biomarker discovery, such as tumor mutation burden assessment, which functions as a composite genomic score predicting response to immune checkpoint inhibition [8]. Microsatellite instability status, another emerging biomarker, can be determined through NGS by evaluating the observed length of homopolymer tracts across regions of interest in combination with mutational signatures [8].
Research Reagent Solutions
Table 3: Essential Research Materials for FISH-NGS Concordance Studies
| Reagent/Platform | Manufacturer | Primary Function | Application Context |
|---|---|---|---|
| FoundationOne Test | Foundation Medicine | Comprehensive genomic profiling | Commercial NGS platform for solid tumors [9] [8] |
| PGDx elio tissue complete | Personal Genome Diagnostics | Comprehensive DNA-to-report kitted assay | Decentralized NGS solution for local laboratories [8] |
| QIAamp DNA FFPE Tissue Kit | Qiagen | DNA extraction from archived tissues | Nucleic acid isolation for downstream sequencing [18] |
| PATHWAY anti-HER2/neu (4B5) | Ventana Medical Systems | HER2 protein detection | IHC assessment for HER2 status [80] |
| Ariol Imaging System | Applied Imaging | Automated image analysis | Quantitative assessment of IHC staining [80] |
| OncoAim Lung Cancer Targeting Gene Detection Kit | Singlera Genomics | Targeted NGS for lung cancer | Integrated mutation and rearrangement detection [18] |
The concordance between FISH and NGS technologies ranges from 80% to over 95% across various cancer types, with the highest agreement observed for specific genetic alterations like HER2 in uterine serous carcinoma and clinically relevant CNAs in chronic lymphocytic leukemia. While FISH remains a valuable technique with lower tumor content requirements, NGS offers comprehensive genomic profiling, detection of novel biomarkers, and simultaneous assessment of multiple alteration types from limited tissue material. The methodological considerations outlined in this guide, including experimental design, bioinformatic pipelines, and technical limitations, provide researchers and drug development professionals with a framework for selecting appropriate genomic assessment strategies based on their specific research objectives and clinical contexts.
Inter-laboratory Reproducibility and Quality Assurance Programs
In the evolving landscape of molecular diagnostics, inter-laboratory reproducibility represents a fundamental requirement for reliable genomic testing. As precision oncology increasingly guides therapeutic decisions, the consistency of results across different testing platforms and laboratories becomes paramount for both patient care and drug development. This guide objectively compares the performance of Fluorescence In Situ Hybridization (FISH) and Next-Generation Sequencing (NGS) methodologies within the context of concordance research, examining how quality assurance programs address variability in testing environments. While FISH maintains a established role in clinical diagnostics, emerging data reveals that NGS approaches demonstrate superior reproducibility for comprehensive genomic profiling, particularly for complex alterations such as gene fusions. The integration of these technologies, supported by robust quality metrics, provides the foundation for reliable inter-laboratory results in both research and clinical settings.
Methodological Comparison: FISH versus NGS Platforms
Fundamental Technical Principles
FISH Methodology: FISH operates on the principle of hybridizing fluorescently-labeled DNA probes to complementary target sequences within chromosomes or interphase nuclei. The technique utilizes several probe types: locus-specific probes for detecting gene rearrangements, centromeric probes for identifying aneuploidy, and whole chromosome paints for visualizing complex rearrangements. Detection relies on fluorescence microscopy and manual or semi-automated signal enumeration [81].
NGS Methodology: NGS employs massively parallel sequencing of fragmented DNA or RNA molecules. Targeted hybrid capture-based approaches (used by FoundationOneRNA and similar assays) enrich for specific genomic regions of interest, while anchored multiplex PCR (used in Archer FusionPlex assays) enables amplification of fusion transcripts with unknown partners. The process involves library preparation, cluster generation, sequencing-by-synthesis, and sophisticated bioinformatic analysis for variant calling [82] [83].
Experimental Protocols for Validation Studies
Comprehensive NGS Validation Protocol (Based on FoundationOneRNA Assay):
- Sample Requirements: 500ng RNA input for accuracy/precision studies; 300ng for limit of detection studies
- Quality Control: cDNA quality check via qPCR (PreSeq QC) prior to library construction
- Library Preparation: Hybrid capture-based enrichment targeting 318 fusion genes and 1,521 gene expression markers
- Sequencing: Illumina platform with process match controls
- Analysis: Bioinformatic pipeline with minimum coverage requirements and quality metrics
- Validation Parameters: Accuracy (vs. orthogonal methods), reproducibility (inter/intra-run), limit of detection (using diluted cell lines) [83]
FISH Validation Protocol (Per CAP/ASCO Guidelines):
- Sample Preparation: Fixed cells on microscopic slides with tumor enrichment
- Probe Hybridization: Denaturation of probe and target DNA followed by hybridization
- Signal Detection: Fluorescence microscopy with filter sets for different fluorophores
- Enumeration: Manual counting of signals in interphase nuclei by trained technologists
- Validation Parameters: Analytic sensitivity/specificity, normal cutoff establishment, precision through repeated measurements [84] [85]
Comparative Performance Data
Analytical Performance Metrics
Table 1: Comparative Analytical Performance of FISH and NGS Methodologies
| Performance Parameter | FISH Performance | NGS Performance | Comparative Significance |
|---|---|---|---|
| Inter-laboratory Concordance | 76-95.2% [86] [84] | 95-100% [86] [83] | NGS demonstrates superior reproducibility between laboratories |
| Positive Percent Agreement (PPA) | Varies by target and methodology | 98.28% for fusion detection [83] | Targeted NGS shows consistently high sensitivity |
| Negative Percent Agreement (NPA) | Dependent on operator experience | 99.89% for fusion detection [83] | NGS demonstrates exceptional specificity |
| Reproducibility (Precision) | 100% for well-validated assays [85] | 100% for target fusions [83] | Both methods can achieve perfect reproducibility when standardized |
| Limit of Detection | ~5-10% tumor cell fraction [81] | 1.5ng RNA input; 0.5% variant allele frequency [83] | NGS offers superior sensitivity for low-frequency alterations |
Detection Capabilities by Alteration Type
Table 2: Detection Capabilities Across Genomic Alteration Types
| Alteration Type | FISH Detection | NGS Detection | Clinical Implications |
|---|---|---|---|
| Gene Fusions | Limited to known partners with specific probes | Comprehensive detection of known and novel partners [82] | NGS identifies more therapeutically actionable fusions |
| Copy Number Alterations | Limited resolution for small changes | Precise quantification of amplifications/deletions [87] | NGS provides more accurate assessment of CNAs |
| Single Nucleotide Variants | Not detectable | Comprehensive detection across gene panels [8] | NGS enables broad mutation profiling |
| Insertions/Deletions | Not detectable | High sensitivity detection down to 1.5% VAF [8] | NGS identifies clinically relevant indels missed by FISH |
| Structural Variants | Detects large rearrangements | Comprehensive detection of various SVs [87] | Both methods have utility for SV detection |
Quality Assurance and Standardization Approaches
Quality Control Metrics
NGS Quality Metrics:
- Sample QC: RNA integrity number (RIN), cDNA quality via qPCR, DNA concentration
- Sequencing QC: Minimum coverage depth (typically >500x), uniformity of coverage, duplication rates
- Variant Calling QC: Minimum supporting reads, strand bias assessment, mapping quality [82] [83]
FISH Quality Metrics:
- Sample QC: Tumor cell percentage, specimen fixation quality, nuclei morphology
- Hybridization QC: Signal intensity, background fluorescence, probe efficiency
- Enumeration QC: Cell selection criteria, minimum cell count, signal interpretation criteria [84] [88]
Automation and Standardization
FISH Automation Status (Survey of 38 Laboratories):
- Automated sample processing: 42.1%
- Automated spot counting: 28.9%
- Automated probe denaturation/hybridization: 26.3%
- Automated image acquisition: 15.8%
- Automated report generation: 13.2% [88]
NGS Automation: NGS workflows benefit from higher levels of automation throughout library preparation, sequencing, and data analysis. Integrated platforms enable standardized processing with minimal manual intervention, contributing to improved inter-laboratory reproducibility [8].
Integrated Testing Workflows
Diagram 1: Integrated Genomic Testing Workflow. This workflow demonstrates how FISH and NGS technologies can be complementary in clinical practice, with reflex testing patterns and orthogonal confirmation pathways to ensure result accuracy.
The Scientist's Toolkit: Essential Research Reagents
Table 3: Essential Research Reagents for Genomic Analysis
| Reagent/Category | Specific Examples | Function/Application |
|---|---|---|
| Nucleic Acid Extraction | Qiagen AllPrep DNA/RNA FFPE Kit, RNeasy Kits | Co-extraction of DNA and RNA from challenging FFPE samples [82] [83] |
| FISH Probes | Dual-probe HER2 IQFISH, IGH/BCL2 fusion probes | Target-specific detection of chromosomal rearrangements [84] [85] |
| NGS Library Prep | Archer FusionPlex, FoundationOneRNA, PGDx elio | Target enrichment for comprehensive genomic profiling [82] [8] [83] |
| Quality Control Assays | Qubit Fluorometric Quantification, Agilent Bioanalyzer | Assessment of nucleic acid quantity and quality pre-sequencing [82] [87] |
| Automation Systems | QIAsymphony SP/AS, automated FISH processors | Standardization of sample processing across laboratories [87] [88] |
Concordance Analysis in Pediatric ALL: A Case Study
Recent comprehensive benchmarking in pediatric Acute Lymphoblastic Leukemia (pALL) reveals the complementary value of multiple technologies:
Diagram 2: Multi-technology Integration in Pediatric ALL. This case study demonstrates how emerging technologies complement traditional methods to resolve diagnostic challenges and improve detection rates.
- Detection Rates: The combination of dMLPA and RNA-seq detected clinically relevant alterations in 95% of pALL cases, compared to 46.7% with standard FISH and karyotyping [87]
- Fusion Identification: OGM as a standalone test detected 56.7% of gene fusions compared to 30% with FISH (p = 0.0057) [87]
- Complex Alterations: RNA-seq uniquely identified IGH rearrangements undetected by other methods, while resolving 15% of non-informative cases [87]
The evolving landscape of inter-laboratory reproducibility emphasizes integrated approaches that leverage the respective strengths of FISH and NGS technologies. While FISH maintains advantages for rapid assessment of known alterations and tissue context preservation, NGS platforms demonstrate superior comprehensive detection capabilities and reproducibility across laboratories. Quality assurance programs must evolve to address the unique challenges of each technology, with particular emphasis on automation standardization for FISH and bioinformatic pipeline validation for NGS. Future directions will likely see increased adoption of multi-modal integration, where orthogonal technologies validate and complement each other, providing comprehensive genomic characterization with the reproducibility required for both drug development and clinical application.
In the field of genomic research and clinical diagnostics, fluorescence in situ hybridization (FISH), DNA microarrays, and next-generation sequencing (NGS) have emerged as foundational technologies for detecting genetic variation. While each platform possesses distinct strengths and limitations, their integrated use provides a powerful approach for comprehensive genomic analysis. FISH has long served as the gold standard for visualizing specific chromosomal abnormalities in clinical practice, offering high-resolution spatial context within tissues and cells [89]. DNA microarrays deliver cost-effective, genome-wide capability for detecting copy number variations (CNVs) and are well-established in research and clinical cytogenetics [90] [91]. NGS technologies offer the most comprehensive solution, enabling simultaneous detection of multiple variant types—including single nucleotide variants, insertions/deletions, CNVs, and translocations—from a single assay [78] [8]. This guide objectively compares the technical performance, applications, and experimental considerations for these platforms, providing researchers with data-driven insights for selecting and integrating appropriate methodologies for specific research goals.
Platform Performance: Quantitative Comparison
Extensive comparative studies have quantified the performance characteristics of FISH, microarrays, and NGS across various applications and genomic contexts. The tables below summarize key performance metrics based on recent empirical evidence.
Table 1: Analytical Performance Comparison Across Platforms
| Performance Metric | FISH | Microarrays | NGS |
|---|---|---|---|
| SNV/Indel Detection | Not Applicable | Limited (dependent on design) | Excellent (>95% PPA for SNVs/indels) [8] |
| CNV Detection Sensitivity | >80% for targeted loci [5] | Varies by design (40bp-8Mbp range) [91] | 80-83% PPA [8] |
| Translocation Detection | Excellent for known targets | Limited | 80-83% PPA [8] |
| Spatial Resolution | Single-cell/subcellular [89] | Bulk sample | Bulk sample (single-cell with specialized approaches) |
| Limit of Detection | Low cell-to-cell heterogeneity | Varies by probe density & design [92] | ~1% VAF (varies by coverage) [78] |
| Multiplexing Capacity | Limited (~4-6 targets conventionally) [78] | High (up to millions of probes) [90] | Very High (hundreds to thousands of genes) [8] |
Table 2: Operational and Practical Considerations
| Characteristic | FISH | Microarrays | NGS |
|---|---|---|---|
| Turnaround Time | 1-2 days | 2-3 days | 4-5 days for in-house; longer for send-outs [8] |
| Sample Throughput | Moderate | High | Moderate to High |
| Cost Per Sample | Low to Moderate | Moderate | High (decreasing) |
| Required Sample Input | Tissue sections, cells | 50-250ng DNA [91] | 10-100ng DNA (varies by protocol) [8] |
| Data Complexity | Low (manual interpretation) | Moderate | High (requires bioinformatics) |
| Discoverability Capability | None (hypothesis-driven) | Limited to designed content | Excellent (open system) [93] |
Concordance Analysis: Experimental Evidence
Glioma Diagnostic Marker Study
A retrospective cohort study of 104 glioma patients systematically compared FISH, NGS, and DNA methylation microarrays (DMM) for detecting six CNV-related diagnostic parameters: EGFR, CDKN2A/B, 1p, 19q, chromosome 7, and chromosome 10 [5]. All three methods demonstrated high consistency in EGFR assessment, but FISH showed relatively low concordance with NGS and DMM for other parameters. In contrast, NGS and DMM exhibited strong concordance across all six parameters. The discordant cases were associated with high-grade gliomas and high fractions of genome alteration, indicating that technological discrepancies are most pronounced in genomically unstable tumors [5].
Experimental Protocol: The study used formalin-fixed paraffin-embedded tumor samples. FISH was performed using standard clinical protocols with locus-specific probes. NGS was conducted using targeted sequencing panels covering the relevant regions. DNA methylation profiling was performed using Infinium MethylationEPIC BeadChip arrays. Concordance was calculated using FISH as the reference standard, with sensitivity, specificity, positive predictive value, and negative predictive value as primary metrics [5].
Chronic Lymphocytic Leukemia (CLL) Analysis
A comprehensive evaluation of 509 CLL and monoclonal B-cell lymphocytosis patients compared targeted NGS with FISH for detecting clinically relevant CNAs [78]. Using a custom targeted sequencing panel covering 59 recurrently mutated genes and additional amplicons across regions affected by clinically relevant CNAs, researchers achieved specificity >95%, sensitivity >86%, positive predictive value >90%, and negative predictive value >84% across all clinically relevant CNAs compared to FISH.
Experimental Protocol: DNA was extracted from peripheral blood mononuclear cells with tumor purity ≥80% or enriched using CD5+/CD19+ magnetic beads for lower purity samples. The targeted sequencing panel was designed with additional amplicons across regions affected by del(17p), del(11q), del(13q), and trisomy 12. CNVs were called using the PatternCNV algorithm, which divides each exon into bins where coverage is standardized across samples. Quality control excluded samples with DiffMAD scores >0.3. FISH assays were performed in clinical laboratories as standard of care [78].
Microarray Platform Performance Benchmarking
A systematic comparison of 17 microarray platforms from Affymetrix, Agilent, and Illumina quantified CNV detection capabilities using the well-characterized NA12878 genome [91]. Performance varied significantly based on array design principles rather than simply probe number. Arrays combining genome-wide backbones with targeted coverage of exonic or known CNV regions detected more valid CNVs than evenly spaced designs. The number of validated CNVs ranged from 4 to 489 across platforms, with Agilent's 2×400K-CNV array detecting the most validated CNVs using Nexus analysis software.
Experimental Protocol: DNA from NA12878 was hybridized to each array in two technical replicates. Raw data was analyzed using both manufacturer-specific software and the platform-agnostic Nexus software. CNV calls were validated against a gold standard set derived from 1000 Genomes Project whole-genome sequencing data. A CNV was considered valid if it overlapped a single gold standard CNV by ≥50% reciprocally in size, or if there existed a set of gold standard CNVs with ≥50% reciprocal overlap [91].
Integrated Workflow Strategies
Multi-platform Integration Framework
The complementary strengths of FISH, microarrays, and NGS create powerful synergies when integrated into coordinated analysis workflows. The following diagram illustrates a strategic framework for multi-platform integration:
Sequential Validation Workflow
For clinical applications requiring high confidence in specific genomic findings, a sequential validation workflow ensures result reliability:
Research Reagent Solutions
Table 3: Essential Research Reagents and Platforms
| Category | Specific Examples | Function & Application |
|---|---|---|
| FISH Probes | Locus-specific probes (EGFR, CDKN2A), chromosome painting probes | Targeted detection of specific genomic loci or chromosomal regions in situ [5] |
| Microarray Platforms | Agilent SurePrint G3, Illumina Infinium, Affymetrix Cytoscan | Genome-wide CNV detection with varying resolution and content [91] |
| NGS Panels | FoundationOne CDx, PGDx elio tissue complete, Custom targeted panels | Comprehensive mutation profiling across hundreds of cancer genes [8] |
| CNV Calling Algorithms | PatternCNV (for targeted NGS), CNVnator (for WGS), Nexus Copy Number | Bioinformatics tools for detecting copy number alterations from sequencing or array data [78] [91] |
| Multiplex FISH Technologies | ARTseq-FISH, CODEX, ImmunoSABER | Simultaneous detection of multiple RNA and protein targets in tissue contexts [89] |
Technical Considerations for Experimental Design
Microarray Probe Design Impact
Microarray performance is critically dependent on probe design principles, which significantly impact CNV detection accuracy and resolution [92]. Optimal probe design must balance several factors: probes must target loci specifically without cross-hybridization to similar sequences, particularly in segmentally duplicated regions or pseudogenes. Probe sensitivity requires avoidance of secondary structures in both the probe and target DNA that might hinder hybridization. GC content must be optimized—high GC causes "sticky" probes with non-specific binding, while low GC results in poor hybridization efficiency. Sophisticated design workflows incorporate in silico analysis of target sequences, identification of repetitive and homologous regions, generation of all possible probes, analysis of physicochemical properties, and empirical optimization through repeated testing [92]. These design principles enable detection of increasingly smaller variants, with modern arrays capable of identifying single-exon CNVs relevant to Mendelian disorders [92].
NGS Panel Design and Validation
Targeted NGS panels for CNV detection require careful design and validation to ensure clinical-grade performance. The CLL study demonstrated successful CNV detection using a targeted approach with additional amplicons across regions affected by clinically relevant CNAs [78]. Key considerations include sufficient coverage depth (median >1000× in the CLL study), careful bait design to avoid problematic genomic regions, and implementation of robust bioinformatics algorithms specifically validated for CNV calling. The PGDx elio tissue complete assay validation demonstrated that targeted NGS panels can achieve >95% positive percentage agreement for SNVs and indels, and 80-83% for CNVs and translocations compared to established clinical tests [8].
Emerging Multiplexed Spatial Technologies
Advanced multiplexing approaches like ARTseq-FISH enable simultaneous quantification of mRNA, protein, and phosphoprotein levels in individual cells with high spatial resolution [89]. This method uses DNA-barcoded antibodies against (phospho-)protein targets combined with padlock probes for mRNA detection, followed by rolling circle amplification and sequential fluorescence hybridization. Such technologies bridge the gap between high-plex NGS and spatial resolution of FISH, providing unprecedented insights into cellular heterogeneity and positional effects in tissue contexts [89].
The integration of FISH, microarrays, and NGS provides researchers with a powerful toolkit for comprehensive genomic analysis. FISH remains indispensable for spatial context and validation of complex structural variations. Microarrays offer cost-effective, robust solutions for genome-wide CNV detection, particularly in large cohort studies. NGS delivers the most comprehensive variant detection across multiple variant classes from a single assay. Platform selection should be guided by specific research questions, sample characteristics, and resource constraints, with strategic integration providing the most complete understanding of genomic architecture. As each technology continues to evolve, their complementary strengths will continue to make multi-platform approaches valuable for both basic research and clinical applications.
The evolution of molecular diagnostics has revolutionized clinical practice, particularly in oncology, where precise genetic characterization directly informs therapeutic decisions. Two cornerstone technologies—fluorescence in situ hybridization (FISH) and next-generation sequencing (NGS)—are frequently employed to detect critical genomic alterations, including copy number variations, gene rearrangements, and mutations. While both methods aim to provide accurate molecular profiling, discordant findings between them can significantly impact diagnostic accuracy and treatment pathways.
This guide objectively compares the performance characteristics of FISH and NGS across multiple clinical contexts, analyzing the root causes of discordance and the complementary value each method provides. Through examination of experimental data from glioma and non-small cell lung cancer (NSCLC) case studies, we demonstrate how understanding the technical capabilities and limitations of each platform enables more informed test selection and interpretation, ultimately enhancing patient management in molecular pathology and drug development.
Clinical Case Studies
Glioma Diagnostics: Copy Number Variation Assessment
A retrospective cohort study comprising 104 glioma patients systematically compared FISH, NGS, and DNA methylation microarray (DMM) for detecting six CNV-related diagnostic or prognostic parameters: EGFR, CDKN2A/B, 1p, 19q, chromosome 7, and chromosome 10 [5].
Key Findings: While all three methods showed high consistency in EGFR assessment, FISH demonstrated relatively low concordance with NGS/DMM in detecting other parameters. In contrast, NGS and DMM exhibited strong concordance across all six parameters [5]. Notably, discordant cases were associated with high-grade gliomas (grade 3/4; P < 0.05) and high fraction of genome altered (P < 0.01), indicating these cases represented tumors with greater malignancy and genomic instability [5].
Clinical Impact: The study elucidated the discrepancies and limitations of conventional FISH compared with NGS/DMM in CNV assessments, suggesting that reliance solely on FISH in high-grade gliomas could lead to incomplete genomic characterization. The authors proposed a diagnostic process with recommendations on methods, highlighting the importance of integrated multiplatform assays for accurate clinical diagnosis [5].
NSCLC: Detection of ALK and ROS1 Rearrangements
A comprehensive study of 131 cytological samples from advanced NSCLC patients compared immunocytochemistry (ICC), FISH, and NGS for detecting ALK and ROS1 rearrangements [94]. These genetic alterations are critical therapeutic targets, with ALK rearrangements present in 3-7% and ROS1 in 2-3% of NSCLC cases [94].
Performance Metrics: Using NGS as reference, ICC demonstrated sensitivity and specificity of 0.79 and 0.91 for ALK, and 1 and 0.87 for ROS1, respectively. FISH showed perfect sensitivity and specificity (1 for both) for both ALK and ROS1 probes [94]. False-positive cases obtained by ICC were systematically corrected by FISH, while true-positive cases were confirmed [94].
Complementary Value: The study highlighted the cost-effectiveness of sequential ICC and FISH testing while acknowledging NGS's superior ability to simultaneously detect multiple alteration types. Notably, NGS identified additional rearrangement partners and types, including a MET rearrangement and a RET rearrangement in two patients [94].
Expanded NSCLC Validation
A separate study of 107 NSCLC cases further validated the relationship between IHC/FISH and NGS testing [18]. This research integrated detection of EGFR mutations, ALK rearrangement, ROS1 rearrangement, and alterations of nine other lung cancer-related genes into a single NGS platform.
Methodological Advantages: The study found NGS could explore various gene mutations and rearrangements with reduced experimental time and lower tumor tissue requirements compared to multiple IHC staining experiments [18]. NGS provided more informative and reliable results than IHC for EGFR gene alterations, particularly in exon 19, and increased the positive rate of ALK rearrangement while decreasing false positive ROS1 rearrangements detected by IHC [18].
Clinical Utility: The authors concluded that NGS was effective for confirming the status of various important lung cancer-related gene alterations and necessary for confirming IHC results of ALK and ROS1 rearrangements [18].
Comparative Performance Data
Table 1: Performance Comparison of FISH and NGS in Clinical Detection
| Parameter | FISH | NGS | Clinical Context |
|---|---|---|---|
| Sensitivity (ALK) | 1.0 [94] | 1.0 (reference) [94] | NSCLC rearrangement detection |
| Specificity (ALK) | 1.0 [94] | 1.0 (reference) [94] | NSCLC rearrangement detection |
| Sensitivity (ROS1) | 1.0 [94] | 1.0 (reference) [94] | NSCLC rearrangement detection |
| Specificity (ROS1) | 1.0 [94] | 1.0 (reference) [94] | NSCLC rearrangement detection |
| Concordance with DMM | Low for CDKN2A/B, 1p, 19q, chr7, chr10 [5] | Strong for all 6 parameters [5] | Glioma CNV assessment |
| Tissue Requirements | Low-moderate | Low [18] | Multiple alteration detection |
| Testing Capacity | Limited to targeted regions | Comprehensive (mutations, CNVs, fusions) [18] | Multi-gene assessment |
| Cost Considerations | Lower cost for targeted testing [94] | Higher cost but more comprehensive [94] | Healthcare resource allocation |
Table 2: Causes and Clinical Implications of Discordant Findings
| Cause of Discordance | Description | Clinical Impact | Recommended Action |
|---|---|---|---|
| Genomic Instability | Discordant cases associated with high fraction of genome altered [5] | Underestimation of complexity in high-grade tumors | Multiplatform testing in advanced disease |
| Technical Limitations | FISH has lower resolution for smaller CNAs [95] | Potential missed detection of clinically relevant alterations | Confirm critical findings with orthogonal methods |
| Spatial Heterogeneity | FISH assesses limited regions; NGS provides genome-wide view [5] | Incomplete tumor profiling | Consider broader testing in heterogeneous tumors |
| Variant Type | FISH optimal for rearrangements; NGS detects multiple alteration types [94] [18] | Inappropriate test selection may miss targetable alterations | Match test to clinical suspicion and available therapies |
Experimental Protocols and Methodologies
Glioma CNV Detection Protocol
Sample Processing: The glioma study utilized 104 patient samples processed through three parallel methodologies: FISH, NGS, and DNA methylation microarray [5].
FISH Methodology:
- Target-specific fluorescent probes applied to tissue sections
- Visual enumeration of signals per nucleus under fluorescence microscopy
- Threshold-based scoring for copy number alterations
- Limited to predefined genomic regions (EGFR, CDKN2A/B, 1p, 19q, chromosome 7, chromosome 10)
NGS Methodology:
- DNA extraction and library preparation targeting relevant genomic regions
- High-throughput sequencing on NGS platforms
- Bioinformatics analysis for copy number assessment using read depth comparisons
- Genome-wide capability with focus on the six specified parameters
Statistical Analysis:
- Concordance calculation between methods
- Association of discordance with tumor grade and genomic instability metrics
- Statistical significance testing (P < 0.05 considered significant) [5]
NSCLC Rearrangement Detection Protocol
Sample Collection and Preparation:
- 131 cytological samples including lymph nodes, pleural effusions, pericardial effusions, and bronchial brushings [94]
- Cell pellets and stained slides prepared for different analytical methods
- RNA extraction using standardized kits; quality assessment via spectrophotometry
ICC/FISH Workflow:
- Immunocytochemistry screening with ALK and ROS1 antibodies
- Positive or doubtful cases confirmed by FISH
- FISH performed with break-apart probes for ALK and ROS1
- Systematic interpretation of signal patterns (break-apart, single 3' signals)
NGS Analysis:
- RNA sequencing using fusion panel approach
- Capability to identify specific fusion partners and variants
- Simultaneous detection of additional mutations via DNA sequencing panel [94]
Performance Calculation:
- Sensitivity and specificity calculations using NGS as reference standard
- Concordance assessment across methods
- Analysis of co-occurring mutations in positive cases
NSCLC Testing Pathways: This diagram illustrates clinical decision pathways for molecular testing in non-small cell lung cancer, highlighting scenarios where FISH and NGS provide complementary versus standalone value.
Technological Advancements and Emerging Methods
Advanced FISH Methodologies
Recent technological innovations have enhanced FISH capabilities, addressing some traditional limitations. The novel π-FISH rainbow method represents a significant advancement, enabling highly efficient multiplexed in situ detection of diverse biomolecules with improved signal intensity and reduced background noise [96].
Key Improvements:
- π-shaped probe design with complementary base pairs increases hybridization efficiency and stability
- Capability to detect diverse biomolecules (DNA, RNA, proteins, neurotransmitters) individually or simultaneously
- Enhanced sensitivity for short nucleic acid fragments through combination with hybridization chain reaction (π-FISH+)
- Successful application across multiple species and sample types (frozen, paraffin, whole-mount) [96]
Clinical Applications:
- Detection of androgen receptor splice variant 7 (ARV7) in circulating tumor cells from prostate cancer patients
- Visualization of microRNA and noncoding RNA with single-molecule resolution
- Spatial mapping of 21 neuronal marker genes in just two rounds of hybridization [96]
NGS-Based Applications Beyond Oncology
The utility of NGS technologies extends beyond traditional cancer genomics. In hematopoietic stem cell transplantation (HSCT), NGS-based chimerism testing has demonstrated superior performance compared to conventional short tandem repeat (STR) analysis [97].
Performance Advantages:
- Enhanced detection limit (0.3% host DNA) for minor alleles compared to STR (~1-5%)
- High analytical specificity (99.9%)
- Improved accuracy in cell subset analysis (CD3 and CD66 enriched populations)
- Excellent reproducibility across technical replicates and platforms [97]
Clinical Impact:
- Early detection of mixed chimerism predictive of graft rejection
- Monitoring engraftment kinetics with superior sensitivity
- Guiding timely interventions through precise quantification of donor-recipient ratios [97]
Research Reagent Solutions
Table 3: Essential Research Reagents for FISH and NGS Methodologies
| Reagent Category | Specific Examples | Function/Application |
|---|---|---|
| FISH Probes | Locus-specific fluorescent probes (ALK, ROS1 break-apart) | Targeted detection of gene rearrangements and copy number alterations [94] |
| NGS Library Prep Kits | SGI OncoAim Lung Cancer Targeting Gene Detection Kit | Target capture and library preparation for focused NGS panels [18] |
| DNA Extraction Kits | QIAamp DNA FFPE Tissue Kit | High-quality DNA extraction from formalin-fixed paraffin-embedded samples [18] |
| RNA Extraction Kits | RNeasy FFPE Kit | RNA isolation for fusion transcript detection [94] |
| Cell Enrichment Kits | EasySep Human Whole Blood Positive Selection Kit (CD3, CD66b/33) | Isolation of specific cell subsets for sensitive chimerism monitoring [97] |
| Amplification Systems | π-FISH rainbow amplification probes | Signal amplification for improved FISH sensitivity [96] |
| Validation Kits | AmoyDx Human EGFR/ALK/ROS1 Detection Kits | Orthogonal validation of NGS findings using established methods [18] |
Technology Integration Logic: This diagram illustrates the complementary advantages and limitations of FISH and NGS technologies, demonstrating how their integration creates a more comprehensive diagnostic approach than either method alone.
The comparative analysis of FISH and NGS technologies reveals a complex landscape of discordant and complementary findings with significant clinical implications. FISH maintains important advantages for targeted detection of rearrangements with high sensitivity and specificity, particularly when tissue is limited or cost considerations are paramount. However, NGS provides a more comprehensive genomic profile, detecting various alteration types simultaneously with superior resolution for copy number variations and the ability to identify novel fusion partners.
The observed discordances between platforms frequently associate with biologically and clinically relevant scenarios, including high genomic instability and tumor heterogeneity. These findings underscore the necessity of method-aware test interpretation and strategic deployment of orthogonal validation in specific clinical contexts. Rather than positioning these technologies as mutually exclusive, the evidence supports a nuanced approach leveraging their complementary strengths—whether through sequential testing algorithms or parallel assessment—to optimize diagnostic accuracy, therapeutic targeting, and ultimately patient outcomes in molecular pathology and drug development.
Cost-Effectiveness and Turnaround Time in Routine Clinical Practice
The integration of genomic testing into routine clinical practice represents a cornerstone of precision oncology. The identification of actionable genetic alterations enables clinicians to match patients with targeted therapies, significantly improving treatment outcomes. For years, fluorescence in situ hybridization (FISH) has served as a standard technique for detecting key genomic abnormalities, including gene amplifications, deletions, and rearrangements. However, the emergence of next-generation sequencing (NGS) has revolutionized molecular diagnostics by enabling the simultaneous assessment of numerous genes from a single tissue sample. This guide provides an objective comparison of these two technologies, focusing on their cost-effectiveness and operational efficiency within clinical settings, framed by the growing body of evidence on method concordance.
Analytical Performance and Concordance
Understanding the analytical agreement between FISH and NGS is fundamental for evaluating their relative clinical utility. While both methods are validated for detecting specific alterations, their performance varies depending on the genomic context and tumor type.
Key Comparative Studies
Recent studies have systematically evaluated the concordance between FISH and NGS across various cancers:
- Glioma: A retrospective cohort study of 104 glioma patients compared FISH, NGS, and DNA methylation microarray (DMM) for detecting six copy number variation (CNV) parameters. While all three methods showed high consistency for EGFR assessment, FISH demonstrated relatively low concordance with NGS/DMM for other parameters like CDKN2A/B, 1p, 19q, chromosome 7, and chromosome 10. In contrast, NGS and DMM exhibited strong concordance for all parameters. Discordant cases were notably associated with high-grade gliomas and high genomic instability [5].
- Non-Small Cell Lung Cancer (NSCLC):
- A study on MET amplification detection found that NGS confidently identified FISH-validated MET amplification. The authors suggested that FISH should only be considered in NGS non-amplified cases, particularly those with low tumor content [26].
- For ALK and ROS1 rearrangements in cytological samples, FISH demonstrated perfect sensitivity and specificity (1.00 for both) compared to NGS. However, immunocytochemistry (ICC) generated false positives that were systematically corrected by FISH, suggesting a potential role for FISH as a confirmatory test in a sequential algorithm [94].
- Uterine Serous Carcinoma (HER2): The correlation between IHC/FISH and NGS for HER2 status ranged between 81% and 85%, improving when tests were performed on the same tissue block. Whole exome sequencing (WES) identified additional HER2-positive patients missed by IHC/FISH, highlighting a potential limitation of traditional testing [9].
- Multi-Cancer Platform Study (K-MASTER): A large-scale study comparing an NGS panel with orthogonal methods across colorectal, breast, NSCLC, and gastric cancers found that the agreement varied by genetic alteration. For example, while the concordance for ALK fusion in NSCLC was 100%, the sensitivity for ERBB2 amplification in breast and gastric cancers was lower (53.7% and 62.5%, respectively) [98].
Table 1: Concordance and Performance Metrics Between FISH and NGS
| Cancer Type | Genetic Alteration | Sensitivity (%) | Specificity (%) | Concordance Notes |
|---|---|---|---|---|
| Glioma [5] | EGFR CNV | High | High | High consistency across FISH, NGS, DMM |
| CDKN2A/B, 1p/19q | Lower (FISH vs NGS/DMM) | Lower (FISH vs NGS/DMM) | FISH showed low concordance with NGS/DMM | |
| NSCLC [94] | ALK Rearrangement | 100 (FISH) | 100 (FISH) | Perfect agreement with NGS |
| ROS1 Rearrangement | 100 (FISH) | 100 (FISH) | Perfect agreement with NGS | |
| NSCLC [26] | MET Amplification | - | - | NGS confidently identified FISH-validated amplification |
| Breast Cancer [98] | ERBB2 Amplification | 53.7 (NGS) | 99.4 (NGS) | Lower sensitivity of NGS vs orthogonal methods |
| Gastric Cancer [98] | ERBB2 Amplification | 62.5 (NGS) | 98.2 (NGS) | Lower sensitivity of NGS vs orthogonal methods |
| Uterine Serous Carcinoma [9] | HER2/ERBB2 | - | - | 81-85% correlation between IHC/FISH and NGS |
Cost-Effectiveness Analysis
The economic evaluation of diagnostic strategies is crucial for their sustainable implementation in healthcare systems. A growing body of evidence indicates that NGS offers superior cost-effectiveness compared to sequential single-gene testing, which often includes FISH.
Economic Models in NSCLC and Other Cancers
A pivotal cost-effectiveness analysis compared three testing strategies for advanced NSCLC adenocarcinoma:
- Strategy 1: Sequential testing with EGFR RT-PCR, followed by FISH for ALK and ROS1.
- Strategy 2: EGFR RT-PCR with simultaneous FISH for ALK and ROS1.
- Strategy 3: A single NGS test covering EGFR, ALK, and ROS1.
The study concluded that although NGS incurred higher initial test costs, it identified 24% more true positive cases. The incremental cost-effectiveness ratio (ICER) for NGS versus sequential testing was US $3,479 per correctly identified case. While the gain in quality-adjusted life years (QALYs) was slight, the comprehensive nature of NGS improves diagnostic accuracy [99].
Further economic analyses have introduced the metric of "cost per correctly identified patient" (CCIP). In nonsquamous NSCLC, the CCIP was €658 for NGS versus €1,983 for sequential single-gene testing (SGT). This superior cost-benefit profile for NGS was also demonstrated in other tumor types, including metastatic colorectal, breast, and gastric cancers, as well as cholangiocarcinoma [100].
Drivers of Cost-Efficiency
The cost advantage of NGS stems from several key factors:
- Parallel vs. Sequential Testing: NGS can interrogate hundreds of genes simultaneously from a single, often limited, tissue sample. In contrast, SGT requires multiple rounds of testing, consuming more tissue and increasing overall costs [99] [100].
- Tissue Preservation: Sequential testing algorithms risk exhausting precious biopsy material through repeated assays, potentially leading to inadequate material for comprehensive profiling and requiring re-biopsy—a costly and invasive procedure [100].
- Operational Efficiency: Consolidating multiple tests into a single NGS workflow reduces the hands-on time, reagent costs, and administrative overhead associated with managing multiple standalone test orders and results [100].
Table 2: Cost-Effectiveness Comparison of Testing Strategies
| Parameter | Sequential Single-Gene Testing (incl. FISH) | Next-Generation Sequencing (NGS) |
|---|---|---|
| Overall Economic Model | Less cost-effective; higher cost per correct diagnosis [99] [100] | More cost-effective; lower cost per correctly identified patient (CCIP) [99] [100] |
| CCIP in NSCLC | €1,983 (non-squamous) [100] | €658 (non-squamous) [100] |
| Therapeutic Yield | Lower; identifies fewer true positive cases [99] | Higher; identified 24% more true positive cases in one model [99] |
| Tissue Utilization | Inefficient; consumes more tissue with each sequential test [100] | Efficient; multiple biomarkers from a single test [100] |
| Laboratory Workflow | Multiple separate workflows, increasing hands-on time and complexity [100] | Single, consolidated workflow [100] |
Turnaround Time in Clinical Workflow
Turnaround time (TAT)—the period from test initiation to result reporting—is a critical operational metric that directly impacts patient management.
- Sequential Testing Delays: In a sequential algorithm, the total TAT is the sum of the individual TATs for each test, plus the administrative and transport time between assays. If an initial EGFR test is negative, the sample must then be processed for ALK FISH, and if negative again, for ROS1 FISH. This step-wise process inherently prolongs the time to a definitive treatment decision [99].
- Parallel NGS Efficiency: NGS condenses this timeline by processing the analysis for all biomarkers concurrently. Although the wet-lab and sequencing steps for NGS can be technically longer than a single FISH test, the overall TAT to a comprehensive genomic profile is typically shorter than the cumulative TAT of a sequential approach [100].
- Impact on Treatment: A shorter TAT allows oncologists to make informed treatment decisions more rapidly, which is particularly crucial for patients with advanced, rapidly progressing disease. This avoids treatment delays that can compromise clinical outcomes.
The following diagram illustrates the workflow differences that directly impact turnaround time and resource utilization.
Experimental Protocols & The Scientist's Toolkit
To ensure the generation of reliable and reproducible data, robust experimental protocols and high-quality reagents are essential for both FISH and NGS.
Detailed Methodologies
Fluorescence In Situ Hybridization (FISH):
- Protocol: Tissue sections are mounted on slides, pretreated with heat and enzymes to allow probe penetration, and denatured. Fluorescently labeled DNA probes specific to the gene or chromosomal region of interest (e.g., MET/CEN7 dual color probe) are hybridized to the target. After washing, signals are visualized and enumerated using a fluorescence microscope. Amplification is typically defined as a MET:CEN7 ratio ≥2.0, while copy number gain is a ratio of 1-2.0 or >2 signals for both in a 1:1 ratio [26].
- Validation: The technique requires pathologist scoring of signals within tumor cell nuclei, with a minimum number of cells counted for statistical significance.
Next-Generation Sequencing (NGS):
- Protocol (Targeted Panel, DNA): DNA is extracted from formalin-fixed, paraffin-embedded (FFPE) tumor tissue with a defined tumor content (e.g., >10%). Libraries are prepared, often using hybrid-capture (e.g., K-MASTER panel) or amplicon-based (e.g., Oncomine panel) approaches. Libraries are sequenced on platforms like the Ion Torrent PGM or Illumina sequencers. Data is processed through a bioinformatics pipeline for variant calling. For the NCI-MATCH assay, the limit of detection was validated at 2.8% for SNVs, 10.5% for indels, and 4 copies for gene amplification [101] [98].
- Validation (Clinical Grade): The NCI-MATCH assay was validated across four CLIA-certified labs using archived FFPE tumor specimens and cell lines with known variants identified by orthogonal methods (digital PCR, Sanger sequencing, FISH). The assay demonstrated an overall sensitivity of 96.98% and specificity of 99.99% for known mutations, with high inter-laboratory reproducibility [101].
Research Reagent Solutions
Table 3: Essential Research Materials for FISH and NGS Protocols
| Item | Function/Description | Example in Context |
|---|---|---|
| Dual Color FISH Probes | Gene-specific and centromere probes for determining amplification ratios. | MET/CEN7 probe for MET amplification testing in NSCLC [26]. |
| FFPE-Derived DNA | The primary input material for NGS; quality and quantity are critical. | DNA extracted from FFPE tissue with >10% tumor content for the RMH200Solid gene panel [26]. |
| Targeted NGS Panel | A predefined set of probes/primers to capture and sequence genes of interest. | Oncomine Cancer Panel, K-MASTER Cancer Panel, SNUH FIRST Cancer Panel [101] [98]. |
| Bioinformatic Pipeline | Software for processing raw sequencing data, aligning reads, and calling variants. | Torrent Suite & Ion Reporter used for the NCI-MATCH NGS assay; in-house pipelines for K-MASTER [101] [98]. |
| Cell Line Controls | Specimens with known genetic aberrations for assay validation and quality control. | FFPE cell line pellets with known variants used in NCI-MATCH validation [101]. |
The body of evidence strongly supports the superior cost-effectiveness of NGS compared to sequential testing strategies that include FISH. The ability of NGS to provide a comprehensive genomic profile from a single test, with a lower cost per correct diagnosis and a more efficient workflow, makes it an increasingly indispensable tool in modern oncology. While FISH remains a highly specific and valuable technique, particularly for certain structural variants and as a reflex test in ambiguous NGS cases, its role is evolving. For routine clinical practice, especially in cancers with numerous potential driver alterations, NGS represents a more economically viable and operationally efficient platform, accelerating the delivery of precision medicine to patients.
Conclusion
The concordance between FISH and NGS is context-dependent, varying by genomic alteration type, disease setting, and technical methodology. While NGS demonstrates superior resolution and throughput for comprehensive genomic profiling, FISH retains value for specific applications and validation. Future diagnostic workflows will increasingly leverage multi-platform approaches, integrating emerging technologies like optical genome mapping and Hi-C to overcome the limitations of individual methods. For biomedical research and drug development, this evolution necessitates robust validation frameworks and a nuanced understanding of how different technologies complement each other to fully characterize complex cancer genomes and guide targeted therapeutic strategies.
References
- 1. FISH and cytogenetics in cancer research [https://www.ogt.com/us/resources/fish-resources-and-support/fish-resources/fish-and-cytogenetics-in-cancer-research/]
- 2. Bioinformatically-expanded next-generation sequencing ... [https://pmc.ncbi.nlm.nih.gov/articles/PMC9633455/]
- 3. Incorporating automation in a cytogenetics laboratory [https://pmc.ncbi.nlm.nih.gov/articles/PMC12164055/]
- 4. Diagnostic accuracy of next-generation sequencing (NGS) ... [https://link.springer.com/article/10.1007/s12094-025-04040-7]
- 5. Comparison of Fluorescence In Situ Hybridization, Next- ... [https://www.sciencedirect.com/science/article/pii/S0023683725000789]
- 6. Comparison of Next-Generation Sequencing and ... [https://pmc.ncbi.nlm.nih.gov/articles/PMC8465051/]
- 7. Utility of Targeted Sequencing Compared to FISH for ... [https://www.mdpi.com/2072-6694/16/13/2450]
- 8. Next-Generation Sequencing Concordance Analysis of ... [https://pmc.ncbi.nlm.nih.gov/articles/PMC8567158/]
- 9. Immunohistochemistry, next generation sequencing (NGS) ... [https://pubmed.ncbi.nlm.nih.gov/41092695/]
- 10. Unique molecular assay (UMA): a next-generation ... [https://pmc.ncbi.nlm.nih.gov/articles/PMC12485320/]
- 11. Comparison between Immunocytochemistry, FISH and ... [https://www.mdpi.com/1422-0067/23/18/10556]
- 12. A targeted next-generation sequencing panel for ... [https://www.nature.com/articles/s41598-025-08039-6]
- 13. Determining Performance Metrics for Targeted Next ... [https://pmc.ncbi.nlm.nih.gov/articles/PMC6172655/]
- 14. The Impact on the Therapeutic Decision of Massive Gene ... [https://pmc.ncbi.nlm.nih.gov/articles/PMC12611080/]
- 15. Sequencing Coverage for NGS Experiments [https://www.illumina.com/science/technology/next-generation-sequencing/plan-experiments/coverage.html]
- 16. Making the Most of Your NGS Data: Understanding Metrics ... [https://sequencing.roche.com/us/en/article-listing/metrics-for-target-enriched-ngs.html]
- 17. Detection of structural DNA variation from next generation ... [https://www.sciencedirect.com/science/article/abs/pii/S2210776213001579]
- 18. Comparison of next-generation sequencing and ... [https://pmc.ncbi.nlm.nih.gov/articles/PMC6988007/]
- 19. Evaluating the Correlation Between FISH and NGS in ... [https://bostongene.com/news-and-publications/publications/evaluating-the-correlation-between-fish-and-ngs-in-assessing-erbb2-amplification-in-breast-cancer-insights-and-implications]
- 20. CDKN2A alternations in non-small cell lung cancer [https://pubmed.ncbi.nlm.nih.gov/40834771/]
- 21. The role of next-generation sequencing in detecting gene ... [https://www.sciencedirect.com/science/article/abs/pii/S0046817722000363]
- 22. Gene Fusion Detection in NSCLC Routine Clinical Practice [https://pmc.ncbi.nlm.nih.gov/articles/PMC10137127/]
- 23. Hi-C Technology Reveals Actionable Gene Fusions and ... [https://pmc.ncbi.nlm.nih.gov/articles/PMC12469463/]
- 24. SplitFusion enables ultrasensitive gene fusion detection ... [https://www.sciencedirect.com/science/article/pii/S2666389925000224]
- 25. Visual Inspection of Sequencing Data for Diagnosis [https://pubmed.ncbi.nlm.nih.gov/40884649/]
- 26. 7 Concordance of MET amplification detection between ... [https://www.sciencedirect.com/science/article/pii/S0169500224001132]
- 27. Detecting actionable mutations from matched plasma-based ... [https://jeccr.biomedcentral.com/articles/10.1186/s13046-025-03480-x]
- 28. Prognostic and Predictive Biomarkers in Gliomas - PMC [https://pmc.ncbi.nlm.nih.gov/articles/PMC8508830/]
- 29. Comprehensive clinical assays for molecular diagnostics of ... [https://www.frontiersin.org/journals/molecular-biosciences/articles/10.3389/fmolb.2023.1216102/full]
- 30. A Custom DNA-Based NGS Panel for the Molecular ... [https://pmc.ncbi.nlm.nih.gov/articles/PMC8969903/]
- 31. Challenging CDKN2A assessment in BRAF-altered gliomas [https://pmc.ncbi.nlm.nih.gov/articles/PMC12337364/]
- 32. DNA methylation profiling for molecular classification of adult ... [https://clinicalepigeneticsjournal.biomedcentral.com/articles/10.1186/s13148-021-01085-7]
- 33. Prognostic Markers of DNA Methylation and Next-Generation ... [https://pmc.ncbi.nlm.nih.gov/articles/PMC10543963/]
- 34. Diagnostic impact of DNA methylation classification in adult ... [https://www.nature.com/articles/s41598-025-87079-4]
- 35. Multiomic neuropathology improves diagnostic accuracy in ... [https://pmc.ncbi.nlm.nih.gov/articles/PMC10115638/]
- 36. Clinical utility of whole-genome DNA methylation profiling as a ... [https://pmc.ncbi.nlm.nih.gov/articles/PMC10355794/]
- 37. t(11;14) status is stable between diagnosis and relapse ... [https://pmc.ncbi.nlm.nih.gov/articles/PMC11141641/]
- 38. Unique molecular assay (UMA): a next-generation ... [https://haematologica.org/article/view/12063]
- 39. Comparison of Diagnostic Yield of a FISH Panel Against ... [https://pmc.ncbi.nlm.nih.gov/articles/PMC5980910/]
- 40. A comprehensive approach to evaluate genetic ... [https://www.nature.com/articles/s41408-024-01059-x]
- 41. The potential role of next-generation sequencing in ... [https://pmc.ncbi.nlm.nih.gov/articles/PMC11532092/]
- 42. MET inhibitors for targeted therapy of EGFR TKI-resistant lung ... [https://jhoonline.biomedcentral.com/articles/10.1186/s13045-019-0759-9]
- 43. MET amplification identified by next-generation sequencing ... [https://ehoonline.biomedcentral.com/articles/10.1186/s40164-021-00245-y]
- 44. NGS and FISH for MET amplification detection in EGFR TKI ... [https://pubmed.ncbi.nlm.nih.gov/39068705/]
- 45. Metagenomic next-generation sequencing for concurrent ... [https://www.nature.com/articles/s41598-025-18812-2]
- 46. Comparison of metagenomic next-generation sequencing and... [https://bmcinfectdis.biomedcentral.com/articles/10.1186/s12879-024-09236-w]
- 47. Comparative diagnostic performance of metagenomic and two ... [https://pmc.ncbi.nlm.nih.gov/articles/PMC12301447/]
- 48. Optical Genome Mapping: A New Tool for Cytogenomic ... [https://pmc.ncbi.nlm.nih.gov/articles/PMC12385997/]
- 49. : A ‘Tool’… | College of American Pathologists Optical Genome Mapping [https://www.cap.org/member-resources/articles/optical-genome-mapping-a-tool-with-significant-potential-from-discovery-to-diagnostics]
- 50. High-resolution structural profiling of myelodysplastic... variant [https://www.nature.com/articles/s41375-022-01652-8?error=cookies_not_supported&code=71c2a6aa-e944-42c6-b228-1de907fe21e7]
- 51. How Optical (OGM) Works | Bionano Genome Mapping [https://bionano.com/how-ogm-works/]
- 52. Deciphering histone mark-specific fine-scale chromatin ... [https://www.nature.com/articles/s41467-025-64350-w]
- 53. Comparison of structural by variants with... detected optical mapping [https://pubmed.ncbi.nlm.nih.gov/33983367/]
- 54. What are the Pros and Cons of FISH, aCGH and NGS? [https://www.enzo.com/note/what-are-the-pros-and-cons-of-fish-acgh-and-ngs/]
- 55. NGS and FISH for MET amplification detection in EGFR TKI ... [https://www.sciencedirect.com/science/article/abs/pii/S0169500224004318]
- 56. Discordance between FISH, IHC, and NGS Analysis of ALK ... [https://pmc.ncbi.nlm.nih.gov/articles/PMC6280637/]
- 57. Discordant ALK Status in Non-Small Cell Lung Carcinoma [https://www.mdpi.com/1422-0067/25/15/8168]
- 58. ALK FISH patterns and the detection of ALK fusions by next ... [https://www.oncotarget.com/article/12705/text/]
- 59. Resolving intra-tumor heterogeneity and clonal evolution of ... [https://ehoonline.biomedcentral.com/articles/10.1186/s40164-025-00718-4]
- 60. Heterogeneity in precision oncology - PMC - PubMed Central [https://pmc.ncbi.nlm.nih.gov/articles/PMC10953762/]
- 61. Array-based comparative genomic hybridization analysis of ... [https://www.nature.com/articles/gim200840]
- 62. Array-CGH and multipoint FISH to decode complex ... [https://bmcgenomics.biomedcentral.com/articles/10.1186/1471-2164-7-330]
- 63. Next-generation sequencing in breast cancer: current clinical ... [https://pmc.ncbi.nlm.nih.gov/articles/PMC12502106/]
- 64. Overcoming intra-tumoral heterogeneity for biomarker ... [https://www.nature.com/articles/s41698-025-00911-y]
- 65. Cancer Heterogeneity and Liquid Biopsy [https://www.thermofisher.com/blog/behindthebench/precision-medicine-cancer-heterogeneity-liquid-biopsy/]
- 66. A copy number variation detection method based on ... [https://www.nature.com/articles/s41598-025-88143-9]
- 67. Benchmarking scRNA-seq copy number variation callers [https://www.nature.com/articles/s41467-025-62359-9]
- 68. Benchmarking copy number variation detection with low- ... [https://pmc.ncbi.nlm.nih.gov/articles/PMC12481693/]
- 69. Copy Number Variation (CNV) Calling [https://www.cancer.gov/about-nci/organization/cbiit/training/library/cnv]
- 70. Pan-cancer copy number variant analysis identifies optimized ... [https://pmc.ncbi.nlm.nih.gov/articles/PMC10802684/]
- 71. Benchmarking germline CNV calling tools from exome ... [https://www.nature.com/articles/s41598-021-93878-2]
- 72. Cryopreserved Tissue Biospecimens Offer Superior Quality ... [https://www.mdpi.com/1422-0067/26/22/11038]
- 73. Large-scale analysis of whole genome sequencing data ... [https://www.nature.com/articles/s41467-024-51577-2]
- 74. Comparison of next‑generation sequencing quality metrics ... [https://pmc.ncbi.nlm.nih.gov/articles/PMC11843196/]
- 75. Whole genome sequencing improves tissue-of-origin ... [https://www.nature.com/articles/s41467-025-59661-x]
- 76. Automation of fluorescent in situ hybridization (FISH) ... [https://pubmed.ncbi.nlm.nih.gov/40962484/]
- 77. The state of the art in cost-benefit of HTS methods for stock ... [https://www.frontiersin.org/journals/marine-science/articles/10.3389/fmars.2022.1005534/full]
- 78. Utility of Targeted Sequencing Compared to FISH for ... [https://pmc.ncbi.nlm.nih.gov/articles/PMC11240685/]
- 79. a next-generation sequencing targeted panel for efficient ... [https://pubmed.ncbi.nlm.nih.gov/40371906/]
- 80. Inter-observer reproducibility of HER2 immunohistochemical ... [https://bmccancer.biomedcentral.com/articles/10.1186/1471-2407-9-165]
- 81. Fluorescence In Situ Hybridization (FISH) and Its Applications [https://pmc.ncbi.nlm.nih.gov/articles/PMC7122835/]
- 82. Key considerations for comprehensive validation of an RNA ... [https://pmc.ncbi.nlm.nih.gov/articles/PMC7322345/]
- 83. Analytical validation (accuracy, reproducibility, limit of ... [https://journals.plos.org/plosone/article?id=10.1371/journal.pone.0329697]
- 84. Quantitative Imaging Analysis Fluorescence In Situ ... [https://pubmed.ncbi.nlm.nih.gov/36920020/]
- 85. Preclinical validation of fluorescence in situ hybridization ... [https://www.sciencedirect.com/science/article/pii/S1098360021034031]
- 86. Impact and Reproducibility of In-House Targeted Next ... [https://www.sciencedirect.com/science/article/pii/S152515782500042X]
- 87. Benchmarking standard-of-care and emerging genomic ... [https://www.nature.com/articles/s41416-025-03204-0]
- 88. Status and Prospects of Fluorescence In Situ Hybridization ... [https://pmc.ncbi.nlm.nih.gov/articles/PMC9690641/]
- 89. ARTseq-FISH reveals position-dependent differences in ... [https://www.nature.com/articles/s41467-024-48107-5]
- 90. Comparing whole genomes using DNA microarrays - PMC [https://pmc.ncbi.nlm.nih.gov/articles/PMC7097741/]
- 91. Comprehensive performance comparison of high-resolution ... [https://bmcgenomics.biomedcentral.com/articles/10.1186/s12864-017-3658-x]
- 92. The impact of microarray probe design on detecting CNV [https://www.ogt.com/us/resources/array-resources-and-support/array-resources/the-impact-of-microarray-probe-design-on-detecting-copy-number-variants-at-exon-resolution/]
- 93. Comparing microarrays and next-generation sequencing ... [https://www.sciencedirect.com/science/article/pii/S0167779910000491]
- 94. Comparison between Immunocytochemistry, FISH and NGS ... [https://pmc.ncbi.nlm.nih.gov/articles/PMC9502752/]
- 95. Re-evaluating experimental validation in the Big Data Era [https://pmc.ncbi.nlm.nih.gov/articles/PMC7903713/]
- 96. Highly efficient and robust π-FISH rainbow for multiplexed ... [https://www.nature.com/articles/s41467-023-36137-4]
- 97. Validation of next-generation sequencing-based chimerism ... [https://www.frontiersin.org/journals/genetics/articles/10.3389/fgene.2023.1282947/full]
- 98. Comparison of the Data of a Next-Generation Sequencing ... [https://pmc.ncbi.nlm.nih.gov/articles/PMC8756135/]
- 99. Cost-effectiveness analysis comparing companion ... [https://pmc.ncbi.nlm.nih.gov/articles/PMC7489015/]
- 100. NGS Testing More Cost-Effective Than SGT in Oncology [https://www.jons-online.com/web-exclusives/ngs-testing-more-cost-effective-than-sgt-in-oncology]
- 101. Analytical Validation of the Next-Generation Sequencing ... [https://pmc.ncbi.nlm.nih.gov/articles/PMC5397672/]