Full-Length vs 3' End Counting scRNA-seq: A Comprehensive Guide for Embryo Research and Drug Development
This article provides a detailed comparative analysis of full-length and 3' end counting single-cell RNA sequencing (scRNA-seq) protocols, with a specific focus on applications in embryo research and preclinical drug...
Full-Length vs 3' End Counting scRNA-seq: A Comprehensive Guide for Embryo Research and Drug Development
Abstract
This article provides a detailed comparative analysis of full-length and 3' end counting single-cell RNA sequencing (scRNA-seq) protocols, with a specific focus on applications in embryo research and preclinical drug development. It covers the foundational principles of each method, explores their specific methodological workflows and applications in studying embryonic development and cellular heterogeneity, addresses key technical challenges and optimization strategies, and presents a rigorous validation and comparative framework. Aimed at researchers and scientists, this review synthesizes current evidence to guide protocol selection for maximizing data resolution, accuracy, and biological insights in complex systems like human embryology and tumor microenvironments.
Core Principles of scRNA-seq: Deconstructing Full-Length and 3' End Counting Protocols
The comprehensive analysis of gene expression patterns, known as the transcriptome, has become a cornerstone of modern biological research, particularly in the study of complex processes like embryonic development. The field has evolved significantly from bulk RNA sequencing (RNA-seq) methods, which profile the average gene expression of a population of cells, to sophisticated single-cell RNA sequencing (scRNA-seq) technologies that resolve transcriptional heterogeneity at the individual cell level. This technological progression has been especially transformative for embryology, where understanding the precise timing and cellular context of gene expression is critical for deciphering developmental mechanisms. Researchers now face important methodological decisions between full-length transcriptome approaches that capture complete RNA sequences and 3' end counting methods that focus on the 3' termini of transcripts for quantitative gene expression analysis. Each methodology offers distinct advantages and limitations that must be carefully considered within the context of specific research goals, sample types, and resource constraints [1] [2] [3].
The fundamental difference between these approaches lies in their scope and resolution. Bulk RNA-seq methods, including both whole transcriptome and 3' end counting protocols, provide a population-averaged view of gene expression, making them suitable for quantifying transcript abundance across entire tissues or embryos. In contrast, scRNA-seq technologies enable the dissection of cellular heterogeneity within developing embryos by capturing the transcriptomes of thousands of individual cells simultaneously, revealing rare cell populations and continuous developmental trajectories that are obscured in bulk measurements [2] [3]. This guide provides an objective comparison of these transcriptomic technologies, with a specific focus on their applications in embryonic research, supported by experimental data and methodological considerations to inform researchers' experimental design decisions.
Bulk RNA-seq Methodologies: Whole Transcriptome versus 3' End Counting
Technical Principles and Workflows
Bulk RNA-seq encompasses two primary methodological approaches: whole transcriptome sequencing and 3' end counting (3' mRNA-seq). Whole transcriptome sequencing employs random fragmentation of RNA followed by reverse transcription to generate cDNA libraries that represent the entire length of transcripts. This method provides comprehensive coverage across gene bodies, enabling the detection of alternative splicing events, novel isoforms, single nucleotide variants, and gene fusions. The workflow typically involves ribosomal RNA depletion or poly(A) selection to enrich for coding transcripts, followed by random priming, library preparation, and sequencing [1] [2].
In contrast, 3' mRNA-seq methods such as QuantSeq utilize oligo(dT) primers that bind specifically to the poly(A) tails of mRNAs, generating cDNA fragments primarily from the 3' ends of transcripts. This approach deliberately captures only one fragment per transcript molecule, resulting in a digital count of transcript abundance that is not biased by gene length. The streamlined workflow of 3' end counting methods involves fewer processing steps, making them more efficient and cost-effective for focused gene expression quantification [1] [4] [5]. The fundamental distinction in their biochemical approaches is summarized in Table 1.
Table 1: Comparison of Bulk RNA-seq Methodological Approaches
| Feature | Whole Transcriptome Sequencing | 3' End Counting (3' mRNA-seq) |
|---|---|---|
| Library Preparation | Random priming followed by RNA fragmentation | Oligo(dT) priming at poly(A) tails |
| Transcript Coverage | Uniform coverage across entire transcript | Focused on 3' untranslated region (UTR) |
| Read Distribution | Proportional to transcript length | Equal per transcript regardless of length |
| Key Steps | Poly(A) selection/rRNA depletion; random fragmentation; adapter ligation | Oligo(dT) priming; reverse transcription; PCR amplification |
| Typical Sequencing Depth | Higher (20-50 million reads/sample) | Lower (1-5 million reads/sample) |
| Information Content | Gene expression, splicing variants, mutations, novel isoforms | Gene expression quantification only |
Performance Comparison in Embryonic Systems
Experimental comparisons between these bulk RNA-seq approaches in embryonic contexts reveal distinct performance characteristics. A comprehensive study by Ma et al. (2019) directly compared traditional whole transcriptome sequencing (KAPA Stranded mRNA-Seq) with 3' end counting (Lexogen QuantSeq) in mouse liver tissue, including samples from developmental and dietary intervention studies. The research demonstrated that while both methods showed similar levels of reproducibility, the whole transcriptome approach detected more differentially expressed genes (DEGs) across all sequencing depths, benefiting from greater coverage and statistical power for longer transcripts. Conversely, 3' end counting methods demonstrated superior detection of shorter transcripts, particularly at lower sequencing depths, and showed less bias related to transcript length [5].
These findings were corroborated by a zebrafish embryo study investigating transcriptomic responses to toxicant exposure, which further revealed that the advantage of whole transcriptome sequencing in detecting more DEGs diminished under conditions of sparse data. Notably, while standard RNA-seq identified more enriched pathways when analyzing DEG lists, both methods performed similarly when conducting gene set enrichment analysis (GSEA) using all genes, suggesting that 3' end counting can capture comparable biological insights for pathway-level analyses despite detecting fewer individual DEGs [4]. The quantitative performance characteristics of these methods are summarized in Table 2.
Table 2: Performance Comparison of Bulk RNA-seq Methods in Embryonic Research
| Performance Metric | Whole Transcriptome Sequencing | 3' End Counting |
|---|---|---|
| Genes Detected | More comprehensive, especially longer transcripts | Better for short transcripts |
| DEG Detection | Higher sensitivity for detecting DEGs | Fewer DEGs detected |
| Length Bias | Significant bias toward longer transcripts | Minimal length bias |
| Reproducibility | High between biological replicates | Similarly high reproducibility |
| Pathway Analysis | More enriched functions from DEG lists | Comparable results with GSEA approach |
| Required Sequencing Depth | Higher (20-50M reads) | Lower (1-5M reads) |
| Cost Per Sample | Higher | Lower (approximately 1/10th of scRNA-seq) |
Single-Cell RNA-seq: Revolutionizing Embryonic Development Studies
Technical Approaches and Protocol Selection
Single-cell RNA sequencing (scRNA-seq) has transformed the study of embryonic development by enabling the transcriptional profiling of individual cells within complex tissues. The core technological principle involves physically separating individual cells, capturing their mRNA, reverse transcribing it to cDNA, adding cell-specific barcodes, and sequencing the resulting libraries. The 10x Genomics Chromium system has emerged as a widely adopted platform that utilizes microfluidics to partition thousands of single cells into droplets (GEMs) containing barcoded beads, enabling high-throughput scRNA-seq analysis [2] [3].
scRNA-seq protocols can be broadly categorized into two types: full-length transcript methods (e.g., Smart-Seq2, MATQ-Seq) that sequence nearly complete transcripts, and 3' or 5' end counting methods (e.g., Drop-Seq, inDrop, CEL-Seq2) that focus on transcript termini. Full-length methods provide more comprehensive information about alternative splicing, sequence variants, and RNA editing, while end-counting methods are more cost-effective for profiling large numbers of cells and are better suited for straightforward cell type identification and gene expression quantification [6]. A recent benchmarking study by the LRGASP consortium systematically evaluated long-read RNA-seq methods and found that libraries with longer, more accurate sequences produced more accurate transcripts, while greater read depth improved quantification accuracy [7].
The following diagram illustrates the core workflow and key decision points in single-cell RNA sequencing experiments:
Applications in Embryonic Development Research
scRNA-seq has proven particularly powerful for constructing comprehensive developmental atlases and understanding lineage specification during embryogenesis. A landmark study created an integrated human embryo reference by combining six published scRNA-seq datasets covering developmental stages from zygote to gastrula. This resource, comprising 3,304 early human embryonic cells, revealed continuous developmental progression with time and lineage specification, capturing the first lineage branch point where inner cell mass and trophectoderm cells diverge, followed by the bifurcation of epiblast and hypoblast lineages [8].
In mouse embryogenesis, comprehensive transcriptome analysis from embryonic day 10.5 to birth across 17 tissues demonstrated that neurogenesis and hematopoiesis dominate developmental gene expression programs, jointly accounting for one-third of differential gene expression and more than 40% of identified cell types. The integration of scRNA-seq data enabled the decomposition of whole-tissue transcriptomes into constituent cell types and revealed universal temporal drivers, including a system-wide decrease in cell proliferation machinery and early erythroid markers as development progresses [9].
The power of scRNA-seq in embryonic research lies in its ability to identify rare cell populations, reconstruct developmental trajectories, and reveal spatial organization patterns. For example, in a study of mouse embryonic stem cells, scRNA-seq identified a rare subpopulation (3 cells) highly expressing Zscan4 genes with greater differentiation potential than previously recognized [3]. Similarly, in developing limb buds, scRNA-seq profiling of 25 candidate cell types enabled the inference of lineage relationships and the extraction of cell-type-specific transcription factor networks [9].
Experimental Design and Protocol Selection Guide
Decision Framework for Method Selection
Choosing between bulk and single-cell RNA-seq approaches, and between full-length and 3' end counting methods, requires careful consideration of research objectives, sample characteristics, and practical constraints. The following decision framework provides guidance for selecting the most appropriate transcriptomic method:
Research Objectives: For discovery-focused research aiming to identify novel isoforms, splicing variants, gene fusions, or non-coding RNAs, whole transcriptome bulk RNA-seq or full-length scRNA-seq protocols are recommended. For quantitative gene expression analysis focused specifically on differential expression, 3' end counting methods (either bulk or single-cell) provide cost-effective solutions [1] [2].
Sample Characteristics: When working with degraded samples (e.g., FFPE tissues) or samples with partially degraded RNA, 3' end counting methods are advantageous due to their focus on the 3' termini of transcripts, which are more likely to be preserved. For complex tissues with high cellular heterogeneity, scRNA-seq is essential for resolving distinct cell populations [1] [3].
Practical Constraints: When processing large numbers of samples or working with limited budgets, 3' end counting methods provide significant cost advantages. For studies requiring high sample throughput, droplet-based scRNA-seq methods enable profiling of thousands of cells simultaneously. When computational resources are limited, bulk RNA-seq or 3' end counting scRNA-seq generate more manageable datasets compared to full-length scRNA-seq [3] [6].
Embryo-Specific Methodological Considerations
Embryonic samples present unique challenges for transcriptomic analysis, including limited cell numbers, rapid transcriptional changes, and complex cellular heterogeneity. For early embryonic stages with small cell numbers, methods like SMART-Seq2 with high transcript capture efficiency are advantageous. For later stages with more complex tissues, high-throughput droplet methods enable comprehensive cellular cataloging [8] [6].
The choice between full-length and 3' end counting protocols in embryonic research should consider annotation quality. Well-annotated model organisms (e.g., mouse, human) are suitable for either approach, while non-model organisms or poorly annotated systems benefit from full-length transcriptome methods that can improve genome annotations. A recent study using PacBio long-read sequencing during zebrafish embryogenesis identified 2,113 previously unannotated genes and 33,018 novel isoforms, dramatically expanding the transcriptomic landscape and highlighting the limitations of existing annotations [10].
Research Reagent Solutions and Experimental Tools
Successful transcriptomic studies require careful selection of reagents and experimental tools. The following table summarizes key solutions for embryonic transcriptomics research:
Table 3: Essential Research Reagent Solutions for Embryonic Transcriptomics
| Reagent/Tool Category | Specific Examples | Function and Application |
|---|---|---|
| Library Preparation Kits | Lexogen QuantSeq 3' mRNA-Seq, KAPA Stranded mRNA-Seq, SMART-Seq2 | Convert RNA to sequenceable libraries with specific protocol advantages |
| Single-Cell Platforms | 10x Genomics Chromium, Fluidigm C1, Dolomite Bio Nadia | Partition individual cells for scRNA-seq with varying throughput and cost |
| RNA Extraction Methods | Qiagen RNeasy, Zymo Research Quick-RNA, TRIzol | Maintain RNA integrity and preserve specific RNA species (e.g., small RNAs) |
| rRNA Depletion Kits | Illumina Ribo-Zero, Thermo Fisher Ribominus | Remove abundant ribosomal RNAs for whole transcriptome sequencing |
| Amplification Reagents | Takara Bio SMARTer PCR, NEB Next Ultra | Amplify limited cDNA from single cells or low-input samples |
| Barcode/Index Systems | Illumina TruSeq, IDT for Illumina UDI | Multiplex samples for cost-effective sequencing |
| Quality Control Tools | Agilent Bioanalyzer, Advanced Analytical Fragment Analyzer | Assess RNA integrity and library quality before sequencing |
The transcriptomic landscape in embryonic research has expanded dramatically with the development of diverse methodological approaches, each with distinct strengths and applications. Whole transcriptome methods provide comprehensive molecular information, including alternative splicing, sequence variants, and novel isoforms, making them ideal for discovery-oriented research. In contrast, 3' end counting approaches offer cost-effective, focused solutions for quantitative gene expression analysis, particularly advantageous for large-scale studies or degraded samples. The emergence of scRNA-seq technologies has further revolutionized embryonic research by enabling the decomposition of complex tissues into constituent cell types and states, revealing developmental trajectories and rare populations inaccessible to bulk methods.
Future directions in embryonic transcriptomics point toward integrated multi-omics approaches that combine transcriptomic data with epigenetic, proteomic, and spatial information. The LRGASP consortium has demonstrated the power of collaborative benchmarking efforts to establish standards and best practices [7], while the development of comprehensive reference atlases [8] [9] provides essential resources for the research community. As long-read sequencing technologies continue to mature and computational methods for data integration advance, the field moves closer to a complete understanding of the molecular mechanisms governing embryonic development, with profound implications for regenerative medicine, developmental biology, and evolutionary studies.
In the evolving field of transcriptomics, researchers face a fundamental choice between two principal methodological approaches: full-length transcript protocols and 3' end counting methods. This decision significantly impacts the depth of biological information that can be extracted from RNA sequencing experiments, influencing downstream analyses and conclusions. Full-length transcript protocols capture the entire RNA molecule, enabling comprehensive characterization of transcript isoforms, splicing variations, and structural features. In contrast, 3' end counting methods focus sequencing efforts on the transcript termini, primarily enabling gene-level quantification. As transcriptomic analyses become increasingly integrated into both basic research and clinical applications, understanding the technical capabilities, performance characteristics, and appropriate applications of these methodologies is essential for designing effective experimental strategies.
The table below summarizes key performance characteristics of full-length transcript protocols versus 3' end counting methods based on current research findings:
| Performance Metric | Full-Length Transcript Protocols | 3' End Counting Protocols |
|---|---|---|
| Gene Detection Sensitivity | Detects more differentially expressed genes overall [1] [5] | Better detection of short transcripts [1] [5] |
| Transcript Length Bias | More reads assigned to longer transcripts [5] | Equal reads regardless of transcript length [5] |
| Sequencing Depth Requirements | Higher depth required for full transcript coverage [1] | Lower sequencing depth sufficient (1-5 million reads/sample) [1] |
| Isoform Resolution | Enables identification of alternative splicing, novel isoforms, fusion genes [1] | Limited isoform resolution [1] |
| Data Analysis Complexity | Higher complexity requiring alignment, normalization, transcript concentration estimation [1] | Simplified analysis through direct read counting [1] |
| Sample Compatibility | Requires high-quality RNA; challenged by degraded samples [1] | Robust with degraded RNA (FFPE, clinical samples) [1] |
| Cost Efficiency | Higher per-sample cost due to increased sequencing requirements [1] | Cost-effective for large-scale studies [1] |
Experimental Protocols and Methodologies
Core Workflow Comparisons
The fundamental differences between these approaches begin at the library preparation stage. Full-length transcript methods typically employ random priming and RNA fragmentation, generating sequences distributed across the entire transcript [1]. This requires effective ribosomal RNA depletion or polyadenylated RNA selection prior to library preparation to prevent unnecessary sequencing of abundant ribosomal RNAs [1]. In contrast, 3' end counting methods utilize oligo(dT) priming without fragmentation, producing sequences localized specifically to the 3' ends of transcripts [1]. This streamlined approach generates one fragment per transcript, significantly simplifying both library preparation and subsequent data analysis.
Specialized Applications in Single-Cell RNA Sequencing
In single-cell transcriptomics, the full-length versus 3' end distinction remains particularly relevant. Plate-based full-length scRNA-seq protocols (SMART-Seq2, SMART-seq3, G&T-seq) provide complete transcript coverage, enabling isoform usage analysis, allelic expression detection, and identification of RNA editing events [6]. These methods demonstrate higher sensitivity in gene detection per cell but are limited in throughput [11]. Conversely, droplet-based scRNA-seq methods (Drop-Seq, inDrop, 10X Genomics) typically employ 3' end counting, allowing profiling of thousands of cells simultaneously at lower cost per cell but with reduced information about transcript structure and isoform diversity [6].
Visualizing Protocol Selection Pathways
The following diagram illustrates the decision-making process for selecting between full-length and 3' end transcript protocols:
Protocol Selection Pathway
Research Reagent Solutions: Essential Materials for Transcriptomics
The table below outlines key reagents and their functions in transcriptomic research:
| Reagent/Category | Function | Example Applications |
|---|---|---|
| Polymerase Variants | Reverse transcription with terminal transferase activity | SMART-seq protocols for template switching [11] |
| Template Switching Oligos (TSO) | Enable full-length cDNA synthesis | SMART-seq2/3 with locked nucleic acids for improved efficiency [11] |
| Unique Molecular Identifiers (UMIs) | Distinguish biological duplicates from technical PCR duplicates | Accurate transcript counting in 3' end methods and SMART-seq3 [6] [11] |
| Ribosomal Depletion Kits | Remove abundant ribosomal RNA | Total RNA-seq for capturing non-polyadenylated transcripts [1] [12] |
| NMD Inhibitors (Cycloheximide) | Stabilize transcripts undergoing nonsense-mediated decay | Detecting aberrant transcripts in clinical diagnostics [13] |
| Single-Cell Isolation Reagents | Partition individual cells for sequencing | Droplet-based (3' end) vs. plate-based (full-length) protocols [6] |
Emerging Applications and Future Directions
Clinical Diagnostic Implementation
Full-length transcript protocols are demonstrating particular value in clinical diagnostics, where comprehensive transcript characterization can resolve variants of uncertain significance. A recent study utilizing a minimally invasive RNA-seq protocol with peripheral blood mononuclear cells demonstrated successful detection of splicing defects in patients with neurodevelopmental disorders, enabling reclassification of several variants [13]. The implementation of nonsense-mediated decay inhibition through cycloheximide treatment further enhanced detection of transcripts that would otherwise be degraded, increasing the diagnostic yield [13].
Long-Read Sequencing Technologies
The emergence of long-read sequencing platforms (Nanopore, PacBio) represents a significant advancement for full-length transcriptomics. These technologies enable end-to-end sequencing of complete RNA molecules, overcoming limitations of short-read assemblies for isoform resolution [14] [15]. The Singapore Nanopore Expression (SG-NEx) project has established a comprehensive benchmark demonstrating that long-read RNA sequencing more robustly identifies major isoforms, fusion transcripts, and RNA modifications compared to short-read approaches [14]. This technological evolution is particularly transformative for exploring transcriptome complexity in human diseases, where alternative isoform expression plays critical functional roles [15].
The choice between full-length transcript protocols and 3' end counting methods remains context-dependent, dictated by specific research objectives, sample characteristics, and resource constraints. Full-length approaches provide comprehensive biological information, including isoform resolution, splicing variants, and non-coding RNA characterization, making them ideal for discovery-phase research and mechanistic studies. Conversely, 3' end counting methods offer cost-efficiency, streamlined workflows, and robustness with challenging samples, advantageous for large-scale screening and expression quantification studies. As transcriptomic technologies continue to evolve, particularly with the integration of long-read sequencing and improved single-cell methods, researchers are increasingly equipped to capture the complete RNA story across diverse biological and clinical contexts.
High-throughput transcriptomics has revolutionized the field of biological research by enabling comprehensive profiling of gene expression patterns. Within this domain, 3' end counting protocols have emerged as powerful, targeted alternatives to whole-transcriptome sequencing, particularly for large-scale quantitative studies. These methods specifically sequence the 3' terminal region of mRNA transcripts, offering distinct advantages in cost-efficiency, throughput, and analytical simplicity for gene expression quantification.
The fundamental distinction in RNA sequencing approaches lies in their transcript coverage. While traditional whole transcriptome (WTS) methods sequence fragments distributed across the entire mRNA length, 3' end counting methods deliberately target only the 3' region, generating one sequencing read per transcript [1]. This strategic focus makes 3' end counting particularly valuable for research contexts requiring precise quantification of gene expression levels across many samples, including embryonic development studies where sample numbers may be large and budgetary constraints significant.
Methodological Comparison: Whole Transcriptome vs. 3' End Counting
Fundamental Technical Differences
The core technical distinction between these approaches begins at the library preparation stage. Whole transcriptome protocols typically employ random priming and fragment the mRNA to generate sequences distributed across the entire transcript [5]. This requires effective ribosomal RNA depletion or poly(A) selection prior to library preparation to prevent capturing unnecessary ribosomal RNA sequences. Consequently, WTS workflows are generally longer and require higher sequencing depth to ensure sufficient coverage across entire transcripts [1].
In contrast, 3' end counting methods like QuantSeq utilize oligo(dT) primers that bind to the poly(A) tail, initiating cDNA synthesis from the 3' end of polyadenylated RNAs [1]. This approach generates one fragment per transcript, localizing all sequencing reads to the 3' region. The simplified workflow omits multiple steps required in traditional library preps, streamlining the process and reducing hands-on time. The 3' end counting method assigns roughly equal numbers of reads to transcripts regardless of their lengths, eliminating the length bias inherent in whole transcript approaches where longer transcripts receive more reads due to generating more fragments [5].
Table 1: Core Methodological Differences Between Sequencing Approaches
| Feature | Whole Transcriptome Sequencing | 3' End Counting |
|---|---|---|
| Library Priming | Random primers | Oligo(dT) primers targeting poly(A) tail |
| Transcript Coverage | Distributed across entire transcript | Localized to 3' end |
| Reads per Transcript | Proportional to transcript length | One fragment per transcript |
| rRNA Handling | Requires depletion prior to library prep | In-prep poly(A) selection through oligo(dT) priming |
| Workflow Complexity | Higher, multiple purification steps | Streamlined, fewer steps |
| Sequencing Depth Required | Higher (typically >20M reads/sample) | Lower (1-5M reads/sample) |
Experimental Workflow Visualization
The following diagram illustrates the key procedural differences in library preparation between these methodologies:
Performance Comparison and Experimental Evidence
Quantitative Performance Metrics
Direct comparative studies provide robust data on the performance characteristics of both methods. Research by Ma et al. (2019) systematically compared traditional whole transcriptome sequencing (using KAPA Stranded mRNA-Seq) with 3' end counting (using Lexogen QuantSeq) in mouse liver samples from animals on different dietary regimens [5]. Their findings highlight complementary strengths that inform methodological selection.
Table 2: Performance Comparison Based on Ma et al. (2019) Study [5]
| Performance Metric | Whole Transcriptome | 3' End Counting |
|---|---|---|
| Reproducibility | High, similar between methods | High, similar between methods |
| Detection of DEGs | More differentially expressed genes detected | Fewer DEGs detected, but key biological findings conserved |
| Length Bias | More reads assigned to longer transcripts | Equal reads regardless of transcript length |
| Short Transcript Detection | Less effective as sequencing depth drops | Better detection of short transcripts at lower sequencing depths |
| Mapping Rates | ~80% uniquely mapped reads | ~82% uniquely mapped reads |
| Required Sequencing Depth | Higher (22.9M reads average in study) | Lower (18.4M reads average in study) |
The 3' end counting method demonstrated particular advantages in detecting short transcripts, especially as sequencing depth decreases. When sequencing depth dropped to 5 million reads, 3' end counting detected approximately 300 more transcripts shorter than 1000 bp compared to whole transcriptome sequencing [5]. This difference became even more pronounced at 2.5 million reads, approaching a 400-transcript advantage for the 3' end approach.
Biological Concordance in Pathway Analysis
Despite detecting fewer differentially expressed genes (DEGs), 3' end counting captures essentially the same biological insights at the pathway level. In the Ma et al. study, pathway analysis of mouse livers under high iron diet conditions revealed that the top upregulated gene sets identified by whole transcriptome sequencing were consistently identified by 3' end counting, though with some variation in rank order beyond the very top hits [1].
For example, the "Response of EIF2AK1 (HRI) to Heme Deficiency" pathway ranked first in both methods. Similarly, "negative regulation of circadian rhythm" ranked second in WTS and fourth in 3' end counting, while "negative regulation of acute inflammatory response" ranked fifth in WTS and third in 3' end counting [1]. This demonstrates that while statistical power differs for individual genes, the major biological conclusions regarding affected pathways remain consistent between methods.
Protocol Selection Guide
Decision Framework
Choosing between whole transcriptome and 3' end counting methodologies depends on specific research objectives, sample characteristics, and resource constraints. The following decision framework summarizes key considerations:
Application-Specific Recommendations
Choose Whole Transcriptome Sequencing When:
- Isoform-level resolution is required for detecting alternative splicing, novel isoforms, or fusion genes [1]
- Global RNA characterization is needed, including both coding and non-coding RNA species [1]
- Working with samples lacking poly(A) tails, such as prokaryotic RNA or some highly degraded clinical samples without good 3' end preservation [1]
- Detailed transcriptional characterization is prioritized over cost considerations for smaller sample sets
Choose 3' End Counting When:
- Accurate gene expression quantification is the primary goal, especially for large-scale studies [1]
- High-throughput screening of many samples is required under budget constraints [1]
- Streamlined workflow and simpler data analysis are desirable [1]
- Working with challenging sample types including degraded RNA and FFPE specimens [1]
- Drug screening or compound testing where many treatments need profiling [16]
Advanced 3' End Counting Methodologies
Innovative Protocol Variations
Recent methodological advances have further enhanced the efficiency and reduced the costs of 3' end counting approaches. One notable innovation is BOLT-seq (Bulk transcriptOme profiling of cell Lysate in a single poT), which demonstrates the ongoing evolution of this field [16].
BOLT-seq utilizes unpurified bulk RNA in crude cell lysates, with RNA/DNA hybrids directly subjected to tagmentation. This approach omits second-strand cDNA synthesis and RNA purification steps, allowing library construction in just 2 hours of hands-on time at remarkably low cost (under US $1.40 per sample, excluding sequencing) [16]. The method has been successfully applied to cluster small molecule drugs based on their mechanisms of action and intended targets, demonstrating its utility in pharmaceutical research.
Another advanced method, 3'READS+, addresses the challenge of accurate cleavage and polyadenylation site (pAs) identification while overcoming mispriming issues that often plague 3' end sequencing [17]. This approach uses a special locked nucleic acid oligo to capture poly(A)+ RNA and remove the bulk of the poly(A) tail, generating RNA fragments with an optimal number of terminal A's that balance data quality and detection of genuine pAs. The method shows substantially improved sensitivity (over two orders of magnitude) compared to its predecessor and can work with as little as 100 ng of total input RNA [17].
Essential Research Reagent Solutions
Table 3: Key Reagents for 3' End Counting Protocols
| Reagent / Solution | Function | Protocol Examples |
|---|---|---|
| Oligo(dT) Primers | Binds to poly(A) tail to initiate cDNA synthesis from 3' end | QuantSeq [1], BOLT-seq [16] |
| Locked Nucleic Acid (LNA) Oligos | Enhanced specificity for poly(A) capture with reduced mispriming | 3'READS+ [17] |
| Tn5 Transposase | Enzyme for tagmentation (simultaneous fragmentation and tagging) | BOLT-seq [16], BRB-seq |
| 4-thiouridine (4sU) | Metabolic RNA labeling for distinguishing maternal and zygotic transcripts | scSLAM-seq [18] |
| Iodoacetamide (IAA) | Chemical derivatization for detecting labeled nucleotides in sequencing | scSLAM-seq [18] |
| M-MuLV Reverse Transcriptase | cDNA synthesis from RNA templates | BOLT-seq [16] |
3' end counting protocols represent a specialized, efficient approach for high-throughput gene expression quantification that complements rather than replaces whole transcriptome sequencing. The methodological choice fundamentally depends on research priorities: whole transcriptome sequencing provides comprehensive isoform-level data for deep transcriptional characterization, while 3' end counting offers cost-effective, streamlined quantitative profiling ideal for large-scale studies.
For embryonic development research, where sample numbers may be substantial and quantitative comparisons essential, 3' end counting methods provide particularly valuable advantages in throughput and cost-efficiency. The continuing evolution of these protocols, including innovations such as BOLT-seq and 3'READS+, further expands their utility while reducing barriers to implementation. By aligning methodological capabilities with specific research questions, scientists can optimize their experimental designs to maximize biological insights within practical constraints.
Single-cell RNA-sequencing (scRNA-seq) has revolutionized transcriptomics by enabling researchers to investigate gene expression profiles at individual cell resolution, providing unprecedented insights into cellular heterogeneity in complex biological systems [6]. This technology has become indispensable for uncovering novel and rare cell types, mapping developmental pathways, and investigating tumor diversity [6]. The key technical divergences in scRNA-seq protocols—particularly in unique molecular identifiers (UMIs), amplification methods, and transcript coverage—significantly impact data quality, quantification accuracy, and biological interpretations. Understanding these distinctions is especially critical in sensitive research contexts such as embryo development studies, where sample material is often limited [6]. This guide systematically compares these fundamental technical parameters, providing researchers with a framework for selecting appropriate methodologies based on specific research objectives in developmental biology and drug discovery.
Protocol Comparisons: Technical Specifications and Experimental Methodologies
scRNA-seq technologies diverge primarily in their transcript coverage, with two principal approaches dominating the field: full-length transcript protocols and 3' or 5' end-counting methods [6]. Full-length protocols (e.g., Smart-Seq2, MATQ-Seq, Fluidigm C1) sequence the entire transcript, enabling comprehensive analysis of isoform usage, allelic expression, and RNA editing [6]. In contrast, 3'-end counting methods (e.g., Drop-Seq, inDrop, Seq-Well) focus sequencing on the transcript's 3' end, prioritizing quantification efficiency over structural transcript information [6]. A third category, 5'-end counting methods (e.g., STRT-Seq), specifically target transcription start sites [6]. These technical categories employ different molecular mechanisms during library preparation that fundamentally influence their applications, advantages, and limitations.
Detailed Experimental Protocols
Full-Length Transcript Protocols (Smart-Seq2 Methodology): The Smart-Seq2 protocol begins with cell isolation, typically via fluorescence-activated cell sorting (FACS), followed by cell lysis and RNA release [6]. Reverse transcription employs oligo(dT) priming with template switching, effectively capturing full-length transcripts [6]. The protocol utilizes PCR amplification without UMIs, potentially introducing amplification bias but enabling detection of low-abundance transcripts through enhanced sensitivity [6]. Library preparation follows standard Illumina protocols, generating sequences that cover the entire transcript length, which is particularly advantageous for identifying splice variants and sequence polymorphisms in embryonic development studies [6].
3'-End Counting Protocols (Drop-Seq Methodology): Drop-Seq employs droplet-based microfluidics for high-throughput single-cell isolation [6]. Each droplet contains a single cell and a barcoded bead with UMIs. Cell lysis occurs within droplets, followed by reverse transcription using primers containing cell barcodes, UMIs, and poly(T) sequences [6]. The methodology employs PCR amplification and incorporates UMIs to correct for amplification bias [6]. Library preparation sequences only the 3' ends of transcripts, prioritizing quantification accuracy over structural information. This approach enables parallel processing of thousands of cells at a lower cost per cell, making it suitable for large-scale embryonic cell atlas projects [6].
UMI-Enabled Full-Length Protocols (MATQ-Seq Methodology): MATQ-Seq represents an advanced methodology that combines full-length transcript coverage with UMI-based quantification [6]. This droplet-based approach uses PCR amplification with UMIs, providing both comprehensive transcript structural information and accurate molecular quantification [6]. The protocol offers increased accuracy in quantifying transcripts and efficient detection of transcript variants, bridging the gap between quantitative accuracy and structural analysis [6].
Table 1: Comprehensive Comparison of scRNA-seq Protocols and Their Characteristics
| Protocol | Isolation Strategy | Transcript Coverage | UMI Incorporation | Amplification Method | Unique Features |
|---|---|---|---|---|---|
| Smart-Seq2 | FACS | Full-length | No | PCR | Enhanced sensitivity for low-abundance transcripts; generates full-length cDNA |
| MATQ-Seq | Droplet-based | Full-length | Yes | PCR | Increased accuracy in quantifying transcripts; efficient transcript variant detection |
| Drop-Seq | Droplet-based | 3'-end | Yes | PCR | High-throughput, low cost per cell; scalable to thousands of cells |
| inDrop | Droplet-based | 3'-end | Yes | IVT | Uses hydrogel beads; low cost per cell; efficient barcode capture |
| CEL-Seq2 | FACS | 3'-only | Yes | IVT | Linear amplification reduces bias compared to PCR |
| STRT-Seq | FACS | 5'-only | Yes | PCR | High-resolution mapping of transcription start sites |
| Fluidigm C1 | Microfluidics | Full-length | No | PCR | Precise cell handling; integrated microfluidics system |
Unique Molecular Identifiers (UMIs): Principles, Applications, and Analysis Methods
Theoretical Foundations of UMIs
Unique Molecular Identifiers are random oligonucleotide barcodes incorporated into individual RNA molecules before PCR amplification, enabling distinction between identical copies arising from distinct molecules versus those generated through PCR amplification of the same molecule [19]. This molecular barcoding system fundamentally addresses the critical challenge of amplification bias in scRNA-seq, where the minimal starting material requires substantial amplification, potentially distorting true biological expression patterns [20]. UMIs function as molecular counters, with each original molecule receiving a unique barcode that is propagated through all amplification cycles, allowing bioinformatic correction of technical duplication events [19]. The theoretical foundation rests on probability theory, where a sufficient diversity of UMI sequences (4^n, where n is UMI length) ensures minimal collision probability, thereby guaranteeing that nearly every original molecule receives a unique identifier.
UMI Error Correction Methodologies
Sequencing errors in UMI sequences represent a significant challenge, potentially creating artifactual UMIs that inflate molecular counts [19]. Network-based methods have been developed to account for these errors:
Directional Method: This approach constructs networks where nodes represent UMIs and directional edges connect nodes a single edit distance apart when the count of the putative parent UMI is significantly higher (na ≥ 2nb − 1) than the putative child UMI [19]. This method leverages the observation that UMI errors typically produce lower-count daughter sequences, enabling directional correction that preserves true biological variation while removing technical artifacts [19].
Adjacency Method: This method resolves complex UMI networks by iteratively removing the most abundant node and all nodes connected to it, repeating until all network nodes are accounted for [19]. The number of removal steps corresponds to the estimated number of unique molecules, effectively resolving amplification and sequencing artifacts while preserving true molecular diversity [19].
Cluster Method: The simplest approach merges all UMIs within a network separated by a single edit distance, retaining only the UMI with the highest counts [19]. While computationally efficient, this method may underestimate true molecular diversity in complex networks where multiple similar UMIs represent distinct biological molecules [19].
Table 2: Performance Comparison of UMI Error Correction Methods
| Method | Principle | Advantages | Limitations | Suitable Applications |
|---|---|---|---|---|
| Directional | Directional networks based on count disparities | High accuracy in distinguishing true molecules from errors; preserves true biological variation | Computationally intensive; requires sufficient sequencing depth | High-precision quantification; low-expression genes |
| Adjacency | Iterative removal of most abundant nodes and neighbors | Handles complex networks better than cluster method; reasonable computational load | May over-collapse similar but distinct UMIs | Standard scRNA-seq experiments; balanced performance |
| Cluster | Merging all UMIs within edit distance threshold | Computational efficiency; simple implementation | Underestimates diversity in complex networks | High-expression genes; initial exploratory analysis |
| Unique | Assumes each UMI represents a distinct molecule | Maximum sensitivity | Highly inflated counts due to UMI errors | Not recommended for accurate quantification |
| Percentile | Removes UMIs below count threshold | Simple threshold-based approach | Arbitrary threshold; may remove true low-expression molecules | Limited to specific applications with clear count thresholds |
Impact of UMIs on Statistical Modeling
The incorporation of UMIs fundamentally alters the statistical properties of scRNA-seq data. Read counts without UMIs exhibit distinct bimodal distributions with excessive zeros, requiring zero-inflated negative binomial (ZINB) models that separately model zero counts and non-zero counts [20]. In contrast, UMI-count data follows simpler unimodal distributions, with the negative binomial model providing a good approximation even in heterogeneous cell populations [20]. Comparative analyses reveal that while no genes measured with UMI counts preferred the ZINB model over the negative binomial model, significant percentages of genes (9.4–34.5%) from the same datasets rejected the negative binomial model in favor of ZINB when measured in read counts [20]. This statistical simplification has profound implications for differential expression analysis, enabling more robust identification of true biological effects with reduced false discovery rates.
Amplification Methods: Technical Principles and Implications
PCR-Based Amplification
Polymerase chain reaction (PCR) amplification represents the most common amplification method in scRNA-seq protocols, utilized by full-length methods such as Smart-Seq2, Quartz-Seq2, and MATQ-Seq, as well as 3'-end counting methods including Drop-Seq [6]. PCR amplification employs multiple temperature cycles to exponentially amplify cDNA fragments, providing high sensitivity and requiring relatively low input material [6]. However, this method introduces sequence-dependent amplification biases, where certain transcripts amplify more efficiently than others due to variations in GC content, secondary structure, or length [20]. These biases can distort true expression ratios, particularly for low-abundance transcripts, potentially confounding biological interpretations in sensitive applications such as embryonic cell typing. The incorporation of UMIs significantly mitigates these biases by enabling computational correction of amplification duplication events [19].
In Vitro Transcription (IVT) Amplification
In vitro transcription (IVT) represents an alternative linear amplification approach employed by protocols such as CEL-Seq2 and inDrop [6]. This method utilizes T7 or other RNA polymerase promoters incorporated during reverse transcription, followed by amplification through multiple rounds of RNA synthesis [6]. IVT provides more uniform coverage and reduced amplification bias compared to PCR-based methods, as it avoids sequence-dependent efficiency variations inherent in temperature cycling [6]. However, IVT protocols typically exhibit lower sensitivity for detecting low-abundance transcripts and require more complex laboratory workflows [6]. The linear nature of IVT amplification makes it particularly suitable for quantitative applications where preservation of expression ratios is prioritized over maximum sensitivity.
Transcript Coverage: Biological Implications and Technical Trade-offs
Full-Length vs. 3'-End Counting: Experimental Comparisons
The choice between full-length and 3'-end transcript coverage represents a fundamental trade-off between informational completeness and quantitative scalability. Experimental comparisons using identical biological samples reveal that full-length methods (traditional whole transcriptome sequencing) detect more differentially expressed genes across varying sequencing depths [5]. This enhanced detection power stems from more uniform transcript coverage, which provides greater statistical confidence in expression quantification, particularly for longer transcripts [5]. Whole transcript methods assign more reads to longer transcripts, naturally providing greater power for detecting expression changes in these genes [5]. In contrast, 3'-end counting methods assign roughly equal numbers of reads to transcripts regardless of length, eliminating length bias but reducing statistical power for longer transcripts [5].
Applications in Embryo Development Research
In embryo development studies, where material is often extremely limited, protocol selection must balance analytical depth with practical constraints. Full-length protocols excel in identifying isoform switches during embryonic development, detecting allele-specific expression patterns in early embryogenesis, and discovering novel transcripts in developing tissues [6]. These capabilities are crucial for understanding the complex regulatory networks that guide embryonic patterning and cell fate decisions. Conversely, 3'-end counting methods enable comprehensive cellular atlas projects of embryonic tissues by profiling thousands of individual cells, effectively capturing the cellular heterogeneity present in developing systems [6]. Emerging methods like SDR-seq further enhance these capabilities by enabling simultaneous profiling of genomic DNA variants and transcriptomes in the same cell, powerfully linking genotype to phenotype in developmental contexts [21].
Impact on Transcript Detection Sensitivity
Transcript coverage methodology significantly impacts detection sensitivity for different transcript categories. The 3'-end counting methods demonstrate superior detection of short transcripts, recovering approximately 10% more transcripts shorter than 1000 bp compared to whole transcript methods at reduced sequencing depths [5]. This advantage diminishes as sequencing depth increases, with both methods achieving similar detection rates at high coverage [5]. For longer transcripts (>3000 bp), whole transcript methods maintain consistent detection advantages across all sequencing depths, leveraging their inherent length proportionality for enhanced sensitivity [5]. These differential sensitivity profiles should guide protocol selection based on the specific transcript classes of interest in embryonic development research.
Visualization of Experimental Workflows and Decision Pathways
scRNA-seq Experimental Workflow
Diagram 1: scRNA-seq Experimental Workflow and Protocol Divergence. This diagram illustrates the core experimental workflow for scRNA-seq, highlighting the key decision point where protocols diverge into full-length versus 3' end-counting methodologies, each with distinct technical characteristics and applications [6].
UMI Error Correction Decision Pathway
Diagram 2: UMI Error Correction Decision Pathway. This diagram outlines the computational decision process for correcting sequencing errors in UMI sequences, which is critical for accurate molecular quantification in scRNA-seq experiments [19].
The Scientist's Toolkit: Essential Research Reagent Solutions
Table 3: Essential Research Reagents and Their Applications in scRNA-seq
| Reagent/Category | Function | Protocol Applications | Technical Considerations |
|---|---|---|---|
| Oligo(dT) Primers | Reverse transcription priming; poly(A) RNA selection | Universal in scRNA-seq protocols | Efficiency impacts transcript capture; modified primers enable template switching |
| Template Switching Oligos | Enable full-length cDNA synthesis; add universal sequences | Smart-Seq2 and other full-length protocols | Critical for 5' complete coverage; requires reverse transcriptase with terminal transferase activity |
| UMI Barcoded Beads | Cell barcoding; molecular indexing; cell isolation | Drop-Seq, inDrop, 10x Genomics | Barcode diversity determines multiplexing capacity; UMI length affects error rates |
| Cell Fixatives (PFA/Glyoxal) | Nucleic acid preservation; cell membrane permeabilization | SDR-seq, fixed sample protocols | Glyoxal preserves RNA quality better than PFA by avoiding cross-linking [21] |
| Multiplex PCR Reagents | Targeted amplification of genomic DNA and RNA | SDR-seq, targeted scRNA-seq | Polymerase fidelity impacts variant calling; amplification efficiency affects coverage uniformity [21] |
| Polymerase Enzymes | cDNA amplification; library amplification | All scRNA-seq protocols | High-processivity enzymes improve full-length coverage; thermostable enzymes enable high-temperature reverse transcription |
| Spike-in RNA Controls | Quantification standards; technical variation assessment | All quantitative scRNA-seq protocols | Enable molecular counting; require species-specific exclusion during alignment |
The technical divergences in UMIs, amplification methods, and transcript coverage across scRNA-seq protocols present researchers with strategic decisions that fundamentally influence experimental outcomes in embryo development studies. Full-length transcript protocols with UMI incorporation (e.g., MATQ-Seq) provide the most comprehensive molecular information, enabling simultaneous isoform detection and accurate quantification—particularly valuable for investigating the complex transcriptional dynamics of embryonic development [6]. For large-scale embryonic cell atlas projects requiring high throughput, 3'-end counting methods with UMIs (e.g., Drop-Seq) offer superior scalability while maintaining quantification accuracy [6]. The emerging integration of single-cell DNA and RNA sequencing (SDR-seq) further expands these capabilities, enabling direct linkage of genomic variants to transcriptional phenotypes in developing systems [21]. Protocol selection should be guided by specific research questions, with full-length methods preferred for characterizing transcriptional complexity and 3'-end methods optimized for comprehensive cellular cataloging in embryonic tissues. As single-cell technologies continue evolving, these fundamental technical parameters will remain central to experimental design in developmental biology and therapeutic discovery.
In embryo research, the choice of transcriptomic analysis protocol is not merely a technical decision but a biological imperative that directly dictates the depth, accuracy, and scope of developmental insights achievable. As stem cell-based embryo models become increasingly sophisticated tools for studying early human development, the selection between full-length transcript and 3' end counting methods carries significant implications for how researchers characterize cellular identity, lineage specification, and developmental potential. This guide provides an objective comparison of these competing approaches, examining their performance characteristics, technical requirements, and optimal applications within embryo research to inform evidence-based experimental design.
Methodological Foundations: How Transcriptomic Protocols Work
Full-Length Transcript Sequencing
Full-length transcript sequencing, often called Whole Transcriptome Sequencing (WTS), captures the complete sequence of RNA molecules, providing a comprehensive view of the transcriptome. In this approach, mRNA is typically fragmented randomly before reverse transcription, generating cDNA fragments that represent the entire transcript length [1]. Sequencing reads are then distributed across the complete transcript, enabling detection of splice variants, isoform-specific expression, nucleotide polymorphisms, and fusion events [22]. Common implementations include SMART-seq-based protocols that employ oligo-dT priming followed by template switching to capture full-length transcripts, with plate-based methods remaining dominant for applications requiring high gene detection sensitivity per cell [11].
3' End Counting Methods
3' end counting methods, such as 3' mRNA-Seq (e.g., QuantSeq), employ a fundamentally different strategy focused specifically on the 3' termini of transcripts. Rather than fragmenting RNA, these methods use reverse transcription primed by oligo-dT primers that bind to the poly(A) tail, generating cDNA from only the 3' end of each transcript [1] [22]. This approach generates one sequencing read per transcript molecule, with reads localized predominantly to the 3' untranslated region (3' UTR), enabling quantitative gene expression counting without bias toward transcript length [22]. Advanced versions like 3'READS+ incorporate locked nucleic acid (LNA) oligos to improve poly(A)+ RNA capture and address internal priming artifacts [17].
Performance Comparison: Experimental Data and Benchmarking
Detection Sensitivity and Transcript Length Bias
Comparative studies reveal fundamental differences in how these protocols detect transcripts of varying lengths. In a direct comparison using mouse liver RNA, traditional whole transcript methods assigned more reads to longer transcripts, with median read counts increasing with transcript length, while 3' RNA-Seq methods generated roughly equal numbers of reads regardless of transcript length [22]. This length bias in full-length protocols translates to differential detection sensitivity, with 3' methods detecting more short transcripts as sequencing depth decreases—approximately 300-400 more transcripts shorter than 1000 bp at 2.5-5 million read depth [22].
Differential Expression and Gene Set Enrichment
When evaluating differential expression, whole transcriptome methods typically detect more differentially expressed genes across all sequencing depths [22]. However, despite detecting fewer genes, 3' mRNA-Seq reliably captures the majority of key differentially expressed genes and produces highly similar biological conclusions at the pathway and gene set enrichment level [1]. In a study of murine liver response to iron diet, both methods identified identical top upregulated gene sets, though with some ranking variations for less significant categories [1].
Table 1: Quantitative Performance Comparison Between Sequencing Approaches
| Performance Metric | Full-Length Transcript | 3' End Counting |
|---|---|---|
| Read Distribution | Uniform coverage across transcript | Heavy 3' UTR bias |
| Length Bias | More reads to longer transcripts | Equal reads regardless of length |
| Short Transcript Detection | Lower sensitivity, especially at reduced depth | Detects ~300-400 more short transcripts at 2.5M reads |
| Differentially Expressed Genes | Detects more DEGs | Fewer DEGs detected |
| Pathway Analysis Concordance | High similarity in biological conclusions | Captures majority of key pathways |
| Reproducibility | Similar levels between methods | Similar levels between methods |
| Required Sequencing Depth | Higher (typically >20M reads) | Lower (1-5M reads sufficient) |
Technical Reproducibility and Implementation Considerations
Both methods demonstrate similar levels of reproducibility between biological replicates [22]. However, they differ significantly in workflow complexity and resource requirements. Full-length methods typically involve more complex library preparation with rRNA depletion or poly(A) selection steps, while 3' end methods feature streamlined workflows that are particularly advantageous for large sample numbers or challenging material like FFPE samples [1]. For single-cell applications, plate-based full-length methods like G&T-seq and SMART-seq3 provide the highest gene detection per cell but require more technical expertise and processing time compared to droplet-based methods [11].
Table 2: Technical and Practical Implementation Considerations
| Implementation Factor | Full-Length Transcript | 3' End Counting |
|---|---|---|
| Library Prep Complexity | Higher (rRNA depletion/polyA selection) | Lower (streamlined workflow) |
| Hands-on Time | More extensive | Minimal |
| Cost per Sample | Higher | Lower |
| Sample Multiplexing Capacity | Lower | Higher |
| Suitability for Degraded RNA | Poorer performance | Better performance |
| Annotation Dependence | Standard annotations sufficient | Requires well-curated 3' annotation |
| Ideal Sample Number | Smaller studies (<50 samples) | Large-scale studies (>100 samples) |
| Data Analysis Complexity | Higher (alignment, normalization) | Lower (straightforward read counting) |
Application to Embryo Research: Specific Considerations and Use Cases
Characterizing Early Development and Lineage Specification
In embryo research, full-length transcript sequencing enables comprehensive characterization of isoform switching and alternative splicing events that are critical during early development [8]. When building reference atlases of human embryogenesis from zygote to gastrula stages, the ability to resolve complete transcript structures provides essential information about lineage-specific isoforms and regulatory mechanisms [8]. The comprehensive nature of full-length data makes it particularly valuable for identifying novel transcripts, fusion genes, and nucleotide variants that may underlie developmental disorders [1].
Large-Scale Screening and Quantitative Expression Studies
For large-scale screening studies evaluating multiple embryo models or experimental conditions, 3' end counting offers a cost-effective alternative that maintains quantitative accuracy for gene expression comparisons [1]. When the primary research question focuses on quantitative expression differences rather than transcriptomic complexity, the streamlined workflow and reduced sequencing requirements of 3' methods enable higher throughput while maintaining statistical power [22]. This makes 3' approaches particularly suitable for time-course studies of embryo development, drug screening applications, and quality assessment of multiple stem cell-based embryo models [1].
Essential Research Reagent Solutions
Table 3: Key Research Reagents and Their Applications in Embryo Transcriptomics
| Reagent/Kit | Protocol Type | Primary Application in Embryo Research |
|---|---|---|
| SMART-seq HT Kit | Full-length transcript | High-sensitivity single-cell profiling of embryo models |
| Lexogen QuantSeq 3' mRNA-Seq | 3' end counting | High-throughput screening of multiple embryo conditions |
| NEBnext Single Cell/Low Input RNA | Full-length transcript | Library prep from limited embryonic material |
| G&T-seq Protocol | Full-length transcript | Parallel genome and transcriptome analysis of single cells |
| 3'READS+ Method | 3' end counting | Accurate polyadenylation site mapping in embryonic transcripts |
| SMART-seq3 | Full-length with UMIs | Absolute transcript counting in single embryonic cells |
Experimental Design Guidelines for Embryo Research
Protocol Selection Framework
Choosing between full-length and 3' end counting methods requires careful consideration of research objectives, sample characteristics, and resource constraints. The following decision framework provides guidance for embryo researchers:
Choose Full-Length Transcript Sequencing When: Studying alternative splicing or isoform regulation during embryonic development; characterizing novel transcripts or fusion genes; working with non-model organisms with incomplete 3' annotations; requiring comprehensive transcriptome characterization for lineage tracing [1] [8].
Choose 3' End Counting When: Conducting large-scale expression screening across many samples or conditions; working with partially degraded RNA from challenging sample types; focusing primarily on differential expression quantification; requiring cost-effective profiling with lower sequencing depth; possessing well-annotated 3' transcript references for the studied organism [1] [22].
Quality Control and Experimental Validation
Regardless of protocol choice, rigorous quality control is essential for generating reliable embryo research data. For full-length methods, assess coverage uniformity across transcripts and check for 5' bias. For 3' end counting, verify mapping rates to 3' regions and confirm adequate annotation of transcript end sites. Technical validation using orthogonal methods (e.g., qPCR for expression, RNA-FISH for spatial localization) remains crucial, particularly for novel findings or when working with innovative stem cell-based embryo models [23] [8].
The choice between full-length transcript and 3' end counting protocols represents a fundamental strategic decision that shapes the biological insights achievable in embryo research. Full-length methods provide comprehensive transcriptome characterization essential for discovering isoform diversity and regulatory complexity, while 3' approaches offer quantitative precision and practical efficiency for expression-focused studies. As embryo models increase in sophistication and scale, matching protocol capabilities to research objectives becomes increasingly critical for advancing our understanding of human development. By selecting methods aligned with specific experimental goals and accounting for technical considerations outlined in this guide, researchers can optimize their experimental designs to extract maximum biological insight from precious embryonic materials.
Protocols in Action: Application of scRNA-seq Methods in Embryo and Disease Research
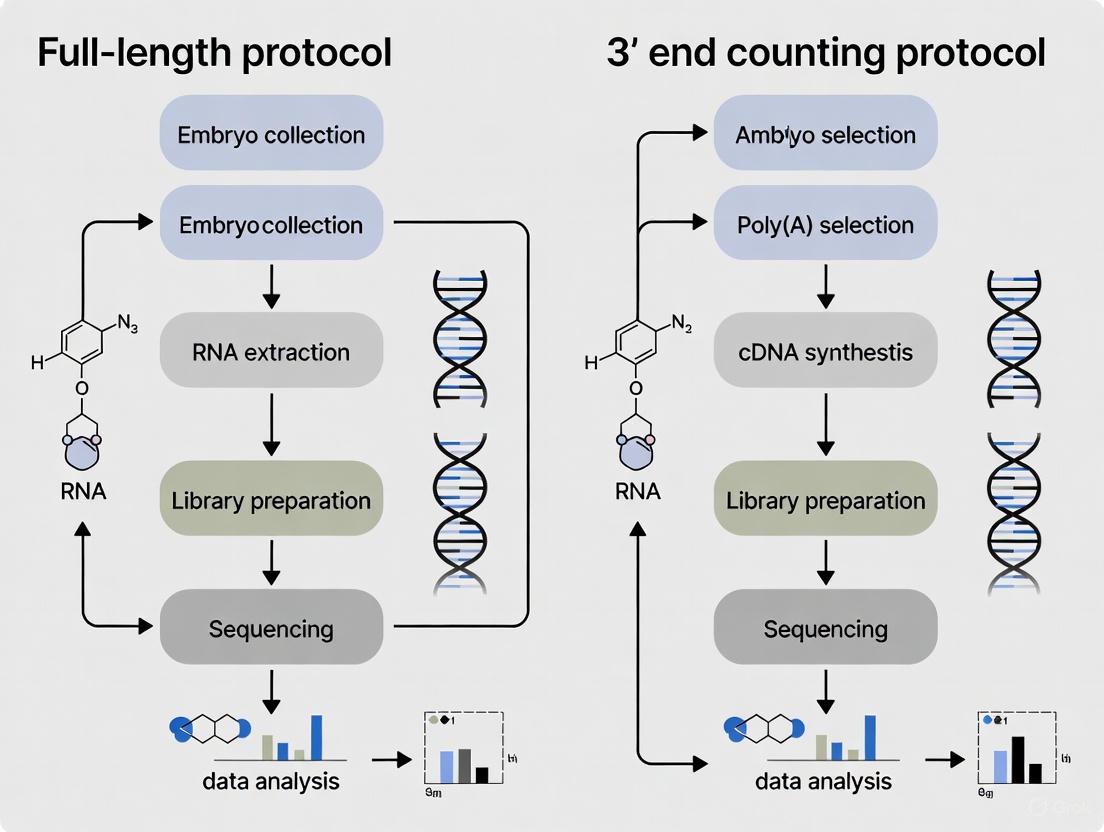
In the study of embryonic development and cellular heterogeneity, the choice of RNA sequencing protocol is pivotal. The fundamental division lies between full-length transcript and 3' end counting methodologies, each with distinct advantages, limitations, and workflow implications [1]. Full-length transcript protocols, including both short-read and long-read approaches, aim to sequence RNA fragments across the entire transcript, enabling the discovery of novel isoforms, fusion genes, and alternative splicing events [24] [14]. In contrast, 3' end counting methods, such as QuantSeq, streamline the process by sequencing only the 3' end of transcripts, providing a digital count of mRNA molecules that is unaffected by transcript length and is ideal for accurate, cost-effective gene expression quantification [1] [5]. This guide provides an objective, data-driven comparison of these workflows—from initial cell isolation to final library preparation—to inform researchers and drug development professionals selecting the optimal protocol for their specific experimental goals within embryology and beyond.
Protocol Workflows: A Step-by-Step Breakdown
Cell Isolation and Lysis
The initial steps are largely consistent across most scRNA-seq protocols, with plate-based methods being essential for full-length transcript analysis and droplet-based methods often used for 3' end counting in high-throughput applications [25].
- Plate-Based Techniques (Common for Full-Length): Single cells are plated individually into tubes or each well of a PCR plate, often via fluorescence-activated cell sorting (FACS). This method allows for processing of hundreds of cells in parallel and enables additional protocols on the same cell, such as FACS surface marker quantification [25].
- Droplet-Based Techniques (Common for 3' End Counting): Cells are encapsulated into oil-emulsion droplets within a flow chamber, with one cell per droplet. This method allows for the preparation of thousands of cells in a single batch but typically precludes full-length transcript sequencing [25].
- Lysis: Following isolation, cells are lysed to release RNA. The lysate contains the full cellular RNA content, which becomes the input for the subsequent reverse transcription and library preparation steps.
Library Preparation: Core Methodologies
The library preparation process is where the two protocols diverge significantly, defining their ultimate capabilities and biases. The table below summarizes the key differences in their final library characteristics.
Table 1: Characteristic Differences in Final Sequencing Libraries
| Characteristic | Full-Length Transcript Protocols | 3' End Counting Protocols |
|---|---|---|
| Transcript Coverage | Uniform coverage across the entire transcript [5] | Reads localized preferentially to the 3' end [1] [5] |
| Bias Related to Transcript Length | Longer transcripts generate more fragments/reads [5] | One fragment per transcript, independent of length [5] |
| Information Obtained | Gene expression, alternative splicing, novel isoforms, fusion genes [1] | Gene expression quantification [1] |
| Required Sequencing Depth | High (e.g., >20 million reads/sample) [1] | Low (e.g., 1-5 million reads/sample) [1] |
The following diagram illustrates the foundational biochemical workflows that lead to these different outcomes.
Full-Length Transcript Protocols
Full-length protocols are designed to convert entire RNA molecules into sequenceable cDNA libraries. A prominent example is the SMART-seq (Switching Mechanism at the 5' end of RNA Template) technology, which is utilized in commercial kits like those from Takara and NEB, as well as in non-commercial methods like G&T-seq and SMART-seq3 [25].
- Poly(A) Selection and Reverse Transcription: mRNA is primed using an oligo-d(T) primer. The primed mRNA is reverse transcribed by M-MLV reverse transcriptase, which exhibits terminal transferase activity, adding non-templated cytosines to the 3' end of the cDNA [25].
- Template Switching: A template switching oligo (TSO) containing ribo-guanosines at its 3' end anneals to the non-templated cytosines. This allows the reverse transcriptase to "switch" templates and continue replicating the TSO sequence, thereby ensuring the cDNA contains both the 5' and 3' ends of the original mRNA [25]. Kits like Takara's SMART-seq HT and the G&T protocol use a TSO with a locked nucleic acid (LNA) to improve annealing efficiency and transcript capture [25].
- cDNA Amplification and Library Preparation: The full-length cDNA is then PCR-amplified. For sequencing on Illumina platforms, the amplified cDNA is typically fragmented and tagged with sequencing adapters in a subsequent library preparation step, such as with the Nextera XT kit [25].
3' End Counting Protocols
3' end counting protocols, such as Lexogen's QuantSeq, significantly simplify the workflow by focusing sequencing efforts on the 3' terminus of transcripts [1].
- Reverse Transcription: The process starts with an initial oligo(dT) primer that binds to the poly(A) tail of mRNAs. This primes the reverse transcription reaction, which generates cDNA from the 3' end of the transcripts. This streamlined approach generates one cDNA fragment per transcript [1] [5].
- Library Preparation: The resulting cDNA, which corresponds to the 3' end of the genes, is then directly used for library construction. This omits several steps required in full-length protocols, such as fragmentation and random priming, leading to a faster and more robust workflow that is particularly suitable for degraded samples like FFPE material [1].
Performance Comparison: Quantitative Experimental Data
Direct comparisons of these methods reveal how their fundamental differences translate into practical performance metrics.
Detection Sensitivity and Bias
A study by Ma et al. (2019) directly compared a traditional whole transcript method (KAPA) to a 3' end method (Lexogen QuantSeq) using mouse liver RNA, providing clear experimental evidence of their relative strengths and weaknesses [5].
Table 2: Experimental Performance Comparison (Ma et al., 2019)
| Performance Metric | Whole Transcript (KAPA) | 3' End (QuantSeq) |
|---|---|---|
| Reads Assigned to Long Transcripts | More reads assigned to longer transcripts [5] | Roughly equal reads per transcript, independent of length [5] |
| Detection of Short Transcripts | Less effective at lower sequencing depths [5] | Detected more short transcripts as sequencing depth dropped [5] |
| Differentially Expressed Genes (DEGs) | Detected more DEGs [1] [5] | Detected fewer DEGs, but key biological conclusions were consistent [1] |
| Reproducibility | Similar levels of reproducibility between biological replicates [5] | Similar levels of reproducibility between biological replicates [5] |
Functional Enrichment and Pathway Analysis
While whole transcript methods often detect a greater number of DEGs, studies show that 3' end methods reliably capture the major biological signals. A reanalysis of the Ma et al. dataset demonstrated that among the top 15 upregulated gene sets identified by the whole transcript method, the 3' method captured all of them, though with some shifts in rank order for lower-priority pathways [1]. This indicates that for pathway and gene set enrichment analysis, both methods can lead to highly similar biological conclusions, with the whole transcript method offering marginally greater sensitivity for secondary inferences [1].
Performance in Challenging Conditions
The robustness of 3' end counting shines in specific challenging experimental scenarios.
- Sparse Data and Low-Input Samples: A 2023 study on zebrafish found that the advantage of standard RNA-seq in identifying more DEGs and functionally enriched pathways disappeared under conditions of sparse data, making 3' RNA-seq a robust alternative when sequencing depth is limited [4].
- Degraded Samples: 3' mRNA-seq is often the preferred method for profiling mRNA expression from degraded RNA and challenging sample types like FFPE (Formalin-Fixed Paraffin-Embedded) due to its streamlined and robust library preparation protocol [1].
- Non-Model Species: The requirement for a well-curated 3' annotation is a critical consideration. For non-model organisms with insufficient 3' annotation, mapping rates can be low, making standard RNA-seq a better option in such cases [1] [26].
The Scientist's Toolkit: Essential Research Reagents
Selecting the right reagents and kits is fundamental to a successful transcriptomics experiment. The following table details key solutions used in the protocols discussed.
Table 3: Key Research Reagent Solutions
| Reagent/Kit | Protocol Type | Primary Function |
|---|---|---|
| SMART-seq HT Kit (Takara) | Full-Length, Plate-based | Single-tube RT and cDNA amplification for full-length scRNA-seq, minimizing hands-on time [25]. |
| NEBnext Single Cell/Low Input RNA Library Prep Kit (NEB) | Full-Length, Plate-based | Converts RNA to sequencing-ready cDNA libraries for Illumina, includes all enzymes and buffers [25]. |
| QuantSeq 3' mRNA-Seq Kit (Lexogen) | 3' End Counting | Provides a streamlined method for 3' digital gene expression profiling with low sequencing depth requirements [1] [5]. |
| KAPA Stranded mRNA-Seq Kit | Full-Length, Traditional | Prepares whole transcriptome libraries from purified mRNA; used as a traditional benchmark in comparative studies [5]. |
| Nextera XT DNA Library Preparation Kit (Illumina) | Library Prep (Tagmentation) | Used for final library preparation from amplified cDNA in protocols like Takara's SMART-seq, adding Illumina sequencing adapters [25]. |
| Template Switching Oligo (TSO) | Full-Length, Biochemistry | Critical for SMART-seq methods; ensures capture of complete 5' ends of transcripts during reverse transcription [25]. |
| Unique Molecular Identifiers (UMIs) | Both (some protocols) | Short random nucleotide sequences that tag individual mRNA molecules to correct for PCR amplification bias and enable absolute molecule counting [25]. |
The choice between full-length and 3' end counting protocols is not a matter of one being universally superior, but rather of matching the technology to the research question and experimental constraints.
- Choose Full-Length Transcript Sequencing if: Your research requires a global view of the transcriptome, including the discovery of novel isoforms, alternative splicing events, fusion genes, or the analysis of non-coding RNAs. This is the preferred method for in-depth mechanistic studies on a smaller number of samples where the higher cost and sequencing depth are justifiable [1] [24] [14].
- Choose 3' End Counting if: The primary goal is accurate and cost-effective gene expression quantification for a large number of samples, such as in high-throughput screening, large-scale cohort studies, or when working with challenging, degraded samples like FFPE. Its simplicity, robustness, and lower sequencing cost per sample make it highly efficient for these applications [1] [4].
For the field of embryonic development, this means that 3' end counting is excellent for mapping expression dynamics across many embryos or time points, while full-length sequencing is indispensable for unraveling the complex regulatory landscape of splicing and isoform usage that governs development.
Single-cell RNA sequencing (scRNA-seq) has revolutionized biomedical research by enabling the dissection of gene expression at the fundamental unit of biology—the individual cell [27]. The choice of scRNA-seq protocol profoundly influences the biological questions one can address, as these technologies differ dramatically in their core mechanics and the information they capture [28]. Primarily, scRNA-seq methods fall into two categories: full-length transcript protocols and 3'-end counting protocols.
Full-length transcript sequencing approaches, such as Smart-seq2 and MATQ-seq, aim to capture and sequence the entire transcript. This allows for the investigation of alternative splicing, allelic expression, and single-nucleotide polymorphisms, providing a deeper, more qualitative view of the transcriptome [28] [29]. In contrast, 3'-end counting protocols, including Drop-seq and 10x Genomics Chromium, focus on quantifying gene expression levels by capturing just the 3' ends of transcripts and using Unique Molecular Identifiers (UMIs) to count individual molecules with high precision [30] [28]. This method excels in quantitative accuracy and profiling thousands of cells in parallel, making it ideal for discovering cellular heterogeneity and identifying rare cell types [30].
This guide provides an objective, data-driven comparison of these four prominent scRNA-seq protocols—Smart-seq2, MATQ-seq, Drop-seq, and 10x Genomics—to help researchers select the most appropriate technology for their specific research context, particularly in studies comparing full-length versus 3' end counting approaches.
The table below provides a consolidated, data-driven overview of the core features and performance metrics of the four scRNA-seq protocols based on published comparative studies.
Table 1: Direct Comparison of scRNA-seq Protocol Performance and Characteristics
| Feature | Smart-seq2 | MATQ-seq | Drop-seq | 10x Genomics Chromium |
|---|---|---|---|---|
| Protocol Category | Full-length, plate-based | Full-length, plate-based | 3'-end counting, droplet-based | 3'-end counting, droplet-based |
| Throughput (Cells) | Hundreds [11] | Hundreds | Thousands [31] | Thousands (500-20,000 per sample) [32] |
| Sensitivity (Genes/Cell) | High (~4,000-9,000 detected in mESCs) [33] | Very High (Outperforms Smart-seq2 for low-abundance genes) [28] | Moderate (~2,500 genes) [31] | High (~3,000 genes) [31] |
| Quantification Basis | TPM (Transcripts Per Kilobase Million) [30] | Read Counts / UMIs [28] | UMI Counts [31] | UMI Counts [30] |
| UMI Usage | No [28] | Yes [28] | Yes [31] | Yes [30] |
| Key Strengths | High gene detection; Splicing/isoform analysis [29] | Superior for low-abundance genes; High sensitivity [28] | Lower cost per cell; Open-source platform [31] | High sensitivity & cell throughput; User-friendly commercial system [31] |
| Primary Limitations | High mitochondrial gene proportion; More expensive per cell [30] | Protocol complexity | Lower sensitivity and higher technical noise [31] | Higher cost per experiment [31] |
| Ideal Application | Isoform detection, mutation analysis, lowly expressed genes | Maximizing gene detection, especially for low-abundance transcripts | Large-scale cell population studies with budget constraints | Large-scale cohort studies, rare cell type identification, standard gene expression |
Detailed Protocol Methodologies and Experimental Data
Full-Length Transcript Protocols: Smart-seq2 and MATQ-seq
Smart-seq2 is one of the most widely used full-length scRNA-seq protocols due to its high sensitivity and robustness [30] [29]. Its methodology relies on the switching mechanism at the 5' end of the RNA template (SMART). The process begins with reverse transcription of polyadenylated RNA using an oligo-dT primer. The reverse transcriptase enzyme, often M-MLV, adds a few non-templated cytosines to the 3' end of the cDNA. A template-switching oligo (TSO) with riboguanosines at its 3' end then binds to this C-rich overhang, allowing the reverse transcriptase to switch templates and copy the TSO sequence. This mechanism ensures that the complete cDNA fragment is flanked by known primer binding sites, enabling efficient PCR amplification [11]. A key advantage of Smart-seq2 is its high sensitivity, allowing it to detect more genes per cell than many other protocols, including droplet-based methods [30] [33]. However, it typically captures a higher proportion of reads from mitochondrial genes, which can sometimes indicate more thorough cell lysis but may also reflect cell quality [30].
MATQ-seq (Multiple Annealing and dC-Tailing-based Quantitative scRNA-seq) was developed to achieve even higher sensitivity, particularly for low-abundance transcripts [28] [34]. The protocol involves several key steps. First, RNA is reverse transcribed using a poly(dT) primer. Second, the resulting cDNA is tailed with dCTP using terminal transferase. Third, a second strand is synthesized using a poly(dG) primer. This multi-step amplification process is designed to minimize amplification bias and maximize the capture of even rare transcripts. Benchmarking studies have shown that MATQ-seq can outperform Smart-seq2 in detecting genes with low expression levels, making it one of the most sensitive full-length methods available [28]. Its high reproducibility and even coverage across genic regions also make it suitable for integrating with other single-cell omics data, as demonstrated in multiomics studies of early embryonic development [34].
3'-End Counting Protocols: Drop-seq and 10x Genomics Chromium
Drop-seq is a droplet-based, high-throughput method that uses nanoliter-scale droplets to individually barcode thousands of cells in a single experiment [31]. Cells are co-encapsulated with barcoded magnetic beads in droplets. The beads are coated with primers containing several functional regions: a PCR handle, a cell-specific barcode unique to each bead, a UMI, and a poly(dT) sequence for mRNA capture. Within each droplet, cells are lysed, and their mRNAs are hybridized to the beads. After breaking the droplets, the pooled mRNA-bead complexes are reverse-transcribed and amplified. The cell barcode and UMI information allows bioinformatic tools to assign each sequenced read back to its cell of origin and count individual mRNA molecules, correcting for PCR amplification bias [28] [31]. While highly scalable and cost-effective, Drop-seq generally has lower sensitivity and higher technical noise compared to 10x Genomics, detecting around 2,500 genes per cell on average [31]. Its bead encapsulation also follows a Poisson distribution, which can limit its efficiency for very precious samples [31].
10x Genomics Chromium is a widely adopted commercial droplet-based system that operates on principles similar to Drop-seq but with key engineering improvements [31]. It uses a proprietary microfluidic chip and specially designed gel beads. Each gel bead contains primers with a cell barcode, a UMI, and a poly(dT) sequence. A key differentiator is that the beads are deformable, allowing for higher bead occupancy per droplet (over 80%), which improves cell capture efficiency and reduces multiplets [31]. Reverse transcription occurs inside the droplets, potentially enhancing capture efficiency. According to direct comparisons, the 10x Genomics system demonstrates superior performance to Drop-seq and inDrop in several aspects, including sensitivity (detecting ~3,000 genes and 17,000 transcripts per cell), precision, and the quality of its cell barcodes [31]. However, this comes at a higher cost per experiment [31]. The platform is continuously updated, with newer versions like the "Universal 3'" kit offering increased sensitivity and flexibility for various sample types, including nuclei and fixed cells [32].
Diagram 1: Workflow and application differences between full-length and 3' end counting scRNA-seq protocols.
The Scientist's Toolkit: Essential Research Reagents and Materials
Successful execution of a scRNA-seq experiment requires careful selection of reagents and kits. The table below lists key solutions and their functions for the featured protocols.
Table 2: Key Research Reagent Solutions for scRNA-seq Protocols
| Reagent / Kit Name | Function / Description | Compatible Protocol(s) |
|---|---|---|
| SMART-seq HT Kit (Takara) | Commercial kit for full-length cDNA; combines RT and cDNA amplification to minimize hands-on time. | Smart-seq2 [11] |
| NEBnext Single Cell/Low Input Kit (New England Biolabs) | Commercial kit for RNA-to-cDNA conversion and library prep; includes all reagents for Illumina sequencing. | Smart-seq2 [11] |
| Chromium GEM-X Chip & Reagents (10x Genomics) | Microfluidic chip and core reagents for generating gel beads-in-emulsion (GEMs) for single-cell barcoding. | 10x Genomics [32] |
| Dual Index Kit (10x Genomics) | Contains barcodes for multiplexing libraries during sequencing. | 10x Genomics [32] |
| Cell Ranger Analysis Pipeline (10x Genomics) | Standardized software for demultiplexing, barcode processing, alignment, and UMI counting. | 10x Genomics [32] |
| Template Switching Oligo (TSO) | Critical oligonucleotide for template-switching reaction in SMART-based protocols. | Smart-seq2, SMART-seq3 [29] [11] |
| Oligo-d(T) Primers with VN Anchor | Primers for initiating reverse transcription from the poly-A tail of mRNA; VN anchor improves specificity. | All mentioned protocols [11] |
| SuperScript IV Reverse Transcriptase | Highly processive reverse transcriptase used in newer protocols to improve cDNA yield and length. | FLASH-seq, Smart-seq3 [29] |
The choice between full-length and 3' end counting scRNA-seq protocols is not a matter of one being universally superior, but rather depends on the specific biological question and experimental constraints.
Full-length protocols like Smart-seq2 and MATQ-seq are the preferred tools when the research goal requires a deep dive into the transcriptome's complexity. Their high sensitivity and ability to sequence across the entire transcript body make them indispensable for detecting splice variants, investigating allelic expression, characterizing low-abundance genes, and identifying single-nucleotide variants [29] [33]. This comes at the cost of lower throughput, higher price per cell, and greater hands-on time. They are ideally suited for focused studies where deep molecular characterization of a few hundred cells is more valuable than a broad census of thousands.
3' end counting protocols like 10x Genomics and Drop-seq excel in scalability and quantitative precision for gene expression. Their ability to profile thousands of cells in a single run makes them powerful for defining cellular taxonomies, discovering rare cell populations, and understanding the composition of complex tissues [30] [31]. The use of UMIs provides accurate digital counting of transcripts, reducing technical noise. While they sacrifice information on isoform diversity, they have become the workhorse for large-scale atlas projects and studies where capturing the full spectrum of cellular heterogeneity is the primary objective.
Ultimately, the landscape of scRNA-seq protocols offers a powerful toolkit for researchers. By understanding the inherent trade-offs in sensitivity, throughput, and informational content, scientists can make an informed choice to best advance their research in drug development, basic biology, and clinical applications.
Understanding the journey from a single fertilized egg to a complex organism requires precise tools to map cellular fate and function. The emergence of high-throughput single-cell RNA sequencing (scRNA-seq) has revolutionized developmental biology by enabling researchers to deconstruct embryonic processes at unprecedented resolution. Two primary methodological approaches—full-length transcript sequencing and 3' end counting—have become central to this endeavor, each with distinct advantages for profiling gene expression in embryo development and lineage tracing studies. Full-length transcript sequencing provides comprehensive information on the entire RNA molecule, enabling isoform-level analysis, while 3' end counting focuses on the 3' terminal region of transcripts for efficient transcript quantification. This guide objectively compares these platforms through experimental data and performance metrics, empowering researchers to select optimal methodologies for their specific investigations of cellular heterogeneity during embryonic development.
Technical Foundations: Core Methodologies Compared
Full-Length Transcript Sequencing
Full-length methods capture complete RNA sequences from the 5' cap to the 3' poly(A) tail. Prominent protocols include SMART-seq3, FLASH-seq, and related variants that employ template-switching mechanisms for cDNA synthesis [29] [25] [35]. These methods typically begin with cell lysis followed by reverse transcription primed by oligo-dT primers. The template-switching activity of reverse transcriptase adds defined adapter sequences to the 3' end of cDNA, enabling PCR amplification of full-length transcripts [25]. FLASH-seq introduced key modifications including a more processive reverse transcriptase (Superscript IV), shortened reaction times, and optimized nucleotide balances to boost template-switching efficiency while reducing protocol time to approximately 4.5 hours [29]. The automated high-throughput Smart-seq3 (HT Smart-seq3) workflow further enhances reproducibility through robotic liquid handling in 384-well plates, integrated quality control checks, and cDNA normalization steps [35].
3' End Counting Methods
In contrast, 3' end counting methods like QuantSeq and droplet-based platforms (e.g., 10X Genomics) focus sequencing on the 3' terminal region of polyadenylated RNAs [1] [22]. These approaches use oligo-dT primers containing unique molecular identifiers (UMIs) and cell barcodes to directly capture the 3' ends of transcripts. In QuantSeq, simplified workflows generate one sequencing fragment per transcript through initial oligo(dT) priming without RNA fragmentation [1] [22]. Droplet-based systems encapsulate individual cells in oil droplets where reverse transcription occurs with cell-specific barcodes, enabling massive parallel processing of thousands of cells [25]. The fundamental principle unifying these methods is that sequencing reads directly reflect transcript abundance without length bias, as each mRNA molecule generates approximately the same number of reads regardless of transcript length [22].
Table 1: Core Methodological Differences Between Sequencing Approaches
| Feature | Full-Length Sequencing | 3' End Counting |
|---|---|---|
| Transcript Coverage | Complete 5' to 3' coverage | Focused on 3' region |
| Primary Applications | Isoform detection, splicing analysis, mutation identification | Gene expression quantification, large-scale cellular heterogeneity studies |
| Typical Protocols | SMART-seq3, FLASH-seq, G&T-seq | QuantSeq, 10X Chromium, Drop-seq |
| UMI Incorporation | Optional (e.g., in SMART-seq3) | Standard practice |
| Single-Cell Throughput | Hundreds to thousands of cells | Tens of thousands of cells |
| RNA Input Flexibility | Suitable for low-input samples | Requires sufficient RNA for barcoding |
Visual Comparison of Experimental Workflows
The diagram below illustrates the key procedural differences between full-length transcript sequencing and 3' end counting workflows:
Performance Benchmarking: Experimental Data and Applications
Sensitivity and Transcript Detection
Multiple studies have systematically compared the performance of full-length and 3' end counting methods. In plate-based single-cell RNA sequencing, full-length protocols consistently demonstrate superior gene detection sensitivity. A comprehensive benchmarking study evaluating four plate-based scRNA-seq protocols found that G&T-seq delivered the highest detection of genes per single cell, while SMART-seq3 provided the highest gene detection at the lowest cost [25]. When comparing HT Smart-seq3 with the 10X Genomics platform using human primary CD4+ T-cells, HT Smart-seq3 demonstrated higher cell capture efficiency, greater gene detection sensitivity, and lower dropout rates [35]. This enhanced sensitivity enables the identification of a more diverse set of isoforms and genes, particularly protein-coding and longer genes [29].
For bulk RNA sequencing applications, a direct comparison between traditional whole transcript (KAPA Stranded mRNA-Seq) and 3' methods (Lexogen QuantSeq) in mouse liver tissue revealed distinct performance characteristics. While the whole transcript method detected more differentially expressed genes overall, the 3' method demonstrated enhanced detection of short transcripts, particularly at lower sequencing depths [22]. At a sequencing depth of 2.5 million reads, the 3' method detected approximately 400 more transcripts shorter than 1000 bp compared to the whole transcript method [22].
Applications in Embryo Development and Lineage Tracing
Embryonic Development Studies
Full-length transcript sequencing has proven invaluable for detailed investigations of embryonic development. A high-resolution mRNA expression time course of zebrafish development across 18 time points from 1 cell to 5 days post-fertilization successfully characterized temporal expression profiles of 23,642 genes using both poly(A) pulldown RNA-seq and a 3' end transcript counting method (DeTCT) [36]. This study identified temporal and functional transcript co-variance, associating 5024 unnamed genes with distinct developmental time points, and revealed a previously uncharacterized class of over 100 zinc finger domain-containing genes expressed during zygotic genome activation [36]. The comprehensive nature of full-length sequencing enabled researchers to discover new genes and transcripts, differential exon usage, previously unidentified 3' ends, new primary microRNAs, and temporal divergence of gene paralogues generated in the teleost genome duplication [36].
Lineage Tracing Applications
Lineage tracing remains essential for understanding cell fate, tissue formation, and human development [37]. Modern lineage tracing studies increasingly integrate single-cell sequencing technologies to unravel lineage hierarchies. Both full-length and 3' end counting methods have been applied to lineage tracing, each offering distinct advantages. Full-length single-cell RNA sequencing methods like FLASH-seq enable characterization of gene expression at high resolution across multiple samples, providing the sensitivity needed to identify rare cell populations and transitional states during differentiation [29]. The comprehensive transcriptome information captured by full-length protocols allows for simultaneous detection of gene expression patterns and genetic variants that can serve as natural lineage markers [38].
Recent innovations in lineage tracing incorporate multicolour reporter cassettes and barcoding approaches that leverage sequencing readouts. Techniques such as Brainbow and R26R-Confetti reporters enable clonal analysis at the single-cell level through stochastic Cre-loxP-mediated excision events that generate unique fluorescent signatures [37]. When combined with single-cell RNA sequencing, these approaches provide both lineage information and transcriptional profiles from the same cells, offering powerful insights into developmental processes.
Table 2: Experimental Performance Comparison Across Studies
| Performance Metric | Full-Length Sequencing | 3' End Counting | Experimental Context |
|---|---|---|---|
| Genes Detected per Cell | ~4,000-8,000 [25] | ~200-5,000 [25] | Plate-based vs. droplet-based scRNA-seq |
| Differential Expression Detection | Detects more DEGs [22] | Fewer DEGs detected [22] | Bulk RNA-seq in mouse liver |
| Short Transcript Detection | Lower sensitivity [22] | Higher sensitivity [22] | Transcripts <1000 bp at 2.5M reads |
| Protocol Duration | ~4.5 hours (FLASH-seq) [29] | Faster processing [1] | Hands-on time and total workflow |
| Single-Cell Throughput | Hundreds to thousands of cells [35] | Tens of thousands of cells [25] | Practical implementation scale |
| Isoform Resolution | Complete isoform detection [29] | Limited isoform information [1] | Splicing and isoform quantification |
3' UTR Analysis in Development
Quantifying 3' untranslated region (3' UTR) length has emerged as a crucial parameter in developmental regulation, as alternative polyadenylation can influence mRNA stability, translation, and subcellular localization [39]. Recent computational advances like scUTRquant enable quantification of 3' UTR isoforms from scRNA-seq data, revealing extensive 3' UTR length changes across cell types that are as widespread and coordinately regulated as gene expression changes but affect mostly different genes [39]. This indicates that mRNA abundance and mRNA length represent two largely independent axes of gene regulation that together determine the amount and spatial organization of protein synthesis during development.
Decision Framework: Selecting the Appropriate Methodology
Comparative Analysis of Strengths and Limitations
The choice between full-length and 3' end counting methods depends heavily on research goals, sample type, and resource constraints. The following diagram illustrates the decision-making workflow for selecting between these approaches:
Integrated Approach for Comprehensive Developmental Analysis
For many research programs investigating embryo development, a sequential or integrated approach leveraging both methodologies provides the most comprehensive insights. Researchers can utilize 3' end counting methods for large-scale screening of multiple embryonic time points or conditions to identify key transitions or populations of interest, followed by full-length sequencing for deep molecular characterization of selected critical samples [1]. This strategy balances the cost-efficiency and scalability of 3' methods with the rich biological information provided by full-length approaches.
The Scientist's Toolkit: Essential Research Reagents and Solutions
Table 3: Key Research Reagent Solutions for scRNA-seq in Developmental Biology
| Reagent/Kit | Primary Function | Application Context | Considerations |
|---|---|---|---|
| SMART-seq HT Kit (Takara) | Full-length scRNA-seq with high sensitivity | Embryonic cell characterization where high gene detection is critical | Highest cost option but simplified workflow [25] |
| NEBnext Single Cell/Low Input Kit | Full-length scRNA-seq library preparation | General purpose full-length transcriptomics | Lower detection sensitivity but cost-effective [25] |
| QuantSeq 3' mRNA-Seq Kit (Lexogen) | 3' end counting for gene expression quantification | Large-scale expression screening in development studies | Cost-effective; optimized for degraded samples [1] [22] |
| 10X Genomics Chromium | Droplet-based 3' end counting | High-throughput cellular heterogeneity studies | Enables processing of thousands of cells simultaneously [25] |
| Template Switching Oligo (TSO) | cDNA synthesis enhancement in SMART protocols | Full-length transcript capture | LNA-modified TSO improves sensitivity [25] |
| Unique Molecular Identifiers (UMIs) | Correction for amplification bias | Accurate transcript counting | Essential for quantitative expression analysis [29] [25] |
| Nextera XT DNA Library Preparation Kit | Library preparation from cDNA | Sequencing-ready libraries for Illumina platforms | Compatible with multiple full-length protocols [25] |
Both full-length transcript sequencing and 3' end counting methods offer powerful capabilities for investigating embryo development and cellular heterogeneity, with distinct performance characteristics that suit different research applications. Full-length protocols provide superior sensitivity, isoform resolution, and ability to detect genetic variants, making them ideal for deep molecular characterization of critical samples. In contrast, 3' end counting methods offer superior scalability, cost-efficiency, and enhanced detection of short transcripts, enabling large-scale screening studies. The optimal choice depends on specific research questions, sample characteristics, and resource constraints. As single-cell technologies continue to evolve, emerging methods that combine the strengths of both approaches while addressing their limitations will further empower researchers to unravel the complex cellular dynamics underlying embryonic development and lineage specification.
Single-cell RNA sequencing (scRNA-seq) has revolutionized biological sciences by enabling the unbiased profiling of gene expression at the ultimate resolution—the individual cell. While its foundational applications emerged in developmental biology, particularly in mapping the intricate cellular trajectories of early embryogenesis [8], this powerful technology has rapidly transformed oncology research. The same principles that allow researchers to deconstruct lineage specification in embryos are now being deployed to dissect the complex cellular ecosystems of tumors, particularly the tumor microenvironment (TME) [40] [41]. This guide provides a comparative analysis of scRNA-seq methodologies, framing their performance within the context of a broader thesis on full-length versus 3' end counting protocols, and details their transformative applications in characterizing the TME and accelerating drug discovery.
Comparative Analysis of scRNA-seq Methodologies
scRNA-seq protocols are broadly categorized into two groups based on transcript coverage: full-length transcript protocols and 3' or 5' end counting (tag-based) protocols [6] [41]. The choice between them represents a fundamental trade-off between the depth of information per transcript and the scale of cellular profiling.
Table 1: Comparison of Full-Length vs. 3' End Counting scRNA-seq Protocols
| Feature | Full-Length Transcript Protocols | 3' End Counting Protocols |
|---|---|---|
| Transcript Coverage | Entire transcript length [6] | 3' or 5' end only [6] |
| Key Strengths | Identifies isoforms, splicing variants, and RNA editing [6] [41]; Higher sensitivity for lowly-expressed genes [6] | More quantitative with UMIs; Higher cell throughput; Lower cost per cell [6] |
| Primary Limitations | Higher cost per cell; Lower throughput [41] | Cannot identify isoforms or splicing events [41] |
| Amplification Method | PCR-based (exponential) [6] | PCR or In Vitro Transcription (IVT) [6] [41] |
| Representative Methods | Smart-seq2 [42] [6], Quartz-seq2 [6], MATQ-seq [6] [41] | Drop-seq [6] [41], inDrop [6] [41], 10x Genomics [41], CEL-seq2 [6] [41], MARS-seq [42] [41] |
| Ideal Application | In-depth analysis of transcriptome complexity in focused cell populations | Large-scale population studies, like mapping heterogeneous TMEs [40] |
This dichotomy mirrors choices in bulk RNA-seq, where whole transcriptome analysis contrasts with 3' mRNA-seq methods like QuantSeq, which focus on quantitative gene expression with a streamlined workflow [1] [5]. A critical study comparing these bulk methods found that while whole transcriptome sequencing detected more differentially expressed genes, 3' mRNA-seq provided highly similar biological conclusions in pathway analysis with significantly less sequencing depth [1] [5].
scRNA-seq in Deconstructing the Tumor Microenvironment
The TME is a complex admixture of cancer cells, immune cells, stromal fibroblasts, and vascular cells. Bulk RNA sequencing only provides an average expression signal from this mixture, obscuring critical cellular subpopulations and their interactions [41]. scRNA-seq cuts through this averaging effect, revealing the true cellular heterogeneity within tumors.
Key applications in TME analysis include:
- Identifying Rare Cell Populations: scRNA-seq can pinpoint rare but therapeutically critical cell types, such as cancer stem cells (CSCs) [40]. For instance, in gastric adenocarcinoma, scRNA-seq revealed that the transcription factor SOX9 was associated with maintaining stemness in CSCs, identifying a potential therapeutic vulnerability [40].
- Characterizing Tumor Infiltrating Immune Cells: The technology enables comprehensive cataloging of T-cell and myeloid cell states within tumors, uncovering exhausted T-cell phenotypes, regulatory T-cells, and various macrophage polarization states that influence response to immunotherapy [40] [43].
- Discovering Stromal Cell Diversity: Fibroblasts and other stromal cells in the TME are not uniform. scRNA-seq has uncovered functionally distinct fibroblast subpopulations, some of which promote tumor growth and immune suppression [40].
Table 2: Key Research Reagent Solutions for scRNA-seq in Cancer Research
| Reagent / Solution | Function | Example Use Case |
|---|---|---|
| Unique Molecular Identifiers (UMIs) | Short nucleotide tags that label individual mRNA molecules to correct for PCR amplification bias, enabling accurate mRNA counting [6] [41]. | Used in most 3' end counting methods (e.g., Drop-seq, 10x Genomics) for precise gene expression quantification [42]. |
| Antibody-Oligonucleotide Conjugates (Hashtags) | Antibodies conjugated to oligonucleotide barcodes that label cell surface proteins (e.g., CD298, B2M), enabling multiplexing and sample pooling [43]. | Allows pooling of up to 96 samples in a single scRNA-seq run, as demonstrated in pharmacotranscriptomic screens [43]. |
| Template-Switching Oligos | Enable the addition of universal adapter sequences to the 5' end of cDNA during reverse transcription, a key step in full-length protocols like Smart-seq2 [6]. | Facilitates whole-transcript amplification without gene-specific primers. |
| Barcoded Beads (e.g., from 10x Genomics) | Micron-sized beads containing millions of copies of a barcoded oligo-dT primer, used to capture mRNA from single cells in droplet-based systems [6] [41]. | The core of high-throughput commercial platforms, allowing thousands of cells to be processed simultaneously. |
Advanced Pharmacotranscriptomic Applications in Drug Discovery
The application of scRNA-seq extends beyond characterization to functional screening in drug discovery. It plays critical roles in target identification, high-throughput drug screening, and understanding drug resistance mechanisms [40] [44].
Target Identification and Mechanism of Action
scRNA-seq can identify novel drug targets by comparing treatment-resistant and sensitive cell subpopulations. For example:
- In multiple myeloma, scRNA-seq of patient samples identified PPIA as a potential novel target for overcoming resistance to Dara-KRd treatment [40].
- In glioblastoma, scRNA-seq revealed that targeting the Wnt signaling pathway could eliminate refractory cells and block metastasis [40].
High-Throughput Drug Screening
A landmark study published in Nature Chemical Biology [43] demonstrated a multiplexed scRNA-seq pipeline for high-throughput pharmacotranscriptomic profiling. This innovative workflow combined large-scale drug screening with 96-plex scRNA-seq via live-cell barcoding. Key aspects of this approach included:
- Experimental Workflow: Treatment of primary high-grade serous ovarian cancer (HGSOC) cells with 45 drugs across 13 mechanisms of action, followed by labeling with unique antibody-oligonucleotide conjugates (hashtags), pooling, and multiplexed scRNA-seq.
- Findings: The study uncovered a previously unknown drug resistance feedback loop wherein a subset of PI3K-AKT-mTOR inhibitors induced upregulation of caveolin 1 (CAV1), leading to activation of receptor tyrosine kinases like EGFR. This resistance mechanism could be mitigated by synergistic combination therapy.
- Impact: This pipeline enables the personalized testing of patient-derived tumor samples at single-cell resolution, potentially accelerating the development of effective combination therapies.
The following diagram illustrates the logical relationship and experimental workflow of this multiplexed pharmacotranscriptomics approach.
Understanding Drug Resistance and Pharmacokinetics
Tumor heterogeneity is a major driver of drug resistance. scRNA-seq can track the evolution of cell subpopulations under therapeutic pressure. For instance, it has been used to discover copy-number amplification of IRS1 and IRS2 in dasatinib-resistant glioblastoma clones [40]. Furthermore, circulating tumor cells (CTCs) can be profiled to understand metastatic mechanisms and identify targets like survivin in pancreatic ductal adenocarcinoma [40].
The migration of scRNA-seq from developmental biology to oncology has provided an unparalleled lens through which to view the cellular complexity of cancer. The strategic choice between full-length and 3' end counting protocols depends heavily on the research objective: full-length protocols are superior for deep analysis of transcriptome complexity, while 3' end counting methods enable the large-scale population studies needed to map heterogeneous TMEs and perform pharmacotranscriptomic screens. As evidenced by the advanced workflows described, the integration of scRNA-seq into drug discovery pipelines is already yielding novel targets, revealing unexpected resistance mechanisms, and paving the way for more effective, personalized cancer therapies. The ongoing development of even higher-throughput and multi-omics single-cell technologies promises to further refine our understanding of tumor biology and accelerate the development of next-generation oncology therapeutics.
Spatial transcriptomics has emerged as a revolutionary technology that preserves the spatial context of gene expression, enabling researchers to understand tissue organization and cellular interactions with unprecedented resolution. This comparison guide objectively evaluates the performance of full-length versus 3' end counting transcriptomic protocols specifically for embryonic research contexts, providing experimental data and methodological frameworks to guide researchers in selecting optimal approaches for their spatial genomics studies.
Spatial transcriptomics (ST) represents a transformative advancement over traditional sequencing methods by measuring transcriptomic information while preserving crucial spatial information within tissue architectures. These technologies have significantly enhanced our understanding of cellular heterogeneity and tissue organization, offering critical insights into developmental processes, disease mechanisms, and potential therapeutic strategies [45]. Unlike single-cell RNA sequencing that dissociates cells from their native microenvironments, ST techniques maintain the spatial coordinates of RNA molecules, enabling researchers to map gene expression patterns within the context of tissue histology [46].
The field encompasses two primary technological categories: imaging-based and sequencing-based methods [45]. Imaging-based approaches, such as in situ sequencing and in situ hybridization, detect RNA molecules directly in tissue sections using fluorescently-labeled probes but have traditionally been limited in the number of target sequences that can be simultaneously identified. Sequencing-based methods, including spatial barcoding approaches, utilize arrayed DNA-barcoded spots to capture and sequence mRNA from tissue sections, enabling transcriptome-wide quantification while preserving spatial information [47] [46]. These technological foundations provide the basis for comparing how different RNA sequencing protocols perform when integrated with spatial transcriptomics, particularly in complex embryonic development contexts.
Full-Length vs 3' End Counting Protocols: Core Methodologies
3' End Counting Approaches
3' mRNA sequencing methods, such as Lexogen's QuantSeq, provide a targeted approach for gene expression quantification by focusing sequencing efforts exclusively on the 3' ends of transcripts [1] [5]. These protocols utilize oligo(dT) primers to initiate cDNA synthesis from the polyadenylated tails of mRNAs, generating one fragment per transcript without random fragmentation [1]. This streamlined approach localizes sequencing reads to the 3' untranslated regions (UTRs) of polyadenylated RNAs, which is sufficient to identify gene expression patterns even at relatively low sequencing depths of 1-5 million reads per sample [1]. The method's simplicity reduces processing steps and computational complexity while providing direct transcript counting without normalization requirements for transcript length [5].
A key characteristic of 3' end counting methods is their insensitivity to transcript length, assigning roughly equal numbers of reads to transcripts regardless of their lengths [5]. This uniform coverage across different transcript lengths contrasts sharply with whole transcript methods and provides more accurate molecular counting when quantification is the primary research objective. The robustness of 3' mRNA-Seq library preparation protocols makes them particularly suitable for gene expression profiling from demanding samples, including degraded and FFPE (formalin-fixed, paraffin-embedded) material often encountered in clinical and developmental biology research [1].
Full-Length Transcript Approaches
Full-length transcript sequencing methods employ fundamentally different molecular strategies, using random primers to initiate cDNA synthesis across the entire transcript length rather than focusing exclusively on the 3' end [1]. This approach distributes sequencing reads across complete transcripts, enabling comprehensive characterization of transcript isoforms, alternative splicing events, fusion genes, and nucleotide modifications [48] [10]. However, because random primers can bind to highly abundant ribosomal RNA (rRNA), these methods require effective rRNA removal prior to library preparation—either through polyadenylated RNA selection or specific ribosomal depletion—adding procedural complexity to the workflow [1].
Full-length methods demonstrate strong length bias in read distribution, with longer transcripts generating more sequencing fragments and consequently receiving more reads [5]. This characteristic necessitates stringent length normalization during data analysis to accurately estimate expression levels. The comprehensive transcript coverage requires higher sequencing depth to provide sufficient coverage across entire transcripts, increasing both sequencing costs and computational requirements for data alignment, normalization, and transcript concentration estimation [1]. Despite these requirements, full-length approaches provide unparalleled insights into transcriptome complexity, making them indispensable for discovering novel isoforms and structural variations.
Table 1: Core Methodological Differences Between 3' End Counting and Full-Length Approaches
| Parameter | 3' End Counting | Full-Length Transcript |
|---|---|---|
| Priming Method | Oligo(dT) primers | Random primers |
| Transcript Coverage | 3' UTR regions only | Entire transcript length |
| rRNA Depletion | Not required | Required (polyA selection or rRNA depletion) |
| Length Bias | Minimal | Significant (longer transcripts get more reads) |
| Sequencing Depth | Low (1-5 million reads/sample) | High (varies by application) |
| Primary Applications | Gene expression quantification | Isoform discovery, splicing analysis, fusion detection |
Experimental Data and Performance Comparison
Detection Capabilities and Sensitivity
Direct comparisons between 3' end counting and full-length transcript methods reveal distinct performance characteristics with important implications for experimental design. A comprehensive study by Ma et al. (2019) systematically compared these approaches using mouse liver RNA and found that while whole transcript methods detected more differentially expressed genes overall, 3' end counting methods demonstrated superior detection of short transcripts, particularly as sequencing depth decreases [5]. When sequencing depth was reduced to 5 million reads, 3' end counting detected approximately 300 more transcripts shorter than 1,000 base pairs compared to whole transcript methods, with the difference increasing to nearly 400 transcripts at 2.5 million reads [5].
For transcripts longer than 2,500 base pairs, whole transcript methods consistently detected slightly more transcripts across all sequencing depths, though these differences were relatively small [5]. This length-dependent detection bias has significant implications for embryonic research, where dynamically expressed shorter transcripts, including transcription factors and regulatory RNAs, often play crucial roles in developmental processes. The enhanced sensitivity of 3' end counting for shorter transcripts at lower sequencing depths makes it particularly advantageous for large-scale screening applications where cost-effectiveness is a priority.
Quantitative Accuracy and Reproducibility
Both 3' end counting and whole transcript methods demonstrate similar levels of reproducibility between biological replicates, indicating comparable technical reliability [5]. However, their fundamental differences in transcript quantification mechanics lead to distinct analytical considerations. The 3' end counting approach generates reads that directly reflect transcript numbers regardless of length, providing more straightforward quantification without normalization requirements for transcript length [1] [5]. In contrast, whole transcript methods require sophisticated normalization to account for the inherent bias toward longer transcripts, which generate more fragments and consequently receive more reads during sequencing [5].
Despite these methodological differences, studies examining biological conclusions have found remarkable consistency between the two approaches. Research comparing pathway analysis and gene set enrichment between the methods demonstrated highly similar results, with the majority of key differentially expressed genes and enriched biological pathways consistently identified by both techniques [1]. For example, in studies of murine livers under different dietary conditions, both methods robustly detected expected pathways involved in iron metabolism, regulation of circadian rhythm, and inflammatory responses, though with some variation in the statistical ranking of less significant gene sets [1].
Table 2: Performance Comparison Based on Experimental Data
| Performance Metric | 3' End Counting | Full-Length Transcript |
|---|---|---|
| Genes Detected | Fewer overall, but better for short transcripts | More overall, especially longer transcripts |
| Differential Expression | Detects fewer DEGs | Detects more DEGs |
| Short Transcript Detection | Superior, especially at lower sequencing depths | Inferior for transcripts <1,000 bp |
| Reproducibility | High between replicates | High between replicates |
| Pathway Analysis Consistency | High concordance for major pathways | High concordance for major pathways |
| Required Sequencing Depth | Lower (1-5 million reads) | Higher (varies by target) |
Spatial Transcriptomics Integration: Technical Considerations
Analysis Workflows and Computational Methods
The integration of transcriptomic protocols with spatial transcriptomics requires specialized computational approaches that account for both gene expression patterns and spatial coordinates. Current analytical workflows for spatial transcriptomics encompass multiple steps, including preprocessing, dimensionality reduction, clustering, and spatial domain identification [45] [49]. Preprocessing typically involves normalization to account for technical variations, with methods like sctransform demonstrating advantages over standard log-normalization by more effectively handling the substantial variance in molecular counts per spot that often characterizes spatial datasets [49].
Spatial clustering represents a critical analytical step that differs fundamentally from conventional single-cell clustering by incorporating spatial neighborhood information. Benchmarking studies have evaluated numerous spatial clustering algorithms, identifying distinct performance characteristics across different methodologies [45]. Statistical methods like BayesSpace employ t-distributed error models with Markov chain Monte Carlo parameter estimation, while graph-based deep learning approaches such as SpaGCN, STAGATE, and GraphST utilize graph neural networks to extract latent features that incorporate spatial relationships [45]. These computational methods enable the identification of spatially coherent regions that correspond to anatomical structures or functional domains within tissues.
For integrating multiple tissue slices, alignment and integration methods have been developed to address technical variations between samples. Tools like PASTE utilize optimal transport algorithms for aligning consecutive spatial transcriptomics slices, while integration methods such as STAligner and PRECAST learn shared latent embeddings across multiple samples to enable comparative analyses [45]. These computational approaches are essential for constructing three-dimensional representations of gene expression from serial tissue sections, particularly valuable for understanding embryonic development and structural organization.
Platform Selection and Performance Characteristics
The selection of spatial transcriptomics platforms significantly influences data quality and experimental outcomes, with different technologies offering distinct trade-offs in resolution, sensitivity, and coverage. A comprehensive benchmarking study evaluating 11 sequencing-based spatial transcriptomics methods revealed substantial variability in performance characteristics across platforms [47]. Methods examined included microarray-based approaches (10X Genomics Visium, DynaSpatial), bead-based technologies (HDST, Slide-seq V2), polony-based methods (Stereo-seq), and microfluidics-based approaches (DBiT-seq), each demonstrating unique strengths and limitations [47].
Sensitivity comparisons using downsampled data to control for sequencing depth variations revealed that platform performance is tissue-dependent, with Slide-seq V2 demonstrating higher sensitivity in mouse eye tissues, while probe-based Visium and DynaSpatial showed advantages in hippocampal regions [47]. Importantly, the study found that spatial transcriptomic data exhibit unique attributes beyond merely adding a spatial axis to single-cell data, including enhanced ability to capture patterned rare cell states along with specific markers [47]. These findings highlight the importance of matching platform capabilities to specific research questions, particularly for embryonic studies where rare cell populations and precise spatial localization are often critical.
Embryonic Research Applications
Transcriptome Complexity in Embryogenesis
Embryonic development represents one of the most biologically complex processes, characterized by dynamic transcriptional changes and intricate spatial patterning. Research using full-length RNA sequencing has revealed unprecedented transcriptome complexity during embryogenesis, with studies in zebrafish identifying 2,113 previously unannotated genes and 33,018 novel isoforms across 21 developmental stages [10]. Similarly, direct RNA sequencing of Caenorhabditis elegans developmental stages uncovered approximately 57,000 novel isoforms, substantially expanding the documented transcriptomic repertoire [48]. These findings demonstrate that current genome annotations remain incomplete, particularly for developmental processes where alternative splicing and isoform regulation play crucial functional roles.
The comprehensive transcriptome mapping enabled by full-length approaches provides critical insights into the regulatory mechanisms governing embryonic development. In zebrafish embryogenesis, studies have revealed dynamic isoform usage and splicing variations across developmental stages, with different sets of genes showing differential expression versus differential isoform usage during development [48] [10]. This suggests fine-tuned regulation at the isoform level that would be undetectable using 3' end counting methods alone. The temporal specificity of isoform expression indicates sophisticated regulatory mechanisms that contribute to the precise developmental transitions characteristic of embryogenesis.
Practical Considerations for Embryonic Studies
The selection between full-length and 3' end counting protocols for embryonic spatial transcriptomics studies involves careful consideration of multiple practical factors. Full-length approaches are clearly superior for comprehensive transcriptome characterization, particularly when investigating poorly annotated genomes or exploring novel splicing events and isoform diversity [10] [7]. However, this comprehensive coverage comes with substantial costs, including higher sequencing requirements, more complex computational analyses, and increased reagent expenses [25] [7].
For large-scale embryonic screening applications or studies focusing specifically on quantitative gene expression changes, 3' end counting methods provide a cost-effective alternative with streamlined workflows. The reduced sequencing requirements of 3' end counting enable more extensive replication or broader temporal sampling within the same budgetary constraints, potentially increasing statistical power for detecting subtle expression changes [1] [5]. This can be particularly advantageous in time-series studies of embryonic development, where comprehensive sampling across developmental stages is often necessary to capture rapid transcriptional transitions.
Research Reagent Solutions
The experimental protocols discussed utilize various specialized reagents and kits that enable precise transcriptomic analyses. For full-length transcriptome sequencing, the PacBio Sequel II platform with its Single Molecule, Real-Time (SMRT) sequencing technology has been widely used to generate comprehensive transcriptome landscapes, particularly for embryonic development studies [10]. Alternative approaches utilizing Oxford Nanopore Technologies enable direct RNA sequencing of native poly(A)-tailed mRNAs without reverse transcription or amplification steps, preserving natural modification information [48].
For plate-based full-length scRNA-seq protocols, several commercial options are available, including the SMART-seq HT kit from Takara Bio Inc., which incorporates template-switching mechanism with locked nucleic acid technology for enhanced sensitivity, and the NEBNext Single Cell/Low Input RNA Library Prep Kit, which provides a complete workflow from RNA to sequencing-ready libraries [25]. Non-commercial alternatives include the G&T-seq protocol, which enables simultaneous genome and transcriptome sequencing from the same single cell, and SMART-seq3, which incorporates unique molecular identifiers (UMIs) for improved quantification accuracy [25].
For 3' end counting approaches, the Lexogen QuantSeq 3' mRNA-Seq Library Prep Kit provides a streamlined workflow specifically designed for gene expression quantification, while the KAPA Stranded mRNA-Seq Kit offers a traditional whole transcript approach for comparison studies [5]. These reagent systems form the foundation of spatial transcriptomics research, enabling the precise molecular measurements that underpin spatial gene expression analyses.
Table 3: Key Research Reagent Solutions for Transcriptomic Studies
| Reagent/Kits | Provider/Protocol | Primary Application | Key Features |
|---|---|---|---|
| QuantSeq 3' mRNA-Seq | Lexogen | 3' end counting | FWD library prep, oligo(dT) priming, simplified workflow |
| KAPA Stranded mRNA-Seq | Roche | Whole transcript | Random priming, strand-specific, broad transcript coverage |
| SMART-seq HT Kit | Takara Bio | Full-length scRNA-seq | Template switching, LNA technology, high sensitivity |
| NEBNext Single Cell/Low Input | New England Biolabs | Full-length scRNA-seq | Complete workflow, ULTRA II FS DNA library prep |
| PacBio Sequel II | PacBio | Full-length isoform sequencing | SMRT technology, long reads, isoform resolution |
| Oxford Nanopore | Oxford Nanopore Tech | Direct RNA sequencing | Native RNA, modification detection, long reads |
Visualizing Experimental Workflows and Relationships
The diagram below illustrates the core methodological differences between 3' end counting and full-length transcript approaches and their integration with spatial transcriptomics:
This workflow visualization highlights the divergent paths taken by 3' end counting versus full-length transcript approaches, from initial RNA input through library preparation to final spatial transcriptomics applications. The diagram emphasizes how methodological choices at the library preparation stage fundamentally influence the analytical capabilities and biological questions that can be addressed in downstream spatial transcriptomics analyses.
The integration of transcriptomic protocols with spatial technologies represents a powerful approach for understanding gene expression within its native tissue context, particularly during embryonic development where spatial organization is fundamental to developmental processes. The choice between full-length and 3' end counting approaches involves significant trade-offs that must be aligned with research objectives, experimental constraints, and analytical requirements.
Full-length transcript methods provide unparalleled comprehensiveity for discovering novel transcripts, characterizing isoform diversity, and detecting structural variations, making them ideal for exploratory studies of embryonic development where transcriptome complexity is high. Conversely, 3' end counting approaches offer streamlined, cost-effective solutions for quantitative gene expression studies, enabling larger sample sizes and broader screening applications within fixed budgetary constraints. Both approaches yield highly concordant results for major biological pathways and processes, providing confidence in conclusions drawn from well-designed experiments using either methodology.
As spatial transcriptomics technologies continue to evolve, with improvements in resolution, sensitivity, and computational integration, the synergistic combination of full-length and 3' end counting approaches may offer the most comprehensive strategy for elucidating the intricate relationships between gene expression and spatial organization during embryonic development and disease progression.
Navigating Technical Challenges and Optimizing scRNA-seq for Sensitive Samples
In single-cell RNA sequencing (embryo research, sparse and noisy data presents a fundamental challenge that can compromise downstream biological interpretations. Data sparsity in this context refers to gene expression matrices containing an abundance of zero values, which may represent either true biological absence of expression or technical artifacts known as "dropout events." These dropouts occur due to limitations in sequencing depth, inefficient reverse transcription, or unsuccessful cDNA amplification, where low-abundance transcripts fail to be detected [6] [50]. As researchers increasingly employ scRNA-seq to investigate cellular heterogeneity in early embryo development and to identify novel cell types within complex tissues, addressing these data quality issues becomes paramount for drawing accurate biological conclusions [6].
The choice between full-length transcript and 3' end-counting protocols introduces distinct considerations for data sparsity and the subsequent normalization strategies required. This guide provides a comprehensive comparison of these approaches, their performance characteristics, and specialized computational techniques for handling the sparse and noisy data they generate, with a specific focus on applications in embryo research.
scRNA-seq Protocol Comparisons: Full-Length vs. 3' End Counting
Single-cell RNA sequencing technologies can be broadly categorized into two approaches: full-length transcript protocols that sequence across the entire transcript, and 3' end-counting methods that focus sequencing on the 3' end of transcripts. Each approach offers distinct advantages and limitations for embryo research applications [6] [11].
Table 1: Comparison of Full-Length Transcript and 3' End-Counting scRNA-seq Protocols
| Feature | Full-Length Transcript Protocols | 3' End-Counting Protocols |
|---|---|---|
| Transcript Coverage | Entire transcript length | 3' end only |
| Key Applications | Isoform usage analysis, allelic expression detection, RNA editing, identification of RNA fusions and mutations | High-throughput cell typing, gene expression quantification, large-scale cellular heterogeneity studies |
| Detection Sensitivity | Higher sensitivity for detecting more genes per cell | Lower per-cell gene detection but more cost-effective for large cell numbers |
| UMI Incorporation | Limited capability (except SMART-seq3) | Standard feature (e.g., Drop-seq, inDrop, CEL-Seq2) |
| Multiplexing Capacity | Lower throughput (hundreds of cells) | Higher throughput (thousands of cells) |
| Cost Considerations | Higher cost per cell | Lower cost per cell |
| Data Sparsity Concerns | Lower technical zeros but higher amplification noise | Higher technical zeros but reduced amplification bias with UMIs |
| Representative Methods | SMART-seq2, SMART-seq3, MATQ-Seq, Fluidigm C1 | Drop-seq, inDrop, CEL-Seq2, MARS-seq |
Full-length transcript protocols like SMART-seq2 and MATQ-Seq excel in applications requiring comprehensive transcript information, such as identifying splice variants, RNA editing events, and allelic expression patterns—features particularly valuable for understanding regulatory mechanisms in early embryonic development [6]. These methods typically demonstrate higher sensitivity for gene detection per cell but come with limitations in throughput and higher costs per cell [11].
In contrast, 3' end-counting methods like Drop-seq and inDrop utilize unique molecular identifiers (UMIs) that enable more accurate transcript quantification by reducing amplification bias, making them ideal for large-scale studies of cellular heterogeneity in complex embryonic tissues [6] [33]. While these methods detect fewer genes per cell, their higher throughput and cost-efficiency make them suitable for comprehensive atlas-building projects such as the Human Cell Atlas initiative [11].
Experimental Performance Benchmarking
Several studies have quantitatively compared the performance of scRNA-seq protocols to guide researchers in selecting appropriate methods for their specific research questions, particularly in contexts where data sparsity is a concern.
Table 2: Quantitative Performance Comparison of Selected scRNA-seq Protocols
| Protocol | Type | Genes Detected per Cell | Reproducibility Between Samples | Cost per Cell (€) | Key Strengths |
|---|---|---|---|---|---|
| G&T-seq | Full-length | Highest | High | 12 | Highest gene detection; compatible with simultaneous DNA analysis |
| SMART-seq3 | Full-length | High | High | N/A | UMI incorporation for improved quantification |
| Takara SMART-seq HT | Full-length | High | High | 73 | Ease of use; minimal hands-on time |
| NEB SMART-seq | Full-length | Lower | Moderate | 46 | Lower cost while maintaining full-length coverage |
| Drop-seq | 3' end-counting | Moderate | High | Low | High throughput; cost-effective for large cell numbers |
| CEL-seq2 | 3' end-counting | Moderate | High | Moderate | Low amplification noise; well-suited for transcript quantification |
A comprehensive benchmarking study evaluating four plate-based full-length scRNA-seq protocols revealed that the G&T-seq protocol delivered the highest detection of genes per single cell, while SMART-seq3 provided high gene detection at a lower price point. The Takara kit demonstrated similar high gene detection with excellent reproducibility between samples but at a significantly higher cost [11].
Another extensive comparison of six prominent scRNA-seq methods highlighted that while Smart-seq2 detected the most genes per cell, methods employing UMIs (including CEL-seq2, Drop-seq, and MARS-seq) quantified mRNA levels with less amplification noise. The study further performed power simulations at different sequencing depths, revealing that Drop-seq offered superior cost-efficiency for transcriptome quantification of large cell numbers, while MARS-seq, SCRB-seq, and Smart-seq2 proved more efficient for smaller-scale analyses [33].
Experimental Workflows and Data Processing
The generation and processing of scRNA-seq data follow a series of method-specific steps that influence the characteristics of the resulting data and appropriate strategies for addressing sparsity.
Diagram 1: Experimental workflow for scRNA-seq showing parallel paths for full-length and 3' end-counting protocols, converging at data processing where sparsity challenges are addressed.
Advanced Imputation Strategies for Sparse Single-Cell Data
The sparse nature of scRNA-seq data, characterized by numerous zero values in the gene expression matrix, requires specialized imputation approaches. These zero values stem from both biological phenomena (genuine absence of gene expression) and technical artifacts (dropout events where low-expression genes escape detection) [50].
Matrix Completion-Based Methods
Matrix completion theory has been successfully applied to address dropout events in scRNA-seq data by treating the imputation problem as one of recovering unknown entries in an incomplete matrix. The scIALM method employs an Inexact Augmented Lagrange Multiplier approach to recover sparse single-cell RNA expression matrices under the assumption that the true gene expression matrix is inherently low-rank. This method transforms the imputation challenge into a convex optimization problem, using singular value decomposition to obtain a low-rank approximation of the matrix and progressively refining the estimate through augmented Lagrange multiplier iteration [50].
The mathematical foundation of this approach can be represented as solving the optimization problem:
min ‖A‖* + λ‖E‖1, subject to D = A + E
where D is the observed data matrix, A is the low-rank matrix to be recovered, E represents the sparse noise matrix, ‖·‖* denotes the nuclear norm, and ‖·‖1 represents the L1-norm [50].
Deep Learning and Smooth Imputation
Recent advances have adapted transformer architectures, which have dominated other domains like text and image processing, for handling irregularly-spaced longitudinal functional data like scRNA-seq. The SAND (Smooth Imputation of Sparse and Noisy Functional Data with Transformer) method augments standard transformers with a self-attention on derivatives module that naturally encourages smoothness by modeling the sub-derivative of the imputed curve. This approach has demonstrated superior performance compared to both standard transformer counterparts and traditional statistical methods like kernel smoothing and PACE for functional imputation [51].
Other deep learning approaches include DCA (deep count autoencoder network), which employs a zero-inflated negative binomial distribution model and autoencoder to denoise data, and scVI, which uses variational inference for imputation [50].
Gene-Specific Imputation
An alternative strategy is implemented in scImpute, a statistical method that learns the dropout probability of each gene in each cell based on a mixed model and then performs imputation using information from the same gene in other similar cells. This approach leverages the observation that dropout events are not random but occur more frequently in lowly expressed genes and can be mitigated by borrowing information from cells with similar expression profiles [50].
The Scientist's Toolkit: Essential Research Reagents and Computational Tools
Table 3: Key Research Reagent Solutions for scRNA-seq Experiments
| Reagent/Tool | Function | Protocol Applicability |
|---|---|---|
| Oligo-d(T) Primers | Prime poly(A) tails of mRNA transcripts during reverse transcription | Universal |
| Template Switching Oligo (TSO) | Enable full-length cDNA synthesis in SMART-seq protocols | SMART-seq2, SMART-seq3 |
| UMI Barcodes | Unique molecular identifiers for accurate transcript quantification | 3' end-counting methods (Drop-seq, inDrop) |
| Streptavidin Magnetic Beads | mRNA capture and purification in G&T-seq protocol | G&T-seq |
| Nextera XT Library Prep Kit | Library preparation for Illumina sequencing | Compatible with multiple protocols |
| scIALM Software | Sparse matrix imputation using augmented Lagrange multiplier method | Computational tool for post-processing |
| SAND Transformer | Smooth imputation of sparse functional data | Computational tool for post-processing |
| MAGIC | Markov affinity-based graph imputation | Computational tool for post-processing |
Normalization Strategies for Addressing Technical Variability
Normalization represents a critical step in scRNA-seq data processing that addresses technical variability between cells, enabling meaningful biological comparisons. The choice of normalization approach depends on both the experimental protocol and the specific characteristics of the resulting data.
For full-length transcript protocols, depth-dependent normalization methods like counts per million (CPM) or transcripts per million (TPM) are commonly employed to account for variations in sequencing depth across cells. These methods scale expression values based on total sequencing depth, allowing for comparative analysis between cells with different total read counts [1].
For UMI-based 3' end-counting protocols, normalization must consider both sequencing depth and capture efficiency. Methods like SCTransform build on a regularized negative binomial model to account for technical noise while preserving biological heterogeneity. Alternative approaches include downsampling to equal sequencing depth across cells or utilizing spike-in controls for absolute quantification, though the latter is less common in droplet-based methods due to practical implementation challenges [33].
Addressing sparse and noisy data in embryo research requires a multifaceted approach beginning with strategic protocol selection. Full-length transcript protocols offer advantages for investigations of isoform diversity and regulatory mechanisms in early embryonic development, where complete transcript information is essential. In contrast, 3' end-counting methods provide superior scalability for comprehensive atlas-building efforts aimed at cataloging cellular diversity in embryonic tissues.
Regardless of the chosen protocol, specialized imputation methods like scIALM and SAND can effectively address technical zeros and enhance data quality, while protocol-appropriate normalization strategies mitigate technical variability. By aligning experimental design with analytical approaches, researchers can maximize biological insights from sparse single-cell data in embryo research, advancing our understanding of developmental processes and cellular heterogeneity.
Single-cell RNA sequencing (scRNA-seq) has revolutionized biological research by enabling the profiling of transcriptomes at the single-cell level, offering unprecedented insights into cellular heterogeneity, developmental biology, and disease mechanisms [52] [8]. However, the accuracy of scRNA-seq data is compromised by technical artifacts, primarily batch effects and amplification bias, which can obscure true biological signals and lead to misleading conclusions [53] [33]. Batch effects are systematic technical variations introduced during sample processing, sequencing, or analysis when cells from different biological conditions are processed separately [54]. Amplification bias arises during library preparation, where certain transcripts are preferentially amplified over others, distorting the true representation of gene expression levels [5] [33].
These technical challenges are particularly relevant in sensitive research areas such as embryology, where distinguishing subtle transcriptional differences is critical for understanding early human development [8]. The choice between full-length and 3' end-counting embryo protocols further influences how these artifacts manifest and must be corrected. This guide provides a comprehensive comparison of batch effect correction methods and their performance across different scRNA-seq protocols, offering experimental data and methodologies to help researchers select appropriate strategies for combating these technical artifacts.
Origins of Batch Effects
Batch effects stem from multiple sources throughout the experimental workflow. Common causes include differences in sequencing platforms, reagent lots, laboratory conditions, personnel, sample preparation protocols, and instrumentation [55] [53] [54]. In scRNA-seq specifically, these effects manifest as consistent fluctuations in gene expression patterns and high dropout events, where approximately 80% of gene expression values may be zero due to technical rather than biological factors [54].
The fundamental cause of batch effects can be partially attributed to the basic assumption in omics data representation that there exists a linear, fixed relationship between instrument readout and analyte concentration. In practice, this relationship fluctuates across different experimental conditions, making instrument readouts inherently inconsistent across batches [53].
Consequences of Uncorrected Batch Effects
The impacts of uncorrected batch effects are profound and far-reaching. In benign cases, they increase variability and decrease statistical power to detect real biological signals. More severely, they can lead to incorrect conclusions, especially when batch effects correlate with biological outcomes of interest [53]. Examples include:
- Misclassification in clinical settings: In one clinical trial, a change in RNA-extraction solution resulted in incorrect classification outcomes for 162 patients, 28 of whom received incorrect or unnecessary chemotherapy regimens [53].
- Species misinterpretation: Batch effects were responsible for apparent cross-species differences between human and mouse that were actually technical artifacts; after correction, gene expression data clustered by tissue rather than by species [53].
- Irreproducibility: Batch effects are a paramount factor contributing to the reproducibility crisis in science, resulting in retracted papers, discredited research findings, and financial losses [53].
In embryology research, where scRNA-seq is used to authenticate stem cell-based embryo models against in vivo counterparts, batch effects pose particular challenges for accurate cell lineage annotation and developmental trajectory inference [8].
Amplification Bias in scRNA-seq Protocols
Protocol-Specific Biases
Amplification bias varies significantly across scRNA-seq methods due to differences in their molecular mechanisms. A comprehensive comparison of six prominent scRNA-seq methods revealed substantial variations in performance characteristics [33]. Smart-seq2 detected the most genes per cell but exhibited more amplification noise, while CEL-seq2, Drop-seq, MARS-seq, and SCRB-seq quantified mRNA levels with less amplification noise due to their use of unique molecular identifiers (UMIs) [33].
The fundamental difference between whole transcriptome and 3' end-counting approaches significantly influences amplification bias. In whole transcriptome methods like KAPA Stranded mRNA-Seq, extracted mRNAs are randomly fragmented before reverse transcription, resulting in more reads from longer transcripts [1] [5]. In contrast, 3' end-counting methods like Lexogen QuantSeq generate cDNA only from the 3' end of mRNAs, producing one fragment per transcript regardless of length [1] [5].
Quantitative Comparison of Protocol Biases
Table 1: Performance Comparison of Whole Transcriptome vs. 3' end-counting Methods
| Performance Metric | Whole Transcriptome (KAPA) | 3' end-counting (Lexogen) |
|---|---|---|
| Read Distribution | Uniform coverage across transcripts | Exclusive coverage at 3' end |
| Length Bias | More reads for longer transcripts | Equal reads regardless of length |
| Short Transcript Detection | Less effective as sequencing depth drops | Better detection of short transcripts |
| Differentially Expressed Genes | Detects more DEGs | Detects fewer DEGs |
| Reproducibility | High between biological replicates | High between biological replicates |
| Sequencing Depth Requirement | Higher depth needed for equivalent coverage | Lower depth sufficient for quantification |
The trade-offs between these approaches have direct implications for embryology research. While whole transcriptome methods detect more differentially expressed genes, 3' end-counting methods provide more accurate quantification independent of transcript length and are more cost-effective for large-scale studies [1] [5] [33].
Batch Effect Correction Methods: A Comparative Analysis
Method Categories and Algorithms
Batch effect correction methods can be broadly categorized into non-procedural approaches that use direct statistical modeling and procedural approaches that employ multi-step computational workflows [56]. Non-procedural methods include ComBat and Limma, which were originally developed for bulk RNA-seq and adjust additive or multiplicative batch biases [56]. Procedural methods include Seurat v3 (using canonical correlation analysis and mutual nearest neighbors), Harmony (iterative clustering with PCA), and deep learning-based approaches like MMD-ResNet and scGen [56] [54].
A critical distinction exists between methods that correct on a per-cell level for visualization and clustering versus those that operate on a per-gene level for differential expression analysis. Per-cell correction methods like Harmony aim to position cells in a corrected space for dimensionality reduction and clustering, but the corrected counts should not be used for quantitative per-gene comparisons like differential expression analysis [57]. For per-gene analyses, incorporation of batch variables directly into regression models is recommended over using batch-corrected matrices [52].
Performance Evaluation of Correction Methods
Table 2: Quantitative Performance of Batch Effect Correction Methods in scRNA-seq
| Method | Category | Key Metric | Performance | Limitations |
|---|---|---|---|---|
| SVA | Surrogate Variable Analysis | FDR Control | Controls FDR well with good power for small group effects | Inflated FDR (up to 0.2) with large group effects |
| Mixed Effects Models | Nested Models | Power | Significant power loss with latent batches | Does not leverage information shared among genes |
| Aggregation-based Methods | Pseudo-bulk | Power | Significant power loss with latent batches | Loses single-cell resolution |
| ComBat | Non-procedural | Order Preservation | Preserves gene expression order | Ineffective with high zero counts in scRNA-seq |
| Harmony | Procedural | Batch Mixing | Good batch integration for visualization | Does not output corrected expression matrix |
| Order-Preserving Method | Procedural | Inter-gene Correlation | Superior correlation preservation | Computationally intensive |
For known batch variables, incorporating them as covariates in regression models outperforms approaches using batch-corrected matrices [52]. For latent batch effects, surrogate variable-based methods like SVA generally control false discovery rates well while maintaining good power, particularly with small group effects [52]. Fixed effects models tend to have inflated false discovery rates, while aggregation-based methods and mixed effects models suffer from significant power loss [52].
Recent advancements include order-preserving methods based on monotonic deep learning networks, which demonstrate superior performance in maintaining inter-gene correlation and preserving original differential expression information while effectively aligning batches [56].
Experimental Protocols for Method Evaluation
Simulation Frameworks for Batch Effect Assessment
Systematic evaluation of batch effect correction methods requires carefully designed simulation frameworks. One comprehensive approach simulated two primary batch effect scenarios using UMI count-based scRNA-seq datasets [52]:
- Matched batches: Two groups with three matched batches where samples were simultaneously collected for both groups in each batch.
- Independent batches: Two groups, each with three independent batches where all samples were collected independently.
The simulation framework varied multiple parameters, including group effect size (fold changes of 1.2, 1.5, and 20), total number of cells (600 vs. 12,000), and impurity level (0% vs. 5% mislabeled cells) [52]. For matched batches, the approach started with a real scRNA-seq dataset of Rh41 cells from three different batches, filtering out lowly expressed genes (average UMI count < 0.1 in any batch), then swapping expression vectors of pre-selected gene pairs to simulate differential expression [52].
For independent batches, gene count matrices were generated from negative binomial distributions with parameters estimated from the Rh41 dataset, incorporating batch variables with gene-specific scaling factors [52]. Performance was evaluated using false discovery rate (FDR), statistical power, F1-score, and area under the precision-recall curve with precision restricted to >0.8 [52].
Validation Metrics and Implementation
Robust validation of batch effect correction requires multiple complementary metrics focusing on both batch mixing and biological conservation [56] [54]:
- Batch Mixing Metrics: Local Inverse Simpson Index (LISI) measures neighborhood diversity, with higher values indicating better mixing [56].
- Clustering Metrics: Adjusted Rand Index (ARI) evaluates clustering accuracy against known cell type labels, while Average Silhouette Width (ASW) assesses cluster compactness [56].
- Biological Conservation: Inter-gene correlation preservation evaluates how well gene-gene relationships are maintained after correction using root mean square error, Pearson correlation, and Kendall correlation [56].
- Order Preservation: Spearman correlation coefficients measure how well the original ranking of gene expression levels is preserved, particularly important for maintaining differential expression patterns [56].
Visualization techniques including PCA, t-SNE, and UMAP plots are essential for qualitative assessment, where effective correction should show cells clustering by biological type rather than batch origin [54].
Diagram 1: Batch effect correction workflow showing input data, method categories, and evaluation metrics that guide researchers from raw data to corrected datasets.
Research Reagent Solutions and Experimental Materials
Table 3: Essential Research Reagents and Platforms for scRNA-seq Studies
| Reagent/Platform | Function | Application Context |
|---|---|---|
| KAPA Stranded mRNA-Seq Kit | Whole transcriptome library preparation | Generates uniform transcript coverage for isoform-level analysis |
| Lexogen QuantSeq 3' mRNA-Seq Kit | 3' end-counting library preparation | Provides cost-effective gene quantification for large studies |
| Unique Molecular Identifiers (UMIs) | Molecular barcoding for noise reduction | Eliminates amplification bias in CEL-seq2, Drop-seq, MARS-seq |
| SC3 clustering algorithm | Cell type identification | Enables accurate cell clustering for downstream analysis |
| Harmony algorithm | Batch effect correction | Efficiently integrates datasets using iterative clustering |
| Seurat v3 | Single-cell analysis pipeline | Provides comprehensive toolkit including CCA-based integration |
| 10X Genomics Chromium | Single-cell partitioning platform | Enables high-throughput scRNA-seq with UMIs |
| Smart-seq2 reagents | Full-length transcript protocol | Maximizes gene detection per cell for in-depth analysis |
The selection of appropriate reagents and platforms depends heavily on research goals. For embryology studies requiring isoform-level information, whole transcriptome approaches with Smart-seq2 or KAPA kits are preferable [1] [33]. For large-scale embryo model validation studies where cost-effectiveness is crucial, 3' end-counting methods like QuantSeq provide reliable quantification with lower sequencing depth requirements [1] [5].
Pathway and Workflow Visualization
Diagram 2: Decision pathway for selecting appropriate scRNA-seq protocols and corresponding artifact correction strategies based on research objectives.
The comparative analysis of batch effect correction methods and amplification bias mitigation strategies reveals context-dependent optimal approaches. For embryology research utilizing full-length transcriptome protocols, we recommend incorporating known batch variables directly into regression models rather than using pre-corrected matrices for differential expression analysis [52]. For latent batch effects, surrogate variable-based methods like SVA provide the best balance of false discovery rate control and statistical power [52].
When working with 3' end-counting protocols, which are increasingly popular for large-scale embryo model validation, the order-preserving batch correction methods based on monotonic deep learning networks demonstrate superior performance in maintaining biological integrity while effectively removing technical artifacts [56]. These methods excel at preserving inter-gene correlations and differential expression patterns, which is crucial for accurate pathway analysis in developmental studies.
Future methodological development should focus on approaches that simultaneously address multiple technical artifacts while preserving subtle biological signals, particularly important for detecting rare cell populations in embryo development and validating the fidelity of stem cell-based embryo models against their in vivo counterparts [8] [56]. The integration of experimental best practices with computational correction strategies will continue to enhance the reliability of scRNA-seq data in combating technical artifacts and advancing our understanding of early human development.
Research in developmental biology, oncology, and drug discovery increasingly depends on the ability to profile gene expression from limited biological material, such as rare cell populations, micro-dissected tissues, and clinical biopsies. In these scenarios, maximizing sample integrity while obtaining robust transcriptomic data presents a significant technical challenge. The choice of RNA sequencing methodology profoundly impacts the quality, scope, and biological validity of the results, necessitating careful strategic planning.
This guide objectively compares two principal approaches for transcriptome analysis—full-length RNA sequencing and 3' end counting methods—within the specific context of low-input and rare cell applications. We focus on their performance characteristics using supporting experimental data to inform researchers selecting the optimal protocol for their sample integrity requirements.
Technology Comparison: Full-Length versus 3' End Counting Methods
Core Methodological Principles
Full-length RNA-seq (also called Whole Transcriptome Sequencing or WTS) protocols are designed to sequence fragments distributed across the entire transcript. For these methods, cDNA synthesis is typically initiated with random primers, and to prevent the majority of sequencing reads from originating from highly abundant ribosomal RNA (rRNA), enrichment for polyadenylated RNAs or specific depletion of rRNA is required prior to library preparation [1]. This approach generates data that enables the investigation of alternative splicing, novel isoforms, fusion genes, and provides comprehensive coverage of coding and non-coding RNA species [1].
In contrast, 3' mRNA-seq methods, such as QuantSeq, streamline the process by generating sequencing libraries from the 3' end of polyadenylated RNAs through an initial oligo(dT) priming step. This design captures one fragment per transcript, localizing reads to the 3' untranslated region (UTR), which is sufficient for gene identification and quantification [1] [22]. This fundamental difference in library construction underpins all subsequent differences in performance, cost, and application suitability.
Direct Performance Comparison from Experimental Studies
Several studies have directly compared these methodologies to quantify their performance differences. Ma et al. (2019) conducted a comprehensive comparison using mouse liver RNA from animals on normal or high-iron diets, preparing libraries with both the KAPA Stranded mRNA-Seq kit (full-length) and the Lexogen QuantSeq 3' mRNA-Seq kit (3' end counting) [22].
Table 1: Key Performance Metrics from Ma et al. (2019) Study
| Performance Metric | Full-Length RNA-seq | 3' mRNA-seq |
|---|---|---|
| Read Distribution | Assigns more reads to longer transcripts | Assigns roughly equal reads regardless of transcript length |
| Short Transcript Detection | Detects fewer short transcripts as sequencing depth drops | Better detects short transcripts (≈400 more at 2.5M reads) |
| Differentially Expressed Genes (DEGs) | Detects more DEGs regardless of sequencing depth | Detects fewer DEGs overall |
| Reproducibility | High reproducibility between biological replicates | Similar level of reproducibility between replicates |
| Gene Set Enrichment Results | Identifies more gene sets | Captures majority of key pathways with high rank correlation |
The investigation revealed that while whole transcript methods detected more differentially expressed genes, the 3' RNA-seq method demonstrated particular advantages in detecting shorter transcripts, especially as sequencing depth decreased [22]. Notably, when sequencing depth was reduced to 2.5 million reads, the 3' method detected approximately 400 more transcripts shorter than 1000 base pairs compared to the full-length approach [22].
A subsequent study by Jarvis et al. (2023) reinforced these findings, confirming that 3' RNA-seq excels under conditions of sparse data but identified that full-length RNA-seq maintains an advantage in identifying toxicity pathways in model organisms [58]. This suggests that the choice between methods should be informed by both the biological question and practical experimental constraints.
Application to Low-Input and Rare Cell Populations
Special Considerations for Sample-Limited Scenarios
Research involving low-input and rare cell populations introduces additional technical challenges that directly impact protocol selection. Sample integrity concerns are paramount, as these valuable samples often undergo extensive processing or derive from challenging sources like fixed tissues, laser-capture microdissected material, or sorted rare cell populations.
For such applications, 3' mRNA-seq offers distinct practical advantages. Its streamlined workflow with fewer processing steps reduces hands-on time and potential for sample loss [1]. The method's robustness with partially degraded RNA is particularly valuable for clinical samples or those requiring extensive manipulation, as it only requires the integrity of the 3' end of transcripts for successful library preparation [59]. Furthermore, the lower sequencing depth requirement (typically 1-5 million reads per sample) enables cost-effective multiplexing of numerous samples, making large-scale screening studies of rare populations financially feasible [1] [59].
Full-length methods remain essential when the research question extends beyond gene expression quantification to investigate isoform-specific biology, splicing variations, or when working with non-polyadenylated RNA species [1]. However, these approaches demand higher RNA quality and greater sequencing depth (typically 20-30 million reads per sample), increasing both cost and analytical complexity [1].
Integration with Single-Cell and Low-Input Technologies
The rise of single-cell RNA sequencing (scRNA-seq) has revolutionized the study of rare cell populations by enabling transcriptome profiling at individual cell resolution [60]. Interestingly, the barcoding strategy fundamental to 3' end counting methods was first established in single-cell transcriptomics, where sample and mRNA barcoding allowed hundreds to thousands of single cells to be multiplexed in one experiment [59].
Most high-throughput scRNA-seq platforms (10x Genomics, Drop-seq, inDrop) employ 3' end counting approaches due to their cost-effectiveness and simplified workflow [6]. For applications demanding the highest sensitivity per cell, particularly in cases of low RNA content, plate-based full-length scRNA-seq methods (SMART-seq2, SMART-seq3) demonstrate superior gene detection capability [11]. However, this enhanced sensitivity comes with substantially higher per-cell costs and lower throughput [11].
Table 2: Protocol Selection Guide for Challenging Sample Types
| Research Scenario | Recommended Approach | Rationale | Supporting Evidence |
|---|---|---|---|
| Large-scale screening of rare populations | 3' mRNA-seq | Cost-effective multiplexing; lower sequencing depth required | [1] [59] |
| FFPE or degraded clinical samples | 3' mRNA-seq | Insensitive to RNA degradation; only requires intact 3' end | [1] [59] |
| Isoform-specific expression or splicing analysis | Full-length RNA-seq | Provides complete transcript sequence information | [1] [14] |
| Discovery of novel isoforms or fusion genes | Full-length RNA-seq | Enables identification of structural transcript variations | [1] [14] |
| Low-input single-cell analysis with maximum sensitivity | Full-length plate-based scRNA-seq | Higher genes detected per cell; better for low-abundance transcripts | [6] [11] |
| High-throughput single-cell atlas construction | 3' end counting droplet-based scRNA-seq | Cost-effective for processing thousands of cells | [6] [61] |
Experimental Design and Protocol Selection
Decision Framework for Researchers
Selecting the appropriate transcriptomic method requires balancing multiple factors, including research goals, sample characteristics, and practical constraints. The following decision framework provides guidance for researchers designing studies involving low-input or rare cell populations:
Define Primary Research Objective: If the question involves quantitative gene expression analysis across many samples or conditions, 3' mRNA-seq typically provides the most efficient solution [1]. For investigations requiring transcript-level resolution, including alternative splicing, isoform usage, or allele-specific expression, full-length approaches are necessary [1] [14].
Assess Sample Quality and Quantity: For high-quality samples with sufficient quantity (≥10ng RNA), both methods are viable. For degraded samples or those with limited quantity, 3' mRNA-seq offers superior performance [1] [59]. When RNA is extremely limited (single cells or few cells), consider single-cell or low-input optimized full-length protocols like SMART-seq2 or SMART-seq3 [11].
Consider Experimental Scale and Budget: Large-scale studies involving hundreds of samples benefit substantially from the cost-effectiveness of 3' mRNA-seq, which can be up to 25 times cheaper than standard full-length approaches per sample [59]. Smaller studies focused on deep characterization of limited samples may justify the additional cost of full-length sequencing.
Practical Implementation Strategies
To maximize sample integrity in practice, researchers should consider these evidence-based strategies:
Utilize Unique Molecular Identifiers (UMIs): When working with low-input samples, incorporate UMIs to account for amplification biases and improve quantification accuracy [60] [11]. These molecular barcodes distinguish original mRNA molecules from PCR duplicates, providing more accurate digital counting of transcripts.
Optimize Sample Preparation: For single-cell experiments, sample dissociation protocols significantly impact data quality. Dissociation at 4°C rather than 37°C minimizes artificial stress responses, and single-nucleus RNA-seq (snRNA-seq) provides an alternative when tissue dissociation is challenging [60].
Leverage Spike-In Controls: For absolute quantification or technical normalization, particularly in low-input scenarios, include external RNA controls of known concentration to monitor technical performance and normalize across samples [11] [14].
The following workflow diagram illustrates the key decision points in selecting the appropriate methodology for low-input and rare cell population studies:
Essential Research Reagent Solutions
Successful transcriptomic analysis of low-input and rare cell populations depends on appropriate selection of research reagents and kits. The following table summarizes key solutions validated in experimental studies:
Table 3: Research Reagent Solutions for Low-Input Transcriptomics
| Reagent/Kit Name | Type | Key Features | Best Applications |
|---|---|---|---|
| Lexogen QuantSeq 3' mRNA-Seq | 3' end counting | Low sequencing depth (1-5M reads); robust for degraded RNA; simple workflow | Large-scale screening; FFPE samples; cost-effective studies [1] [22] |
| SMART-seq HT (Takara) | Full-length single-cell | High gene detection per cell; commercial reliability | High-sensitivity single-cell studies; low-input RNA [11] |
| SMART-seq3 | Full-length with UMIs | Incorporates UMIs for quantification; high sensitivity | Absolute transcript counting; low-abundance gene detection [11] |
| 10x Genomics Chromium | 3' end counting scRNA-seq | High-throughput; thousands of cells per run; integrated workflow | Cellular atlas construction; heterogeneous tissue profiling [61] |
| NEBnext Single Cell/Low Input RNA Library Prep | Full-length low-input | Cost-effective commercial option; integrated library prep | Medium-throughput low-input studies; budget-conscious projects [11] |
The strategic selection between full-length and 3' end counting RNA sequencing methods profoundly impacts the success of studies involving low-input and rare cell populations. While 3' mRNA-seq offers compelling advantages in cost-effectiveness, sample throughput, and robustness to sample degradation, full-length methods remain essential for research questions requiring transcript-level resolution.
Experimental evidence consistently demonstrates that both approaches can generate biologically valid conclusions, with strong concordance in pathway-level analyses despite differences in individual gene detection [1] [22]. By carefully matching method capabilities to research objectives and sample constraints, investigators can maximize both data quality and sample preservation, advancing our understanding of rare cell biology and disease mechanisms.
The comprehensive analysis of RNA transcripts is fundamental to advancing research in cellular differentiation, development, and human diseases. The human genome transcribes over 200,000 RNAs, with a single gene often generating numerous highly similar alternative isoforms through mechanisms like alternative promoters, exon skipping, and intron retention [14]. These isoforms can be differentially regulated and possess distinct functionalities, making their accurate identification and quantification crucial [14]. While short-read RNA sequencing has been widely adopted for gene expression studies, its limitations in assigning reads to individual RNA transcripts hinder the precise analysis of complex transcriptional events [14] [15]. Long-read sequencing technologies from Oxford Nanopore Technologies (ONT) and Pacific Biosciences (PacBio) overcome these limitations by sequencing full-length transcripts end-to-end, thereby providing an unambiguous view of the transcriptome [15]. This guide objectively benchmarks these two leading long-read sequencing platforms, providing researchers with experimental data and methodologies to inform their study designs, particularly in the context of comparing full-length versus 3' end counting embryo protocols.
Both ONT and PacBio platforms enable full-length transcriptome sequencing but employ distinct biochemical principles and offer multiple library preparation options, each with specific strengths and trade-offs.
Oxford Nanopore Technologies (ONT) provides three primary RNA sequencing protocols [14] [62]:
- Direct RNA Sequencing: Sequences native RNA without reverse transcription or amplification, allowing for simultaneous detection of RNA modifications such as N6-methyladenosine (m6A) [14] [62].
- Amplification-free Direct cDNA Sequencing: Omits PCR steps, reducing amplification biases while still converting RNA to cDNA for sequencing [14].
- PCR-amplified cDNA Sequencing: Requires the least input RNA and generates the highest throughput, though it may introduce amplification biases [14].
Pacific Biosciences (PacBio) employs a different approach [63] [64]:
- Iso-Seq (Isoform Sequencing): Utilizes Single Molecule, Real-Time (SMRT) sequencing to generate highly accurate HiFi (High-Fidelity) reads. The method involves converting RNA into cDNA, creating SMRTbell library constructs, and then performing circular consensus sequencing (CCS) to produce long reads with accuracy exceeding 99% [63] [64]. The recent Kinnex kits enhance this workflow by enabling higher throughput full-length RNA sequencing on both the Revio and Vega systems [63].
The following workflow diagram illustrates the key steps in generating and analyzing long-read RNA sequencing data for both platforms, from sample preparation through to downstream biological insights.
Performance Benchmarking: Quantitative Comparisons
Rigorous benchmarking studies provide critical insights into the performance characteristics of Nanopore and PacBio technologies. The data presented below are synthesized from multiple large-scale consortium studies and independent investigations, including the Singapore Nanopore Expression (SG-NEx) project and the Long-read RNA-Seq Genome Annotation Assessment Project (LRGASP) [14] [62] [64].
Technical Performance and Isoform Detection
Table 1: Technical Performance Metrics of Long-Read Sequencing Platforms
| Performance Metric | Nanopore (PCR cDNA) | PacBio Iso-Seq | Notes |
|---|---|---|---|
| Average Read Length | ~915-2,795 bp [65] | ~2,027 bp [65] | Varies significantly with protocol |
| Throughput per Sample | Highest among ONT protocols [62] | Matched Illumina with Kinnex [63] | PCR cDNA requires least input RNA |
| 5'/3' Coverage Uniformity | Good with optimized protocols [65] | Most uniform across transcript [62] | Direct RNA starts at poly(A) tail [62] |
| Full-Splice-Match Reads | High proportion [62] | Highest proportion [62] | Reads spanning all exon junctions |
| Spike-in Recovery (SIRV) | Good recovery [64] | Recovers all SIRV transcripts [64] | PacBio is only method to recover all |
| Artifact Rate | More antisense/genic transcripts [64] | Lower artifact rate [64] | ONT artifacts likely from library prep |
Detection Accuracy and Quantification Performance
Table 2: Detection and Quantification Accuracy
| Accuracy Metric | Nanopore | PacBio | Context |
|---|---|---|---|
| Gene Detection Rate | Robust gene identification [14] | Greatest number of genes detected [64] | Across multiple cell lines |
| Isoform Detection Sensitivity | Good for major isoforms [14] | More long and rare isoforms [64] | PacBio excels for low-expression isoforms |
| Quantification Correlation | Strong gene-level correlation [62] | Pearson >0.9 gene/transcript level [63] | Versus Illumina short-read data |
| Inferential Variability | Good reproducibility [64] | Higher consistency than Illumina [63] | Replicate-to-replicate fluctuations |
| Allele-Specific Analysis | More challenging for SNP calling [63] | ~3× more true positive SNPs [63] | Due to higher sequencing error rate in ONT |
| Fusion Gene Detection | Identifies full-length fusion transcripts [14] | Precise junction sites [65] | Both enable full-length fusion analysis |
Experimental Protocols and Methodologies
To ensure the reproducibility of benchmarking studies, this section outlines detailed methodologies from key cited investigations.
Cell Lines and Sample Preparation:
- Utilized seven human cell lines: HCT116 (colon cancer), HepG2 (liver cancer), A549 (lung cancer), MCF7 (breast cancer), K562 (leukemia), HEYA8 (ovarian cancer), and H9 human embryonic stem cells.
- Each cell line sequenced with at least three high-quality biological replicates.
- Included six different spike-in RNA standards (Sequin V1/V2, ERCC, SIRVs E0/E2, long SIRVs) with known concentrations for quantification accuracy assessment.
Sequencing Protocols:
- Performed five different RNA-seq protocols in parallel: short-read Illumina cDNA, Nanopore direct RNA, Nanopore amplification-free direct cDNA, Nanopore PCR-amplified cDNA, and PacBio Iso-Seq.
- Generated transcriptome-wide N6-methyladenosine (m6A) profiling data (m6ACE-seq) to evaluate RNA modification detection from direct RNA-seq data.
- Extended the core dataset with additional samples from stomach cancer, head and neck cancer, HEK293T cell lines, and multiple myeloma patient samples.
Data Analysis Pipeline:
- Implemented the nf-core/nanoseq pipeline for standardized processing, including quality control, alignment, transcript discovery and quantification, differential expression analysis, RNA fusion detection, and RNA modification detection [62].
Protocol Modifications for Enhanced Performance:
- Incorporated inverted terminal repeats and unique molecular identifiers (UMIs) to prevent over-representation of short fragments and precisely recognize duplicated reads.
- Implemented Exonuclease I treatment between dT primer annealing and reverse transcription to prevent internal priming.
- Evaluated reverse transcriptase enzymes for improved stabilization of the RT complex during template-switching reaction.
- Optimized amplification parameters to inhibit the formation of artificial chimeric products.
- Utilized the SQK-LSK114 ligation sequencing kit rather than the standard PCR-cDNA sequencing kit to improve library loading efficiency.
Performance Validation:
- Benchmarking against Universal Human Reference RNA (UHRR) demonstrated significant increases in full-length non-chimeric (FLNC) read length distribution and gene body recovery.
- Achieved higher reference mapping ratio (99.9% vs. 89.43%) and lower fraction of reads aligned to top 10 abundant genes (2.7% vs. 5.41%) compared to standard ONT PCS protocol, indicating improved PCR bias inhibition.
Experimental Design for Large-Scale Benchmarking:
- Generated one of the largest PacBio long-read RNA-seq datasets, sample-matched with Illumina short-read RNA-seq for rigorous benchmarking.
- Analyzed 202 Human Pangenome Reference Consortium (HPRC) Kinnex datasets for comprehensive variant and isoform analysis.
- Developed longcallR tool for joint SNP calling, haplotype phasing, and allele-specific analysis of long-read RNA-seq data.
Performance Metrics:
- Assessed quantification accuracy through Pearson correlations exceeding 0.9 at the gene level and approaching 0.9 at the transcript level compared to Illumina data.
- Evaluated allele-specific splicing detection, identifying 88 significant allele-specific splicing events per sample on average, with 46% involving unannotated junctions.
Analysis Tools and Computational Methods
The accurate interpretation of long-read sequencing data depends heavily on specialized computational tools. A comprehensive benchmark of thirteen methods implemented in nine tools revealed significant differences in performance [66].
Table 3: Performance of Selected Isoform Detection Tools
| Software Tool | Precision | Sensitivity | Key Strengths | Computational Efficiency |
|---|---|---|---|---|
| IsoQuant | Highest | High | Best overall for alternative splicing detection [66] | Moderate |
| Bambu | High | High | Uses machine learning for transcript discovery [66] | Moderate |
| StringTie2 | High | High | Superior computational efficiency [66] | Highest |
| FLAIR (guided) | Robust | Robust | Comprehensive functional modules [66] | Moderate |
| RSEM | Most consistent across platforms [64] | N/A | Best for quantification accuracy [64] | N/A |
The following diagram illustrates the decision-making workflow for selecting appropriate tools based on research objectives, guided by benchmarking results.
The Scientist's Toolkit: Essential Research Reagents and Materials
Table 4: Key Research Reagents and Their Applications in Long-Read RNA Sequencing
| Reagent/Kit | Platform | Primary Function | Application Notes |
|---|---|---|---|
| PCR-cDNA Sequencing Kit | Nanopore | Generate amplified cDNA libraries | Highest throughput, lowest input requirement [14] |
| Direct cDNA Sequencing Kit | Nanopore | Amplification-free cDNA library prep | Reduces amplification biases [14] |
| Direct RNA Sequencing Kit | Nanopore | Sequence native RNA directly | Enables RNA modification detection [14] |
| Iso-Seq Library Prep Kit | PacBio | Full-length cDNA library preparation | Generates HiFi reads for isoform resolution [64] |
| Kinnex RNA Kit | PacBio | High-throughput full-length RNA-seq | Increases multiplexing capacity on Revio/Vega [63] |
| Spike-in RNA Controls | Both | Quantification accuracy benchmarking | SIRV, ERCC, Sequin with known concentrations [14] |
| UMIs (Unique Molecular Identifiers) | Both | Accurate read counting and deduplication | Essential for quantifying PCR duplicates [65] |
| Exonuclease I | Nanopore | Prevent internal priming | Improves full-length transcript recovery [65] |
Based on the comprehensive benchmarking data, each technology demonstrates distinct advantages suited to different research scenarios:
Select Oxford Nanopore Technologies when:
- Studying RNA modifications alongside isoform expression, using the direct RNA protocol [14] [62].
- Working with limited input material, utilizing the PCR-cDNA protocol which requires the least amount of RNA [14].
- Budget constraints are a primary consideration, as ONT provides a cost-effective option for isoform discovery [15].
Select Pacific Biosciences when:
- Pursuing allele-specific expression or splicing analysis, due to higher SNP calling accuracy and more true positive variants [63].
- Investigating long, rare, or novel isoforms, as PacBio consistently demonstrates superior recovery of these transcripts [64].
- Requiring the highest quantification accuracy at the transcript level, with demonstrated correlations approaching 0.9 compared to Illumina data [63].
- Conducting large-scale studies where high-throughput Kinnex kits on Revio or Vega systems provide scalable solutions [63].
For research focusing on embryo protocols and developmental biology, where both full-length isoform characterization and accurate quantification are critical, a hybrid approach may be optimal: using PacBio for comprehensive isoform discovery and annotation, followed by Nanopore for larger-scale quantitative studies across multiple samples and conditions. As both technologies continue to advance, with improvements in throughput, accuracy, and analysis tools, long-read RNA sequencing is positioned to become the foundational technology for transcriptome analysis, ultimately replacing short-read sequencing for applications requiring isoform-level resolution.
Computational Pipelines and Best Practices for Robust Data Analysis
In the field of embryology and developmental biology, single-cell RNA sequencing (scRNA-seq) has revolutionized our ability to understand cellular heterogeneity and lineage specification during early development. The choice between full-length transcript and 3' end counting protocols represents a fundamental methodological decision that directly influences downstream computational analysis, data interpretation, and biological conclusions. This comparison guide objectively evaluates these approaches within the context of embryo research, providing researchers with experimental data and computational frameworks to inform their study designs.
The core distinction between these methodologies lies in transcript coverage: full-length protocols capture complete transcript sequences, while 3' end counting methods focus sequencing on the 3' termini of transcripts. This fundamental difference creates divergent analytical requirements and opportunities throughout the computational pipeline, from read alignment to biological interpretation.
Methodological Comparison: Full-Length vs. 3' End Counting Approaches
Technical Foundations and Experimental Workflows
Full-length transcript protocols (e.g., SMART-Seq2, SMART-seq3, G&T-seq) are designed to capture and sequence the entire transcript molecule. These methods typically utilize template-switching mechanisms during reverse transcription to ensure complete cDNA representation, followed by PCR amplification. The resulting libraries preserve information about transcript isoforms, splicing variants, and sequence heterogeneity, making them particularly valuable for studying alternative splicing in developing embryos where isoform switching plays crucial regulatory roles [25] [33].
3' end counting protocols (e.g., 10X Genomics, Drop-seq, inDrop) employ poly(A) priming with cell barcodes and unique molecular identifiers (UMIs) to tag individual mRNA molecules at their 3' ends. These methods enable highly multiplexed analysis of thousands of cells simultaneously by incorporating barcodes during cDNA synthesis. The computational advantage lies in the ability to accurately quantify transcript abundance without normalization artifacts related to transcript length, as all reads originate from the 3' region [1] [6].
Table 1: Core Technical Characteristics of Representative Protocols
| Characteristic | Full-Length Protocols | 3' End Counting Protocols |
|---|---|---|
| Transcript Coverage | Entire transcript length | 3' end only |
| UMI Incorporation | Limited availability (e.g., SMART-seq3) | Standard feature |
| Amplification Method | PCR-based | PCR or in vitro transcription (IVT) |
| Multiplexing Capacity | Lower (96-384 cells) | Higher (thousands of cells) |
| Read Distribution | Across entire transcript | Localized to 3' end |
| Primary Applications | Isoform detection, mutation identification, fusion genes | Gene expression quantification, large-scale profiling |
Experimental Design Considerations for Embryo Research
When planning scRNA-seq experiments in embryo research, several biological and technical factors must be considered:
- Cell Input Requirements: Embryo studies often face material limitations. Full-length methods typically offer higher sensitivity with lower cell numbers, while 3' end counting requires sufficient cells for droplet-based encapsulation [25].
- Transcriptome Complexity: Developing embryos exhibit dynamic transcriptome changes including isoform switching. Full-length protocols capture this complexity more comprehensively [7].
- Cost Efficiency: For large-scale embryo screening studies, 3' end counting provides more cost-effective profiling per cell, while full-length methods offer deeper molecular characterization [1] [33].
Computational Pipelines: From Raw Data to Biological Insights
Analytical Workflows for Each Approach
The computational analysis of scRNA-seq data requires specialized pipelines tailored to the specific protocol characteristics. Below are the generalized workflows for both full-length and 3' end counting approaches:
Specialized Computational Tools and Their Applications
The analytical workflows for each approach require specialized computational tools:
Full-Length Analysis Tools:
- Isoform Detection: Tools like StringTie, Cufflinks, and FLAMES perform transcript assembly and quantification
- Splicing Analysis: LeafCutter, MAJIQ, and rMATS detect alternative splicing events
- Variant Calling: specialized pipelines for identifying single-nucleotide variants in transcriptomic data
3' End Counting Analysis Tools:
- Barcode Processing: CellRanger, STARsolo, and kallisto bustools handle demultiplexing and UMI counting
- Dimensionality Reduction: Seurat, Scanpy, and scran provide PCA, UMAP, and t-SNE implementations
- Cell Type Identification: SingleR, SCINA, and scCATCH enable automated cell annotation
Performance Benchmarking: Experimental Data and Comparisons
Detection Sensitivity and Technical Performance
Multiple studies have systematically compared the performance characteristics of full-length and 3' end counting protocols. The table below summarizes key benchmarking metrics from published evaluations:
Table 2: Experimental Performance Comparison Across Protocols
| Performance Metric | Full-Length Protocols | 3' End Counting Protocols | Experimental Basis |
|---|---|---|---|
| Genes Detected per Cell | 4,000-8,000 | 200-5,000 | [25] [33] |
| Technical Noise | Higher amplification bias | Lower noise with UMIs | [33] |
| Isoform Detection | Comprehensive | Limited | [1] [7] |
| Cost per Cell (EUR) | 10-75 | 4-8 (at scale) | [25] |
| Cell Throughput | 96-384 cells/run | 1,000-10,000 cells/run | [25] [6] |
| Differential Expression | Detects more DEGs | Fewer DEGs but focused on 3' UTR | [1] |
| Mapping Rate | Dependent on annotation | Less dependent on full annotation | [1] |
A comprehensive benchmark study evaluating six prominent scRNA-seq methods revealed that Smart-seq2 (full-length) detected the most genes per cell and across cells, while CEL-seq2, Drop-seq, MARS-seq, and SCRB-seq (3' end counting) quantified mRNA levels with less amplification noise due to the use of unique molecular identifiers (UMIs) [33]. Power simulations at different sequencing depths demonstrated that Drop-seq is more cost-efficient for transcriptome quantification of large numbers of cells, while MARS-seq, SCRB-seq, and Smart-seq2 are more efficient when analyzing fewer cells [33].
Biological Concordance and Interpretation
Despite technical differences, both approaches show strong concordance in biological interpretation when appropriately analyzed. A comparative study between whole transcriptome and 3' mRNA-seq found that both methods generate highly similar results and show comparable reproducibility between biological replicates [1]. While whole transcriptome sequencing typically detects more differentially expressed genes, enrichment analysis and pathway activation conclusions remain highly consistent between methodologies [1].
For embryo research specifically, the detection of short transcripts and low-abundance regulatory genes may be better with 3' end counting approaches, while isoform dynamics and structural variations are more reliably detected with full-length methods [1] [7].
Best Practices for Robust Data Analysis
Experimental Design and Quality Control
- Replicate Strategy: Incorporate biological replicates to distinguish technical variability from biological heterogeneity, crucial in embryo development studies where individual variations exist [1].
- Quality Metrics: For full-length protocols, assess reads mapped to exonic regions and transcript integrity numbers. For 3' end counting, monitor cell barcode ranking plots and UMI distributions [6].
- Spike-in Controls: Implement spike-in RNA standards for normalization, particularly important for full-length protocols where amplification biases can vary between samples [33].
Computational Recommendations
- Normalization Methods: Use protocol-specific normalization approaches—TPM or FPKM for full-length data, UMI-aware methods (e.g., SCTransform) for 3' end counting [6].
- Batch Effect Correction: Apply methods like Harmony, ComBat, or mutual nearest neighbors when integrating multiple embryos or experimental batches [6].
- Annotation Dependence: Recognize that 3' end counting performance is highly dependent on accurate 3' annotation, which may be limited in non-model organisms or poorly annotated genomes [1].
Research Reagent Solutions and Essential Materials
Table 3: Key Research Reagents and Computational Tools for scRNA-seq in Embryo Research
| Reagent/Tool | Function | Protocol Applicability |
|---|---|---|
| SMART-Seq HT Kit | Full-length cDNA synthesis with template switching | Full-length protocols |
| Chromium Next GEM Kit | Droplet-based encapsulation with barcoding | 3' end counting |
| Nextera XT DNA Library Prep | Tagmentation-based library preparation | Both protocols |
| CellRanger | Pipeline for processing 3' end counting data | 3' end counting |
| STARsolo | Spliced-aware aligner with UMI processing | Both protocols |
| Seurat | R toolkit for single-cell analysis | Both protocols |
| Scanpy | Python-based single-cell analysis | Both protocols |
| Trimmomatic | Read quality control and adapter trimming | Both protocols |
| UMI-tools | Deduplication and UMI processing | 3' end counting |
| StringTie | Transcript assembly and quantification | Full-length protocols |
The choice between full-length and 3' end counting approaches should be guided by specific research questions and experimental constraints in embryo studies. Full-length protocols are recommended when investigating isoform dynamics, splicing regulation, or structural variants in developing embryos, despite higher per-cell costs and lower throughput. 3' end counting approaches excel in large-scale profiling studies where cellular heterogeneity mapping and cost-effective quantification are priorities.
Future methodological developments will likely bridge these approaches, combining the comprehensive transcriptome coverage of full-length methods with the quantitative precision and scalability of 3' end counting. As computational methods continue to evolve, integration strategies that leverage the complementary strengths of both approaches will provide increasingly comprehensive insights into embryonic development at single-cell resolution.
A Rigorous Comparison: Validating Performance Across scRNA-seq Platforms
The choice between full-length and 3' end counting single-cell RNA sequencing (scRNA-seq) protocols represents a critical strategic decision in embryogenesis research, directly impacting data quality, biological insights, and experimental feasibility. These technologies enable researchers to capture gene expression profiles at the resolution of individual cells, providing unprecedented views into the cellular heterogeneity and transcriptional dynamics of early development. However, each approach carries distinct advantages and compromises in sensitivity, accuracy, and throughput that must be carefully balanced against specific research objectives and experimental constraints. For embryo research, where sample material is often limited and developmental processes occur with precise temporal coordination, selecting the appropriate transcriptomic profiling method becomes particularly crucial. This guide provides a direct performance comparison between these competing methodologies, synthesizing experimental data to inform protocol selection for studies of embryonic systems at single-cell resolution.
Performance Metric Comparison
The quantitative performance differences between full-length and 3' end counting scRNA-seq protocols stem from their fundamental methodological approaches, each optimized for different research priorities. The table below summarizes key comparative metrics based on experimental evaluations across multiple studies.
Table 1: Direct Performance Metrics for Embryo scRNA-seq Protocols
| Performance Metric | Full-Length Protocols | 3' End Counting Protocols | Experimental Support |
|---|---|---|---|
| Genes Detected per Cell | 2,000-5,000 (HEK293T) [29] | Generally lower for same sequencing depth [1] | Significantly more genes detected in HEK293T cells by FLASH-seq, especially protein-coding and longer genes [29] |
| Technical Sensitivity | Superior for low-abundance transcripts [6] | Reduced sensitivity for low-expression genes [1] | Full-length methods (Smart-Seq2, MATQ-Seq) outperform in detecting low-abundance genes [6] |
| Transcriptomic Coverage | Uniform across transcript body [29] | 3' UTR-biased [1] [6] | Full-length protocols provide even gene-body coverage versus 3' end localization [29] |
| Quantitative Accuracy | Moderate (potential PCR amplification bias) [6] | High with UMI incorporation [6] [29] | UMIs in 3' end counting enable precise molecule counting, reducing technical variability [6] |
| Cells Processed per Run | 96-384 (plate-based) [6] | 10,000+ (droplet-based) [6] | Droplet-based methods (inDrop, Drop-Seq) enable massive parallelization [6] |
| Hands-on Time | ~4.5 hours (FLASH-seq) to >8 hours [29] | Streamlined workflow with less hands-on time [1] | 3' mRNA-Seq workflows are notably shorter with fewer processing steps [1] |
| Cost per Cell | Higher reagent costs [6] | Significantly lower [6] | Droplet-based 3' end counting dramatically reduces cost per cell [6] |
| Multiplexing Capacity | Limited by plate formats [6] | High with cellular barcoding [67] [6] | Cell barcodes enable pooling samples before library prep [67] |
Experimental Protocols and Methodologies
Full-Length scRNA-seq Protocols
Full-length single-cell RNA sequencing methods capture complete transcript sequences, enabling comprehensive characterization of transcriptome diversity. The experimental workflow for prominent full-length protocols involves several critical phases:
Cell Isolation and Lysis: Individual cells are isolated using fluorescence-activated cell sorting (FACS) or microfluidic platforms [6]. The isolated cells undergo immediate lysis to release RNA content while maintaining RNA integrity, a crucial consideration when working with embryonic material that may have varying RNA quality.
Reverse Transcription and cDNA Synthesis: This represents a key differentiator for full-length protocols. The FLASH-seq method utilizes Superscript IV reverse transcriptase for enhanced processivity, combined with a template-switching oligonucleotide (TSO) containing riboguanosine instead of locked nucleic acid to reduce strand-invasion artifacts [29]. The reaction includes increased dCTP concentration to favor C-tailing activity of the reverse transcriptase, boosting template-switching efficiency. FLASH-seq innovatively combines reverse transcription and cDNA preamplification into a single step, significantly reducing processing time.
cDNA Amplification and Library Preparation: Full-length protocols employ PCR-based amplification of cDNA, with FLASH-seq achieving sufficient yields in just 10-16 cycles depending on cell RNA content [29]. Following amplification, libraries are prepared via tagmentation using Tn5 transposase, a rapid approach that fragments DNA and adds sequencing adapters simultaneously. FLASH-seq demonstrates that intermediate purification steps can be eliminated when proceeding directly to tagmentation, saving approximately 2.5 hours without compromising library quality.
Quality Control and Sequencing: The resulting full-length libraries undergo quality assessment for fragment size distribution and concentration before sequencing on Illumina platforms. The extensive amplification in full-length protocols requires careful quality control to monitor potential bias introduction.
3' End Counting scRNA-seq Protocols
3' end counting methods focus sequencing resources specifically on transcript termini, providing a cost-effective approach for quantitative gene expression profiling:
Cell Barcoding and Capture: Droplet-based systems like Drop-Seq and inDrop encapsulate individual cells in nanoliter droplets with barcoded beads [6]. Each bead contains oligonucleotides with poly(dT) sequences for mRNA capture, unique molecular identifiers (UMIs) for transcript counting, and cell barcodes that label all mRNAs from the same cell. This approach enables massive parallel processing of thousands of cells in a single experiment.
On-Bead Reverse Transcription: Within each droplet, captured mRNAs undergo reverse transcription while attached to the bead surface, creating cell-specific cDNA libraries with incorporated barcodes [6]. The emulsion is then broken, and pooled cDNA is purified and amplified.
Library Preparation and Sequencing: The amplified cDNA is processed into sequencing libraries, typically requiring less fragmentation than full-length approaches due to the focused nature of the captured sequences. These libraries are sequenced with a focus on obtaining sufficient coverage of the 3' ends rather than complete transcript sequences.
Data Processing and Demultiplexing: Computational pipelines assign reads to individual cells based on their barcode sequences, count unique transcripts using UMIs, and generate gene expression matrices [6]. The simplified structure of 3' end data enables streamlined analysis workflows compared to the complex processing required for full-length transcriptome data.
Figure 1: scRNA-seq Protocol Workflow Comparison
Applications in Embryo Development Research
Resolving Developmental Heterogeneity
Single-cell RNA sequencing technologies have revolutionized our understanding of embryonic development by enabling researchers to characterize cell-type diversity and lineage specification during embryogenesis. Full-length scRNA-seq protocols provide distinct advantages for identifying novel isoforms and alternative splicing events that are particularly relevant during embryonic development [68]. The comprehensive transcript coverage enables detection of isoform switching during cell fate decisions, a capability that is compromised in 3' end counting approaches. Studies of zygotic genome activation greatly benefit from full-length protocols, as they can identify transcription start sites and novel isoforms emerging during this critical developmental transition [69].
For mapping developmental trajectories, 3' end counting methods offer sufficient information to reconstruct lineage relationships through pseudotemporal ordering algorithms. The high cell throughput enables capturing rare progenitor populations that might be missed in lower-throughput full-length approaches. Research on rare minnow embryos utilized full-length transcriptome sequencing to investigate zygotic genome activation mechanisms, demonstrating the value of complete transcript information for understanding this pivotal developmental event [69].
Comparative Embryogenesis and Evolutionary Insights
The application of scRNA-seq in evolutionary developmental biology (evo-devo) has revealed both conserved and divergent transcriptional programs governing embryogenesis across species. Research on Acropora coral species demonstrated that despite morphological conservation during gastrulation, each species utilizes divergent gene regulatory networks, supporting the concept of developmental system drift [70]. Full-length scRNA-seq was essential for these insights, as it enabled researchers to identify species-specific differences in paralog usage and alternative splicing patterns that indicate independent peripheral rewiring of conserved developmental modules.
Long-read single-cell technologies now enable direct identification of full-length RNA isoforms, advancing studies of complex alternative splicing events at single-cell resolution across different embryonic systems [68]. These approaches are particularly valuable for detecting allele-specific expression and RNA editing events during early development, providing mechanistic insights into the regulation of embryogenesis.
Figure 2: Embryo Research Applications by Protocol Type
Research Reagent Solutions
Selecting appropriate reagents is critical for successful implementation of either scRNA-seq approach. The table below outlines essential research reagent solutions for both protocol types, along with their specific functions in embryonic transcriptomics workflows.
Table 2: Essential Research Reagents for Embryo scRNA-seq Protocols
| Reagent Category | Specific Examples | Protocol Application | Function in Embryo Research |
|---|---|---|---|
| Reverse Transcriptase | Superscript IV [29] | Full-length | Enhanced processivity for full-length cDNA synthesis from limited embryonic material |
| Template-Switching Oligo | FS-TSO with riboguanosine [29] | Full-length | Reduces strand-invasion artifacts while enabling template switching |
| Barcoded Beads | Drop-Seq, 10x Genomics beads [6] | 3' end counting | Cell barcoding and mRNA capture for high-throughput embryonic cell profiling |
| Unique Molecular Identifiers | Modified TSO with UMIs [29] | Both | Enables accurate transcript counting, crucial for quantitative embryonic expression |
| Cell Lysis Reagents | Trizol Reagent [69] | Both | Maintains RNA integrity during extraction from embryonic tissues |
| Polymerase Mix | KAPA HiFi HotStart ReadyMix [29] | Both | High-fidelity amplification with minimal bias for embryonic transcriptomes |
| Tagmentation Enzyme | Tn5 Transposase [29] | Both | Efficient fragmentation and adapter addition for library construction |
| mRNA Capture Beads | NEBNext Poly(A) mRNA Magnetic Beads [69] | Both | Selective enrichment of polyadenylated transcripts from total RNA |
Strategic Protocol Selection Framework
Decision Factors for Embryo Research
Selecting between full-length and 3' end counting scRNA-seq protocols requires careful consideration of multiple experimental factors specific to embryonic systems:
Biological Question Priority: The nature of the research question should drive protocol selection. For investigations requiring isoform resolution, detection of allele-specific expression, or characterization of splicing variants during embryogenesis, full-length protocols provide essential data dimensions [68]. When the primary goal is comprehensive cell type identification, lineage tracing, or mapping transcriptional trajectories across large cell numbers, 3' end counting approaches offer practical advantages [6].
Sample Characteristics and Availability: Embryonic material often presents limitations in cell number and viability that influence method selection. For precious samples with limited cell numbers, such as early embryonic stages or microdissected tissues, full-length protocols maximize information capture per cell [29]. When working with more abundant embryonic material or when spatial organization needs correlation with cell identities, 3' end counting enables surveying sufficient cells to resolve rare populations and contextual relationships.
Experimental Resources and Infrastructure: Practical considerations including budget, sequencing capacity, and bioinformatics capabilities significantly impact protocol feasibility. Full-length methods require greater sequencing depth per cell to leverage their comprehensive transcript coverage, typically 2-5 million reads per cell compared to 50,000-100,000 for 3' end counting [1] [29]. The bioinformatics complexity also differs substantially, with full-length data requiring specialized tools for isoform reconstruction and splicing analysis.
Emerging Technologies and Future Directions
The evolving landscape of single-cell technologies continues to address limitations of both approaches while introducing new capabilities. Long-read single-cell sequencing technologies now enable full-length isoform identification at single-cell resolution, bridging the gap between throughput and transcriptome completeness [68]. These methods leverage improved accuracy of Pacific Biosciences (99.9%) and Oxford Nanopore Technologies (>99%) platforms to resolve complex alternative splicing events during embryonic development.
Multimodal approaches that combine RNA sequencing with additional data dimensions—including chromatin accessibility, surface protein expression, and spatial information—provide increasingly comprehensive views of embryonic development. The development of targeted scRNA-seq methods focusing on specific gene panels offers a middle ground, enabling enhanced sensitivity for key developmental markers while maintaining cost-effectiveness for large-scale experiments.
Table 3: Protocol Selection Guide for Embryo Research Applications
| Research Scenario | Recommended Protocol | Rationale | Sequencing Depth Guidance |
|---|---|---|---|
| Zygotic Genome Activation | Full-length (Smart-Seq2, FLASH-seq) | Complete transcript information essential for novel isoform detection [69] | 2-5 million reads per cell |
| Lineage Tracing | 3' end counting (10x Genomics, Drop-Seq) | High cell throughput needed for trajectory reconstruction [6] | 50,000-100,000 reads per cell |
| Evolutionary Comparisons | Full-length with long-read options | Alternative splicing and isoform usage differences between species [70] | 3-6 million reads per cell |
| Large-Scale Mutant Screens | 3' end counting | Cost-effective profiling of multiple genetic conditions [6] | 20,000-50,000 reads per cell |
| Rare Cell Type Identification | 3' end counting | Maximum cell numbers to capture low-frequency populations [6] | 50,000-100,000 reads per cell |
| Allele-Specific Expression | Full-length with UMIs | Complete transcript phasing for allele resolution [68] | 2-4 million reads per cell |
The accurate detection of rare transcripts and isoforms represents a frontier challenge in modern transcriptomics, with profound implications for understanding cellular heterogeneity, developmental biology, and disease mechanisms. While next-generation sequencing has revolutionized our ability to profile gene expression, significant limitations persist in characterizing the full diversity of transcript isoforms, particularly those expressed at low levels or with complex structures. The fundamental distinction between full-length transcript sequencing and 3' end counting methods creates a critical methodological divide, each with inherent trade-offs in sensitivity, throughput, and informational content [1] [11]. This guide systematically benchmarks current technologies for rare isoform detection, providing objective performance comparisons and experimental data to inform platform selection for specific research applications across diverse biological contexts, including embryonic development where transcript diversity is particularly consequential.
The pursuit of rare isoform detection is not merely technical but biological in essence—these often elusive transcripts can include tissue-specific isoforms, developmental regulators, disease-associated splice variants, and biomarkers present in limited cell populations. As the LRGASP consortium demonstrated, technological choices directly impact the ability to resolve this "dark matter" of the transcriptome, with significant implications for biological interpretation [64]. This assessment synthesizes evidence from multiple benchmarking studies to establish a rigorous framework for technology selection, experimental design, and data interpretation in the study of transcriptomic diversity.
Technology Landscape: Methodological Approaches and Their Applications
The current transcriptomics landscape encompasses diverse technological approaches, each with distinctive strengths for particular applications. Full-length transcript sequencing captures complete RNA molecules, enabling comprehensive characterization of splice variants, fusion transcripts, and novel isoforms, while 3' end counting methods focus sequencing efforts on transcript termini for efficient gene-level quantification [1]. This fundamental distinction governs the trade space between informational richness and analytical throughput, with implications for rare transcript detection.
Table 1: Core Transcriptomic Technologies for Isoform Detection
| Technology Category | Key Variants | Primary Applications | Isoform Detection Capability |
|---|---|---|---|
| Full-length bulk RNA-seq | SMART-seq variants, G&T-seq, PacBio Iso-Seq | Novel isoform discovery, fusion detection, allele-specific expression | Comprehensive isoform resolution with base-level accuracy |
| 3' end counting bulk | QuantSeq, other 3' mRNA-seq | High-throughput screening, gene expression quantification, degraded samples | Limited to gene-level quantification, cannot detect novel structures |
| Single-cell full-length | SMART-seq2, SMART-seq3, Quartz-Seq2 | Cellular heterogeneity, rare cell type identification, isoform diversity | Cell-level isoform information with UMI quantification |
| Single-cell 3' end | Drop-Seq, inDrop, Chromium | Large-scale cell atlas projects, population screening | Gene expression only, no isoform information |
| Long-read sequencing | PacBio Iso-Seq, Nanopore cDNA/dRNA | Complete isoform sequencing, RNA modification detection | Full-length transcript characterization without assembly |
Single-cell RNA sequencing technologies further divide along this paradigm, with plate-based methods (SMART-seq2, SMART-seq3) typically providing full-length coverage at lower throughput, while droplet-based approaches (Drop-Seq, inDrop, Chromium) employ 3' counting to profile thousands of cells simultaneously [6] [11]. As evidenced by benchmarking studies, plate-based full-length methods demonstrate superior sensitivity for gene detection per cell, enabling characterization of low-abundance transcripts in rare cell populations [11]. Emerging long-read technologies (PacBio Iso-Seq, Oxford Nanopore) now enable full-length transcript sequencing without inference, providing unambiguous isoform resolution particularly valuable for detecting rare and novel transcripts [64] [14] [15].
Figure 1: Experimental decision framework for transcript isoform detection technologies, illustrating the relationship between methodological approaches and detection capabilities.
Spatial transcriptomics technologies represent an emerging dimension in transcriptome analysis, preserving geographical context while profiling gene expression. These platforms divide into imaging-based approaches (Xenium, Merscope, CosMx) that utilize in situ hybridization for transcript localization, and sequencing-based methods (Visium, Visium HD, Stereo-seq) that capture RNA onto spatially barcoded arrays [71] [72]. While currently limited in gene coverage compared to single-cell methods, spatial technologies provide unique insights into tissue microenvironmental regulation of isoform expression, with resolution continuously improving toward single-cell level [71].
Experimental Protocols: Methodological Details for Isoform Detection
Full-Length Single-Cell RNA Sequencing
Benchmarking studies of plate-based full-length scRNA-seq protocols reveal critical differences in performance characteristics for rare transcript detection. The G&T-seq protocol demonstrates highest gene detection sensitivity, employing magnetic bead-based separation of mRNA from genomic DNA followed by SMART-seq2-based amplification [11]. This separation step purifies mRNA, reducing background and enhancing sensitivity for low-abundance transcripts. SMART-seq3 incorporates unique molecular identifiers (UMIs) at the 5' end of transcripts, enabling accurate molecular counting while maintaining full-length coverage, achieving sensitivity approaching single-molecule RNA FISH [11]. Commercial kits like Takara SMART-Seq HT streamline the workflow through combined reverse transcription and amplification steps, reducing hands-on time while maintaining high sensitivity, though at premium cost [11].
For comprehensive isoform discovery, PacBio Iso-Seq protocols generate full-length cDNA sequences without fragmentation, enabling direct observation of complete transcript structures. The methodology employs template-switching reverse transcription to generate full-length cDNAs, PCR amplification, size selection, and SMRT sequencing [64]. Recent advances with the MAS-Seq concatenation method significantly increase throughput by linking multiple cDNA molecules before sequencing, making large-scale isoform discovery more feasible [64]. The Nanopore direct RNA sequencing protocol sequences native RNA without reverse transcription or amplification biases, additionally providing access to RNA modification information through analysis of base-calling signatures [14] [15].
3' End Counting Methods
The QuantSeq 3' mRNA-seq method exemplifies the streamlined 3' counting approach, utilizing oligo(dT) priming for reverse transcription, followed by library preparation with minimal steps [1]. This efficiency enables cost-effective processing of hundreds of samples, particularly advantageous for large-scale screening applications or biobank studies. The targeted nature of 3' sequencing generates less complex libraries, allowing lower sequencing depth (1-5 million reads per sample) while maintaining robust gene-level quantification [1]. However, this approach sacrifices isoform-level information and underdetects shorter transcripts compared to whole transcriptome methods [1].
In the single-cell domain, droplet-based 3' end counting methods (Drop-Seq, inDrop, 10X Chromium) encapsulate individual cells with barcoded beads in oil-emulsion droplets, with poly(T) primers capturing mRNA 3' ends [6]. These methods achieve massive parallelism, profiling thousands to millions of cells in single experiments, enabling detection of rare cell populations through computational analysis. However, without full-length transcript information, isoform characterization remains impossible with standard workflows, limiting biological insights to gene-level expression patterns [6] [11].
Performance Benchmarking: Quantitative Comparisons for Technology Selection
Sensitivity and Detection Accuracy
Rigorous benchmarking reveals substantial differences in isoform detection performance across platforms. The LRGASP consortium demonstrated that PacBio Iso-Seq consistently detected the greatest number of genes and isoforms, with particular advantage for long transcripts and low-expression isoforms [64]. In controlled spike-in experiments with synthetic RNA controls (SIRVs), PacBio Iso-Seq was the only method that recovered all SIRV transcripts, demonstrating superior completeness in isoform detection [64]. The consortium further found that PacBio sequencing generated 2-fold higher abundance resolution compared to Oxford Nanopore cDNA data, indicating more accurate isoform quantification [64].
Table 2: Performance Benchmarking of Transcript Detection Methods
| Method Category | Protocol Examples | Genes Detected per Cell | Isoform Detection Accuracy | Rare Transcript Sensitivity | Major Limitations |
|---|---|---|---|---|---|
| Full-length plate-based scRNA-seq | G&T-seq, SMART-seq3, Takara SMART-Seq HT | 5,000-8,000 genes (highly variable) | High for detected transcripts | Excellent with UMIs | Low throughput, high cost per cell |
| Droplet-based scRNA-seq | Drop-Seq, 10X Chromium | 1,000-3,000 genes | No isoform information | Limited to gene level | No isoform data, high amplification noise |
| Long-read PacBio | Iso-Seq with MAS-Seq | Highest in bulk comparisons | Highest (SIRV spike-in recovery: 100%) | Superior for long, low-abundance isoforms | Lower throughput, higher RNA input |
| Long-read Nanopore | Direct RNA, cDNA PCR | Comparable to PacBio for major isoforms | Good for highly expressed isoforms | Good with sufficient coverage | Higher error rate, quantification challenges |
| 3' end counting | QuantSeq, other 3' mRNA-seq | Limited by 3' annotation | Not applicable | Gene-level only | Misses non-polyadenylated transcripts |
The Singapore Nanopore Expression (SG-NEx) project conducted a comprehensive multi-protocol comparison, sequencing seven human cell lines with PacBio Iso-Seq, Nanopore direct RNA, Nanopore direct cDNA, Nanopore PCR cDNA, and Illumina short-read sequencing [14]. Their analysis demonstrated that long-read RNA sequencing more robustly identifies major isoforms compared to short-read methods, with Nanopore direct RNA sequencing providing additional information about RNA modifications [14]. However, the study noted challenges in isoform quantification accuracy across all long-read protocols, particularly for low-abundance transcripts where technical noise presents significant analytical challenges.
In single-cell benchmarking, full-length methods (SMART-seq2, SMART-seq3) consistently detect more genes per cell than droplet-based 3' end counting approaches, with G&T-seq achieving highest sensitivity in comparative assessments [11]. This enhanced detection capability directly improves ability to characterize rare cell types and low-abundance transcripts. The incorporation of UMIs in SMART-seq3 provides more accurate molecular counting, approaching the sensitivity of single-molecule RNA FISH for transcript detection [11].
Experimental Validation and Reproducibility
A critical metric for rare transcript detection is validation rate of novel isoforms. The LRGASP consortium experimentally validated isoforms discovered by both PacBio and Nanopore platforms using targeted PCR, achieving remarkable 100% validation rates for isoforms consistently detected across software pipelines [64]. Surprisingly, even isoforms with low reproducibility across computational pipelines showed high validation rates, suggesting that biological reality often exceeds computational confidence [64]. This demonstrates that long-read technologies genuinely capture isoform diversity rather than generating technical artifacts.
Method reproducibility varies substantially across platforms. In the Ma et al. (2019) study comparing whole transcriptome and 3' mRNA-seq, both approaches demonstrated similar reproducibility between biological replicates, though whole transcriptome methods detected more differentially expressed genes [1]. For single-cell methods, plate-based full-length protocols generally show higher technical reproducibility than droplet-based methods, though with significantly lower throughput [11]. Computational methods for differential expression analysis from single-cell data also show important performance differences, with pseudobulk approaches generally outperforming naïve single-cell methods that treat cells as independent observations [73].
Technology Selection Framework: Matching Tools to Biological Questions
Decision Criteria for Experimental Design
Selecting the optimal transcript detection technology requires careful consideration of multiple experimental factors:
Biological Question Emphasis: Projects focused on novel isoform discovery, splice variant characterization, or fusion transcript detection require full-length sequencing approaches (PacBio Iso-Seq, Nanopore, or full-length scRNA-seq) [64] [15]. Studies emphasizing gene expression quantification across many samples or conditions benefit from 3' end counting methods (QuantSeq, droplet-based scRNA-seq) for their cost efficiency and analytical simplicity [1].
Sample Type and Quality: Degraded samples (FFPE, archived tissues) often perform better with 3' end counting methods due to their focus on transcript termini [1] [72]. High-quality RNA enables the application of more demanding full-length protocols. Single-cell experiments must further consider cell viability, input requirements, and dissociation protocols [6] [11].
Throughput Requirements: Large-scale studies (hundreds to thousands of samples) may necessitate 3' end counting for practical reasons, while focused mechanistic studies can utilize more intensive full-length approaches [1] [11]. The recent throughput improvements in long-read sequencing (Revio system, MAS-Seq) are gradually mitigating this tradeoff [64].
Analytical Resources: Long-read data and full-length single-cell data require specialized computational expertise and infrastructure, while 3' end counting data benefits from more established analytical pipelines [6] [72].
Special Considerations for Embryonic Research
Embryonic transcriptomes present unique challenges including limited starting material, transient expression dynamics, and extensive alternative splicing during development. These considerations favor full-length single-cell methods with high detection sensitivity (SMART-seq3, G&T-seq) when studying rare transcriptional events in early development [11]. The ability to simultaneously profile genomic variation and transcriptomes using G&T-seq is particularly valuable for connecting genotype to phenotype in developmental models [11].
For spatial mapping of embryonic gene expression, high-resolution spatial transcriptomics (Xenium, CosMx, Visium HD) enables preservation of architectural context while characterizing expression patterns, though current gene throughput limitations constrain isoform-level analysis [71] [72]. Multi-omics integration approaches that combine spatial transcriptomics with full-length isoform data from dissociated cells provide complementary insights into embryonic development.
Table 3: Essential Research Reagents and Computational Tools
| Category | Specific Tools/Reagents | Primary Function | Considerations for Rare Transcript Detection |
|---|---|---|---|
| Library Prep Kits | Takara SMART-Seq HT, NEB NEBNext Single Cell, Lexogen QuantSeq | cDNA synthesis, library preparation | Commercial kits optimize reproducibility; UMI incorporation reduces amplification bias |
| Spike-in Controls | SIRVs, ERCC, Sequins | Quantification calibration, quality control | Essential for normalizing technical variability in sensitivity |
| Single-cell Isolation | FACS, microfluidics (Fluidigm C1), droplet-based (10X) | Cell separation, barcoding | Method affects cell viability and RNA quality; influences detection sensitivity |
| Computational Tools | SQANTI3, IsoQuant, TALON, Cell Ranger | Isoform classification, quantification | Tool selection significantly impacts isoform detection accuracy and false discovery rates |
| Quality Metrics | RIN/DV200, read coverage uniformity, UMI saturation | Experimental QC | Critical for interpreting detection limits and technical variability |
The SG-NEx pipeline provides a community-curated computational workflow for processing long-read RNA-seq data, incorporating quality control, alignment, isoform identification, and quantification [14]. For alternative polyadenylation analysis, APAlyzer and APA-Scan enable detection of 3' UTR variants from standard RNA-seq data, though performance varies substantially across tools [74]. The LRGASP consortium recommendations emphasize using SQANTI3 for isoform classification and quality assessment, with IsoQuant and FLAIR performing well for isoform identification across platforms [64].
Figure 2: Integrated experimental and computational workflow for robust detection of rare transcripts and isoforms, highlighting critical quality control steps.
Essential laboratory reagents include spike-in RNA controls (SIRVs, ERCC, Sequins) at known concentrations, which enable normalization of technical variability and quantitative assessment of detection sensitivity [14]. UMI incorporation during library preparation is particularly valuable for distinguishing biological variation from amplification artifacts in both single-cell and bulk protocols [11]. For single-cell studies, cell viability maintenance through appropriate dissociation protocols and handling conditions is crucial for preserving rare transcript populations that may be preferentially degraded in stressed cells [6] [11].
The landscape of technologies for rare transcript detection is evolving rapidly, with several promising directions emerging. Long-read sequencing platforms are achieving progressively higher throughput and lower costs, gradually overcoming traditional barriers to widespread adoption [64] [14] [15]. The integration of single-cell and long-read technologies represents a particularly promising frontier, potentially enabling comprehensive isoform characterization at cellular resolution [11] [15]. Multi-omics approaches that combine transcriptomic with proteomic, epigenomic, and spatial data will provide richer contextual understanding of isoform functional consequences [72] [15].
Methodologically, computational algorithms for isoform detection and quantification continue to improve, with machine learning approaches showing particular promise for distinguishing technical artifacts from biological signals [74]. The development of standardized benchmarking resources like the SG-NEx dataset enables more rigorous method evaluation and optimization [14]. As these technologies mature, their application to embryonic development, disease pathogenesis, and rare cell populations will undoubtedly yield novel biological insights, expanding our understanding of transcriptomic diversity and its functional implications across biological systems.
For researchers embarking on studies of rare transcripts, a staged approach often proves most effective: initial discovery using full-length methods (long-read or full-length scRNA-seq) to characterize transcript diversity, followed by targeted validation and larger-scale screening using more focused approaches (3' end counting, targeted sequencing). This balanced strategy maximizes both biological insight and practical feasibility, advancing our understanding of transcriptomic complexity while respecting resource constraints inherent to scientific research.
Preimplantation genetic testing (PGT) has become an integral component of assisted reproductive technology, enabling the selection of embryos with the highest reproductive potential and reducing the risk of transmitting genetic disorders [75]. The evolution of PGT methodologies has introduced multiple approaches, each with distinct technical foundations and clinical applications. This case study provides a systematic comparison of contemporary PGT protocols, evaluating their performance characteristics, technical requirements, and clinical validity to inform researchers and clinicians in selecting appropriate methodologies for specific applications.
The foundational shift from cleavage-stage biopsy to trophectoderm biopsy at the blastocyst stage represents a critical advancement in the field. This transition has dramatically improved reliability by reducing the relative impact on embryonic development from 12-25% of total cells to just 5-8% [76]. Furthermore, blastocyst-stage biopsy provides a more robust cellular substrate for genomic analysis while aligning with the embryo's natural lineage segregation, sampling from the trophectoderm rather than the inner cell mass that gives rise to the fetus [76].
Methodological Comparison of Major PGT Platforms
Classification of PGT Modalities by Diagnostic Target
PGT encompasses several specialized modalities designed to address distinct genetic questions, each with defined technical requirements and clinical applications.
Table 1: PGT Modalities and Their Primary Applications
| PGT Modality | Genetic Target | Primary Clinical Applications | Key Technical Considerations |
|---|---|---|---|
| PGT-M (Preimplantation Genetic Testing for Monogenic Disorders) | Single-gene pathogenic variants | Autosomal dominant/recessive disorders, X-linked disorders, HLA matching [77] [76] | Requires family haplotype mapping; >99% accuracy rates [76] |
| PGT-A (Preimplantation Genetic Testing for Aneuploidy) | Whole-chromosome gains or losses | Advanced maternal age, recurrent implantation failure, recurrent pregnancy loss [77] [78] | Detects aneuploidy; clinical value debated in recent trials [78] |
| PGT-SR (Preimplantation Genetic Testing for Structural Rearrangements) | Chromosomal structural rearrangements | Balanced translocations, inversions, other structural variants [77] | Reduces miscarriage risk in carriers of balanced translocations [77] |
| PES/PGT-P (Polygenic Embryo Screening) | Polygenic risk scores | Risk screening for common complex diseases (e.g., CAD, diabetes) [77] | Emerging technology with ethical considerations; limited clinical validation [77] [76] |
Analytical Techniques in PGT
Multiple molecular techniques have been developed to support the various PGT modalities, each offering different resolution, throughput, and analytical capabilities.
Table 2: Comparison of Major PGT Analytical Platforms
| Methodology | Resolution | Primary Applications | Advantages | Limitations |
|---|---|---|---|---|
| Next-Generation Sequencing (NGS) | Single-gene to whole-chromosome | PGT-A, PGT-M, comprehensive analysis [76] [78] | High resolution, detects mosaicism, parallel analysis of multiple genetic features [76] | Cost, analytical complexity, potential sequencing artifacts [79] |
| Array Comparative Genomic Hybridization (aCGH) | Whole-chromosome | PGT-A, detection of aneuploidies [79] [78] | Established technology, comprehensive chromosome screening | Cannot detect low-level mosaicism or balanced rearrangements |
| Single Nucleotide Polymorphism (SNP) Arrays | Gene to chromosome level | PGT-M, PGT-A, linkage analysis [76] | Enables haplotype mapping without direct mutation detection [76] | Requires reference samples from family members |
| Quantitative PCR (qPCR) | Targeted chromosome counting | Rapid aneuploidy screening [78] | Fast turnaround time, lower cost | Limited chromosome coverage in earlier iterations |
| Targeted Multiplex PCR | Single-gene level | PGT-M for specific mutations [76] | High accuracy for known mutations, combined with linkage analysis | Limited to pre-defined mutations, development required for each condition |
Whole Genome Amplification Techniques
The minimal cellular material obtained from embryo biopsy necessitates whole genome amplification (WGA) prior to comprehensive genetic analysis. The selection of WGA methodology significantly impacts downstream applications and data quality.
Table 3: Performance Comparison of Whole Genome Amplification Methods
| Parameter | Multiple Displacement Amplification (MDA) | PCR-Based Methods (OmniPlex) |
|---|---|---|
| Polymerase Enzyme | Phi29 polymerase with proofreading activity [79] | Taq DNA polymerase [79] |
| Amplicon Size | Up to 100 kb [79] | Limited to ~3 kb [79] |
| Allele Dropout (ADO) Rate | Lower overall ADO rates [79] | Higher overall ADO rates [79] |
| Genomic Coverage | Better genomic recovery [79] | Reduced coverage uniformity |
| Preferred Applications | STR sizing, aCGH, Sanger sequencing [79] | Compatible with multiple platforms but with limitations |
A comparative study of 62 embryos from nine couples with various inheritance patterns demonstrated that MDA consistently outperformed PCR-based WGA in genomic recovery and allele dropout rates, making it particularly suitable for protocols requiring high accuracy in allele detection, such as in autosomal dominant conditions [79].
Performance Metrics and Clinical Validation
Diagnostic Accuracy Across PGT Modalities
The analytical performance of PGT methodologies varies significantly based on the genetic target and technical approach.
PGT-M demonstrates exceptional accuracy, with validated diagnostic protocols existing for over 200 monogenic conditions [76]. When properly validated, PGT-M programs consistently achieve accuracy rates exceeding 99%, with misdiagnosis rates below 0.1% [76]. This high reliability is accomplished through complementary approaches combining direct mutation detection with linked marker analysis to mitigate allele dropout and recombination events [76] [79].
PGT-A performance is more variable, with diagnostic accuracy dependent on the analytical platform and biopsy quality. Early fluorescence in situ hybridization (FISH)-based approaches analyzing 5-10 chromosomes showed limited clinical benefit, while comprehensive 24-chromosome analysis methods (aCGH, NGS, qPCR) demonstrate improved predictive value [78]. However, recent multicenter randomized controlled trials have questioned the overall efficacy of PGT-A in improving live birth rates across all patient populations [78].
Impact of Ovarian Stimulation Protocols on PGT Outcomes
The controlled ovarian hyperstimulation (COH) protocol employed prior to IVF and PGT can significantly influence embryo ploidy rates and reproductive outcomes.
Table 4: PPOS Protocol vs. Conventional COH in PGT Cycles
| Outcome Measure | PPOS Protocol Performance | Conventional COH (GnRH Agonist/Antagonist) |
|---|---|---|
| Euploidy Embryo Rates (General Population) | Comparable to conventional protocols [80] | Similar outcomes in unselected populations [80] |
| Patient Prognosis Stratification | Comparable or superior in poor prognosis patients [80] | Standard approach across prognostic categories |
| Cycle Initiation Timing | No significant impact of follicular vs. luteal phase start [80] | Typically follicular phase initiation |
| Monitoring Burden | Reduced monitoring requirements [80] | Standard monitoring protocols |
| Medication Administration | Convenient oral administration [80] | Typically injectable medications |
A systematic review of PPOS protocols in PGT cycles concluded that while PPOS demonstrates comparable euploidy embryo rates and reproductive outcomes to conventional COH protocols in the general population, its performance varies by patient prognosis [80]. In patients with good prognosis, PPOS may yield less favorable EER, whereas in individuals with poor prognosis, it shows comparable or superior outcomes [80].
Technical Considerations and Implementation Challenges
Embryo Biopsy Approaches
The transition from cleavage-stage to trophectoderm biopsy represents one of the most significant technical advancements in PGT. Cleavage-stage biopsy, involving the removal of 1-2 blastomeres from 6-10 cell embryos, substantially compromised embryonic integrity (12-25% of total mass) and was associated with reduced survival rates [76]. In contrast, trophectoderm biopsy at the blastocyst stage extracts 5-8 cells from an embryo comprising over 100 cells, reducing the relative impact to 5-8% of total mass and dramatically improving reliability [76].
Emerging Non-Invasive Approaches
Non-invasive PGT (niPGT) techniques analyzing cell-free DNA from spent culture media represent a promising alternative to traditional biopsy [77] [76]. However, clinical implementation remains limited by substantial analytical challenges, including highly variable cfDNA amounts and difficulty controlling for external contamination [76]. While niPGT offers attractive features like minimal embryo manipulation, its diagnostic accuracy, reproducibility, and predictive value require further validation before clinical application [76].
Quality Control and Reporting Standards
Robust validation of PGT methodologies is essential to prevent both false negatives (transfer of affected embryos) and false positives (wastage of healthy embryos) [76]. Standardized reporting guidelines are increasingly important as technologies push biological resolution limits, particularly for complex findings like mosaicism, segmental aneuploidies, and polygenic risk scores [76]. Evidence-based reporting maximizes diagnostic utility while minimizing inaccurate results, requiring careful attention to sampling bias and technical variability, especially when detecting non-uniform chromosomal abnormalities [76].
Experimental Design and Research Reagent Solutions
Decision Pathway for PGT Protocol Selection
Essential Research Reagent Solutions
Table 5: Key Research Reagents for PGT Workflows
| Reagent Category | Specific Examples | Function in PGT Workflow |
|---|---|---|
| Whole Genome Amplification Kits | MDA-based kits, PCR-based (OmniPlex) kits [79] | Amplification of genomic DNA from limited biopsy material |
| Library Preparation Kits | KAPA Stranded mRNA-Seq, Lexogen QuantSeq [5] | Preparation of DNA or RNA libraries for sequencing |
| Sequencing Platforms | Illumina NGS systems, SNP arrays, aCGH platforms [76] [78] | High-throughput genetic analysis |
| Embryo Culture Media | G-IVF, G-1/G-2 sequential media [81] | Support embryo development to blastocyst stage |
| Biopsy Components | Laser systems, micropipettes, biopsy needles | Trophectoderm cell extraction |
| Genetic Analysis Software | Karyomapping algorithms, NGS analysis pipelines [79] | Data interpretation and result reporting |
This systematic comparison of PGT methodologies demonstrates that protocol performance is highly dependent on the specific clinical question, available laboratory resources, and patient-specific factors. The transition to trophectoderm biopsy with comprehensive chromosome screening technologies represents a significant advancement in the field, though recent evidence suggests careful patient selection is crucial for realizing the benefits of PGT-A.
Future directions in PGT will likely include increased integration of multi-omics technologies, refined algorithms for interpreting complex genetic findings such as mosaicism, and continued development of less invasive approaches. The ethical implications of expanding PGT applications, particularly in the realm of polygenic embryo screening, warrant ongoing discussion and careful consideration as these technologies continue to evolve.
In the field of modern genomics, researchers face a fundamental trade-off between the depth of biological information obtained and the practical constraints of project resources. Two predominant methodological approaches have emerged: full-length transcript RNA sequencing (also known as whole transcriptome sequencing) and 3' end counting methods (often called 3' mRNA-Seq). These technologies serve different needs within scientific research and drug development, each with distinct advantages and limitations.
Full-length transcript sequencing provides a comprehensive view of the entire transcriptome, enabling researchers to investigate alternative splicing, novel isoforms, fusion genes, and sequence variations across the complete length of RNA transcripts [1] [82]. In contrast, 3' end counting methods focus sequencing efforts exclusively on the 3' ends of transcripts, primarily for accurate gene expression quantification [1] [22]. The choice between these approaches significantly impacts not only the biological insights attainable but also the experimental design, sequencing depth requirements, computational resources, and overall project costs.
This guide provides an objective comparison of these competing technologies, presenting experimental data and methodological considerations to help researchers, scientists, and drug development professionals make informed decisions that balance scientific objectives with practical resource constraints.
Methodological Foundations
Core Technical Principles
The fundamental difference between these approaches lies in their library preparation methodologies and the resulting sequence information.
Full-length transcript protocols utilize random priming during reverse transcription, generating sequencing reads distributed across the entire transcript [1]. To prevent abundant ribosomal RNA (rRNA) from dominating sequencing output, these methods require either poly(A) selection to enrich for messenger RNA or specific ribosomal depletion steps prior to library preparation [1]. These protocols typically employ fragmentation steps before or during library preparation, resulting in multiple sequencing reads per transcript [22]. The comprehensive coverage enables detection of transcript isoforms, splice variants, and sequence heterogeneity, but requires higher sequencing depth per sample to achieve adequate coverage across all transcripts of interest [1] [82].
3' end counting methods employ oligo(dT) primers that bind to the poly(A) tails of mRNAs, initiating cDNA synthesis specifically from the 3' end of transcripts [1] [22]. Unlike whole transcript approaches, these methods typically avoid fragmentation, generating one fragment per transcript [22]. This design eliminates length bias in transcript quantification, as longer transcripts no longer generate more reads simply due to their size [22]. The simplified workflow and reduced sequencing requirements make 3' end counting particularly suitable for large-scale gene expression studies where quantitative accuracy and cost-efficiency are priorities [1] [83].
Experimental Workflows
The following diagram illustrates the key procedural differences between these two approaches:
Research Reagent Solutions
Successful implementation of either approach requires appropriate selection of research reagents and kits. The table below details essential materials and their functions for both methodologies:
Table 1: Essential Research Reagents for RNA Sequencing Methods
| Reagent Category | Specific Examples | Function in Protocol | Applicable Methods |
|---|---|---|---|
| Library Prep Kits | KAPA Stranded mRNA-Seq Kit; Lexogen QuantSeq 3' mRNA-Seq Kit | Convert RNA to sequence-ready libraries | Full-length [22]; 3' end [1] [22] |
| Poly(A) Selection | Oligo(dT) Beads; Poly(A) RNA Selection Kits | Enrich for polyadenylated mRNA | Primarily full-length [1] |
| rRNA Depletion | Ribosomal RNA Removal Kits | Remove abundant ribosomal RNA | Full-length [1] |
| Reverse Transcriptase | M-MLV RT; Template-Switching Enzymes | Synthesize cDNA from RNA templates | Both methods [82] |
| UMI Adapters | Unique Molecular Identifiers | Distinguish biological duplicates from PCR duplicates | Both methods (especially 3' end) [6] [11] |
| Amplification Enzymes | High-Fidelity DNA Polymerases | Amplify cDNA for sequencing | Both methods [11] [82] |
Performance Comparison: Experimental Data
Quantitative Performance Metrics
Direct comparisons between these methodologies reveal distinct performance characteristics. A comprehensive study by Ma et al. (2019) systematically compared traditional whole transcript RNA-Seq (using the KAPA Stranded mRNA-Seq Kit) and 3' RNA-Seq (using the Lexogen QuantSeq Kit) using mouse liver RNA samples [22].
Table 2: Performance Comparison of Full-Length vs. 3' End Counting Methods
| Performance Metric | Full-Length Method | 3' End Counting Method | Experimental Context |
|---|---|---|---|
| Read Distribution | Uniform coverage across transcripts [22] | Strong 3' bias (>90% reads at 3' end) [22] | Mouse liver transcriptome [22] |
| Length Bias | More reads assigned to longer transcripts [22] | Equal reads regardless of transcript length [22] | Transcripts 500-8500 bp [22] |
| Short Transcript Detection | Lower detection as sequencing depth drops [22] | Detects ~400 more transcripts <1000 bp at 2.5M reads [22] | Subsampling analysis [22] |
| Differentially Expressed Genes | Detects more DEGs regardless of sequencing depth [22] | Fewer DEGs detected [22] | Differential expression analysis [22] |
| Technical Reproducibility | High reproducibility between replicates [22] | Similar reproducibility to full-length methods [22] | Correlation between replicates [22] |
| Required Sequencing Depth | 20-30 million reads per sample [1] | 1-5 million reads per sample [1] | Recommended coverage [1] |
| Cost Per Sample | $$$$ (Higher due to sequencing & prep costs) [1] | $ (Substantially lower cost) [83] | Relative cost comparison [1] [83] |
Methodological Trade-Offs Visualization
The performance differences between these methods create distinct trade-offs that researchers must consider when selecting an approach:
Application-Based Method Selection
Decision Framework for Researchers
Selecting the appropriate method requires careful consideration of research objectives, sample characteristics, and resource constraints. The following guidelines summarize optimal use cases for each approach:
Choose Full-Length Transcript Sequencing When:
- Your research questions involve alternative splicing, novel isoforms, or fusion genes [1]
- You need to characterize non-polyadenylated RNAs (e.g., some non-coding RNAs) [1]
- Working with samples where poly(A) tails may be absent or degraded (e.g., prokaryotic RNA, severely degraded clinical samples) [1]
- Your budget allows for higher per-sample costs and you have computational resources for complex data analysis [1] [11]
- Transcript-level resolution is required for understanding biological mechanisms [1]
Choose 3' End Counting Methods When:
- Your primary goal is accurate gene expression quantification [1]
- Conducting large-scale screening studies with many samples [1] [83]
- Working with degraded RNA samples (e.g., FFPE tissues) where 3' ends are better preserved [1]
- Budget constraints necessitate cost-effective approaches [83]
- You require streamlined data analysis without the complexity of isoform-level interpretation [1]
- High-throughput processing is prioritized over comprehensive transcript characterization [1] [83]
Single-Cell Sequencing Considerations
In single-cell RNA sequencing (scRNA-seq), the full-length versus 3' end decision involves additional considerations. Plate-based full-length methods (e.g., SMART-seq2, SMART-seq3) typically yield higher sensitivity with more genes detected per cell but at higher cost and lower throughput [6] [11]. Droplet-based 3' end methods (e.g., Drop-seq, inDrop) enable profiling of thousands of cells simultaneously with lower cost per cell but with reduced gene detection sensitivity [6] [33].
Recent benchmarking studies indicate that full-length methods like SMART-seq2 detect the most genes per cell, while 3' end methods with UMIs provide more accurate mRNA quantification with less amplification noise [33]. The decision between these approaches in single-cell research depends on whether the experimental goals prioritize deep characterization of individual cells (favoring full-length methods) or identification of cell populations through profiling many cells (favoring 3' end methods) [6] [11] [33].
The choice between full-length transcript and 3' end counting methods represents a fundamental strategic decision in experimental design that balances scientific depth against practical resources. While full-length methods provide comprehensive transcriptome characterization, 3' end counting offers a cost-effective alternative for gene expression quantification, particularly beneficial for large-scale studies.
Notably, both methods can yield similar biological conclusions in pathway analyses despite differences in individual gene detection [1] [22]. This suggests that for many research applications focused on overall pathway activation rather than specific isoform characterization, 3' end counting methods provide sufficient information at substantially reduced cost.
Researchers should carefully evaluate their specific biological questions, sample types, and resource constraints when selecting between these approaches. In some cases, a hybrid strategy—using 3' end counting for large-scale screening followed by full-length sequencing for targeted deep investigation—may provide an optimal balance of breadth and depth within budget limitations. As sequencing costs continue to decrease and methodologies evolve, the trade-offs between these approaches will undoubtedly shift, but the fundamental principle of aligning methodological choices with research objectives will remain essential for efficient resource utilization in scientific discovery.
In embryonic development research, where biological systems are exceptionally dynamic and complex, the choice of RNA sequencing protocol is a critical determinant of the reproducibility, comparability, and longevity of your data. The decision primarily centers on two fundamental approaches: full-length transcriptome and 3' end counting methodologies. Full-length transcriptome sequencing captures complete RNA sequences, enabling comprehensive analysis of transcript isoforms, splicing variants, and sequence heterogeneity [1] [10]. In contrast, 3' end counting methods focus sequencing on the 3' terminal region of transcripts, primarily for digital gene expression counting [1] [11]. This guide provides an objective comparison of these approaches, grounded in experimental data, to help researchers select the most appropriate method for ensuring data remains valid, reusable, and comparable across studies and time.
Methodological Foundations: How the Protocols Work
Core Principles of Full-Length and 3' End Sequencing
The fundamental distinction between these protocols lies in their coverage of transcripts and their underlying biochemistry. Full-length transcriptome protocols employ random primers to initiate cDNA synthesis, generating sequencing reads distributed across the entire transcript length [1]. This approach requires effective ribosomal RNA (rRNA) depletion prior to library preparation, either through poly(A) selection or specific rRNA depletion methods [1]. The resulting data provides complete positional information across all transcript regions, enabling isoform-level analysis.
In comparison, 3' end counting methods (such as QuantSeq) utilize oligo(dT) primers for targeted sequencing of the 3' terminal region of polyadenylated RNAs [1]. This streamlined approach generates one fragment per transcript, simplifying both library preparation and subsequent data analysis through direct read counting without normalization requirements for transcript coverage [1]. The methodological distinction creates a fundamental trade-off between comprehensive transcript characterization and focused, cost-effective expression quantification.
Experimental Workflow Comparison
The experimental workflows for full-length and 3' end sequencing diverge significantly in both procedure and time investment. The following diagram illustrates the key steps in each protocol:
Performance Benchmarking: Quantitative Comparisons from Experimental Data
Detection Sensitivity and Technical Performance
Multiple studies have systematically compared the performance of full-length and 3' end counting methods. When benchmarked on identical samples, these approaches demonstrate distinct strengths in detection capability:
Table 1: Performance Metrics Comparison Between Full-Length and 3' End Sequencing
| Performance Metric | Full-Length Transcriptome | 3' End Counting | Experimental Context |
|---|---|---|---|
| Genes Detected per Cell | 7,000-12,000 genes/cell [11] | Varies by protocol | Single-cell RNA-seq of T47D cell line [11] |
| Differentially Expressed Genes | Detects more DEGs [1] | Fewer DEGs detected | Murine liver with high-iron diet [1] |
| Short Transcript Detection | Lower sensitivity [1] | Better detection [1] | Transcript length bias analysis [1] |
| Amplification Noise | Higher without UMIs [33] | Lower with UMIs [33] | Comparative analysis of scRNA-seq methods [33] |
| Gene-Body Coverage | Uniform coverage [29] | 3'-biased coverage [1] | Protocol benchmarking studies [1] [29] |
| Input RNA Requirements | Higher input needed [11] | Works with degraded/FFPE RNA [1] | Various sample types tested [1] [11] |
The data reveals a consistent pattern: full-length protocols generally detect more genes and differentially expressed genes, while 3' end counting provides more accurate molecular quantification with unique molecular identifiers (UMIs) and better performance with challenging sample types.
Cost and Efficiency Considerations
The economic and practical considerations of these methodologies significantly impact research scalability, especially in large-scale embryo studies:
Table 2: Resource and Efficiency Comparison
| Resource Metric | Full-Length Transcriptome | 3' End Counting | Notes |
|---|---|---|---|
| Sequencing Depth Required | High (≥20M reads/sample) [1] | Low (1-5M reads/sample) [1] | Depth affects cost and multiplexing |
| Hands-on Time | Longer workflow [1] | Streamlined [1] | Full-length requires rRNA depletion |
| Cost per Sample | $46-$73 per single cell [11] | More cost-effective [1] | Varies by commercial kit |
| Sample Multiplexing | Lower throughput [6] | High-throughput capable [1] | 3' end better for large screens |
| Automation Potential | Moderate [11] | High [1] | 3' end has fewer processing steps |
The efficiency advantage of 3' end counting makes it particularly suitable for large-scale screening applications where hundreds or thousands of samples need to be processed, while full-length methods remain valuable for deeper investigation of smaller sample sets.
Biological Applications: Matching Methods to Research Questions
Application-Specific Protocol Selection
The choice between full-length and 3' end counting methods should be driven primarily by the specific biological questions under investigation:
Choose FULL-LENGTH TRANSCRIPTOME sequencing when your research requires:
- Global characterization of all RNA types (coding and non-coding) [1]
- Identification of alternative splicing events and novel isoforms [1] [10]
- Detection of fusion genes and structural variants [1]
- Analysis of allelic expression and RNA editing [6]
- Working with samples where poly(A) tails may be absent or degraded [1]
Choose 3' END COUNTING when your research requires:
- Accurate, cost-effective gene expression quantification [1]
- High-throughput screening of many samples [1]
- Streamlined workflow with simpler data analysis [1]
- Efficient mRNA profiling from degraded RNA or challenging samples (e.g., FFPE) [1]
- Studies where UMIs are critical for accurate transcript counting [33]
Embryo Research Applications
In embryo research specifically, each method offers distinct advantages. Full-length sequencing has been instrumental in uncovering previously unannotated genes and novel isoforms during zebrafish embryogenesis, with one study identifying 2,113 novel genes and 33,018 novel isoforms [10]. This approach provides critical insights into the complex transcriptional dynamics of embryonic development.
For large-scale phenotypic screening in zebrafish embryos, 3' end counting offers practical advantages due to its cost-effectiveness and compatibility with high-throughput formats [84]. This enables researchers to process the large sample sizes necessary for overcoming the genetic heterogeneity inherent in zebrafish models while maintaining statistical power [84].
Experimental Design for Reproducibility
The Scientist's Toolkit: Essential Research Reagents
Successful implementation of either sequencing approach requires careful selection of research reagents and methodologies:
Table 3: Research Reagent Solutions for Embryo Transcriptomics
| Reagent/Method | Function | Application Notes |
|---|---|---|
| Poly(A) Selection | Enriches polyadenylated RNA | Standard for 3' end; used in some full-length protocols [1] |
| rRNA Depletion Kits | Removes abundant ribosomal RNA | Critical for full-length total RNA sequencing [1] |
| UMI Adapters | Unique Molecular Identifiers | Enables accurate transcript counting; more common in 3' end [33] |
| Template Switching Oligos | Enhances full-length cDNA capture | Used in SMART-seq protocols [11] [29] |
| Single-Cell Isolation | Individual cell separation | FACS or droplet-based for full-length; droplet for 3' end [6] |
| Amplification Kits | cDNA amplification | PCR-based for most protocols; IVT for CEL-seq2 [6] |
Ensuring Cross-Study Comparability
To maximize the reproducibility and future utility of your embryo sequencing data, implement these practical guidelines:
- Annotation Quality: For 3' end counting, ensure well-curated 3' annotation is available for your organism; inadequate annotation reduces mapping rates even with optimal wet-lab workflow [1]
- Sample Preparation Standardization: Implement consistent embryo staging, dissociation protocols, and quality control metrics, especially for single-cell applications [6]
- Control Implementation: Include appropriate controls for batch effects, technical variability, and protocol-specific biases [85]
- Metadata Documentation: Comprehensively document experimental conditions, embryo stages, and processing parameters using standardized ontologies [84]
- Data Sharing Standards: Adhere to community standards for data deposition, ensuring raw data and processing scripts are accessible [85]
The choice between full-length transcriptome and 3' end counting methods represents a fundamental strategic decision in embryo research design. Full-length protocols provide comprehensive transcript characterization essential for isoform-level discovery, while 3' end counting offers efficient, quantitative expression profiling ideal for large-scale comparative studies. By aligning methodological strengths with specific research objectives and implementing rigorous experimental design, researchers can generate data that maintains its value and utility across studies, ultimately accelerating our understanding of embryonic development through reproducible, comparable transcriptomic data.
Conclusion
The choice between full-length and 3' end counting scRNA-seq protocols is not a matter of one being universally superior, but rather a strategic decision based on specific research goals. Full-length protocols like Smart-Seq2 and MATQ-Seq offer unparalleled resolution for detecting low-abundance genes, alternative splicing, and novel isoforms, making them ideal for in-depth mechanistic studies of early embryonic development. In contrast, 3' end counting methods such as Drop-Seq and inDrop provide the scalability and cost-efficiency required for large-scale atlas projects, drug screening, and profiling complex tissues like the tumor microenvironment. Future directions will be shaped by the integration of these approaches with emerging technologies like long-read sequencing for enhanced isoform resolution, spatial transcriptomics for anatomical context, and stem cell-based embryo models for ethical exploration of human development. Ultimately, a nuanced understanding of these complementary tools will empower researchers to push the boundaries of biomedical discovery in embryology and beyond.
References
- 1. Whole Transcriptome vs 3' mRNA-Seq: How to Choose ... [https://www.lexogen.com/blog/choosing-between-whole-transcriptome-total-rna-seq-and-3-mrna-seq/]
- 2. From bulk, single-cell to spatial RNA sequencing [https://www.nature.com/articles/s41368-021-00146-0]
- 3. Understanding Bulk and Single-Cell RNA Sequencing [https://www.cd-genomics.com/resource-bulk-rna-sequencing-vs-single-cell-rna-sequencing.html]
- 4. 3′ RNA-seq is superior to standard RNA-seq in cases of ... [https://pmc.ncbi.nlm.nih.gov/articles/PMC10414111/]
- 5. A comparison between whole transcript and 3' RNA ... [https://bmcgenomics.biomedcentral.com/articles/10.1186/s12864-018-5393-3]
- 6. Navigating single-cell RNA-sequencing: protocols, tools ... [https://pmc.ncbi.nlm.nih.gov/articles/PMC12085826/]
- 7. Systematic assessment of long-read RNA-seq methods for ... [https://www.nature.com/articles/s41592-024-02298-3]
- 8. A comprehensive human embryo reference tool using ... [https://www.nature.com/articles/s41592-024-02493-2]
- 9. The changing mouse embryo transcriptome at whole tissue ... [https://pmc.ncbi.nlm.nih.gov/articles/PMC7410830/]
- 10. High resolution of full-length RNA sequencing deciphers ... [https://bmcbiol.biomedcentral.com/articles/10.1186/s12915-025-02271-2]
- 11. Benchmarking full-length transcript single cell mRNA ... [https://bmcgenomics.biomedcentral.com/articles/10.1186/s12864-022-09014-5]
- 12. Total RNA Sequencing Breakthroughs Transform ... [https://broadclinicallabs.org/total-rna-sequencing-breakthroughs-transform-research-accessibility/]
- 13. Cracking rare disorders: a new minimally invasive RNA- ... [https://www.nature.com/articles/s41525-025-00502-7]
- 14. A systematic benchmark of Nanopore long-read RNA ... [https://www.nature.com/articles/s41592-025-02623-4]
- 15. Long-read RNA sequencing: A transformative technology ... [https://www.sciencedirect.com/science/article/pii/S1525001624007524]
- 16. end mRNA library from unpurified bulk RNA in a single tube [https://www.nature.com/articles/s12276-024-01164-8]
- 17. 3′READS+, a sensitive and accurate method for 3′ end ... [https://pmc.ncbi.nlm.nih.gov/articles/PMC5029459/]
- 18. Spatio-temporal mRNA tracking in the early zebrafish embryo [https://www.nature.com/articles/s41467-021-23834-1]
- 19. UMI-tools: modeling sequencing errors in Unique Molecular ... [https://pmc.ncbi.nlm.nih.gov/articles/PMC5340976/]
- 20. UMI-count modeling and differential expression analysis for ... [https://genomebiology.biomedcentral.com/articles/10.1186/s13059-018-1438-9]
- 21. Functional phenotyping of genomic variants using joint ... [https://www.nature.com/articles/s41592-025-02805-0]
- 22. A comparison between whole transcript and 3' RNA ... [https://pmc.ncbi.nlm.nih.gov/articles/PMC6323698/]
- 23. Deep learning versus manual morphology-based embryo ... [https://www.nature.com/articles/s41591-024-03166-5]
- 24. High resolution of full-length RNA sequencing deciphers ... [https://pmc.ncbi.nlm.nih.gov/articles/PMC12139336/]
- 25. Benchmarking full-length transcript single cell mRNA ... [https://pmc.ncbi.nlm.nih.gov/articles/PMC9801581/]
- 26. Traditional versus 3′ RNA-seq in a non-model species [https://www.sciencedirect.com/science/article/pii/S2213596016301660]
- 27. A practical guide to single-cell RNA-sequencing for ... [https://genomemedicine.biomedcentral.com/articles/10.1186/s13073-017-0467-4]
- 28. Single-Cell RNA-Seq Technologies and Related ... [https://pmc.ncbi.nlm.nih.gov/articles/PMC6460256/]
- 29. Fast and highly sensitive full-length single-cell RNA ... [https://www.nature.com/articles/s41587-022-01312-3]
- 30. Direct Comparative Analyses of 10X Genomics Chromium ... [https://pmc.ncbi.nlm.nih.gov/articles/PMC8602399/]
- 31. Comparative analysis of droplet-based ultra-high-throughput ... [https://prelights.biologists.com/highlights/comparative-analysis-droplet-based-ultra-high-throughput-single-cell-rna-seq-systems/]
- 32. Universal 3 [https://www.10xgenomics.com/products/universal-three-prime-gene-expression]
- 33. Comparative Analysis of Single-Cell RNA Sequencing ... [https://www.sciencedirect.com/science/article/pii/S1097276517300497]
- 34. Single-cell multiomics sequencing reveals the functional ... [https://www.nature.com/articles/s41467-021-21409-8]
- 35. Single-cell sequencing of full-length transcripts and T-cell ... [https://bmcgenomics.biomedcentral.com/articles/10.1186/s12864-024-11036-0]
- 36. A high-resolution mRNA expression time course of ... [https://pmc.ncbi.nlm.nih.gov/articles/PMC5690287/]
- 37. Next generation lineage tracing and its applications ... [https://www.nature.com/articles/s41540-025-00542-w]
- 38. The Theory and Practice of Lineage Tracing - PMC [https://pmc.ncbi.nlm.nih.gov/articles/PMC4618107/]
- 39. Quantifying 3′UTR length from scRNA-seq data reveals ... [https://www.nature.com/articles/s41467-024-48254-9]
- 40. Applications of single-cell technologies in drug discovery for ... [https://pmc.ncbi.nlm.nih.gov/articles/PMC11338156/]
- 41. Advances in single-cell RNA sequencing and its applications ... [https://jhoonline.biomedcentral.com/articles/10.1186/s13045-023-01494-6]
- 42. Comparative Analysis of Single-Cell RNA Sequencing ... [https://pubmed.ncbi.nlm.nih.gov/28212749/]
- 43. A multiplex single-cell RNA-Seq pharmacotranscriptomics ... [https://www.nature.com/articles/s41589-024-01761-8]
- 44. Applications of single-cell technologies in drug discovery ... [https://www.sciencedirect.com/science/article/pii/S2589004224017115]
- 45. Benchmarking clustering, alignment, and integration methods ... [https://genomebiology.biomedcentral.com/articles/10.1186/s13059-024-03361-0]
- 46. Analysis and Visualization of Spatial Transcriptomic Data - PMC [https://pmc.ncbi.nlm.nih.gov/articles/PMC8829434/]
- 47. Systematic comparison of sequencing-based spatial ... [https://www.nature.com/articles/s41592-024-02325-3]
- 48. Direct full-length RNA sequencing reveals unexpected ... [https://pmc.ncbi.nlm.nih.gov/articles/PMC7050527/]
- 49. Analysis, visualization, and integration of spatial datasets ... [https://satijalab.org/seurat/articles/spatial_vignette.html]
- 50. scIALM: A method for sparse scRNA-seq expression matrix ... [https://pmc.ncbi.nlm.nih.gov/articles/PMC10809077/]
- 51. Smooth imputation of sparse and noisy functional data with ... [https://openreview.net/forum?id=MXRO5kukST&referrer=%5Bthe%20profile%20of%20Jonas%20Mueller%5D(%2Fprofile%3Fid%3D~Jonas_Mueller1)]
- 52. A comparison of methods accounting for batch effects in ... [https://pmc.ncbi.nlm.nih.gov/articles/PMC7163294/]
- 53. Assessing and mitigating batch effects in large-scale omics ... [https://genomebiology.biomedcentral.com/articles/10.1186/s13059-024-03401-9]
- 54. Batch Effect in Single-cell RNA-seq: Frequently Asked ... [https://www.elucidata.io/blog/batch-effect-in-single-cell-rna-seq-frequently-asked-questions-and-answers]
- 55. A comparison of batch effect removal methods for ... [https://pmc.ncbi.nlm.nih.gov/articles/PMC2920074/]
- 56. An order-preserving batch-effect correction method based ... [https://pmc.ncbi.nlm.nih.gov/articles/PMC12207412/]
- 57. scRNA-seq downstream analysis on raw vs batch ... [https://www.biostars.org/p/9587126/]
- 58. 3′ RNA-seq is superior to standard RNA-seq in cases of ... [https://www.frontiersin.org/journals/bioinformatics/articles/10.3389/fbinf.2023.1234218/full]
- 59. What is 3' mRNA sequencing? [https://alitheagenomics.com/blog/what-is-3-mrna-sequencing]
- 60. Single‐cell RNA sequencing technologies and applications [https://pmc.ncbi.nlm.nih.gov/articles/PMC8964935/]
- 61. Bulk vs. single cell RNA-seq: Experimental differences and ... [https://www.10xgenomics.com/blog/bulk-vs-single-cell-RNA-seq-experimental-differences-and-advantages-of-single-cell-resolution]
- 62. A systematic benchmark of Nanopore long-read RNA ... [https://pmc.ncbi.nlm.nih.gov/articles/PMC11978509/]
- 63. Powered by PacBio: Selected publications from June 2025 [https://www.pacb.com/blog/powered-by-pacbio-selected-publications-from-june-2025/]
- 64. Iso-Seq method outperforms other long-read ... [https://www.pacb.com/blog/iso-seq-method-outperforms-other-long-read-methods-in-benchmarking-consortium-study/]
- 65. An optimized workflow of full-length transcriptome ... [https://pmc.ncbi.nlm.nih.gov/articles/PMC11572239/]
- 66. Comprehensive assessment of mRNA isoform detection ... [https://www.nature.com/articles/s41467-024-48117-3]
- 67. Embryo tracking system for high-throughput sequencing- ... [https://pubmed.ncbi.nlm.nih.gov/36149256/]
- 68. Single-cell omics sequencing technologies: the long-read ... [https://www.sciencedirect.com/science/article/pii/S0168952525001969]
- 69. Transcriptomic profiling of three embryonic development ... [https://www.nature.com/articles/s41597-025-04971-4]
- 70. Developmental system drift and modular gene regulatory ... [https://pmc.ncbi.nlm.nih.gov/articles/PMC12360431/]
- 71. A practical guide for choosing an optimal spatial ... [https://bmcgenomics.biomedcentral.com/articles/10.1186/s12864-025-11235-3]
- 72. A practical guide to spatial transcriptomics: lessons from ... [https://www.sciencedirect.com/science/article/abs/pii/S0167779925003579]
- 73. Benchmarking methods for detecting differential states ... [https://pubmed.ncbi.nlm.nih.gov/35880426/]
- 74. Benchmarking of methods that identify alternative ... [https://pmc.ncbi.nlm.nih.gov/articles/PMC12076406/]
- 75. The evolution of preimplantation genetic testing [https://www.sciencedirect.com/science/article/abs/pii/S1472648325000525]
- 76. Evidence-Based Reporting in Preimplantation Genetic Testing ... [https://pmc.ncbi.nlm.nih.gov/articles/PMC12469648/]
- 77. Foretelling the Future: Preimplantation Genetic Testing and ... [https://pmc.ncbi.nlm.nih.gov/articles/PMC12156276/]
- 78. The use of preimplantation genetic testing for aneuploidy [https://www.asrm.org/practice-guidance/practice-committee-documents/the-use-of-preimplantation-genetic-testing-for-aneuploidy-a-committee-opinion-2024/]
- 79. Performance comparison of two whole genome amplification ... [https://pmc.ncbi.nlm.nih.gov/articles/PMC6086788/]
- 80. Impact of the PPOS protocol on euploidy embryo rates and ... [https://www.frontiersin.org/journals/endocrinology/articles/10.3389/fendo.2025.1595232/full]
- 81. Comparison of the development of human embryos ... [https://pmc.ncbi.nlm.nih.gov/articles/PMC5904068/]
- 82. Full-Length mRNA-Seq from single cell levels of RNA and ... [https://pmc.ncbi.nlm.nih.gov/articles/PMC3467340/]
- 83. 3'Pool-seq: an optimized cost-efficient and scalable ... [https://pmc.ncbi.nlm.nih.gov/articles/PMC6971924/]
- 84. Zebrafishology, study design guidelines for rigorous and ... [https://www.nature.com/articles/s42003-025-07496-z]
- 85. Challenges in Reproducibility, Replicability, and ... [https://www.frontiersin.org/journals/neuroinformatics/articles/10.3389/fninf.2018.00020/full]