Mastering FISH on FFPE Tissue: A Complete Guide from Basic Principles to Advanced Applications
This comprehensive guide details the application of Fluorescence in Situ Hybridization (FISH) on Formalin-Fixed Paraffin-Embedded (FFPE) tissues, a cornerstone technique in modern research and clinical diagnostics.
Mastering FISH on FFPE Tissue: A Complete Guide from Basic Principles to Advanced Applications
Abstract
This comprehensive guide details the application of Fluorescence in Situ Hybridization (FISH) on Formalin-Fixed Paraffin-Embedded (FFPE) tissues, a cornerstone technique in modern research and clinical diagnostics. Tailored for researchers, scientists, and drug development professionals, it covers foundational principles, robust step-by-step protocols, and advanced multiplexed methods like MERFISH for spatial transcriptomics. The article provides empirical solutions for common troubleshooting challenges, explores validation frameworks to ensure data reliability, and examines emerging trends, including automation, to enhance reproducibility and throughput in biomedical research.
FFPE-FISH Fundamentals: Unlocking Archival Tissues for Genetic Analysis
The Critical Role of FFPE-FISH in Cancer Research and Diagnostics
Formalin-fixed paraffin-embedded (FFPE) tissue samples represent the most extensive archival resource in pathology laboratories worldwide, offering an invaluable repository of clinical information for retrospective studies. The preservation of tissue histomorphology through FFPE processing comes with a significant challenge: nucleic acid fragmentation, degradation, and cross-linking caused by formalin fixation. Fluorescence in situ hybridization (FISH) applied to FFPE tissues has emerged as a critical technology that bridges this gap, enabling researchers and clinicians to detect specific genetic aberrations at the single-cell level while retaining crucial spatial and morphological context. This capability is particularly vital in cancer diagnostics, where specific genetic alterations drive clinical decision-making for targeted therapies.
FFPE-FISH has established itself as an indispensable tool in personalized oncology, providing a unique avenue for detecting amplified genes, rearrangements, deletions, and other chromosomal abnormalities when viable specimens are not available for karyotype examination. The technique allows for the visualization of genetic alterations within the intact tissue architecture, providing insights into tumor heterogeneity and clonal evolution that are impossible to obtain through bulk molecular analyses. Despite the advent of sophisticated sequencing technologies, FFPE-FISH remains a widely adopted method in clinical diagnostics due to its cost-effectiveness, reliability, and ability to provide results that directly inform therapeutic decisions.
Technical Foundations of FFPE-FISH
Fundamental Principles and Applications
FFPE-FISH operates on the principle of annealing fluorescently labeled nucleic acid sequences, or probes, to complementary sequences within fixed tissue sections. This hybridization allows for the detection and precise localization of specific genetic abnormalities, including structural aberrations (translocations, inversions) and numerical changes (deletions, gains) within the context of preserved tissue morphology. The robust nature of this technique enables its application to various sample types, including whole tissue sections and tissue microarrays (TMAs), facilitating high-throughput analysis of multiple archival samples simultaneously.
The applications of FFPE-FISH in cancer diagnostics are extensive and continue to expand. Key implementations include:
- Gene amplification detection: Identification of oncogene amplifications such as HER2 in breast cancer, which directly informs targeted therapy selection
- Translocation analysis: Detection of characteristic rearrangements in lymphomas (e.g., BCL2, BCL6, MYC) and sarcomas
- Deletion identification: Recognition of critical tumor suppressor gene losses (e.g., 1p/19q co-deletion in gliomas)
- Aneuploidy assessment: Evaluation of chromosomal gains and losses in various malignancies
Comparative Methodological Analysis
FFPE-FISH occupies a unique position in the diagnostic landscape, complementing other established techniques while offering distinct advantages. The following table summarizes key characteristics of FFPE-FISH compared to alternative methodologies:
Table 1: Comparative Analysis of FFPE-FISH with Other Diagnostic Methods
| Characteristic | IHC | CISH | FFPE-FISH | NGS-based Methods |
|---|---|---|---|---|
| Target | Protein expression | Chromosomal aberration (chromogenic) | Chromosomal aberration (fluorescent) | DNA/RNA sequences |
| Sensitivity | Variable, depends on antibody and fixation | High for amplifications | High for various aberrations | Very high |
| Specificity | Variable | High | Very high | Very high |
| Morphology Correlation | Excellent | Good | Moderate (nuclear truncation) | None (bulk analysis) |
| Multiplexing Capability | Limited (sequential staining) | Limited | Moderate (multiple fluorophores) | High |
| Turnaround Time | Short (1-2 days) | Moderate (1-2 days) | Moderate (2-3 days) | Long (3-7 days) |
| Equipment Requirements | Standard microscope | Standard microscope | Fluorescence microscope | Sequencing platform |
| Cost | Low | Moderate | Moderate | High |
| Objective Quantification | Semi-quantitative | Quantitative | Quantitative | Quantitative |
| Ability to Detect Unknown Partners | Not applicable | Limited | Limited (break-apart FISH) | Yes |
Quantitative Performance Data in Cancer Diagnostics
The clinical utility of FFPE-FISH is well-established across various cancer types, with validated performance characteristics that support its implementation in routine diagnostic workflows. The following table summarizes key performance metrics for FFPE-FISH assays in detecting clinically relevant genetic alterations:
Table 2: Performance Characteristics of FFPE-FISH Across Cancer Types
| Cancer Type | Genetic Alteration | Probe Type | Sensitivity | Specificity | Clinical Utility |
|---|---|---|---|---|---|
| Breast Cancer | HER2 amplification | Locus-specific | 88.6% concordance with standard FISH [4] | 96.9% concordance with combined IHC/FISH [4] | Trastuzumab therapy selection |
| Follicular Lymphoma | t(14;18) BCL2-IGH | Dual-fusion translocation | 91% (10/11 cases) [5] | 100% [5] | Diagnostic confirmation |
| Mantle Cell Lymphoma | t(11;14) CCND1-IGH | Dual-fusion translocation | 100% (7/7 cases) [5] | 100% [5] | Diagnostic confirmation |
| Burkitt Lymphoma | t(8;14) MYC-IGH | Dual-fusion translocation | 100% (9/9 cases) [5] | 100% [5] | Diagnostic confirmation, prognosis |
| Whipple's Disease | Tropheryma whipplei | Species-specific | 83% in untreated cases [6] | 100% [6] | Pathogen detection in FFPE |
The high sensitivity and specificity demonstrated across various malignancies underscore the reliability of FFPE-FISH as a diagnostic tool. Notably, the technique maintains excellent performance even when applied to archival materials with varying preservation durations and conditions.
Comprehensive FFPE-FISH Protocol for Gene Amplification Detection
This optimized protocol provides a standardized methodology for detecting gene amplification in FFPE tissue samples, with specific application to oncogenes such as ERBB2 (HER2). The procedure typically requires 2-3 days to complete and has been validated for robust detection of amplification events, including extrachromosomal DNA (ecDNA), which plays a crucial role in cancer development and therapy resistance.
Reagent Preparation
Acid Solutions:
- Prepare 0.2N HCl by slowly adding 8.212 mL of HCl (37%) to 491.788 mL of ddH₂O
- Prepare 10mM citric acid solution (pH 6.0) by dissolving 1.47g of tri-sodium citrate in 400mL ddH₂O, adjust to pH 6.0 with HCl, then bring to 500mL final volume
Buffer Systems:
- Prepare 20× SSC (3M NaCl, 0.3M sodium citrate, pH 7.0) by dissolving 44.1g tri-sodium citrate and 87.65g NaCl in 900mL ddH₂O, adjust to pH 7.0, then bring to 1000mL
- Prepare 2× SSC by diluting 20× SSC 1:10 with ddH₂O
- Prepare 0.4× SSC with 0.3% IGEPAL by mixing 100mL 2× SSC, 15mL 10% IGEPAL, and 385mL ddH₂O
- Prepare 2× SSC with 0.1% IGEPAL by adding 5mL 10% IGEPAL to 495mL 2× SSC
Hybridization Components:
- Prepare probe hybridization buffer by mixing:
- 910μL ddH₂O
- 500μL 20× SSC
- 50μL 10% Tween-20
- 40μL RNase A
- 1mL 50% dextran sulfate
- 2.5mL formamide
- Aliquot and store at -20°C
- Prepare probe hybridization buffer by mixing:
Enzyme and Staining Solutions:
- Prepare Proteinase K digestion buffer fresh by adding 1μL Proteinase K to 99μL Tris-EDTA buffer
- Prepare DAPI working solution (1μg/mL) by adding 1μL of 1mg/mL stock to 999μL 2× SSC, protect from light
Sample Pretreatment Protocol
Slide Aging and Deparaffinization:
- Age slides at 60-90°C for 20 minutes or overnight to facilitate paraffin melting
- Deparaffinize by immersing in xylene or substitutes for 10 minutes, repeat with fresh xylene
- Wash with 100% ethanol for 5 minutes
- Rehydrate through graded ethanol series (70% for 5 minutes)
Protein Extraction and Digestion:
- Immerse slides in 0.2N HCl at room temperature for 20 minutes to extract acid-soluble nuclear proteins
- Incubate in preheated 10mM citric acid at 90-95°C for 20 minutes for additional protein extraction
- Rinse briefly in 2× SSC to neutralize pH
- Apply 100-200μL Proteinase K digestion buffer and incubate at room temperature for 1 minute
- Immediately stop digestion and dehydrate through ethanol series (70%, 85%, 100%, 2 minutes each)
FISH Hybridization and Detection
Probe Application and Denaturation:
- Prepare FISH hybridization mix by diluting 2μL FISH probe stock with 8μL hybridization buffer
- Apply to tissue section and cover with coverslip
- Denature simultaneously on a hotplate at 75°C for 5 minutes
Hybridization and Washes:
- Transfer slides to humid, lightproof container and hybridize overnight at 37°C
- Remove coverslip and wash in 0.4× SSC with 0.3% IGEPAL at 72°C for 2 minutes
- Rinse in 2× SSC with 0.1% IGEPAL at room temperature for 30 seconds
Counterstaining and Mounting:
- Apply 10-15μL DAPI antifade to each sample and apply coverslip
- Allow color to develop in dark for 10 minutes before analysis
- View with fluorescence microscope equipped with appropriate filter sets
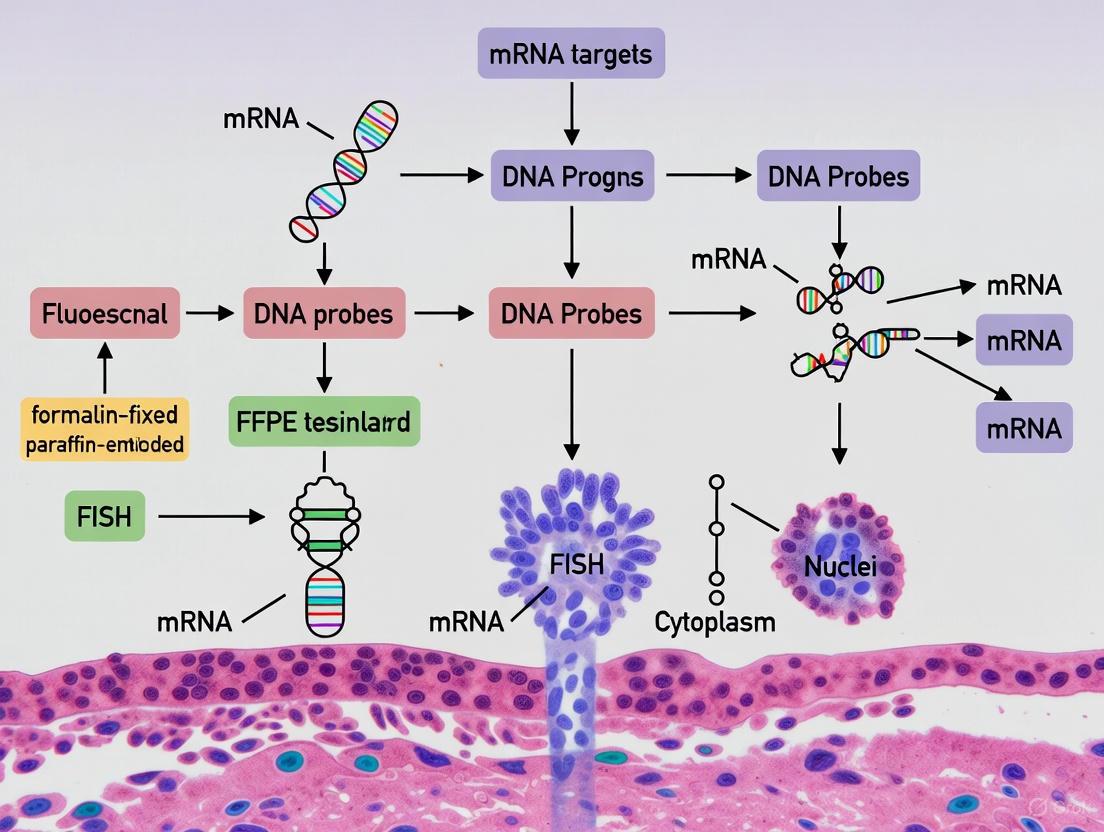
Figure 1: FFPE-FISH Experimental Workflow. This diagram outlines the key procedural steps in the FFPE-FISH protocol, from sample preparation through final detection and analysis.
Essential Research Reagent Solutions
Successful implementation of FFPE-FISH requires carefully selected reagents and materials optimized for the unique challenges of fixed tissue specimens. The following table details critical components and their specific functions in the FFPE-FISH workflow:
Table 3: Essential Research Reagents for FFPE-FISH
| Reagent Category | Specific Examples | Function | Optimization Notes |
|---|---|---|---|
| Tissue Pretreatment Solutions | Tissue Pretreatment Solution (LPS 100) [7], HCl, Citric Acid | Extraction of acid-soluble proteins, reduction of autofluorescence | HCl treatment: 20min RT; Citric acid: 20min at 90-95°C |
| Enzyme Digestion Reagents | Proteinase K, Pepsin | Increased probe accessibility to target sequences | Proteinase K: 1min RT (optimize based on tissue type) |
| Hybridization Components | Formamide, Dextran sulfate, SSC buffer | Control of hybridization stringency, acceleration of hybridization | Standard hybridization buffer contains 50% formamide |
| Probe Systems | Locus-specific probes, Break-apart probes, Dual-fusion probes | Target-specific detection of genetic alterations | HER2, BCL2, MYC probes clinically validated |
| Detection Reagents | Fluorophore-conjugated antibodies, DAPI, Antifade mounting medium | Signal detection and preservation, nuclear counterstaining | Opal dyes (520, 570, 620, 690) for multiplexing |
Advanced Applications and Future Directions
RNA-FISH in FFPE Tissues
Beyond DNA detection, FISH technology has been adapted for RNA visualization in FFPE samples, enabling spatial transcriptomics at the single-cell level. The RNAscope multiplex fluorescent assay represents a significant advancement, providing improved sensitivity and specificity over conventional RNA in situ hybridization techniques. This approach has been successfully applied to various cancers, including breast and lung carcinomas, as well as neurological conditions using human brain tissue.
Critical considerations for RNA-FISH in FFPE tissues include:
- RNA degradation: FFPE tissues show archival duration-dependent RNA degradation, most pronounced in highly expressed genes
- Quality control: Implementation of housekeeping gene probes (UBC, PPIB, POLR2A, HPRT1) for sample qualification
- Pre-treatment optimization: Distinct protocols required for FFPE versus fresh frozen tissues, including baking and antigen retrieval steps
Emerging Methodologies and Integration Approaches
While FFPE-FISH remains a cornerstone technique, emerging methodologies are expanding the diagnostic landscape:
- FFPE-Targeted Locus Capture (FFPE-TLC): Combines proximity ligation with targeted sequencing for improved translocation detection
- Automated Analysis Systems: Platforms like MetaSystems enable objective interpretation of FISH signals in tissue sections
- Multiplexing Approaches: Sequential FISH and stripping protocols maximize information from scarce tissue resources
Figure 2: FFPE-FISH Application Spectrum. This diagram illustrates the broad applications of FFPE-FISH technology, spanning DNA, RNA, and microbial detection with distinct clinical and research utilities.
FFPE-FISH maintains a critical position in the molecular pathology landscape, offering unique advantages that complement emerging genomic technologies. Its ability to provide spatial context for genetic alterations within intact tissue architecture, combined with well-established protocols and interpretation guidelines, ensures its continued relevance in both diagnostic and research settings. As personalized medicine advances, the integration of FFPE-FISH with complementary methodologies will further enhance our understanding of cancer biology and strengthen our capacity to deliver precise diagnostic information that directly informs therapeutic decisions.
The ongoing optimization of FFPE-FISH protocols, development of novel probe systems, and implementation of automated analysis platforms will address current limitations and expand applications. Future directions will likely focus on increased multiplexing capabilities, improved quantification algorithms, and enhanced integration with sequencing-based approaches, ultimately strengthening the role of FFPE-FISH as an indispensable tool in cancer research and diagnostics.
Fluorescence In Situ Hybridization (FISH) is a powerful molecular cytogenetic technique that allows for the direct visualization of specific genetic aberrations within the context of intact cell morphology and tissue architecture. Its application to formalin-fixed paraffin-embedded (FFPE) tissue is particularly valuable in both research and clinical diagnostics, as FFPE material is the most widely available source of archival tumor samples [10]. FISH enables researchers and drug development professionals to identify associations between specific genetic aberrations and tumor types, cellular morphology, and clinical behavior, thereby facilitating targeted therapy development and personalized medicine approaches [10] [11].
The core principle of FISH involves the specific annealing of fluorescently labeled DNA probes to complementary nucleic acid sequences within fixed cells, allowing for the detection, quantification, and spatial localization of genetic targets [10]. This technique is indispensable for definitive diagnosis of many tumors according to the WHO classification system, which increasingly integrates molecular cytogenetic alterations as tumor-defining criteria [11].
Core Principles of FISH
Fundamental Mechanism
FISH analyzes individual cell chromosomes, in interphase or metaphase, within tissue sections, cell preparations, and isolated nuclei. The assay uses fluorescently labeled double-stranded DNA probes that are complementary to specific chromosomal sequences within the cell nucleus. Precise detection and high binding specificity are achieved by tailoring the probe length and affinity to the size and base composition of the target DNA sequence [11].
The fundamental steps of probe-target interaction include:
- Denaturation: The application of heat to separate the double-stranded DNA of both the target (in the sample) and the probe into single strands.
- Hybridization: The cooling of the sample, which allows the single-stranded DNA probes to anneal to their complementary DNA sequences within the cell nucleus.
- Detection: Visualization of the bound probes using fluorescence microscopy, which reveals the presence, absence, or altered position of the specific genetic sequence being investigated [11].
Key Technical Advantages
FISH offers several significant advantages for genetic analysis in fixed tissues:
- Morphological Correlation: As a morphologically guided, in situ method, FISH allows direct correlation of chromosomal alterations with cellular morphology and tissue architecture, which is crucial for distinguishing tumor cells from surrounding normal tissue [11].
- Applicability to FFPE: FISH is compatible with routine pathology workflows and can be successfully performed on FFPE tissue sections, the standard for archival tissue storage [10] [11].
- High Sensitivity and Specificity: FISH can detect genetic aberrations with a low threshold for identifying small populations of abnormal cells (in low tumor percentage or low mosaicism samples), making it highly sensitive [12].
- Rapid Turnaround: Compared to other molecular techniques, FISH has a relatively rapid turnaround time, which is beneficial for both research pipelines and clinical decision-making [11].
- Versatility in Detection: The technique can accurately identify a broad spectrum of numerical and structural chromosomal alterations, including translocations, deletions, amplifications, and aneuploidies [13].
Experimental Protocols
One-Fits-All Pretreatment Protocol for FFPE Tissue
A robust and standardized pretreatment protocol is critical for successful FISH on FFPE tissue. The following optimized protocol is designed to be reproducible, cost-effective, and facilitates FISH on FFPE, fresh frozen, and cytological patient material simultaneously with good quality results [12]. An optimally processed sample is characterized by strong specific signals, intact nuclear membranes, non-disturbing autofluorescence, and a homogeneous DAPI staining.
Workflow Diagram: FISH on FFPE Tissue
Detailed Protocol Steps
Deparaffinization and Rehydration:
- Bake slides at 60°C for a minimum of 60 minutes to ensure tissue adhesion.
- Deparaffinize in xylene (or xylene substitute) for 10-15 minutes, repeated twice.
- Rehydrate through a graded ethanol series: 100% ethanol (twice), 96% ethanol, and 70% ethanol, for 2 minutes each.
- Rinse slides in deionized water [12].
Pretreatment with Citric Acid Buffer:
- Incubate slides in pre-warmed citric acid buffer (pH 6.0) at 95-99°C for 10-15 minutes. This heat-induced epitope retrieval step helps expose the target DNA by reversing formaldehyde cross-links.
- Allow slides to cool at room temperature for 20 minutes.
- Rinse with deionized water [12].
Proteolytic Digestion:
- Digest tissue sections with proteinase K (e.g., 0.5 mg/mL) at 37-45°C for 5-15 minutes. The concentration and time must be optimized for specific tissue types and fixation conditions to permeabilize the tissue without destroying morphology.
- Rinse slides with deionized water to stop the enzymatic reaction [12].
Dehydration:
- Dehydrate slides through an ethanol series (70%, 96%, and 100%) for 2 minutes each and air dry [12].
Probe Application and Denaturation:
Hybridization:
Post-Hybridization Washes:
- Remove the coverslip and wash slides in pre-warmed saline-sodium citrate (SSC) buffer (e.g., 2x SSC/0.3% NP-40 at 72°C for 2 minutes) to remove unbound and nonspecifically bound probes.
- Rinse briefly in room temperature 2x SSC [12].
Counterstaining and Mounting:
- Apply an antifade mounting medium containing DAPI (4',6-diamidino-2-phenylindole) to stain nuclear DNA.
- Seal coverslips with nail polish to prevent drying [12].
Signal Detection and Analysis
- Visualization: Analyze slides using a fluorescence microscope equipped with appropriate filter sets for the fluorochromes used (e.g., DAPI, FITC, SpectrumOrange, Texas Red) [13].
- Scoring: Manually count specific FISH signals (e.g., fusion signals, break-apart signals, gene copy numbers) in a predetermined number of non-overlapping, intact interphase nuclei (typically 60-200 cells). The analysis should be performed by personnel trained to recognize and discount common artifacts [11].
Research Reagent Solutions
A successful FISH experiment relies on a suite of specific reagents and probes. The table below details key materials and their functions in the FISH workflow for FFPE tissue.
Table 1: Essential Research Reagents for FISH on FFPE Tissue
| Reagent Category | Specific Examples | Function and Role in the Experiment |
|---|---|---|
| DNA Probes | Locus-Specific Probes (LSPs), Centromere Probes (CPs), Whole Chromosome Painting Probes (wcps) [14] | Labeled nucleic acid sequences complementary to the specific genetic target (gene, centromere, chromosome arm) for visualization of aberrations. |
| Fluorochromes & Haptens | SpectrumGreen, SpectrumOrange, Texas Red, Cyanine 5, Biotin, Digoxigenin [14] | Directly labeled fluorochromes emit fluorescence; haptens require indirect detection with fluorophore-coupled antibodies. Enable multiplex detection. |
| Pretreatment Reagents | Citric Acid Buffer, Proteinase K, Sodium Thiocyanate [12] | Expose target DNA by breaking cross-links (citric acid) and digesting proteins (Proteinase K) to allow probe penetration while preserving morphology. |
| Hybridization Buffers | Commercial Hybridization Buffer (e.g., from ZytoVision) [13] | Provides optimal pH, ionic strength, and denaturing agents to facilitate specific probe-target DNA annealing. |
| Post-Hybridization Wash Buffers | Saline-Sodium Citrate (SSC), Detergents (e.g., NP-40) [12] | Remove unbound and nonspecifically bound probes to reduce background noise and improve signal-to-noise ratio. |
| Counterstains & Mounting Media | DAPI (4',6-diamidino-2-phenylindole), Antifade Mounting Medium [12] | DAPI stains nuclear DNA for visualizing overall cellular architecture; antifade medium reduces fluorescence photobleaching. |
Quantitative Data and Performance Metrics
Probe Performance and Stability
The reliability of FISH data is underpinned by the consistent performance of DNA probes. Recent studies have quantitatively assessed the long-term stability of FISH probes under proper storage conditions.
Table 2: Stability of FISH Probes During Long-Term Storage at -20°C [14]
| Probe Type | Hapten/Fluorochrome | Age Range Tested (Years) | Number of Cases Tested | Performance Outcome |
|---|---|---|---|---|
| Self-labeled Homemade Probe | Biotin | 1 – 30 | 200 | All probes functioned perfectly, producing bright, analyzable signals. |
| Digoxigenin | 1 – 29 | 167 | All probes functioned perfectly, producing bright, analyzable signals. | |
| SpectrumGreen | 1 – 13 | 27 | All probes functioned perfectly, producing bright, analyzable signals. | |
| SpectrumOrange | 1 – 15 | 79 | All probes functioned perfectly, producing bright, analyzable signals. | |
| Texas Red | 3 – 18 | 14 | All probes functioned perfectly, producing bright, analyzable signals. | |
| SpectrumAqua | 1 – 9 | 19 | Bright labeling for first 3 years, followed by fading. | |
| Commercial Probe | SpectrumGreen | 1 – 20 | 32 | All probes functioned perfectly, producing bright, analyzable signals. |
| SpectrumOrange | 1 – 19 | 21 | All probes functioned perfectly; shorter exposure times maintained over years. | |
| Texas Red | 4 – 15 | 12 | All probes functioned perfectly, producing bright, analyzable signals. | |
| SpectrumAqua | 1 – 8 | 10 | Bright labeling for first 3 years, followed by fading. |
Diagnostic Thresholds and Scoring Criteria
Establishing validated cutoff values is essential for distinguishing true positive results from background noise. The cutoff is defined as the minimum number of positive nuclei required to define a confident FISH diagnosis, which depends on technical parameters, nuclear size, and probe strategy [11].
Table 3: Representative FISH Scoring Criteria and Diagnostic Cutoffs [11]
| Genetic Aberration Type | Probe Strategy | Typical Cutoff Value | Technical and Biological Considerations |
|---|---|---|---|
| Gene Rearrangement (e.g., translocation) | Break-apart | >10-20% of nuclei with split signals | Cutoff depends on the number of nuclei scored; false splits can occur due to nuclear truncation in tissue sections. |
| Gene Deletion (hemizygous) | Locus-specific probe with centromere control | >40-60% of nuclei with loss of one signal | Must correct for nuclear truncation artifacts; cutoff is high due to the potential for false loss from sectioning. |
| Gene Amplification | Locus-specific probe with centromere control | Ratio of target gene to control >2.2, or presence of gene clusters | High-level amplification is unambiguous; low-level gain requires precise ratio calculation and internal controls. |
| Aneuploidy (monosomy/trisomy) | Centromere enumeration probe | >10% of nuclei with abnormal signal count | Requires analysis of a large number of nuclei; can be confounded by overlapping nuclei or truncation. |
Technical Considerations and Troubleshooting
Common Artifacts and Limitations
Understanding potential pitfalls is crucial for accurate interpretation of FISH results in FFPE tissue:
- Truncation Artifacts: In thin tissue sections (typically 4-5 µm), the nucleus is physically cut, leading to the loss of a portion of the nuclear material and FISH signals. This can falsely indicate a deletion (false loss) [11]. Analysis requires established cutoffs that account for this phenomenon.
- Autofluorescence: Some tissue components or fixatives can cause the tissue to fluoresce naturally, creating a background that can obscure specific FISH signals [11]. Using appropriate filters and pretreatment steps can mitigate this issue.
- Off-target and Background Staining: Nonspecific hybridization of probes to repetitive sequences or other non-target DNA can occur. The use of unlabeled blocking DNA (e.g., Cot-1 DNA) in the probe mixture is essential to suppress this background [11].
- Probe Sensitivity: Standard FISH can be limited in detecting very small deletions or single nucleotide variants, as it relies on the visualization of larger genomic alterations [11].
Quality Control and Validation
Robust quality control is imperative for reliable FISH data [11]:
- Control Samples: Each experiment should include known positive and negative control samples to verify probe performance and hybridization efficiency.
- Internal Control Probes: For deletion/amplification tests, a reference probe targeting a stable chromosomal region (e.g., the centromere) should be used as an internal control for copy number assessment [11].
- Signal Assessment: Probes should be assessed for adequacy and consistency of signal strength, lack of background, and absence of cross-hybridization before implementation in critical experiments [12].
Advantages and Challenges of Working with Archival FFPE Samples
Formalin-fixed paraffin-embedded (FFPE) tissue samples represent one of the most extensive biobank resources in pathology archives worldwide, with an estimated 50 to 80 million samples from solid tumors alone potentially suitable for molecular analysis [15]. These specimens are invaluable for retrospective studies, enabling the investigation of disease development, progression, and treatment efficacy while preserving tissue morphology for pathological diagnosis [16] [11]. The integration of FFPE samples with fluorescent in situ hybridization (FISH) creates a powerful tool for clinical research and diagnostic pathology, allowing direct correlation of chromosomal alterations with cellular morphology and tissue architecture [11]. This application note details the advantages, challenges, and detailed protocols for working with archival FFPE samples within the context of FISH-based research, providing researchers and drug development professionals with practical frameworks for utilizing these precious resources.
Advantages of Archival FFPE Samples
Unparalleled Biobank Access and Morphological Context
Archival FFPE samples offer several distinct advantages that make them indispensable for modern biomedical research. The most significant benefit is long-term storage capability at room temperature, allowing for the preservation of tissues for decades [16]. This extensive archival period enables retrospective studies with annotated long-term follow-up data that are often not available with fresh-frozen specimens [17]. Furthermore, FISH performed on FFPE tissues maintains the critical spatial relationship between genetic alterations and tissue morphology, providing insights that dissociated sequencing methods cannot offer [11]. The compatibility of FFPE samples with routine pathology workflows and their applicability to both tissue sections and cytology specimens further enhances their utility in both clinical and research settings [11].
Broad Research Applications in Disease Characterization
FFPE samples serve crucial roles across multiple research domains, particularly in clinical diagnostics and therapeutic development. In oncology, they are fundamental for tumor characterization, diagnosis, and treatment selection [15]. The preserved nucleic acids and proteins enable various molecular analyses, including the detection of specific genetic alterations that inform targeted therapies [18]. Beyond oncology, FFPE tissues are used extensively in immunology, infectious diseases, hematology, and neurodegenerative disorder research [15]. The ability to study immune cell infiltration and microenvironment composition in situ makes them particularly valuable for immuno-oncology research and biomarker discovery [15].
Key Challenges and Mitigation Strategies
Nucleic Acid Degradation and Quality Issues
The chemical modifications induced by formalin fixation present significant challenges for molecular analyses. DNA and RNA fragmentation occurs due to cleavage of the nucleic acid backbone, often exacerbated by prolonged storage and varying environmental conditions [15]. Research shows that RNA from FFPE material is significantly more degraded than from fresh-frozen specimens, with RNA Integrity Number (RIN) values averaging 2.2 ± 0.1 for FFPE compared to 8.2 ± 0.6 for matched fresh-frozen samples [17]. Cytosine deamination represents another major challenge, leading to C>T/G>A substitution artifacts during sequencing [15]. Additionally, cross-linking between nucleic acids and proteins reduces the efficiency of DNA and RNA extraction and subsequent amplification [17] [15].
Table 1: Common Nucleic Acid Challenges in FFPE Samples and Mitigation Strategies
| Challenge | Impact on Analysis | Mitigation Strategy |
|---|---|---|
| DNA/RNA Fragmentation | Reduced amplification efficiency; limited fragment size | Use specialized library prep kits designed for short fragments [16] |
| Cytosine Deamination | C>T/G>A sequencing artifacts | Enzymatic repair treatments; bioinformatics filtering [15] |
| Protein Cross-linking | Reduced nucleic acid yield; inhibition of enzymes | Extended heating or specialized de-crosslinking protocols [19] |
| Low Input Amounts | Limited sensitivity and coverage | Whole transcriptome amplification; specialized low-input kits [16] [17] |
Technical Limitations in FISH and Sequencing Applications
For FISH-based research, FFPE tissues present unique technical hurdles. Tissue pretreatment requirements vary significantly based on fixation methods, duration, and decalcification processes [11]. Acid-based decalcification of bony specimens can result in DNA hydrolysis, making EDTA decalcification the preferred method for preserving nucleic acid integrity [11]. FISH artifacts including truncation artifacts, aneuploidy artifacts, autofluorescence, and off-target background staining can complicate interpretation [11]. In sequencing applications, the co-extraction of human DNA in much higher concentrations than bacterial DNA (when studying microbiome) creates amplification biases, while library preparation efficiency is reduced due to fragment size distribution and chemical damage [20]. For low bacterial biomass studies, contamination from laboratory reagents and environment presents substantial challenges, requiring careful implementation of controls and specialized statistical approaches [20].
Research Reagent Solutions for FFPE-FISH Workflows
Table 2: Essential Research Reagents for FFPE-FISH Applications
| Reagent/Category | Specific Examples | Function & Application Notes |
|---|---|---|
| FISH Probes | ZytoLight SPEC NRG1 Dual Color Break Apart Probe [18] | Designed to detect specific gene rearrangements; essential for oncogene fusion studies |
| DNA Library Prep Kits | NEBNext Ultrashear FFPE DNA Library Prep Kit [16] | Specialized enzymes for FFPE DNA; includes damage repair reagents |
| IDT xGen cfDNA & FFPE DNA Library Prep v2 MC Kit [16] | Designed specifically for challenging FFPE and low-input DNA samples | |
| RNA Library Prep Kits | Takara SMARTer Universal Low Input RNA Kit [16] | Random priming for degraded RNA; useful for FFPE samples with low RIN values |
| KAPA RNA HyperPrep Kit [16] | Stranded protocol with rRNA depletion; optimized for degraded samples | |
| Nucleic Acid Extraction | RNeasy FFPE Kit [19] | Specialized purification of RNA from FFPE tissues; includes de-crosslinking steps |
| Spatial Transcriptomics | Visium Spatial Gene Expression Slide Kit [19] | Enables gene expression profiling within morphological context |
Detailed FISH Protocol for FFPE Tissue Sections
Sample Preparation and Pretreatment
The following protocol is adapted from methodologies described in recent literature for NRG1 fusion detection in lung and pancreatic cancers [18]. Begin with 4-5 μm thick FFPE tissue sections mounted on positively charged slides. Deparaffinize slides by immersing in xylene (3 × 10 minutes), followed by rehydration through a graded ethanol series (100%, 95%, 70% - 2 minutes each). Air dry slides completely. For epitope retrieval, immerse slides in pre-warmed EDTA-based retrieval solution (pH 9.0) and incubate at 95-100°C for 15-30 minutes. Cool slides to room temperature for 20-30 minutes, then wash in PBS for 5 minutes. Apply pepsin digestion solution (0.5 mg/mL in 0.1N HCl) and incubate at 37°C for 10-30 minutes (optimize digestion time based on tissue type and fixation). Wash slides in PBS (2 × 5 minutes) and dehydrate through ethanol series (70%, 95%, 100% - 2 minutes each). Air dry slides completely before proceeding with hybridization.
FISH Hybridization and Detection
Apply commercially available break-apart FISH probes (e.g., ZytoLight SPEC NRG1 Dual Color Break Apart Probe) to the target area (approximately 200 ng per slide) and coverslip, sealing edges with rubber cement. Co-denature slides and probes simultaneously at 75-80°C for 5-10 minutes, then hybridize overnight (16-20 hours) in a humidified chamber at 37°C. Post-hybridization, remove coverslips carefully and wash slides in pre-warmed 2× SSC/0.1% NP-40 at 75°C for 5 minutes, followed by a room temperature wash in the same solution for 1 minute. Air dry slides in darkness and counterstain with DAPI (125 ng/mL). Apply coverslips and store slides in the dark at 4°C until analysis.
Signal Analysis and Interpretation
Analyze slides using a fluorescence microscope equipped with appropriate filters (DAPI, FITC, TRITC, and dual bandpass). Score a minimum of 50-100 non-overlapping tumor cell nuclei per case. For break-apart probes (e.g., NRG1), a positive result is indicated by separation of red and green signals by at least two signal diameters or the presence of isolated single 3' signals [18]. Establish a positive threshold (typically 15%) of tumor nuclei showing the split signal pattern [18]. Include both positive and negative control samples in each hybridization run to ensure assay validity. Document results with digital imaging systems for permanent records and secondary review.
Complementary Next-Generation Sequencing Approaches
Library Preparation Considerations for FFPE-Derived Nucleic Acids
When implementing next-generation sequencing with FFPE samples, library preparation kit selection is critical for success. Specialized kits address FFPE-specific challenges through several mechanisms: enzymatic damage repair components that address formalin-induced lesions; fragment size selection optimized for short DNA and RNA fragments; and lower input requirements with enhanced adapter ligation efficiency [16]. The table below compares selected library preparation kits suitable for FFPE-derived nucleic acids.
Table 3: Comparison of Library Prep Kits for FFPE Samples
| Manufacturer | Kit Name | Input Requirement | Time | Automation Compatibility | Key Features for FFPE |
|---|---|---|---|---|---|
| New England Biolabs | NEBNext Ultrashear FFPE DNA Library Prep | 5-250 ng DNA | 3.25-4.25 hrs | Yes | Specialized enzyme mix for FFPE DNA; includes damage repair reagents [16] |
| Integrated DNA Technologies | xGen cfDNA & FFPE DNA Library Prep v2 | 1-250 ng DNA | 4 hrs | Yes | Designed specifically for challenging FFPE samples; prevents adapter-dimer formation [16] |
| Roche | KAPA DNA HyperPrep Kit | 1 ng-1 μg DNA | 2-3 hrs | Yes | Single-tube chemistry; PCR and PCR-free versions available [16] |
| Takara Bio | ThruPLEX DNA-Seq Kit | 50 pg fragmented dsDNA | 2 hrs | No | Single-tube workflow; no purification steps [16] |
| Illumina | TruSeq Stranded Total RNA Kit | 0.1-1 μg RNA | 11.5 hrs | Yes | Adjustable fragmentation time for degraded samples [16] |
| Watchmaker | DNA Library Prep Kit | 500 pg-1 μg DNA | 2 hrs | Yes | Designed for low-input with automation; higher conversion efficiency [16] |
Quality Control and Validation Metrics
Implementing rigorous quality control measures is essential for generating reliable data from FFPE samples. For DNA extracted from FFPE tissues, assess fragment size distribution using bioanalyzer systems, with typical sizes ranging from 100-500 base pairs depending on fixation and storage conditions [15]. For RNA, the RNA Integrity Number (RIN) is typically low (mean 2.2 ± 0.1) [17], making alternative metrics like DV200 (percentage of fragments >200 nucleotides) more appropriate for quality assessment. For FISH analysis, establish threshold values based on negative control samples, with typical cutoffs ranging from 10-20% of nuclei showing split signals depending on the specific probe and tissue type [18] [11]. Include positive control samples with known genetic alterations in each experimental run to ensure technical validity. For sequencing applications, monitor metrics including mapping rates, duplication rates, and evenness of coverage to identify potential issues related to FFPE-derived nucleic acids.
Archival FFPE samples represent an invaluable resource for biomedical research, particularly when combined with FISH methodology that preserves the critical relationship between genetic alterations and tissue morphology. While significant challenges exist regarding nucleic acid quality and technical artifacts, continued development of specialized reagents and protocols has substantially improved the reliability of data generated from these specimens. By implementing appropriate quality control measures, utilizing specialized library preparation systems, and following optimized FISH protocols, researchers can effectively leverage these vast archives to advance our understanding of disease mechanisms and therapeutic responses. The integration of FFPE-FISH with complementary next-generation sequencing approaches provides a powerful multidimensional framework for translational research and drug development.
Fluorescence in situ hybridization (FISH) applied to Formalin-Fixed Paraffin-Embedded (FFPE) tissue has become an indispensable technique in both research and clinical diagnostics, enabling the detection of chromosomal abnormalities that drive cancer development and progression. The ability to visualize genetic aberrations within the morphological context of tissue architecture makes FISH particularly valuable for analyzing archival FFPE specimens, which represent the most widely available biological resource in pathology departments worldwide [21]. This application note details key methodologies and protocols for identifying fundamental structural and numerical chromosomal abnormalities, framed within the broader context of advancing precision oncology and biomarker discovery.
Key Applications and Quantitative Data
FISH enables the detection of diverse chromosomal abnormalities in FFPE tissues. The table below summarizes the primary applications and their biological and clinical significance.
Table 1: Key Chromosomal Abnormalities Detectable by FISH in FFPE Tissue
| Abnormality Type | Molecular Basis | Detection Method | Biological/Clinical Significance |
|---|---|---|---|
| Gene Amplification | Increase in copy number of a specific gene locus | Enumeration of FISH signals per nucleus [22] | Oncogene activation (e.g., HER2 in breast cancer); predictive biomarker for targeted therapies [23] |
| Chromosomal Translocations | Exchange of genetic material between non-homologous chromosomes | Break-apart FISH (separation of normally adjacent probes) or fusion FISH (colocalization of different colored probes) [24] | Generation of novel fusion oncogenes (e.g., NPM-ALK in anaplastic large cell lymphoma); diagnostic and prognostic marker [25] [24] |
| Aneuploidy | Gain or loss of entire chromosomes | Enumeration of chromosome-specific centromeric probes in interphase nuclei [22] | Chromosomal instability; associated with tumor aggressiveness and poor prognosis |
| Chromosomal Loss (Deletion) | Loss of a specific chromosomal region | Loss of a specific FISH signal pattern (e.g., hemizygous deletion) [22] | Tumor suppressor gene loss; common driver event in many cancers |
Quantitative FISH analysis (QFISHing) significantly enhances these applications by moving beyond simple detection to precise quantification. This is particularly useful for differentiating true chromosome loss from chromosomal associations, detecting amplifications, and quantifying chromosomal heteromorphisms [22] [26]. In cancer research, this quantitative approach is vital for assessing chromosomal instability and somatic mosaicism, which are hallmarks of tumor evolution and progression [26].
Detailed Experimental Protocols
FFPE Tissue Preparation and Pretreatment Protocol
Proper sample preparation is critical for successful FISH. The following protocol is adapted from established methodologies for FFPE tissues [7].
- Sectioning: Cut 4μm - 6μm thick sections from the FFPE tissue block and mount them on adhesive-coated microscope slides.
- Deparaffinization and Hydration:
- Immerse slides in xylene (or xylene substitute) for 5-10 minutes. Repeat with fresh xylene.
- Rehydrate through a graded ethanol series: 100% ethanol (2 minutes), 95% ethanol (2 minutes), 70% ethanol (2 minutes).
- Rinse in deionized water.
- Heat Pretreatment:
- Immerse slides in a preheated Tissue Pretreatment Solution or citrate buffer (pH 6.0) at 98-100°C for 30 minutes. Note: Incubation time may require optimization based on fixation conditions. [7]
- Wash in PBS or dH₂O at room temperature for 2 x 3 minutes.
- Enzyme Digestion:
- Apply 100-200μl of Enzyme Reagent (e.g., pepsin) to cover the tissue section. Incubate at 37°C for 10-30 minutes. Note: Digestion time is critical and must be optimized; over-digestion destroys morphology, while under-digestion reduces probe accessibility. [21] [7]
- Wash in PBS or dH₂O at room temperature for 3 x 2 minutes.
- Dehydrate slides through a graded ethanol series (70%, 85%, 95%, 100% - 2 minutes each) and air dry.
High-Throughput Break-Apart FISH (hiBA-FISH) for Rare Translocations
This protocol, designed for detecting rare structural variants like the NPM1-ALK translocation, combines break-apart FISH with high-throughput imaging for superior sensitivity and quantification [24].
- Probe Design: Create break-apart probes by labeling two BAC clones flanking the known breakpoint region (e.g., in the ALK gene) with different fluorophores (e.g., Alexa488 5' and Alexa568 3'). A third probe for the translocation partner (e.g., NPM1) is labeled with a distinct fluorophore (e.g., Cy5) [24].
- Denaturation and Hybridization:
- Apply the probe mixture to the pretreated FFPE tissue section.
- Co-denature the slide and probe simultaneously at 75°C for 5 minutes.
- Hybridize overnight (≥16 hours) at 37°C in a humidified, light-proof chamber [7].
- Post-Hybridization Washes:
- Remove coverslip carefully and wash in 0.4x SSC (pH 7.0) at 72°C for 2 minutes.
- Perform a secondary wash in 2x SSC with 0.05% Tween-20 at room temperature for 30 seconds.
- Counterstaining and Mounting:
- Drain the slide and apply 10-15μl of DAPI antifade mounting medium.
- Apply a coverslip, remove bubbles, and allow the slide to set in the dark.
- Image Acquisition and Analysis:
- Acquire images using an automated, high-throughput fluorescence microscope.
- Use image analysis software to segment nuclei based on the DAPI signal.
- Automatically detect FISH spots in each channel and measure the center-to-center Euclidean distances between them.
- Set distance thresholds to classify signals as "split" (indicating a break) or "co-localized" (indicating a fusion) [24].
The workflow for this quantitative detection method is illustrated below.
Assay Validation Protocol
Before implementing a FISH assay in clinical practice, rigorous validation is required. The following preclinical validation process is conducted through four consecutive experiments [23]:
- Familiarization Experiment: Test probe performance on metaphase cells from normal specimens to measure baseline analytic sensitivity and specificity.
- Pilot Study: Test a variety of normal and abnormal FFPE specimens to set a preliminary normal cutoff and establish analytic sensitivity.
- Clinical Evaluation: Test a larger series of normal and abnormal specimens to simulate real-world conditions, finalize the normal cutoff and abnormal reference ranges, and lock the standard operating procedure (SOP).
- Precision Experiment: Measure the reproducibility (inter-day and intra-day variability) of the assay over 10 consecutive working days.
The Scientist's Toolkit: Essential Research Reagents
Successful FISH on FFPE tissue requires specific reagents to ensure optimal probe binding, signal detection, and morphological preservation.
Table 2: Essential Research Reagents for FISH on FFPE Tissue
| Reagent / Material | Function / Purpose | Key Considerations |
|---|---|---|
| Adhesive-Coated Slides | Prevents tissue detachment during stringent processing steps. | Critical for maintaining tissue integrity during high-temperature denaturation and washes [21]. |
| Tissue Pretreatment Solution (e.g., Citrate Buffer) | Unmasks target DNA sequences cross-linked by formalin fixation via heat-induced antigen retrieval. | Time and temperature must be optimized for different fixatives [7]. |
| Digestion Enzyme (e.g., Pepsin) | Digests proteins to permeabilize the tissue, allowing probe access to nuclear DNA. | Concentration and incubation time are critical; must be balanced to allow access without destroying morphology [21] [7]. |
| Fluorescently-Labeled DNA Probes | Hybridize to complementary target DNA sequences for visualization. | Can be commercial "home brew" from BAC clones; must be validated [25] [24]. |
| DAPI (4',6-diamidino-2-phenylindole) Antifade | Counterstains nuclear DNA and reduces fluorescence photobleaching. | Allows visualization of nuclei and contextualization of FISH signals within tissue architecture. |
The protocols and applications detailed herein underscore the power of FISH technology for precise genomic interrogation within the morphological context of FFPE tissues. The move towards quantitative FISHing (QFISHing) and high-throughput methods like hiBA-FISH enhances the sensitivity, objectivity, and informational yield of this established technique [22] [24]. As the field of precision medicine advances, with regulatory frameworks evolving to keep pace [27], the robust and validated application of FISH on FFPE specimens remains a cornerstone of cancer research and companion diagnostic development, enabling critical insights into the chromosomal abnormalities that underpin human disease.
Optimized FFPE-FISH Protocol: From Slide Preparation to Image Analysis
Section Preparation and Critical Adhesive Treatment
Formalin-fixed paraffin-embedded (FFPE) tissues are a cornerstone of biomedical research and clinical diagnostics, providing a stable, long-term resource for morphological and molecular studies. Fluorescence in situ hybridization (FISH) applied to FFPE sections is a powerful technique for visualizing specific DNA sequences within an intact cellular and architectural context. However, the very process of formalin fixation and paraffin embedding presents significant technical challenges for successful FISH analysis. Formalin cross-links proteins and nucleic acids, which can mask target sequences and lead to poor probe accessibility, while sectioning and subsequent treatments can affect tissue adhesion and morphology. This document outlines detailed protocols and application notes for the critical preparatory stages of section preparation and adhesive treatment, which are fundamental to achieving reliable, high-quality FISH results in the context of FFPE tissues [28].
Key Challenges in FFPE-FISH and Impact of Section Preparation
A scoping review of the literature highlights that technical challenges in FFPE-FISH are a significant concern, with pre-analytical factors playing a decisive role [28]. Inadequate fixation, contamination, and improper pretreatment are cited as major sources of problems that can compromise the entire assay. The quality of section preparation and the adhesive treatment directly influences several of these critical aspects:
- Tissue Adhesion: Inadequate adhesion leads to tissue detachment or folding during rigorous pretreatment steps, such as deparaffinization and antigen retrieval, resulting in physical loss of sample and experimental failure.
- Morphology Preservation: Poor sectioning or adhesion can cause cracks, tears, or compression of tissue architecture, making subsequent microscopic analysis and interpretation difficult or impossible.
- Hybridization Efficiency: The treatments used to adhere sections to slides can interact with the chemical processes required to unmask nucleic acid targets. An suboptimal adhesive can either fail to retain the tissue or create a barrier that impedes probe penetration and hybridization.
Quantitative Data on Technical Variables
The following tables summarize critical parameters for section preparation and pretreatment based on current literature and established methodologies.
Table 1: Fixation and Sectioning Parameters for Optimal FISH
| Parameter | Optimal Range/Type | Impact on FISH Quality |
|---|---|---|
| Fixation Time | 6-24 hours (in 10% NBF) | Under-fixation: Poor morphology; Over-fixation: Excessive cross-linking, reduced hybridization efficiency [28]. |
| Tissue Processor | Standard automated vacuum infiltration processors | Ensures complete, uniform paraffin infiltration for high-quality sectioning. |
| Section Thickness | 4-5 μm | Standard for FFPE-FISH; thinner sections improve probe penetration but are more fragile. |
| Microtome Blade | High-profile, disposable blades | Prevents carry-over contamination between samples and ensures clean, non-compressed sections. |
| Section Drying | 60°C for 30-60 min, then 37°C overnight | Ensures firm adhesion of tissue to charged slide surface without baking in antigens/nucleic acids. |
Table 2: Comparison of Slide Adhesive Types
| Adhesive Type | Mechanism of Action | Advantages | Disadvantages |
|---|---|---|---|
| Poly-L-Lysine | Electrostatic interaction between positively charged polymer and negatively charged glass and tissue. | Inexpensive, widely used, good for most applications. | Adhesion can weaken under high-temperature or enzymatic pretreatment conditions. |
| Silane | Covalent bonding to glass silanol groups and tissue proteins. | Superior, permanent adhesion; resistant to high temperatures and harsh chemicals. | Can be more expensive; requires specific preparation protocols. |
| Charged/Positively Charged Slides | Commercially pre-coated with poly-lysine or silane. | Consistent quality, convenient, time-saving. | Higher cost per slide; performance can vary by manufacturer. |
Experimental Protocols
Protocol: Section Preparation and Adhesion Using Silane-Coated Slides
This protocol is designed for maximum tissue retention during stringent FISH pretreatment workflows.
Materials:
- High-profile disposable microtome blades
- Silane-coated or poly-L-lysine-coated glass slides
- Water bath (set at 42-45°C)
- Oven or hotplate (set at 60°C)
Methodology:
- Sectioning: Cut 4-5 μm thick sections from the FFPE block using a clean, sharp microtome blade.
- Floating: Carefully float the ribbon of sections on the surface of a warm water bath (42-45°C) to smooth out wrinkles.
- Mounting: Gently pick up the sections onto a pre-labeled, silane-coated slide, ensuring they are centered and flat.
- Draining: Drain excess water from the slide by tilting it onto a paper towel.
- Drying: Place the slides on a flat hotplate or in an oven at 60°C for 30-60 minutes to melt excess paraffin and initiate adhesion.
- Curing: Transfer slides to a slide rack and dry them further at 37°C overnight. This step is critical for robust adhesion.
- Storage: Store dried slides at room temperature or 4°C in a sealed box with desiccant until use. For long-term storage (>6 months), keep at -20°C.
Protocol: Critical Adhesive Treatment and Slide Pretreatment
This protocol outlines steps to verify and enhance slide adhesion prior to FISH.
Materials:
- Xylene or xylene-substitute
- Ethanol (100%, 95%, 70%)
- Phosphate-Buffered Saline (PBS), pH 7.4
- Coplin jars or automated staining system
Methodology:
- Deparaffinization: Immerse slides in fresh xylene (or substitute) for 10 minutes. Repeat twice with fresh xylene.
- Rehydration:
- Immerse slides in 100% ethanol for 5 minutes. Repeat once.
- Immerse slides in 95% ethanol for 5 minutes.
- Immerse slides in 70% ethanol for 5 minutes.
- Rinse slides in distilled water for 2 minutes.
- Adhesion Check: Visually inspect slides under a microscope after the final water rinse. Look for any signs of tissue lifting, bubbling, or detachment. Slides failing this check should not be processed further.
- Pretreatment (Optional but Recommended): Depending on the sample and probe, a pretreatment with a mild detergent (e.g., 0.1% Triton X-100) or a specific antigen retrieval solution may be required to permeabilize the tissue. The adhesion from the silane coating is robust enough to withstand this step.
Workflow Visualization
Diagram 1: FFPE Section Preparation and Adhesion Workflow. This flowchart outlines the critical steps from microtomy to the adhesion quality check prior to FISH.
Diagram 2: Troubleshooting FISH in FFPE Tissues. This diagram maps common challenges in section preparation to their proposed solutions, highlighting the central role of adhesive treatment.
The Scientist's Toolkit: Research Reagent Solutions
Table 3: Essential Materials for FFPE Section Preparation and Adhesion
| Item | Function | Critical Notes |
|---|---|---|
| Silane-Coated Slides | Provides a covalent, high-strength bond between the glass slide and the tissue section, preventing detachment during harsh pretreatment. | Essential for protocols involving high-temperature or enzymatic treatments. Superior to poly-L-lysine for challenging samples [28]. |
| High-Profile Microtome Blades | Produces thin, wrinkle-free, uncompressed tissue sections, which are crucial for uniform probe penetration and clear microscopic analysis. | Prevents cross-contamination between blocks. Dull blades cause tearing and poor morphology. |
| Formalin, Neutral Buffered (10% NBF) | The standard fixative that preserves tissue morphology by forming protein-nucleic acid cross-links. | Fixation time must be optimized and standardized; deviation is a major source of FISH failure [28]. |
| Xylene & Ethanol Series | For deparaffinizing and rehydrating sections prior to FISH. Removes paraffin to allow aqueous-based reagents to access the tissue. | Use fresh xylene for effective paraffin removal. Incomplete deparaffinization will block probe access. |
| Protease Solution (e.g., Pepsin) | Enzyme used in pretreatment to digest proteins and reverse formalin cross-links, thereby unmasking target DNA sequences for probe hybridization. | Concentration and digestion time must be empirically titrated; over-digestion destroys tissue morphology [28]. |
Heat Pretreatment and Enzyme Digestion for Target Accessibility
In the field of fluorescent in situ hybridization (FISH) research using formalin-fixed paraffin-embedded (FFPE) tissues, sample pretreatment is a critical determinant of experimental success. Effective heat pretreatment and enzyme digestion are essential for unlocking target nucleic acid sequences that have been masked by formalin-induced cross-linking and protein encapsulation. These preparatory steps significantly impact hybridization efficiency, signal clarity, and ultimately, the reliability of genetic analyses in both research and clinical diagnostics. This protocol provides detailed methodologies for optimizing these crucial pretreatment parameters to enhance target accessibility while preserving tissue morphology.
Application Notes: Optimization of Pretreatment Parameters
The Impact of Pretreatment on FISH Success
The primary challenge in FFPE-FISH revolves around reversing the effects of formalin fixation, which creates methylene bridges between proteins and nucleic acids, effectively obscuring target sequences. Inadequate pretreatment leaves these cross-links intact, resulting in poor probe penetration and hybridization, while excessive pretreatment can damage tissue morphology and target DNA, leading to compromised interpretation [29]. Achieving the optimal balance requires careful consideration of multiple interdependent variables.
Quantitative Optimization Guidelines
Table 1: Heat Pretreatment Optimization Parameters
| Parameter | Optimal Range | Effect of Insufficient Treatment | Effect of Excessive Treatment |
|---|---|---|---|
| Temperature | 98-100°C [7] [30] | Incomplete reversal of cross-links | Tissue degradation & DNA damage |
| Duration | 30 minutes (starting point) [7] | High background fluorescence | Loss of target integrity |
| Solution Volume | 50 mL [7] [30] | Inconsistent heating across sample | N/A |
| Tissue Section Thickness | 3-6 μm [29] [7] | Probe penetration issues | Overlapping cells & interpretation difficulty |
Table 2: Enzyme Digestion Optimization Parameters
| Parameter | Optimal Range | Effect of Insufficient Treatment | Effect of Excessive Treatment |
|---|---|---|---|
| Enzyme Volume | 100-200 μL [7] [30] | Residual proteins mask targets | Loss of nuclear morphology |
| Incubation Time | 10 minutes (starting point) [7] | Autofluorescence & nonspecific binding | Chromatin structure deterioration |
| Temperature | Room temperature [7] | Reduced enzyme activity | Increased risk of over-digestion |
| Enzyme Type | Protease-specific (e.g., Pepsin) [31] | Incomplete protein digestion | Non-specific tissue damage |
Critical Considerations for Pretreatment Optimization
- Fixation Quality Assessment: The ideal pretreatment protocol must be adjusted based on fixation quality. Under-fixed tissues exhibit incomplete cellular preservation and DNA degradation, while over-fixed tissues demonstrate excessive cross-linking that requires more aggressive pretreatment [29].
- Tissue-Specific Optimization: Different tissue types (e.g., dense fibrous tissue versus cellular organs) require customization of standard protocols. The recommended 30-minute heat pretreatment and 10-minute enzyme digestion serve only as starting points for optimization [7] [30].
- Reagent Quality Control: Always use freshly prepared solutions for fixation, pretreatment, and washing steps. Degraded reagents contribute significantly to high background fluorescence and inconsistent results [29].
Experimental Protocols
Comprehensive FFPE-FISH Pretreatment Protocol
Principle: This protocol utilizes controlled heat-mediated antigen retrieval followed by targeted enzymatic digestion to reverse formalin cross-links and remove obscuring proteins, thereby enhancing nucleic acid accessibility for FISH probes.
Materials:
- FFPE tissue sections (3-6 μm thickness) mounted on adhesive slides
- Tissue Pretreatment Solution (e.g., Citrate-based buffer)
- Enzyme Reagent (e.g., Pepsin)
- Porcelain or Coplin jars
- Water bath capable of maintaining 98-100°C
- Ethanol series (70%, 85%, 95%, 100%)
- Phosphate-buffered saline (PBS) or deionized water
Procedure:
- Deparaffinization:
- Immerse slides in xylene (3 changes, 10 minutes each)
- Rehydrate through ethanol series: 100% (2 minutes), 95% (2 minutes), 85% (2 minutes), 70% (2 minutes)
- Rinse in deionized water [31]
Heat Pretreatment:
- Heat 50 mL Tissue Pretreatment Solution in a porcelain jar immersed in a water bath to 98-100°C [7] [30]
- Place slides in heated solution and incubate for 30 minutes (optimization range: 15-45 minutes based on fixation quality) [7]
- Wash in PBS or deionized water at room temperature (2 × 3 minutes) [7]
Enzyme Digestion:
Dehydration:
Troubleshooting Notes:
- High Background Fluorescence: Increase enzyme digestion time incrementally (2-minute intervals) or increase wash stringency [29]
- Weak Target Signal: Extend heat pretreatment duration (5-minute increments) or increase enzyme concentration [29]
- Tissue Morphology Loss: Reduce enzyme digestion time or concentration; verify section thickness does not exceed 6 μm [29] [7]
Alternative Pretreatment Methodology
For researchers requiring a validated commercial approach, the RNAscope Multiplex Fluorescent Assay provides an alternative protocol:
- Deparaffinization: Xylene and 100% ethanol series
- Hydrogen Peroxide Blocking: 10 minutes to quench endogenous peroxidase activity
- Heat-mediated Target Retrieval: Boiling water bath for 15 minutes
- Enzyme Digestion: Protease Plus incubation at 40°C for 15 minutes [31]
This standardized approach offers reduced optimization time but less flexibility for tissue-specific adjustments.
Workflow Visualization
Diagram Title: FFPE-FISH Pretreatment Workflow
The Scientist's Toolkit
Table 3: Essential Reagents for FFPE-FISH Pretreatment
| Reagent/Category | Specific Examples | Function & Application Notes |
|---|---|---|
| Tissue Pretreatment Kits | CytoCell LPS 100 Tissue Pretreatment Kit [29] | Standardized solution for consistent heat-induced epitope retrieval |
| Enzyme Reagents | Protease Plus [31], Pepsin | Digest obscuring proteins while preserving nucleic acid integrity |
| Buffer Systems | Citrate-based buffer (pH 6.0), SSC buffer | Maintain optimal pH environment for enzymatic activity & hybridization |
| Probe Systems | RNAscope target-specific probes [31], CytoCell FDA-cleared FISH probes [29] | Validated detection systems with optimized hybridization characteristics |
| Signal Detection | TSA Plus Fluorophores [31], DAPI antifade | Amplification and counterstaining for target visualization |
The critical interplay between heat pretreatment and enzyme digestion establishes the foundation for successful FFPE-FISH analysis. The methodologies presented herein provide researchers with both standardized protocols and optimization frameworks to address the variability inherent in archival tissue specimens. As FISH technologies continue to evolve toward multiplexed assays and automated platforms, these fundamental pretreatment principles will remain essential for generating reliable, reproducible genetic data in both research and clinical diagnostic contexts.
Within the broader scope of fluorescent in situ hybridization (FISH) research on formalin-fixed paraffin-embedded (FFPE) tissue, the steps of probe denaturation and hybridization are critical determinants of assay success. These processes directly influence the ability of fluorescently labeled DNA probes to access and bind specifically to their complementary DNA sequences within the complex matrix of fixed tissue. Achieving high specificity is paramount for accurate genetic diagnosis, reliable biomarker detection, and valid research outcomes in drug development. This application note details standardized protocols and key conditions to optimize these crucial steps, ensuring robust and reproducible FISH results in FFPE tissue sections.
The Scientist's Toolkit: Essential Reagents for FISH
The following reagents are fundamental to performing FISH on FFPE tissues, each playing a specific role in ensuring effective probe denaturation and hybridization [32] [7].
Table 1: Key Research Reagent Solutions for FISH
| Reagent Name | Function in Protocol |
|---|---|
| Formamide | A denaturing agent used in hybridization buffers to lower the melting temperature of double-stranded DNA, facilitating probe denaturation and hybridization. |
| Saline Sodium Citrate (SSC) | Provides the appropriate ionic strength and pH for hybridization and stringency washes. |
| Dextran Sulfate | A volume excluder that increases the effective probe concentration in the hybridization mix, enhancing hybridization efficiency. |
| Proteinase K | An enzyme that digests proteins cross-linked by formalin fixation, thereby exposing the target DNA for probe access. |
| Formalin-Fixed Paraffin-Embedded (FFPE) Tissue Sections | The archival clinical and research material, typically sectioned at 4-6 μm thickness for FISH analysis. |
| Fluorochrome-Labeled DNA Probes | Commercially available probes targeting specific DNA sequences (e.g., centromeres, unique genes, whole chromosomes). |
Critical Parameters for Denaturation and Hybridization
Optimal denaturation and hybridization require precise control over several physical and chemical parameters. The quantitative values in the table below are derived from established methodologies [32] [7] [12].
Table 2: Optimization Parameters for Denaturation and Hybridization
| Parameter | Typical Optimal Condition | Impact on Specificity |
|---|---|---|
| Denaturation Temperature | 73°C - 80°C | Incomplete denaturation at low temperatures reduces hybridization; excessive heat damages tissue morphology. |
| Denaturation Time | 5 - 10 minutes | Must be sufficient to fully separate DNA strands but not so long as to degrade the target DNA. |
| Hybridization Temperature | 37°C - 45°C | Lower temperatures permit non-specific binding; higher temperatures can prevent even specific hybridization. |
| Hybridization Time | 4 - 16 hours (Overnight) | Shorter times may yield weak signals; longer times can increase background noise. |
| Formamide Concentration | 50% - 70% (v/v) in hybridization buffer | Reduces the thermal stability of nucleic acids, allowing for specific hybridization at lower, tissue-compatible temperatures. |
| Salt (SSC) Concentration | 2x SSC in hybridization buffer | Higher salt concentrations stabilize DNA duplexes but can also stabilize non-specific interactions if not properly controlled in washes. |
Experimental Protocol: Denaturation and Hybridization
The following detailed methodology is adapted from robust, peer-reviewed protocols for FFPE tissue [32] [7] [12]. This protocol assumes starting with deparaffinized, pretreated, and dehydrated tissue sections.
1. Probe Preparation
- For each target area on the slide, pipette 10-15 μL of the commercially acquired, directly labeled FISH probe into a microcentrifuge tube [7].
- Allow the probe to warm to room temperature and mix thoroughly by pipetting to ensure a uniform solution [7].
2. Pre-warming
- Place the tube containing the probe and the FFPE tissue slide on a pre-warmed hotplate or thermal cycler set to 37°C (±1°C). Let them equilibrate for approximately 5 minutes [7]. This step minimizes thermal shock when the probe is applied.
3. Simultaneous Denaturation of Probe and Target
- Apply the pre-warmed probe mixture directly onto the target tissue area.
- Carefully place a coverslip over the probe to spread it evenly and seal the edges with rubber cement to prevent evaporation during incubation [32].
- Transfer the slide to a pre-heated hotplate or submerged in a floating rack in a water bath set at 75°C (±1°C) for 5 minutes [7]. This critical step simultaneously denatures the double-stranded DNA of both the probe and the cellular DNA in the tissue.
4. Hybridization
- Immediately after denaturation, transfer the sealed slide to a humidified, light-proof chamber.
- Incubate the chamber at 37°C (±1°C) for 4 to 16 hours (overnight) [32] [7]. This extended incubation allows the single-stranded probe molecules to diffuse into the nucleus and find their complementary target sequences.
5. Post-Hybridization Washes (Stringency Washes)
- After hybridization, carefully remove the rubber cement and coverslip.
- Immerse the slide in a pre-warmed solution of 0.4x SSC at 72°C (±1°C) for 2 minutes [32] [7]. This high-temperature, low-salt wash is the primary stringency step, removing probes that are partially bound or mismatched.
- Rinse the slide in a second wash solution, such as 2x SSC with 0.05% Tween-20 at room temperature for 30 seconds, to remove residual salts and detergents [7].
- Dehydrate the slides briefly in an ethanol series (70%, 80%, 95%), air dry, and apply a DAPI-containing antifade mounting medium before coverslipping for analysis [32].
Workflow and Parameter Interrelationships
The diagram below illustrates the core experimental workflow for FISH denaturation and hybridization, highlighting the critical steps that ensure specificity.
Discussion and Concluding Remarks
The reliability of FISH data in FFPE tissue research is fundamentally dependent on the stringent control of denaturation and hybridization conditions. The use of a standardized protocol, as outlined above, mitigates the technical challenges posed by variable fixation and processing of FFPE samples [12] [28]. The one-fits-all pretreatment approach, coupled with the precise thermal and chemical controls during hybridization, has been demonstrated to yield interpretable results in over 93% of clinical samples, underscoring its robustness for both diagnostic and drug development applications [12].
The interplay between formamide concentration, temperature, and salt conditions during hybridization and post-hybridization washes is the primary mechanism for controlling specificity. By carefully optimizing these parameters, researchers can ensure that fluorescent signals are a true representation of the underlying genetic architecture, thereby enabling accurate detection of chromosomal rearrangements, amplifications, and deletions that are central to modern cancer research and therapy stratification.
Post-Hybridization Washes and Signal Detection
In Fluorescence In Situ Hybridization (FISH) performed on Formalin-Fixed Paraffin-Embedded (FFPE) tissue, the steps following the overnight hybridization are critical for achieving a clear, specific, and interpretable result. Post-hybridization washes remove unbound and nonspecifically bound probes, thereby reducing background noise, while appropriate signal detection allows for the accurate visualization of target-specific hybridization. The precise execution of these protocols is essential for definitive genomic aberration detection, which informs diagnostic and therapeutic decisions in clinical practice and drug development [11]. This application note provides detailed methodologies for these crucial phases.
Detailed Experimental Protocols
Protocol for Post-Hybridization Washes
This protocol is designed to be performed after the overnight hybridization step, using a water bath or a temperature-controlled heating block for accurate temperature control [11] [7].
Materials:
- Saline Sodium Citrate (SSC) Buffer (e.g., 20x SSC concentrate)
- Detergent (e.g., Tween-20)
- Coplin jars or glass staining dishes
- Water bath
- Formamide (for high-stringency washes)
Procedure:
- Coverslip Removal: Carefully remove the sealed coverslip and any traces of rubber cement or glue from the slide [7].
- High-Stringency Wash:
- Immerse the slide in a pre-warmed solution of 0.4x SSC (pH 7.0) at 72°C (± 1°C) for 2 minutes without agitation [7].
- The temperature and ionic strength of this wash are key stringency factors. Higher temperatures and lower salt concentrations increase stringency, removing probes with lower sequence complementarity [11] [33].
- Low-Stringency Wash:
- Transfer the slide to a solution of 2x SSC with 0.05% Tween-20 at room temperature (pH 7.0) for 30 seconds to 2 minutes without agitation [7]. This step helps to remove residual salts and detergents.
- Counterstaining and Mounting:
- Drain the slide and apply 10μl - 15μl of DAPI (4',6-diamidino-2-phenylindole) antifade solution to the target area of the sample.
- Cover with a coverslip, remove any bubbles, and allow the slide to develop in the dark for at least 10 minutes before analysis [7].
Protocol for Signal Detection and Analysis
This protocol assumes the use of a fluorescently labeled probe or a hapten-labeled probe (e.g., Digoxigenin) with a fluorescent antibody for detection.
Materials:
- Blocking buffer (e.g., MABT + 2% BSA, milk, or serum)
- Primary antibody conjugated to a fluorophore (e.g., Anti-Digoxigenin)
- Wash buffer (e.g., MABT or PBS with Tween-20)
- DAPI antifade mounting medium
- Fluorescence microscope with appropriate filter sets
Procedure:
- Blocking: Transfer the slide to a humidified chamber and add 200 µL of blocking buffer to each section. Incubate for 1–2 hours at room temperature to prevent nonspecific antibody binding [33].
- Antibody Incubation: Drain the blocking buffer. Apply the fluorophore-conjugated antibody (e.g., Anti-Digoxin) at the manufacturer's recommended dilution in fresh blocking buffer. Incubate for 1–2 hours at room temperature in the dark [33].
- Post-Antibody Washes: Wash the slides 5 times for 10 minutes each with MABT or a similar gentle wash buffer at room temperature to remove any unbound antibody [33].
- Final Mounting and Curing: After the final wash, apply DAPI antifade mounting medium if not already applied, coverslip, and allow the slide to sit in the dark for a final 10 minutes to ensure optimal signal development and photostability [7].
- Analysis: View the slides using a fluorescence microscope equipped with filters specific for the fluorophores used. For each sample, signals from at least 50-100 non-overlapping, intact nuclei should be counted to ensure statistical validity [11].
Data Presentation: Wash Conditions and Parameters
The tables below summarize the key quantitative parameters for post-hybridization washes and signal interpretation.
Table 1: Post-Hybridization Wash Conditions for FFPE-FISH
This table outlines common wash conditions tailored to different probe types to balance signal strength and specificity [11] [33] [7].
| Step | Solution | Temperature | Time | Purpose | Considerations |
|---|---|---|---|---|---|
| Stringency Wash 1 | 50% Formamide in 2x SSC | 37-45°C | 3 x 5 min | Remove excess probe and hybridization buffer | Higher temperatures can weaken hybridized probe signal if overdone [33]. |
| Stringency Wash 2 | 0.1-2x SSC | 25-75°C | 3 x 5 min | Remove non-specific/repetitive sequence hybridization | Short probes (0.5–3 kb): Lower temp (≤45°C), lower stringency (1-2x SSC). Single-locus probes: Higher temp (~65°C), higher stringency (<0.5x SSC) [33]. |
| Final Wash | 2x SSC, 0.05% Tween-20 | Room Temperature | 30 sec - 2 min | Remove residual salts and prepare for detection | Gentler wash to maintain tissue integrity [7]. |
Table 2: Signal Scoring and Interpretation Guidelines
Establishing validated cutoff values is imperative for distinguishing true positive cases from background noise [11].
| Parameter | Typical Threshold / Guideline | Rationale & Notes |
|---|---|---|
| Minimum Nuclei Counted | 50-100 nuclei [11] | Ensures statistical significance and representative sampling. |
| Cutoff Value Determination | Statistically validated per probe and lab [11] | Defined as the minimum number of positive nuclei to define a confident FISH diagnosis. Depends on technical parameters, nuclear size, and probe strategy. |
| Positive Case Example (FRS2/CEP12) | FRS2/CEP12 ratio ≥ 2.0 AND average FRS2 copy number per cell ≥ 4.0 [34] | Example of dual criteria used in a ddPCR-validated FISH assay for gene amplification. |
| Background / Normal Signal | Below established cutoff; consistent with negative control patterns. | Signals from non-target or normal cells. |
| Common Artifacts | Truncation, aneuploidy/polyploidy, autofluorescence, off-target staining [11] | Can be caused by improper sampling, fixation, or nonspecific hybridization. |
Workflow Visualization
The following diagram illustrates the logical sequence and decision points in the post-hybridization and detection process.
The Scientist's Toolkit: Essential Research Reagents
The following reagents are critical for successful post-hybridization washes and signal detection in FFPE-FISH.
Table 3: Key Reagents for Washes and Detection
| Reagent / Solution | Function / Purpose |
|---|---|
| Saline Sodium Citrate (SSC) | A buffer solution that provides the ionic strength (salt concentration) critical for controlling hybridization stringency during washes. Lower concentrations (e.g., 0.1-0.4x) increase stringency [33] [7]. |
| Formamide | A denaturing agent used in high-stringency wash buffers. It lowers the thermal stability of nucleic acid duplexes, allowing for stringent washing at lower, tissue-preserving temperatures to remove imperfectly matched probes [33]. |
| Tween-20 | A non-ionic detergent added to wash buffers (e.g., 2x SSC) to reduce nonspecific background binding by minimizing hydrophobic interactions [7]. |
| Blocking Buffer | A solution containing protein (e.g., BSA, serum) or other blocking agents. It coats the tissue section to prevent nonspecific binding of the detection antibody, thereby reducing background noise [33]. |
| Fluorophore-Conjugated Antibody | The primary detection reagent. It binds specifically to the hapten (e.g., Digoxigenin) incorporated into the FISH probe, enabling visualisation under a fluorescence microscope [33]. |
| DAPI Antifade Mounting Medium | A solution that serves two purposes: 1) DAPI stains nuclear DNA, providing a morphological context (blue fluorescence) for signal localization; 2) The antifade component reduces photobleaching of fluorophores during microscopy [7]. |
Multiplexed FISH and Spatial Transcriptomics (MERFISH)
Multiplexed Error-Robust Fluorescence In Situ Hybridization (MERFISH) is a massively multiplexed single-molecule imaging technology for spatially resolved transcriptomics, capable of simultaneously measuring the copy number and spatial distribution of hundreds to thousands of RNA species in individual cells within their native tissue context [35]. This method has emerged as a powerful tool for defining the cellular structure of diverse tissues, particularly leveraging the vast archives of formalin-fixed paraffin-embedded (FFPE) tissue samples that represent the standard for clinical sample preservation in pathology [36] [37]. MERFISH technology combines advanced combinatorial labeling, sequential imaging, and error-robust barcoding to achieve unparalleled multiplexing capabilities while providing subcellular resolution [35].
The fundamental principle of MERFISH involves assigning each RNA transcript a unique binary barcode that is read through multiple rounds of sequential fluorescence imaging [38] [35]. This system dramatically increases detection capacity and incorporates error correction, producing highly accurate and reproducible data [35]. By localizing transcripts with nanometer-scale resolution, MERFISH enables researchers to map gene expression across entire tissue samples, uncovering complex patterns of tissue organization, cell states, and their interactions across multiple length scales [35]. The ability to perform these measurements in FFPE tissues has been particularly transformative for cancer research and translational studies, allowing investigators to tap into vast historical libraries of patient samples [36].
MERFISH 2.0 Technological Advancements
The recent development of MERFISH 2.0 represents a significant advancement in spatial transcriptomics technology, with optimized chemistry that drives sharper resolution for mapping transcripts and cell types with greater precision [35]. This next-generation technology incorporates three key improvements that enhance performance: perfected RNA anchoring that maintains transcript integrity and probe accessibility, enhanced probe binding that maximizes occupancy rates at target sites, and amplified readout probes that increase the number of readout probes to maximize fluorescent signal [35].
These advancements have proven particularly valuable for FFPE tissue analysis, where RNA integrity is often compromised due to extended storage and fixation processes. MERFISH 2.0 demonstrates enhanced capability to extract meaningful data from samples with degraded RNA, including archival FFPE specimens [39]. Researchers have reported detecting "almost 10-fold higher" transcript numbers compared to MERFISH 1.0, even in challenging samples like pancreatic ductal adenocarcinoma tissue which traditionally presents difficulties due to high RNase content [35]. The improved sensitivity enables researchers to obtain high-quality spatial transcriptomic data that was previously inaccessible from suboptimal samples, expanding the potential for discoveries from valuable clinical archives.
Performance Benchmarking in FFPE Tissues
Comparative Platform Performance
Recent systematic benchmarking studies have evaluated MERFISH alongside other commercial imaging-based spatial transcriptomics platforms using FFPE tissues. These investigations reveal important performance characteristics that inform experimental design and platform selection.
Table 1: Performance Metrics of Imaging Spatial Transcriptomics Platforms in FFPE Tissues [40] [37]
| Performance Metric | MERFISH | CosMx | Xenium (Unimodal) | Xenium (Multimodal) |
|---|---|---|---|---|
| Transcript counts per cell | Lower than CosMx in older TMAs; improves in newer tissues | Highest among all platforms | Intermediate between CosMx and MERFISH | Lower than unimodal version |
| Unique genes per cell | Varies with tissue age; lower in ICON TMAs than newer MESO TMAs | Highest detection | Higher than multimodal | Lower detection |
| Sensitivity with low RNA quality | Good with MERFISH 2.0 improvements | Requires adequate RNA quality | Requires adequate RNA quality | Requires adequate RNA quality |
| Background signal | Lacks negative control probes for comparison | Some target genes expressed at negative control levels | Minimal target genes at negative control levels | Few target genes at negative control levels |
Table 2: Technical Specifications and Sample Compatibility [40] [37] [39]
| Parameter | MERFISH (MERSCOPE) | CosMx | Xenium |
|---|---|---|---|
| FFPE compatibility | Yes, with dedicated solution kit | Yes | Yes |
| Recommended RNA quality | DV200 > 60% | Pre-screening based on H&E | Pre-screening based on H&E |
| Panel size | Up to 1000 genes | 1000-plex (with 6000-gene option emerging) | 289-500 genes (with 5000-gene option emerging) |
| Imageable area | Up to 3 cm² with MERSCOPE Ultra | Limited to selected FOVs (545 μm × 545 μm) | Covers whole tissue area |
| Tissue age performance | Better performance with newer tissues (< 2 years) | Decreased performance in older tissues | Decreased performance in older tissues |
Concordance with Orthogonal Methods
MERFISH demonstrates strong concordance with established transcriptomic methods, providing validation of its quantitative capabilities. Studies comparing MERFISH with bulk RNA-seq and single-cell RNA-seq (scRNA-seq) have shown high correlation (R = 0.99 in liver and R = 0.95 in kidney technical replicates), with MERFISH exhibiting superior dropout rates and sensitivity [41]. This high reproducibility between technical replicates underscores the robustness of the method. Importantly, MERFISH has proven capable of independently resolving distinct cell types and spatial structures without computational integration with scRNA-seq atlases, indicating that its data alone provides sufficient information for accurate cell type identification [41].
MERFISH Protocol for FFPE Tissues
The following diagram illustrates the complete MERFISH workflow for FFPE tissues, from sample preparation through data analysis:
Critical Protocol Optimization Steps
Recent systematic investigations have identified key optimization opportunities that significantly enhance MERFISH performance in FFPE tissues:
Probe Design and Hybridization Optimization
Protocol optimization experiments have revealed that signal brightness depends relatively weakly on target region length for regions of sufficient length (20-50 nt) [38]. The optimal formamide concentration for hybridization does vary with target region length, but the average brightness of single-molecule signals shows weak dependence on formamide concentration within the optimal range for each target region length [38]. These findings suggest that current probe designs are already reasonably efficient, but hybridization conditions can be fine-tuned for specific applications.
Encoding probe hybridization has historically been slow (typically several hours to days), while hybridization of fluorescently labeled readout probes complementary to these readout sequences is much faster (typically minutes) [38]. Modified approaches to encoding probe hybridization can substantially enhance the rate of probe assembly, providing an avenue to brighter signals and potentially reducing overall protocol time [38].
Buffer Composition and Reagent Stability
MERFISH measurements can extend across days, and signal brightness can be modulated by the stability of reagents during this time [38]. Research indicates that MERFISH reagents can decrease in performance throughout the duration of an experiment, but methods have been developed to ameliorate this 'aging' of reagents [38]. Systematic exploration of different imaging buffers has led to the development of new formulations that improve photostability and effective brightness for commonly used MERFISH fluorophores [38]. These buffer optimizations are particularly important for FFPE tissues, where autofluorescence and background signals can be challenging.
Specificity Enhancements
Studies have shown that commonly used MERFISH readout probes can bind non-specifically in a tissue- and readout-specific fashion [38]. This minor increase in background can introduce false positive counts, but can be mitigated by prescreening readout probes against the sample of interest [38]. This finding is particularly relevant for FFPE tissues, which may present unique non-specific binding challenges due to fixation-induced epitope modifications.
Research Reagent Solutions
Table 3: Essential Research Reagents for MERFISH in FFPE Tissues
| Reagent/Category | Function | Implementation Considerations |
|---|---|---|
| Encoding Probes | Bind to cellular RNA containing targeting region and barcode sequences | Target regions of 20-50 nt show similar performance; design includes error-robust barcodes |
| Readout Probes | Fluorescently labeled probes complementary to readout sequences | Sequential hybridization enables barcode reading; non-specific binding can be tissue-dependent |
| Hybridization Buffer | Optimizes probe binding efficiency and specificity | Formamide concentration can be optimized for specific target lengths; new formulations improve photostability |
| Antigen Retrieval Reagents | Reverse formaldehyde cross-links in FFPE tissue | Critical for FFPE samples; affects RNA accessibility and probe binding efficiency |
| Proteinase Digestion Enzymes | Digest proteins to increase RNA accessibility | Must be optimized to balance RNA accessibility with tissue morphology preservation |
| Imaging Buffer | Maintains fluorophore stability during extended imaging | New buffers improve photostability and effective brightness; reduces reagent "aging" during multi-day experiments |
| Cell Segmentation Stains | DAPI and membrane stains for cell boundary identification | Enables single-cell resolution and transcript localization to individual cells |
Experimental Design Considerations
Sample Preparation Workflow
The sample preparation workflow for MERFISH in FFPE tissues requires careful attention to each step to ensure optimal results:
Gene Panel Design
MERFISH requires preselection of target genes, typically ranging from 100 to 1000 genes depending on the platform and application [40] [35] [39]. Panel design should prioritize marker genes that can distinguish cell types and states relevant to the research question. The Vizgen Gene Panel Design Portal provides real-time feedback on gene suitability for MERFISH measurements, helping researchers optimize their panel selections [39]. For FFPE tissues, special consideration should be given to RNA integrity, as longer transcripts may be more fragmented, potentially affecting detection efficiency.
Data Analysis and Interpretation
Computational Processing Pipeline
The computational workflow for MERFISH data involves multiple specialized steps to transform raw images into quantitative spatial data:
Quality Control Considerations
Rigorous quality control is essential for generating reliable MERFISH data from FFPE tissues. Key QC metrics include:
- RNA integrity assessment: While MERFISH is more tolerant of degraded RNA than some other methods, samples with very low RNA quality (RIN < 4) may yield poor results [41]
- Negative control evaluation: Monitoring background signals using negative control probes (where available) helps identify non-specific binding [40]
- Cell segmentation validation: Especially important in FFPE tissues where morphology may be compromised, requiring potential manual correction or algorithm adjustment
- Correlation with orthogonal methods: When possible, validation against bulk RNA-seq or scRNA-seq data from similar samples provides important technical validation [41]
Applications in Translational Research
MERFISH has demonstrated particular utility in cancer research and immunology applications where understanding spatial relationships is crucial. The technology has been successfully applied to profile the tumor microenvironment, characterize immune cell interactions, and identify novel cellular neighborhoods in diseased tissues [36] [40]. The ability to work with FFPE tissues makes MERFISH especially valuable for retrospective studies utilizing valuable clinical cohorts with long-term outcome data.
Recent applications have included discovering "a striking and unanticipated diversity of activated fibroblast states during gut inflammation" [38], highlighting MERFISH's potential to reveal biological insights that might be missed with other technologies. In oncology, MERFISH has been used to characterize spatial patterns of immune cell infiltration in lung adenocarcinoma and pleural mesothelioma, providing insights into the differential responses of "immune hot" and "immune cold" tumors to therapy [40].
The continued refinement of MERFISH protocols, particularly for FFPE tissues, ensures that this technology will remain at the forefront of spatial biology, enabling researchers to address increasingly complex biological questions with greater precision and confidence.
Solving Common FFPE-FISH Problems: A Troubleshooting Manual
Addressing High Background and Non-Specific Signal
In fluorescent in situ hybridization (FISH) research utilizing formalin-fixed paraffin-embedded (FFPE) tissue, achieving a clear signal-to-noise ratio is paramount for accurate interpretation. High background fluorescence and non-specific probe binding pose significant challenges that can compromise data reliability, particularly in the context of drug development where precise quantification of genetic alterations is crucial. This application note details the primary sources of these issues and provides optimized, validated protocols to mitigate them, ensuring robust and reproducible FISH results in FFPE tissue samples.
Root Causes of High Background in FFPE FISH
The complex nature of FFPE tissue processing introduces several variables that contribute to elevated background and non-specific signaling. Understanding these factors is the first step in effective troubleshooting.
- Inadequate Proteolytic Digestion: Insufficient digestion leaves proteins cross-linked by formalin fixation exposed, leading to non-specific electrostatic binding of fluorescently charged probes to these tissue components [42].
- Fixation Artifacts: Prolonged fixation (exceeding 48 hours) or the use of non-buffered formalin creates excessive protein-nucleic acid cross-links, which can trap probes non-specifically and hinder their access to the target DNA [42].
- Suboptimal Hybridization Stringency: Hybridization or post-hybridization wash conditions (temperature, pH, and salt concentration) that are not stringent enough fail to remove probes that are partially bound to off-target sequences with low homology [43].
- Probe-Related Issues: Degraded probes, inappropriate probe concentration, or autofluorescence of the tissue itself (e.g., from red blood cells or collagen) can significantly increase background noise [43].
Optimized Protocol for Background Reduction
The following protocol has been optimized and standardized to minimize non-specific signal while preserving strong, specific hybridization.
Materials and Reagents
| Category | Item | Function/Note |
|---|---|---|
| Tissue Pretreatment | Paraffin Pretreatment Reagent Kit (Vysis/Abbott) or DAKO Histology FISH Accessory Kit | Removal of paraffin and preparation of tissue for probing. The DAKO kit was found to be more time-efficient and produced more uniform, interpretable signals [42]. |
| Proteolytic Enzyme | Pepsin Solution (e.g., 0.1-0.5 mg/mL) | Digests cross-linked proteins to unmask target nucleic acids. Concentration and time must be titrated for each tissue type [42]. |
| Probe System | PathVysion HER-2 DNA Probe Kit | Example of a dual-color probe system (SpectrumOrange for HER-2, SpectrumGreen for CEP17) for gene amplification studies [42]. |
| Detection | Fluorescence Microscope with DAPI, SpectrumOrange, SpectrumGreen filters | Essential for visualizing specific signals against the blue nuclear counterstain [42] [43]. |
Step-by-Step Procedure
Slide Preparation and Baking:
- Cut 4-µm thick sections from the FFPE block and mount on positively charged adhesive slides.
- Bake slides at 56°C overnight or at 70°C for 35 minutes to ensure tissue adhesion [42].
Deparaffinization and Dehydration:
- Follow the manufacturer's instructions for the chosen pretreatment kit. A typical series involves xylene (or substitute) and ethanol washes to completely remove paraffin.
Proteolytic Digestion (Critical Optimization Step):
- Prepare a pepsin solution at an appropriate concentration (e.g., 0.1-0.5 mg/mL in HCl pH 2.0).
- Incubate slides at 37°C. The digestion time must be empirically determined based on fixation duration.
- Titration Guide: Tissues fixed for ~24 hours may require 10-20 minutes, while those fixed for >48 hours often need 20-30 minutes [42]. Over-digestion leads to loss of morphology, while under-digestion causes high background.
Probe Denaturation and Hybridization:
Post-Hybridization Washes (Stringency Control):
- Remove coverslips and wash slides in a pre-warmed stringent wash solution (e.g., 2x Saline-Sodium Citrate (SSC)/0.3% NP-40 at 73°C) for 2-5 minutes.
- Follow with a room temperature wash in the same solution [42].
Counterstaining and Mounting:
Quantitative Data from Protocol Standardization
The impact of key variables on hybridization quality was quantified during protocol optimization [42].
Table 1: Impact of Pre-Analytical Factors on FISH Hybridization Quality
| Factor | Condition | Effect on Background & Signal | Recommendation |
|---|---|---|---|
| Fixation Time | > 48 hours | Increased autofluorescence and cross-linking, leading to higher background [42]. | Standardize fixation in 10% buffered formalin for 24-48 hours [42]. |
| Proteolytic Digestion | Insufficient (Under-digestion) | High background due to inadequate unmasking of target DNA [42]. | Titrate enzyme concentration and time for each tissue type and fixation condition [42]. |
| Excessive (Over-digestion) | Weak specific signal, poor tissue morphology [42]. | ||
| Post-Hybridization Wash Stringency | Low Temperature/High Salt | High background from non-specific probe retention [42]. | Use stringent washes (e.g., 73°C, low salt buffer) to remove loosely bound probes [42]. |
Table 2: Comparison of Two Standardized FISH Pretreatment Protocols
| Parameter | Protocol 1 (Vysis/Abbott Kit) | Protocol 2 (DAKO Kit) |
|---|---|---|
| Total Hybridization Success Rate | 97.5% (39/40 samples) | 100% (30/30 samples) |
| Signal Uniformity & Ease of Interpretation | Good | Superior, more uniform signals [42] |
| Time Efficiency | Standard | More time-efficient [42] |
| General Recommendation | Reliable for standard sample quality | Preferred for efficiency and easier interpretation, especially with suboptimal samples [42] |
Workflow for Systematic Troubleshooting
The following workflow provides a logical pathway for diagnosing and resolving background and non-specific signal issues.
Validation and Quality Control
Rigorous validation is essential to confirm that signal specificity is maintained after troubleshooting.
- Internal Controls: Always score signals in normal ductal epithelium, stromal cells, or lymphocytes present on the same slide. These cells should show the expected disomy (two signals per nucleus), validating the assay performance [42].
- Analytical Specificity: Ensure that control samples with known genetic status (positive and negative for the alteration) yield the expected results after protocol adjustments. The overall concordance between FISH and IHC for HER-2 testing, for example, should be high (>84%), with the greatest discordance occurring in IHC 2+ cases [42].
- Signal Enumeration: Count signals only in non-overlapping nuclei with intact borders. Analyze at least 20-60 cells, depending on the specific clinical or research application guidelines [42] [43].
The Scientist's Toolkit: Research Reagent Solutions
| Item | Function | Application Note |
|---|---|---|
| PathVysion HER-2 DNA Probe Kit | Dual-color probe set to detect HER-2 amplification relative to chromosome 17 centromere (CEP17) [42]. | Gold-standard for HER-2 testing; superior to IHC in selecting patients for trastuzumab therapy [42]. |
| DAKO Histology FISH Accessory Kit | Paraffin pretreatment kit for deparaffinization, rehydration, and tissue conditioning [42]. | More time-efficient and produces more uniform, easily interpretable signals compared to other kits [42]. |
| Pepsin | Proteolytic enzyme for digesting cross-linked proteins to unmask target DNA [42]. | Requires careful titration; concentration and incubation time are critical to balance background reduction with tissue integrity [42]. |
| DAPI (4',6-diamidino-2-phenylindole) | Fluorescent counterstain that binds AT-rich regions of DNA [42] [43]. | Allows visualization of nuclear morphology for accurate cell identification and signal localization [42]. |
Diagnosing Weak or Absent FISH Signals
Weak or absent fluorescence in situ hybridization (FISH) signals in formalin-fixed paraffin-embedded (FFPE) tissue research present a significant challenge in molecular pathology, potentially compromising diagnostic accuracy and research validity. This issue is particularly relevant in the era of precision medicine, where FISH serves as a critical tool for validating genetic aberrations identified by next-generation sequencing (NGS) [25]. Effective troubleshooting requires a systematic approach addressing pre-analytical, procedural, and analytical variables. This protocol provides a comprehensive framework for diagnosing and resolving signal deficiencies, integrating both established methodologies and recent technical advancements to ensure reliable, reproducible FISH results in FFPE tissues.
Table 1: Primary Causes and Corrective Actions for Weak FISH Signals
| Cause Category | Specific Issue | Diagnostic Indicators | Corrective Actions |
|---|---|---|---|
| Pre-analytical Variables | Prolonged formalin fixation >72 hours [44] | Poor hybridization efficiency across multiple probes/protocols | Ensure fixation in 10% neutral-buffered formalin for 6-72 hours [44] |
| Inadequate digestion [25] | High background, weak signals, intact nuclear membranes | Optimize pepsin concentration and incubation time; titrate for each tissue type [25] | |
| Sample decalcification [44] | Complete signal loss | Use non-decalcified bone marrow or core for analysis [44] | |
| Procedural Issues | Suboptimal denaturation [25] | Faint or absent signals in specific regions | Optimize denaturation temperature and duration [25] |
| Inadequate post-hybridization washes [25] | High background fluorescence obscuring signals | Optimize stringency of post-hybridization wash buffers and temperature [25] | |
| Insufficient probe penetration | Weak signals in thick tissue sections | Use 4-5 micron thick sections; optimize pretreatment to expose targets [45] [44] | |
| Reagent & Probe Issues | Probe degradation | Weak signals despite optimized protocol | Validate probe performance on control tissue; ensure proper storage conditions |
| Fluorophore quenching | Signals fade rapidly during visualization | Use antifade mounting medium; minimize light exposure during handling |
Experimental Protocols for Signal Optimization
Basic Protocol 1: Systematic Optimization of FISH on FFPE Tissue
This protocol outlines a step-by-step approach to optimize key variables in the FISH procedure for FFPE tissues, based on established methodologies [25].
Materials
- FFPE tissue sections (4-5 µm thick) mounted on slides
- Xylene and ethanol series (100%, 85%, 70%) for deparaffinization
- Pretreatment solution (e.g., 1M sodium thiocyanate or citrate buffer)
- Pepsin solution (e.g., 0.1-1 mg/mL in 0.1N HCl)
- In-house or commercial FISH probes
- Denaturation/hybridization system
- Post-hybridization wash buffers (e.g., 2x SSC/0.1% NP-40, 0.4x SSC/0.3% NP-40)
- DAPI counterstain
- Antifade mounting medium
Method
- Deparaffinization and Hydration: Immerse slides in xylene (2 x 10 minutes) followed by ethanol series (100%, 85%, 70%, 2 minutes each) and finally rinse in deionized water [25].
- Pretreatment: Incubate slides in a pretreatment solution (e.g., 1M sodium thiocyanate) at 80°C for 10-30 minutes to expose target DNA. Rinse in deionized water [45].
- Digestion: Treat slides with pepsin solution (concentration and time require optimization; start with 0.5 mg/mL for 20 minutes at 37°C). Rinse thoroughly in deionized water and dehydrate through an ethanol series (70%, 85%, 100%) [25].
- Probe Denaturation and Hybridization: Apply probe to the target area, cover with a coverslip, and seal. Co-denature probe and specimen DNA at 80-85°C for 5-10 minutes, then hybridize at 37-45°C overnight in a humidified chamber [25].
- Post-Hybridization Washes: The following day, remove coverslips and perform stringency washes. Common conditions include:
- Counterstaining and Mounting: Apply DAPI counterstain (e.g., 1 µg/mL for 5 minutes), rinse, air-dry, and mount with antifade mounting medium.
Support Protocol 1: Validation Using Control Tissues
Using control tissues is critical for protocol optimization and troubleshooting [25].
- Selection: Use control tissues known to be positive and negative for the genetic aberration targeted by the FISH probe.
- Application: Run control slides in parallel with test samples during every optimization experiment. Clear, distinct signals in positive controls and their absence in negative controls validate the protocol.
- Troubleshooting: If signals are weak in a known positive control, the issue lies with the procedure, not the test sample. Systematically adjust one variable at a time (e.g., pepsin time, denaturation temperature) to resolve.
Advanced Protocol: "One-Fits-All" Pretreatment for Diverse Sample Types
An optimized, standardized pretreatment protocol can facilitate FISH on all types of patient material simultaneously with good quality results [45]. This robust method aims to expose target genes and allow probe penetration without significantly altering tissue integrity or morphology.
The Scientist's Toolkit: Research Reagent Solutions
Table 2: Essential Reagents for FISH Troubleshooting
| Reagent Category | Specific Examples | Function in Protocol | Optimization Tips |
|---|---|---|---|
| Digestion Enzymes | Pepsin [25] | Digests proteins to unmask target DNA and improve probe access. | Concentration (0.1-1 mg/mL) and incubation time are critical; over-digestion destroys morphology, under-digestion causes weak signals [25]. |
| Denaturants & Buffers | Formamide [38], SSC (Saline-Sodium Citrate) buffer [25] | Controls stringency of hybridization and washes; formamide denatures DNA. | Concentration and temperature must be balanced for specific probe; higher stringency (e.g., more formamide, higher temp) reduces background but can weaken true signals [38]. |
| Probe Systems | Break-apart probes (e.g., for ALK, BCL2) [46] [45], Dual-fusion probes (e.g., for IGH/CCND1) [46] | Target-specific DNA sequences labeled with fluorophores. | Validate on control tissue; ensure correct storage to prevent fluorophore quenching. Commercial probes from Cytocell, Vysis, ZytoLight are commonly used [45]. |
| Signal Enhancement | Antifade mounting medium (e.g., Citifluor) [47] | Reduces photobleaching, preserving signal intensity during microscopy. | Essential for all FISH procedures. Use in all final mounting steps [47]. |
Quantitative Performance Assessment
Establishing and monitoring quantitative performance metrics is essential for validating troubleshooting efforts. A robust FISH protocol should yield a high percentage of interpretable results.
Table 3: Benchmark Success Rates for Optimized FISH
| Target Gene (Chromosome) | Probe Type | Manufacturer | Reported Interpretable Results | Common Cut-off Criteria |
|---|---|---|---|---|
| HER2 (17q12) | Amplification | Cytocell | 99% (149/150 slides) [45] | Signal ratio threshold* |
| BCL2 (18q21) | Break-apart | Cytocell | 96% (300/312 slides) [45] | >10% cells with split signals [45] |
| cMYC (8q24) | Break-apart | Cytocell | 97% (336/346 slides) [45] | >10% cells with split signals [45] |
| CCND1 (11q13) | Break-apart | Cytocell | 95% (40/42 slides) [45] | >10% cells with split signals [45] |
| Overall Performance | Various | Multiple | 93% (3881 samples) [45] | N/A |
*Pre-defined amplification ratio based on control cells.
Analysis and Data Interpretation
Accurate diagnosis of weak signals extends beyond protocol optimization to include rigorous analytical methods. Automated image analysis using clustering algorithms can aid in objective signal classification. Fuzzy c-means clustering (FCM) has been successfully applied to classify cells as target (positive) or non-target (negative) based on fluorescence intensity data, providing results comparable to manual counting and helping to standardize interpretation, especially in samples with variable background [47]. Furthermore, all FISH analyses must be performed on tissues that have undergone concurrent evaluation by a qualified pathologist to ensure the test is applied to appropriate tumor cells, as the presence and quantity of tumor cells directly impact the validity of the result [48].
Diagnosing weak or absent FISH signals requires a methodical approach that integrates careful consideration of pre-analytical factors, systematic optimization of procedural steps, and rigorous analytical validation. By adhering to the detailed protocols and troubleshooting guidelines outlined here, researchers and diagnosticians can significantly improve FISH signal quality, thereby enhancing the reliability of genetic analyses in FFPE tissues. This is paramount for advancing research and ensuring accurate patient diagnosis and management in the context of precision medicine.
Optimizing Enzyme Digestion to Preserve Tissue Morphology
Within the broader scope of fluorescent in situ hybridization (FISH) for formalin-fixed paraffin-embedded (FFPE) tissue research, achieving optimal enzymatic digestion represents a critical methodological challenge. This process must balance sufficient protein digestion to permit probe penetration with the preservation of tissue architecture necessary for morphological interpretation [28] [49]. The cross-linking nature of formalin fixation creates a network of methylene bridges that masks nucleic acid targets and hinders probe access, making enzymatic pretreatment an essential step for successful FISH [50] [51]. However, inconsistent or excessive digestion remains a significant source of technical failure, potentially compromising the reliability of results in both research and clinical diagnostics [49] [52]. This application note addresses these challenges by providing detailed protocols and quantitative guidelines for optimizing enzyme digestion to maximize FISH success rates while preserving tissue morphology.
Critical Factors in Enzyme Digestion Optimization
Pre-Digestion Variables Influencing Outcomes
Several pre-analytical factors significantly impact the required enzymatic digestion conditions and subsequent FISH quality. Variations in the time lapse between tissue removal and fixation, formalin fixation duration, and the specific enzymatic pretreatment conditions constitute important variables in the hybridization process [50]. Extended formalin fixation beyond the recommended 18-24 hours can cause major difficulties in FFPE FISH, including reduced probe penetration, high levels of tissue auto-fluorescence, and low hybridization efficiency [52]. Specimens fixed for prolonged periods require extended pepsin digestion times to counteract these effects. Tissue preservation should exclusively use 10% Neutral Buffered Formalin (NBF), which should be replaced after approximately three months of use to maintain efficacy [52].
Morphological Indicators of Optimal Digestion
A groundbreaking method for real-time evaluation of pepsin digestion enables researchers to visually assess digestion adequacy prior to FISH hybridization [49]. This approach identifies distinct morphological changes within the nucleus and perinuclear space detectable by light microscopy. The presence of intact and clear bare nuclei, surrounded by a translucent perinuclear space, serves as a reliable indicator of adequate digestion [49]. Implementing this assessment protocol across 400 breast cancer and lymphoma tissue samples achieved a remarkable FISH success rate of 99.5%, significantly higher than conventional methods without real-time monitoring [49]. In all successful cases, these morphological signs of adequate digestion correlated perfectly with easily interpretable FISH signals.
Table 1: Morphological Indicators of Digestion Quality
| Digestion State | Nuclear Appearance | Perinuclear Space | FISH Signal Quality |
|---|---|---|---|
| Under-digested | Intact cellular membranes | Minimal space | Weak or absent signals |
| Optimal | Clear, bare nuclei | Translucent space | Strong, easily interpretable signals |
| Over-digested | Disrupted nuclear boundaries | Excessive clearing | Poor morphology with diffuse signals |
Experimental Protocols
Real-Time Digestion Assessment Method
The following protocol enables real-time morphological evaluation of enzymatic digestion, allowing termination of enzyme activity at the optimal timepoint [49]:
Materials Required:
- FFPE tissue sections (4-6μm thickness)
- Pepsin solution (e.g., 0.5-1.0% in 0.1N HCl)
- 1x Phosphate Buffered Saline (PBS)
- Light microscope
Procedure:
- Deparaffinize and rehydrate FFPE tissue sections using standard protocols.
- Apply pepsin solution liberally to completely cover the tissue section, ensuring edges remain covered as evaporation may cause enzyme recession [52].
- Incubate at 37°C while monitoring morphological changes at 3-5 minute intervals.
- Terminate digestion immediately when clear bare nuclei surrounded by translucent perinuclear spaces become evident (typically 10-30 minutes depending on tissue type and fixation conditions) [49].
- Rinse slides in 1x PBS to stop enzymatic activity.
- Proceed with standard FISH hybridization protocols.
Systematic Digestion Optimization Protocol
For laboratories establishing FISH protocols for new tissue types or optimizing existing methods, this systematic approach determines ideal digestion parameters:
Materials Required:
- Consecutive FFPE sections from the same block
- Pepsin stock solution (e.g., 5% in 0.1N HCl)
- 0.1N HCl for dilution
- Stop solution (1x PBS or 0.1M Glycine in PBS)
Procedure:
- Prepare a dilution series of pepsin (e.g., 0.1%, 0.25%, 0.5%, 1.0%) in 0.1N HCl.
- Apply each concentration to consecutive tissue sections with constant incubation time (e.g., 15 minutes at 37°C).
- Include a negative control section without pepsin treatment.
- Terminate all reactions simultaneously using stop solution.
- Process all sections through identical FISH procedures.
- Evaluate using both morphological criteria and FISH signal quality.
- Select the pepsin concentration providing optimal signal intensity with preserved morphology.
Technical Specifications and Data Presentation
Enzyme Digestion Parameters for Different Tissue Types
Optimal enzymatic digestion conditions vary significantly based on tissue origin, fixation history, and section thickness. The following table summarizes recommended parameters based on empirical studies:
Table 2: Optimized Enzyme Digestion Conditions for Various FFPE Tissues
| Tissue Type | Section Thickness | Pepsin Concentration | Incubation Time | Temperature | Success Rate |
|---|---|---|---|---|---|
| Breast Carcinoma | 4-6μm | 0.5% in 0.1N HCl | 15-20 minutes | 37°C | 99.5% [49] |
| Lymphoma | 4-6μm | 0.5% in 0.1N HCl | 10-15 minutes | 37°C | 99.5% [49] |
| General Solid Tumors | 4-6μm | 0.5-1.0% in 0.1N HCl | 10-30 minutes | 37°C | >95% [52] |
Impact of Section Thickness on Digestion Efficiency
Tissue section thickness critically influences both digestion efficiency and subsequent FISH interpretation. The following table compares the effects of different section thicknesses:
Table 3: Effect of Section Thickness on FISH Performance
| Section Thickness | Digestion Efficiency | Morphology Preservation | FISH Interpretation | Recommendation |
|---|---|---|---|---|
| <4μm | Rapid but potentially excessive | Compromised (truncated nuclei) | Signal truncation possible | Not recommended |
| 4-6μm | Balanced and controllable | Excellent | Optimal for signal enumeration | Ideal range |
| >6μm | Inconsistent penetration | Good but cell overlapping | Multiple focal planes needed | Suboptimal |
Visualization of Workflows
Enzyme Digestion Optimization Pathway
The following diagram illustrates the decision-making pathway for optimizing enzyme digestion conditions in FFPE FISH:
Tissue Digestion Morphology Assessment
This workflow details the morphological assessment process for determining optimal digestion endpoints:
The Scientist's Toolkit: Research Reagent Solutions
Table 4: Essential Reagents for Enzyme Digestion in FFPE FISH
| Reagent | Function | Application Notes | Storage Conditions |
|---|---|---|---|
| Pepsin | Proteolytic enzyme that digests proteins masking nucleic acid targets | Use 0.5-1.0% in 0.1N HCl; concentration and time vary by tissue type and fixation | 2-8°C; aliquot to preserve activity [52] |
| 0.1N HCl | Creates optimal acidic environment for pepsin activity | Prepare fresh weekly; pH critical for enzyme function | Room temperature |
| 10% Neutral Buffered Formalin (NBF) | Tissue fixative that preserves morphology while allowing molecular analysis | Replace after 3 months; fixation time ideally 18-24 hours [52] | Room temperature |
| Phosphate Buffered Saline (PBS) | Termination solution that stops enzymatic activity | Use 1x concentration; may include 0.1M glycine for enhanced inhibition | Room temperature |
| FFPE Pretreatment Kit (e.g., CytoCell) | Standardized system for tissue preparation before FISH | Includes optimized buffers and enzymes for consistent results | As specified by manufacturer [52] |
Optimizing enzyme digestion for FFPE tissues represents a critical step in balancing the competing demands of nucleic acid accessibility and morphological preservation in FISH experiments. The implementation of real-time morphological assessment protocols enables researchers to achieve exceptional success rates exceeding 99% by providing visual cues for terminating digestion at the optimal point [49]. Attention to pre-analytical variables including fixation conditions, section thickness, and tissue-specific requirements further enhances reproducibility and reliability. As FFPE tissues continue to serve as invaluable resources in both research and clinical diagnostics, these optimized protocols for enzyme digestion ensure maximum utilization of these precious biospecimens while maintaining the architectural context essential for accurate morphological interpretation.
Mitigating Signal Fading and Probe Degradation
In the field of fluorescent in situ hybridization (FISH) research, particularly with formalin-fixed paraffin-embedded (FFPE) tissues, signal fading and probe degradation represent significant technical challenges that can compromise experimental reliability and reproducibility. FFPE tissues present unique difficulties for FISH applications due to variable fixation quality, cross-linking-induced epitope masking, nucleic acid fragmentation, and autofluorescence [28]. These factors contribute to the gradual loss of signal intensity over time and between experiments, creating substantial barriers for both clinical diagnostics and research applications. The preservation of probe integrity and signal stability is especially critical in FFPE-based studies where archival samples may represent irreplaceable clinical resources with associated long-term outcome data. This application note addresses these challenges by presenting evidence-based strategies, optimized protocols, and practical solutions for mitigating signal fading and probe degradation in FFPE-FISH workflows, framed within the broader context of advancing spatial biology and precision medicine initiatives.
Experimental Evidence on Probe Stability and Signal Preservation
Long-Term Probe Stability Under Proper Storage Conditions
A comprehensive study investigating the longevity of hapten-labeled DNA probes provides compelling evidence challenging conventional expiration timelines. Researchers evaluated 581 FISH probes (506 self-labeled homemade and 75 commercial probes) that had been stored for 1-30 years before reuse. All probes had been stored at -20°C in the dark and were successfully used in routine diagnostics, producing bright, analyzable signals regardless of their age [53] [54].
Table 1: Long-Term Performance of FISH Probes Under Proper Storage Conditions
| Probe Characteristic | Performance Finding | Temporal Pattern | Implications for FFPE Research |
|---|---|---|---|
| Overall functionality | 100% success rate (581/581 probes) | Stable for 1-30 years | Enables utilization of archival probe sets for longitudinal FFPE studies |
| Self-labeled homemade probes | Slight to no differences in exposure times | Consistent performance over decades | Supports in-house probe production for specialized FFPE applications |
| Commercial SpectrumOrange probes | Shorter exposure times maintained over years | Stable signal intensity for 20+ years | Reliability for standardized FFPE cancer diagnostics |
| SpectrumAqua/diethylaminocoumarin probes | Bright labeling for first 3 years, then gradual fading | Time-dependent signal reduction | Not recommended for long-term archived FFPE study designs |
The implications of these findings are particularly significant for FFPE tissue research, where experimental continuity across samples collected over extended periods is essential. The demonstrated stability of properly stored probes suggests that approved FISH probes can be used until exhausted rather than discarded based on arbitrary expiration dates, providing substantial cost savings and consistency for research programs working with valuable FFPE sample repositories [53] [54].
Signal Fading Patterns by Fluorophore Type
The same long-term stability study revealed important fluorophore-specific fading patterns that directly inform probe selection strategies for FFPE applications. While most haptens and fluorochromes demonstrated exceptional stability, DNA probes labeled with SpectrumAqua/diethylaminocoumarin showed a distinct pattern of bright labeling for approximately three years followed by measurable fading [53] [54]. This fluorophore-specific degradation profile underscores the importance of matching probe selection to experimental timelines, particularly for FFPE tissue research that may involve repeated analyses over extended periods.
Technical Challenges in FFPE-FISH and Mitigation Strategies
Primary Technical Challenges in FFPE Tissues
FFPE tissues present a constellation of technical challenges that exacerbate signal fading and probe degradation issues. A scoping review dedicated to FISH challenges in FFPE tissues identified several critical factors that compromise signal integrity [28]:
Table 2: Key Technical Challenges in FFPE-FISH and Their Impact on Signal Integrity
| Challenge Category | Specific Issues | Impact on Signal Fading & Probe Degradation |
|---|---|---|
| Pre-analytical variables | Inadequate fixation, contamination, block and slide age | Increased background fluorescence, reduced probe binding efficiency |
| Sample processing limitations | Nucleic acid fragmentation, cross-linking-induced epitope masking | Reduced target accessibility, accelerated signal degradation |
| Technical execution problems | Inadequate pretreatment, suboptimal hybridization conditions | Non-specific binding, increased enzymatic degradation (if applicable) |
| Signal detection issues | Fluorophore quenching, photobleaching during imaging | Premature signal fading before documentation |
The age of FFPE blocks and prepared slides represents a particularly underappreciated factor in signal degradation. Older blocks may exhibit increased autofluorescence while stored slides can experience progressive loss of target accessibility, both contributing to diminished signal-to-noise ratios over time [28].
Strategic Solutions for Signal Preservation
The literature supports several evidence-based strategies to counteract the specific challenges of FFPE-FISH:
Optimized Pretreatment Protocols: Tailored enzyme digestion and heat-induced epitope retrieval methods can significantly improve target accessibility while reducing non-specific probe binding [28].
Blockage Monitoring and Quality Control: Implementation of rigorous quality control measures for FFPE block storage conditions and regular monitoring of sample integrity helps identify degradation before valuable probes are utilized [28].
Careful Probe Selection: Matching probe characteristics to experimental needs, including prioritizing stable fluorophores for long-term studies and considering advanced signal amplification approaches for compromised samples [28].
Emerging Technological Solutions: Incorporation of artificial intelligence and digital pathology approaches for signal quantification can help standardize interpretation despite variations in signal intensity [28].
Advanced Signal Amplification Technologies
TDDN-FISH: Nanostructure-Enhanced Signal Amplification
The recently developed Tetrahedral DNA Dendritic Nanostructure–Enhanced FISH (TDDN-FISH) represents a breakthrough approach for simultaneous signal amplification and fading mitigation. This method employs a precisely engineered layer-by-layer self-assembly strategy to create hierarchical DNA nanostructures that provide exponential signal amplification capacity [55].
Key advantages of TDDN-FISH for FFPE applications include:
- Rapid processing: Each imaging round requires approximately 1 hour post-hybridization compared to ≥8 hours for HCR-FISH amplification
- Enhanced sensitivity: Significantly higher signal intensity than both smFISH and HCR-FISH, enabling detection of short RNA transcripts
- Enzyme-free structure: Eliminates batch variability caused by fluctuations in enzymatic activity, ensuring robustness and reproducibility
- Minimal probe requirements: Effective visualization with only 3 primary probes compared to 48 for smFISH [55]
The structural stability of these DNA nanostructures makes them particularly suitable for FFPE applications where preservation of signal integrity across extended hybridization and imaging procedures is challenging.
SABER-FISH: Signal Amplification by Exchange Reaction
The Signal Amplification By Exchange Reaction (SABER) method provides an alternative amplification approach that enhances signal intensity while offering exceptional multiplexing capabilities. This technique utilizes Primer Exchange Reactions (PERs) to generate concatemeric sequences that serve as scaffolds for multiple fluorophore-labeled 'imager' strands [56].
Key features of SABER-FISH for FFPE research:
- Multiplexing capability: Orthogonal concatemer sequences enable simultaneous detection of multiple targets
- Signal customization: Adjustable concatemer length allows tuning of signal intensity based on target abundance
- Compatibility with exchange imaging: DNA-Exchange Imaging (DEI) enables sequential probing without sample degradation
- Cost-effectiveness: Reduced probe requirements and compatibility with less expensive microscopy setups [56]
The exchange capability of SABER-FISH is particularly valuable for FFPE tissue research as it allows multiple rounds of imaging without signal degradation or sample damage, maximizing the information obtained from precious archival samples.
Optimized Experimental Protocols
Standardized FFPE-FISH Protocol with Signal Preservation Modifications
Materials Required:
- FFPE tissue sections (4-5 μm thickness) mounted on charged slides
- Appropriate FISH probes (validated for FFPE applications)
- Hybridization buffer
- Formamide (molecular biology grade)
- Ethanol series (70%, 85%, 100%)
- Wash buffers (2× SSC, 0.1× SSC)
- DAPI counterstain
- Fluorescence-compatible mounting medium
- Coverslips
- Humidified hybridization chamber
- Hybridization oven or thermocycler with slide capability
- Fluorescence microscope with appropriate filter sets
Procedure:
Slide Pretreatment:
- Bake slides at 60°C for 1 hour to improve tissue adhesion
- Deparaffinize in xylene (3 × 10 minutes)
- Rehydrate through ethanol series (100%, 85%, 70%, 2 minutes each)
- Rinse in deionized water
Tissue Pretreatment:
- Incubate with pretreatment solution (acid or base depending on tissue type) at 95-100°C for 10-30 minutes
- Rinse with deionized water
- Digest with proteinase K (concentration and duration optimized for tissue type and fixation) at 37°C
- Rinse with deionized water and dehydrate through ethanol series (70%, 85%, 100%)
Probe Hybridization:
- Apply probe mixture to tissue section (10-15 μL depending on section size)
- Coverslip and seal with rubber cement
- Co-denature slides and probes at 82°C for 10 minutes
- Hybridize at 37-42°C overnight in humidified chamber
Post-Hybridization Washes:
- Remove coverslips carefully
- Wash with 0.1× SSC at 65°C for 10 minutes (stringency wash)
- Rinse with 2× SSC at room temperature for 5 minutes
- Counterstain with DAPI (125 ng/mL in 2× SSC) for 10 minutes
- Rinse with 2× SSC and air dry in darkness
Signal Preservation and Mounting:
- Apply antifade mounting medium
- Coverslip and seal with nail polish
- Store slides at 4°C in darkness until imaging
Critical Signal Preservation Steps:
- Limit light exposure throughout procedure, especially after probe application
- Use fresh, high-quality antifade mounting medium
- Optimize proteinase K concentration to balance target accessibility and tissue morphology
- Include appropriate controls for autofluorescence and probe performance [28]
Advanced Protocol: TDDN-FISH for Enhanced Signal Stability
Additional Materials:
- TDDN monomers (T0, T1, T2)
- Fluorophore-labeled oligonucleotides complementary to T2 monomers
- Assembly buffer
Procedure Modifications:
Primary Probe Hybridization:
- Follow standard pretreatment steps
- Hybridize with bifunctional primary probes (containing target-specific sequence and TDDN readout sequence)
- Wash to remove unbound probes
TDDN Assembly:
- Apply T0 monomers in assembly buffer for 30 minutes at room temperature
- Wash gently
- Apply T1 monomers for 30 minutes
- Wash gently
- Apply T2 monomers for 30 minutes
- Wash gently
Fluorophore Binding:
- Apply fluorophore-labeled strands complementary to T2 overhangs
- Incubate for 20 minutes
- Perform final washes
- Mount with antifade medium [55]
Research Reagent Solutions
Table 3: Essential Research Reagents for Mitigating Signal Fading and Probe Degradation
| Reagent Category | Specific Examples | Function in Signal Preservation | Implementation Notes |
|---|---|---|---|
| Stable fluorophores | SpectrumOrange, Texas Red, Cyanine 5 | Maintain brightness over extended storage periods | SpectrumAqua shows time-dependent fading; use for short-term studies only [53] [54] |
| Probe stabilization additives | Dextran sulfate, DNA guardians | Reduce nuclease activity and oxidative damage | Include in hybridization buffer and long-term storage solutions |
| Advanced signal amplification systems | TDDN monomers, SABER concatemers | Provide exponential signal enhancement | Enable detection of low-abundance targets in suboptimal FFPE samples [56] [55] |
| Antifade mounting media | ProLong Diamond, Vectashield with DAPI | Reduce photobleaching during imaging and storage | Test compatibility with fluorophores; some may quench specific wavelengths |
| Nuclease inhibitors | RNAse inhibitors, DNAse inhibitors | Prevent probe and target degradation during hybridization | Critical for RNA-FISH in FFPE tissues |
| Stringency wash solutions | Formamide, saline-sodium citrate buffers | Reduce non-specific binding and background | Optimize concentration for specific FFPE tissue types |
Mitigating signal fading and probe degradation in FFPE-FISH requires a comprehensive approach addressing pre-analytical variables, storage conditions, probe selection, and detection methodologies. The experimental evidence demonstrating long-term probe stability under proper storage conditions provides valuable guidance for maximizing resource utilization in research settings. Meanwhile, emerging technologies like TDDN-FISH and SABER-FISH offer promising avenues for overcoming the inherent sensitivity limitations of conventional FISH in challenging FFPE samples. As spatial transcriptomics continues to advance, integration of these signal preservation strategies with multiplexing approaches and computational analysis tools will further enhance the value of FFPE tissue archives for both basic research and clinical applications. Implementation of the protocols and recommendations outlined in this application note will enable researchers to achieve more reproducible, reliable, and robust FISH results in FFPE tissue studies.
Recent Protocol Optimizations for Improved Performance
Fluorescence in situ hybridization (FISH) applied to formalin-fixed paraffin-embedded (FFPE) tissues remains a cornerstone technique in molecular pathology, enabling the precise localization of DNA sequences within a morphological context. The unique capacity of FISH to identify diagnostic numerical and structural chromosomal abnormalities in interphase cells makes it indispensable for tumor definition according to the World Health Organization classification and for guiding targeted therapies [11]. However, the application of FISH on FFPE tissues presents persistent technical challenges, including inadequate fixation, variable sample age, and suboptimal pretreatment, which can compromise hybridization efficiency and signal quality [57] [28]. Recent systematic benchmarking and protocol refinements have directly addressed these pre-analytical and analytical variables, leading to significant enhancements in performance, reproducibility, and integration into high-throughput clinical and research workflows. This application note synthesizes the latest advancements, providing detailed methodologies and quantitative performance data to guide researchers and drug development professionals in optimizing their FFPE-FISH assays.
Performance Benchmarking of Recent Optimizations
Recent studies have systematically evaluated factors influencing FFPE-FISH performance, from basic protocol steps to advanced imaging spatial transcriptomics (iST) platforms. The quantitative outcomes of these optimizations are summarized in Table 1.
Table 1: Summary of Recent Optimization Performance Data
| Optimization Area | Specific Method/Platform | Key Performance Outcome | Quantitative Result / Threshold |
|---|---|---|---|
| Standardized Pretreatment | Citric acid buffer & proteinase K digestion [12] | Diagnostic success rate across 3,881 patient samples | 93% of samples yielded good quality, interpretable results |
| Automated Tissue Processing | VP2000 processor with CytoCell probes [58] | Probe signal intensity (Quality Control Score) | Average score of 4.8 out of 5 (Bright, specific signals) |
| Background interference (Quality Control Score) | Average score of 1.3 out of 5 (Minimal/No background) | ||
| Result concordance with reference standards | 100% concordance for HER2, ALK, and ROS1 | ||
| Imaging Spatial Transcriptomics (iST) | 10X Xenium (FFPE-compatible) [37] | Transcript capture sensitivity | Consistently higher transcript counts per gene |
| Nanostring CosMx (FFPE-compatible) [37] | Transcript capture sensitivity | High transcript counts, concordant with scRNA-seq | |
| Vizgen MERSCOPE (FFPE-compatible) [37] | Data quality recommendation | Requires DV200 > 60% for optimal performance | |
| Tissue Preservation (RNA-FISH) | BE70 (Ethanol-based) fixation [59] | RNA integrity preservation | Comparable quality from 24 hours to 6 months of fixation |
The data in Table 1 underscores the impact of lean, standardized workflows. The one-fits-all pretreatment protocol demonstrated remarkable robustness across 38 different FISH probes from three commercial manufacturers (Cytocell, Vysis, and ZytoLight) [12]. Similarly, automation eliminates manual variability, with one study showing that implementing the VP2000 processor with optimized reagents and CytoCell probes produced consistently high signal intensity (QC score of 4.8/5) and minimal background (QC score of 1.3/5) across HER2, ALK, and ROS1 tests on breast, gastric, and lung cell lines without requiring further protocol optimization [58].
Detailed Experimental Protocols
Optimized One-Fits-All Pretreatment Protocol for FFPE, Fresh Frozen, and Cytological Slides
This robust, in-house developed protocol is designed to be lean, cost-effective, and applicable to all tissue types and commercial probes simultaneously, achieving a 93% diagnostic success rate in a cohort of 3,881 patient samples [12].
Materials:
- Tissue Sections: 4-5 µm thick FFPE, fresh frozen, or cytological sections on positively charged slides.
- Deparaffinization Agents: Xylenes and Ethanol (100%, 96%, 70%).
- Pretreatment Solution: 1 mM Citric Acid buffer, pH 6.0.
- Proteolytic Enzyme: Proteinase K solution (e.g., 0.5 mg/mL).
- Formalin Fixative: 4% Phosphate-Buffered Formalin (for FF and cytology samples).
- Deionized Water.
Methodology:
- Baking and Deparaffinization:
- Bake FFPE slides at 70°C for 10-15 minutes.
- Immerse slides in xylenes for 10 minutes, repeated twice.
- Hydrate through a series of ethanols (100%, 96%, 70%) for 2 minutes each.
- Rinse briefly in deionized water.
Additional Fixation (for Fresh Frozen and Cytology Slides ONLY):
- Post-air drying, fix FF or cytology slides in 4% phosphate-buffered formalin for 10 minutes at room temperature. This step significantly increases signal strength and reduces background [12].
- Rinse in deionized water.
Citric Acid Buffer Pretreatment:
- Place slides in a Coplin jar filled with 1 mM Citric Acid buffer (pH 6.0).
- Incubate in a water bath at 95°C for 10 minutes. This heat-induced epitope retrieval is critical for exposing target DNA.
Proteolytic Digestion:
- Rinse slides in deionized water.
- Apply a predetermined optimal concentration of Proteinase K solution (e.g., 0.5 mg/mL) to the tissue section and incubate at 37°C for 10-15 minutes. This step digests proteins that impede probe access.
- Rinse thoroughly in deionized water.
Dehydration and Hybridization:
- Dehydrate slides through an ethanol series (70%, 96%, 100%) for 2 minutes each and air dry.
- Apply the appropriate FISH probe mixture to the tissue section, add a coverslip, and seal with rubber cement.
- Co-denature the probe and target DNA at 75-80°C for 5-10 minutes, followed by hybridization in a humidified chamber at 37°C for 6-48 hours, depending on the probe.
The entire workflow is visualized in the following diagram:
Automated FISH Processing for High-Throughput Workflows
For laboratories facing high throughput, automation offers significant improvements in consistency and quality while reducing hands-on time [58] [60].
Materials:
- Automated Platform: e.g., Abbott VP2000 Processor or NeoPATH Pro.
- Platform-Specific Reagents: Pretreatment reagent, Protease buffer, Protease enzyme.
- Pre-Diluted/Ready-to-Use FISH Probes: e.g., CytoCell HER2, ALK, ROS1 probes.
- Clearing Agent: e.g., Hemo-De.
Methodology:
- Slide Loading: Load baked FFPE slides onto the automated instrument.
- Run Pre-Programmed Protocol: The instrument executes a sequence that typically includes:
- Deparaffinization using a clearing agent.
- Pretreatment with a proprietary buffer.
- Proteolytic Digestion with a standardized protease solution.
- Probe Application and Hybridization: Retrieve the processed slides. Manually apply pre-optimized, ready-to-use probes (e.g., CytoCell BDot probes). Perform hybridization according to the standard laboratory FISH protocol (e.g., co-denaturation at 75°C for 5 minutes, followed by overnight hybridization at 37°C in a humidified chamber) [58].
- Post-Hybridization Wash: Wash slides in a stringency buffer (e.g., 0.4x SSC / 0.3% NP-40 at 75°C) followed by a room temperature wash in 2x SSC / 0.1% NP-40.
- Counterstaining and Mounting: Apply DAPI counterstain and mount with an anti-fade mounting medium. For signal preservation, seal the coverslip with varnish and store slides in the dark at 2-8°C for long-term storage [61].
The Scientist's Toolkit: Essential Research Reagent Solutions
Successful implementation of optimized FFPE-FISH protocols relies on a carefully selected set of reagents and tools. The following table details key solutions for the modern research laboratory.
Table 2: Key Research Reagent Solutions for Optimized FFPE-FISH
| Item / Solution | Function & Rationale | Example Products / Notes |
|---|---|---|
| Commercial FISH Probes | Target-specific DNA probes for detecting amplifications, deletions, and translocations. | CytoCell (e.g., HER2 LPS 001-A, ALK LPS 019-A), Vysis, ZytoLight. Ready-to-use formats save time and reduce error [58] [12]. |
| Automated Staining Systems | Standardize pre-analytical steps (deparaffinization, pretreatment, digestion) to minimize variability. | Abbott VP2000, NeoPATH Pro, BioDot CellWriter S. Critical for high-throughput labs [58] [60]. |
| Tissue Pretreatment Kits | Provide standardized reagents for efficient target retrieval and protein digestion. | CytoCell Tissue Pretreatment Kit (LPS100). Ensures consistent hybridization efficiency [61]. |
| RNase-Free Reagents | Preserve RNA integrity for RNA-FISH and spatial transcriptomics applications. | DEPC-treated water, RNase Away. Contamination can lead to false negatives [59]. |
| Alternative Fixatives | Coagulative fixatives that better preserve nucleic acid integrity compared to formalin. | BE70 (70% ethanol, glycerol, acetic acid). Reduces formalin-induced artifacts and RNA degradation [59]. |
| Spatial Transcriptomics Platforms | Enable highly multiplexed, targeted in situ RNA profiling from FFPE tissues. | 10X Xenium, Nanostring CosMx, Vizgen MERSCOPE. Require predefined gene panels [37]. |
Visualization and Analysis Optimizations
Post-hybridization analysis is critical for accurate data interpretation. Key considerations for the imaging setup directly impact signal quality and fidelity.
- Microscope Filters: Ensure filter cubes are matched to the fluorophores used. A Texas Red/FITC/DAPI filter is required for simultaneous visualization of CytoCell's red, green, and blue dyes. Using a filter specific for TRITC/FITC/DAPI will not provide optimal results [61].
- Filter and Bulb Maintenance: Fluorescent filters degrade over time and typically need replacement every 2-4 years. A damaged filter will manifest as higher background and weaker signals. Mercury vapor bulbs have a finite shelf life (200-3000 hours); older bulbs produce dimmer fluorescence and risk explosion, releasing toxic vapor [61].
- Signal Sealing: After applying DAPI and a coverslip, seal the coverslip with varnish to prevent drying and maintain probe signal strength for up to 2 weeks at room temperature or longer at 2-8°C [61].
The relationship between platform chemistry, signal amplification, and performance in next-generation iST is complex, as illustrated below:
The field of FFPE-FISH has evolved significantly beyond a one-protocol-fits-all approach. Current best practices involve selecting from a suite of optimized methods tailored to specific research goals. The foundational one-fits-all pretreatment protocol offers remarkable robustness for standard DNA FISH across diverse tissue archives. For specialized applications requiring high-throughput consistency, automated processing with pre-optimized probes delivers superior reproducibility. Meanwhile, the emergence of commercial FFPE-compatible iST platforms like Xenium, CosMx, and MERSCOPE opens new frontiers for highly multiplexed gene expression analysis within a morphological context, albeit with specific sample quality requirements [37]. By adopting these recent protocol optimizations—whether for classic single-geline FISH or cutting-edge spatial transcriptomics—researchers and drug developers can maximize the yield and reliability of molecular insights from precious FFPE tissue banks, thereby accelerating biomarker discovery and diagnostic validation.
Ensuring Accuracy: Validation, Automation, and Comparative Methodologies
Establishing Validation Frameworks for Reliable Results
Fluorescence in situ hybridization (FISH) applied to formalin-fixed paraffin-embedded (FFPE) tissue is a powerful tool for diagnosing and monitoring disease in both clinical and research settings, particularly in oncology and hematology. When testing for minimal residual disease or making critical diagnostic calls, precise and accurate normal cut-offs are essential [62]. The establishment of a robust validation framework is therefore paramount, as there is no universal consensus on the correct method for establishing a normal reference range [62]. This protocol outlines a comprehensive, statistically rigorous framework to optimize FISH on FFPE tissue and establish reliable validation parameters, ensuring results are both accurate and reproducible for research and drug development applications.
Variations in pre-analytical factors, such as the time lapse between tissue removal and fixation, duration of fixation, and enzymatic pretreatment, are critical factors that impact hybridization efficiency and must be controlled for during method optimization and validation [57]. The following sections provide detailed methodologies for tissue processing, experimental procedures, statistical determination of reference ranges, and the integration of advanced analytical tools to create a complete validation framework.
Experimental Protocol: FISH on FFPE Tissue
Sample Preparation and Slide Processing
The following protocol is optimized for FFPE tissue sections, though the isolation of nuclei from paraffin-embedded tissue is recommended when the presence of intact nuclei is critical for signal quantitation [57].
Materials & Reagents:
- Glass coverslips (22x22 mm is optimal) [63]
- Carnoy's Fixative: 3:1 methanol/acetic acid for bone marrow cells; for FFPE tissues, standard formalin fixation and paraffin embedding are used [64] [57].
- Saline Sodium Citrate (SSC): 2x and 0.4x concentrations, pH 7.0 [64].
- Ethanol series: 70%, 85%, and 100% for dehydration [64].
- Paraformaldehyde (PFA): 4% (v/v) in 1x PBS for fixation [63].
- Protease Solution: (e.g., Pepsin) for enzymatic pretreatment of FFPE sections to expose nucleic acid targets [57].
- FISH Probes: Specific to the genomic targets of interest (e.g., CytoCell FISH probe kits) [64].
- DAPI Antifade: Counterstain for nuclear visualization (e.g., 0.125μg/ml DAPI) [64].
Procedure:
- Sectioning: Cut 4-5 μm sections from the FFPE tissue block and mount onto glass slides.
- Deparaffinization and Hydration: Bake slides at 60°C for 30-60 minutes, followed by deparaffinization in xylene and rehydration through a graded ethanol series (100%, 85%, 70%) to water.
- Pretreatment (Critical for FFPE): Immerse slides in a pre-warmed citrate-based antigen retrieval solution and heat using a pressure cooker or steamer. Allow to cool, then rinse in distilled water [57].
- Enzymatic Digestion: Treat slides with a protease solution (e.g., 0.1 mg/ml Pepsin in 0.1N HCl) at 37°C for 5-30 minutes. The optimal time and concentration must be determined empirically for each tissue type and fixation condition [57].
- Dehydration: Dehydrate the slides in an ethanol series (70%, 85%, 100%), each for 2 minutes at room temperature, and allow to dry [64].
Hybridization and Post-Hybridization Washes
This section details the denaturation, hybridization, and stringency washes crucial for specific signal detection.
Workflow Diagram: FISH Hybridization Protocol
Materials & Reagents:
- FISH Probe Mix: Labeled probe in hybridization buffer (formamide, dextran sulfate, SSC) [64].
- Rubber Solution Glue or Rubber Cement: For sealing coverslips.
- 0.4x SSC / 2x SSC + Tween-20 Wash Buffers [64].
- DAPI Antifade [64].
Procedure:
- Probe Preparation: Thaw the FISH probe and briefly centrifuge. Mix the probe solution thoroughly by pipetting or vortexing. For each test, aliquot 10μl of probe into a microcentrifuge tube [64].
- Pre-denaturation: Place the probe aliquot and the sample slide on a 37°C (± 1°C) hotplate for 5 minutes to pre-warm [64].
- Probe Application: Spot 10μl of the probe mixture onto the target area of the sample slide and carefully apply a 22x22 mm coverslip. Seal the edges with rubber solution glue and allow it to dry completely [64].
- Denaturation: Denature the sample and probe simultaneously by heating the slide on a hotplate at 75°C (± 1°C) for 2 minutes [64].
- Hybridization: Transfer the slide to a lightproof, humidified container and incubate at 37°C (± 1°C) overnight (typically 16-24 hours) [64].
- Post-Hybridization Washes:
- Carefully remove the coverslip and all traces of glue.
- Immerse the slide in 0.4x SSC (pH 7.0) at 72°C (± 1°C) for 2 minutes without agitation.
- Drain the slide and transfer it to 2x SSC + 0.05% Tween-20 at room temperature (pH 7.0) for 30 seconds without agitation [64].
- Counterstaining and Mounting: Drain the slide and apply 10-15μl of DAPI antifade to each sample. Apply a new coverslip (24x24mm), remove any bubbles, and seal the edges with clear nail varnish. Allow the slide to develop in the dark for at least 10 minutes before analysis [64].
Statistical Validation and Reference Range Establishment
Determining the False-Positive Rate (p)
The key to establishing a robust reference range is an accurate estimation of the false-positive rate for each probe and each signal pattern using a validation study of normal specimens.
- Validation Study: Score a minimum of 20 normal specimens, with 500 nuclei scored per specimen, for a total of 10,000 nuclei [62].
- Calculation of p: The probability (p) of a false-positive nucleus for a specific probe pattern is calculated using the formula: p = Total Positive Nuclei / Total Nuclei Evaluated [62]. For a standard validation study of 20 specimens x 500 nuclei, this becomes: p = Total Positive Nuclei / 10,000 [62].
Calculating the Normal Cut-Off
The binomial distribution is the most accurate and simple method for calculating the normal reference range (cut-off) for a FISH assay [62]. The cut-off value (k) is the maximum number of positive nuclei that can be observed in a normal sample at a specified confidence limit (e.g., 95%).
Statistical Decision Flowchart: Establishing Normal Cut-Off
The cut-off value k can be determined using the CRITBINOM function in Microsoft Excel:
k = CRITBINOM(n, p, confidence_limit) [62].
- n: Number of nuclei scored in the clinical assay (e.g., 200).
- p: The false-positive rate determined from the validation study.
- confidence_limit: The desired confidence level, typically 0.95 for 95%.
Example: If p=0.013 and 200 nuclei are scored in a test assay, the normal cut-off at the 95% confidence limit is calculated in Excel as: =CRITBINOM(200, 0.013, 0.95), which returns a value of 5. A specimen with more than 5 positive nuclei is therefore considered positive for the abnormality [62].
Quantitative Data for Validation Framework
The following table summarizes key statistical parameters and their impact on the validation cut-off.
Table 1: Parameters for Statistical Determination of FISH Cut-Off Values
| Symbol | Definition | Role in Validation | Example Impact on Cut-Off |
|---|---|---|---|
| p | Probability of a false-positive nucleus | Estimated from normal validation study; laboratory-specific for each probe pattern | A higher p value directly increases the cut-off value k [62] |
| n | Number of nuclei scored in a clinical FISH assay | Defined by the laboratory's standard operating procedure (SOP) | A larger n requires a higher k to maintain the same confidence level [62] |
| k | Number of positive nuclei in a specimen | The calculated cut-off (reference range) for the assay | The final integer result from the CRITBINOM function [62] |
| Confidence Limit | The statistical certainty level (e.g., 95%) | Chosen based on clinical need; higher confidence requires higher k | A 99% confidence limit will yield a higher k than a 95% limit for the same n and p [62] |
The Scientist's Toolkit: Essential Research Reagent Solutions
A successful FISH validation framework relies on high-quality, specific reagents. The following table details essential materials and their functions.
Table 2: Key Research Reagent Solutions for FFPE FISH
| Reagent Category | Specific Examples | Function in Protocol | Critical Parameters |
|---|---|---|---|
| Fixatives & Preservation | Formalin, Carnoy's solution (3:1 Methanol:Acetic Acid) [64] [57] | Preserve tissue architecture and nucleic acids; Carnoy's is standard for hematologic samples | Fixation time; consistency across samples is vital for reproducible FISH [57] |
| Enzymatic Pretreatment | Pepsin [57] | Digests proteins cross-linked by formalin, allowing probe access to target DNA/RNA | Concentration, time, and temperature must be optimized for each tissue type [57] |
| Labeled FISH Probes | CytoCell AML/MDS FISH Probes [64] | Target-specific DNA probes labeled with fluorophores (e.g., FITC, Texas Red) | Probe design (enumeration, fusion, break-apart); specificity; signal intensity |
| Hybridization Buffers | Solutions containing formamide, dextran sulfate, SSC [64] | Creates optimal chemical environment for specific probe-target binding | Formamide concentration and salt (SSC) concentration control stringency |
| Stringency Wash Buffers | 0.4x SSC (pH 7.0), 2x SSC + 0.05% Tween-20 [64] | Removes excess and non-specifically bound probe after hybridization | Temperature and salt concentration are critical for maintaining specificity [64] |
| Counterstains & Mounting Media | DAPI (4',6-diamidino-2-phenylindole) antifade [64] | Stains nuclear DNA for visualization; antifade reduces photobleaching | Concentration; compatibility with filter sets and other fluorophores |
Advanced Tools: AI and Deep Learning in FISH Analysis
Modern analysis increasingly leverages artificial intelligence to overcome challenges in signal detection. U-FISH is a deep learning method that enhances diverse raw FISH images into uniform images for reliable, automated spot detection without manual parameter tuning [65].
- Performance: Benchmarked against other tools, U-FISH demonstrated superior accuracy, achieving an F1 score of approximately 0.924 and a distance error of 0.290 pixels, indicating high precision in spot localization [65].
- Application: This tool is particularly valuable for analyzing complex spatial-omics data and for standardizing signal quantification in clinical diagnostics, ensuring consistency and objectivity in the analysis phase of the validation framework [65].
This application note provides a detailed protocol and framework for establishing a statistically rigorous validation process for FISH assays on FFPE tissue. By adhering to standardized sample preparation protocols, understanding and controlling for pre-analytical variables, and implementing a binomial statistical approach to define reference ranges, researchers and clinicians can ensure the generation of reliable, accurate, and reproducible FISH results. The integration of advanced tools like AI-based spot detectors further enhances the robustness and throughput of this critical molecular cytogenetic technique, solidifying its role in both basic research and applied drug development.
Fluorescence in situ hybridization (FISH) on formalin-fixed paraffin-embedded (FFPE) tissue is a cornerstone technique in molecular pathology, providing critical diagnostic, prognostic, and predictive information for various cancers [66]. The manual performance and interpretation of FISH assays are labor-intensive, time-consuming, and subject to inter-observer variability [67] [66] [68]. Automated solutions, encompassing both staining and analysis, have been developed to standardize FISH testing, improve workflow efficiency, and enhance the precision of results [67] [69] [70]. This application note synthesizes current evidence to compare the concordance and operational efficiency of automated versus manual FISH methodologies within FFPE tissue research.
Quantitative Concordance and Performance Data
Validation studies demonstrate that automated FISH systems achieve a high degree of concordance with established manual methods. The following tables summarize key performance metrics from recent studies.
Table 1: Diagnostic Concordance Between Automated and Manual FISH
| Study & Cancer Type | Automation System | Sample Size (n) | Concordance Rate | Sensitivity | Specificity |
|---|---|---|---|---|---|
| Breast Cancer [67] | Leica BOND-III (Staining) | 77 | 98% | 0.95 | 0.97 |
| Gastric Cancer [67] | Leica BOND-III (Staining) | 8 | 100% | 1.0 | 1.0 |
| Breast Cancer (TMA) [70] | Leica FISH Staining + D-Sight Analysis | 328 | 98.8% | N/R | N/R |
| Breast Cancer (IHC 2+) [70] | Leica FISH Staining + D-Sight Analysis | 50 | 93.8% | N/R | N/R |
| B-Cell Lymphomas [71] | MetaSystems (Automated Analysis) | 27 | 91-100%* | N/R | N/R |
N/R: Not Reported; *Range reflects different lymphoma subtypes.
Table 2: Operational Efficiency and Analysis Metrics
| Parameter | Manual FISH | Automated FISH | Notes |
|---|---|---|---|
| Technical Hands-on Time | High [67] | Significantly Decreased [67] | Automated staining reduces labor. |
| Analysis Objectivity | Subjective, experience-dependent [66] | Objective, algorithm-driven [66] | Automated analysis reduces inter-observer variability. |
| Cell Nuclei Counted | Typically 20-40 nuclei [70] | Can analyze >1000 nuclei/tiles [71] | Automated analysis enables higher throughput and more comprehensive sampling. |
| Dimensional Analysis | Primarily 2D [66] | 3D Z-stack scoring possible [66] | Confocal WSI with 3D analysis captures more spatial data. |
| Signal Pattern Detection | Limited by human perception [66] | Detects variant patterns (e.g., truncation, deletion) [66] | Algorithms can identify subtle, complex signal distributions. |
Experimental Protocols
This protocol outlines a fully automated procedure for HER2 FISH testing on FFPE breast cancer tissue, integrating automated staining and digital analysis.
- Tissue Specimen: FFPE tissue sections (4-5 μm thick) mounted on glass slides.
- Key Equipment & Reagents: Automated staining platform (e.g., Leica BOND-III), HER2 FISH probe kit (e.g., Leica HER2 FISH System), fluorescent microscope with digital imaging system (e.g., Visia D-Sight platform).
Procedure:
- Slide Baking: Bake FFPE slides at 60°C for a minimum of 1 hour.
- Automated Staining: Load slides onto the automated stainer. The system executes a fully hands-off protocol including:
- Dewaxing and dehydration.
- Pretreatment with buffer and protease for target retrieval.
- Application of the HER2/CEP17 probe mixture.
- Denaturation and hybridization (e.g., at 37°C for 16-20 hours).
- Post-hybridization stringency washes.
- Counterstaining and Mounting: Apply DAPI counterstain and mount with an anti-fade medium.
- Digital Image Acquisition: Scan slides using a digital imaging platform at 20x magnification to pre-screen. Capture high-magnification (100x) images of fluorescent signals from at least two distinct tumor regions.
- Supervised Automated Scoring:
- The digital analysis software (e.g., D-Sight HER2 FISH module) automatically identifies nuclei and counts HER2 and CEP17 signals.
- The technologist or pathologist reviews the automated counts, verifying nuclei selection and signal enumeration.
- A minimum of 20 non-overlapping nuclei are scored from the captured images.
- The HER2/CEP17 ratio and average HER2 signals per nucleus are calculated automatically to determine HER2 amplification status based on ASCO/CAP guidelines.
This protocol describes an advanced workflow for automated 3D FISH analysis using Z-stack images from confocal whole-slide scanners, suitable for complex signal pattern detection.
- Tissue Specimen: FFPE tissue sections (4 μm thick).
- Key Equipment & Reagents: Confocal Whole-Slide Imaging (WSI) Scanner, break-apart FISH probes (e.g., for EWSR1, MYC, BCL2, BCL6), specialized 3D analysis software (e.g., SHIMARIS PAFQ algorithm).
Procedure:
- Slide Preparation: Perform standard FISH pretreatment and hybridization procedures as in Section 3.1.
- 3D Image Acquisition: Use a confocal WSI scanner to capture serial optical sections (Z-stacks) through the entire thickness of the tissue section. This generates a multi-layer image dataset for each field of view.
- Automated 3D Nuclei Segmentation: The analysis algorithm processes the Z-stack to perform 3D reconstruction of individual cell nuclei within the tissue volume.
- Automated 3D Signal Detection: The software detects and localizes fluorescent gene signals within the 3D nuclear volume.
- Spatial Analysis and Pattern Classification: For break-apart probes, the algorithm measures the 3D vector distance between differently colored signals to classify them as fused (normal), split (rearranged), or variant patterns (e.g., due to deletion). This step is critical for diagnosing gene translocations.
- Validation: The automated 3D scoring results are compared against manual counts performed by clinical cytogeneticists to establish accuracy and precision.
Workflow Visualization
The following diagram illustrates the key decision points and pathways in a modern automated FISH workflow, highlighting its integration with digital analysis and AI.
Automated vs. Manual FISH Workflow
The Scientist's Toolkit: Research Reagent Solutions
Table 3: Essential Materials for Automated FISH Workflows
| Item | Function | Example Products / Technologies |
|---|---|---|
| Automated Staining Platform | Performs consistent, hands-off FISH procedures to minimize variability and labor. | Leica BOND-III [67] [70] |
| FISH Probe Kits | Fluorescently labeled DNA sequences targeting specific genes for visualization. | Agilent HER2 IQFISH pharmDx [67]; Vysis LSI dual fusion probes [71] |
| Digital Imaging System | Captures high-resolution whole-slide images for analysis and archival. | Visia D-Sight [70]; Confocal WSI Scanners [66]; MetaSystems [71] |
| Automated Analysis Software | Enumerates FISH signals, calculates ratios, and classifies cells algorithmically. | D-Sight HER2 FISH Module [70]; SHIMARIS PAFQ [66]; MetaSystems Metafer 4 [71] |
| AI/Deep Learning Models | Predicts FISH status or IHC scores from images, aiding in classification. | CLAM model for HER2 IHC scoring [72] |
Correlating FISH Findings with Other Molecular Techniques
Fluorescence in situ hybridization (FISH) is a cornerstone molecular cytogenetic technique for visualizing specific DNA sequences within cells and tissues. Its application to formalin-fixed paraffin-embedded (FFPE) tissue samples, the standard for pathological archives, is crucial in both research and clinical diagnostics. However, FFPE processing introduces significant technical challenges including inadequate fixation, contamination, block and slide age, inadequate pretreatment, and FISH technique issues that can compromise results [28]. While FISH provides valuable spatial context and detection of genetic amplifications, deletions, and rearrangements, correlating its findings with other molecular techniques is often essential for comprehensive genomic profiling and resolving diagnostic dilemmas. This application note outlines protocols and strategies for integrating FISH data with next-generation sequencing (NGS) and other molecular methods to enhance diagnostic accuracy and research validity in the context of FFPE tissues.
Technical Challenges of FISH in FFPE Tissues
Applying FISH to FFPE samples presents unique obstacles that can affect result interpretation. The fixation process can cause cross-linking and fragmentation of nucleic acids, while paraffin embedding can create barriers to probe penetration. Pre-analytical variables including fixation time, tissue processing methods, and storage conditions significantly impact signal quality and hybridization efficiency [28]. These technical challenges necessitate rigorous quality control measures and often require correlation with complementary molecular methods to verify findings.
Table 1: Common Technical Challenges in FFPE-FISH and Proposed Solutions
| Challenge | Impact on FISH | Proposed Solution |
|---|---|---|
| Inadequate Fixation | Nucleic acid degradation; poor probe binding | Standardize fixation protocols (10% NBF, <24h) [28] |
| Block and Slide Age | Signal degradation over time | Use archival blocks <5 years old when possible [28] |
| Inadequate Pretreatment | High background; weak specific signals | Optimize protease concentration and digestion time [28] |
| Probe Selection | Low hybridization efficiency | Carefully select probes with appropriate labeling [28] |
| Autofluorescence | Background interference | Implement bleaching protocols; use specific filters [28] |
Case Study: Correlation Between FISH and NGS for MDM2 Amplification Detection
Background and Diagnostic Dilemma
A critical example of the need for technique correlation comes from the assessment of MDM2 amplification in sarcomas. MDM2 amplification via FISH is the gold standard for confirming atypical lipomatous tumor/well-differentiated liposarcoma and dedifferentiated liposarcoma. However, a diagnostic dilemma emerges when FISH shows "low-level" amplification, defined as an MDM2/CEP12 ratio between 2 and 3, which raises the possibility of false positive results [73].
Comparative Analysis Methodology
A recent institutional study retrospectively analyzed 27 high-grade and/or pleomorphic tumors with low-level MDM2 amplification by FISH. Eight of these tumors underwent subsequent analysis using the Oncomine v3 NGS assay, which covers 161 genes and assesses for DNA mutations, RNA fusions, and copy number alterations including MDM2 gene gain or amplification [73]. The comparative methodology involved:
FISH Analysis Protocol:
- Cut 4-5μm sections from FFPE blocks
- Use MDM2 and CEP12 dual-color FISH probes
- Count signals in at least 50 non-overlapping nuclei
- Calculate MDM2/CEP12 ratio
- Define amplification as ratio >2.0 [73]
NGS Analysis Protocol:
- Extract DNA from FFPE tissue sections
- Use Oncomine v3 targeted sequencing panel
- Sequence to high coverage depth (>500x)
- Analyze copy number variations using normalized read depth ratios
- Define amplification as ≥6 copy number gain [73]
Results and Correlation Findings
The correlation study revealed striking discrepancies between the two techniques. Seven of the eight tumors (87.5%) with low-level MDM2 amplification by FISH showed no MDM2 copy number alteration by NGS. Only one tumor (a leiomyosarcoma) demonstrated MDM2 copy number gain (approximately 5 copies), but this did not qualify as amplification based on the NGS threshold of 6 copy number gain cutoff [73].
This finding demonstrated a 0% specificity rate for FISH in low-level amplification cases from their series and highlighted the risk of misdiagnosis and potential misuse of targeted therapy if relying solely on FISH results. The NGS analysis additionally identified other relevant genetic alterations in these tumors, including TP53, CDKN2A/B, PIK3CA, and PTEN mutations, providing alternative explanations for the tumor pathogenesis [73].
Integrative Analysis Workflow
The following diagram illustrates a recommended workflow for correlating FISH findings with other molecular techniques in FFPE tissue research:
LRP1B Mutation Analysis: A Multi-Technique Approach
LRP1B as a Pan-Cancer Biomarker
LRP1B (low-density lipoprotein receptor-related protein 1B) represents an important case study in molecular correlation, as it is among the most frequently mutated genes in human cancer overall and is frequently inactivated by various genetic and epigenetic mechanisms [74]. Initially identified as a putative tumor suppressor, LRP1B has emerged as a potential biomarker for immunotherapy response across multiple cancer types.
Correlation of Mutational Status with Immunotherapy Response
In lung adenocarcinoma (LUAD), studies have demonstrated that LRP1B mutation status correlates with improved outcomes following immune checkpoint inhibitor (ICI) treatment. Analysis of an ICI-treated LUAD cohort revealed that patients with LRP1B mutations had significantly prolonged progression-free survival compared to those with wild-type LRP1B [75]. The molecular correlation approach included:
- Whole Exome Sequencing: Identification of LRP1B mutation status and calculation of tumor mutational burden (TMB)
- Transcriptomic Analysis: Evaluation of immune-related gene expression patterns
- Multiplex Immunohistochemistry (mIHC): Validation of PD-L1 expression and immune cell infiltration
- CIBERSORT Analysis: Computational estimation of immune cell populations from RNA-seq data
This multi-platform approach revealed that LRP1B-mutated LUAD patients exhibited higher TMB, increased neoantigen load, enhanced expression of immune-related genes, and greater infiltration of active immune cells within the tumor microenvironment [75].
Table 2: Molecular Correlations of LRP1B Mutation Status in Lung Adenocarcinoma
| Analytical Method | LRP1B-Mutated Findings | LRP1B Wild-Type Findings | Clinical Significance |
|---|---|---|---|
| Whole Exome Sequencing | Higher TMB; more neoantigens [75] | Lower TMB; fewer neoantigens | Predicts immunotherapy response |
| Immune Gene Expression | Upregulation of antigen presentation, cytotoxicity, chemokines [75] | Lower immune gene expression | Indicates immunologically active TME |
| CIBERSORT Analysis | Increased activated immune cells [75] | Fewer activated immune cells | Correlates with improved survival |
| Multiplex IHC | Elevated PD-L1 expression [75] | Lower PD-L1 expression | Guides treatment selection |
Research Reagent Solutions
Table 3: Essential Reagents for Correlative Molecular Studies in FFPE Tissues
| Reagent Category | Specific Examples | Function | Technical Considerations |
|---|---|---|---|
| FISH Probes | MDM2/CEP12 dual-color probes [73]; HER2/CEP17 probes | Target-specific detection of gene amplifications/chromosomal rearrangements | Verify probe specificity; optimize hybridization conditions |
| NGS Libraries | Oncomine v3 panel [73]; custom targeted panels | Comprehensive mutation and copy number analysis | Assess DNA quality from FFPE; input requirements |
| IHC Antibodies | PD-L1 clones; LRP1B antibodies [75] | Protein expression validation | Optimize antigen retrieval; validate specificity |
| DNA Extraction Kits | FFPE-specific DNA isolation kits | Nucleic acid purification | Maximize yield from degraded material |
| RNA Extraction Kits | FFPE-specific RNA isolation kits | Gene expression analysis | Address RNA fragmentation in FFPE |
Protocol for Resolving Discordant MDM2 Amplification Results
Step-by-Step Diagnostic Algorithm
Initial FISH Testing:
- Perform MDM2 FISH on FFPE tissue sections
- Count signals in 50-100 non-overlapping nuclei
- Calculate MDM2/CEP12 ratio
- Interpret results: >3.0 = positive; 2.0-3.0 = low-level amplification; <2.0 = negative [73]
Low-Level Amplification Assessment:
- If ratio 2.0-3.0, proceed to NGS confirmation
- Evaluate tumor morphology and clinical context
- Consider technical FISH quality metrics
NGS Confirmation Testing:
- Extract DNA from same FFPE block
- Perform targeted NGS with copy number analysis
- Use appropriate cutoff for amplification (e.g., ≥6 copies) [73]
- Analyze concomitant genetic alterations
Integrated Diagnosis:
- Correlate FISH, NGS, histology, and clinical findings
- Use NGS as arbiter for ambiguous FISH results
- Consider additional IHC if needed
Quality Control Measures
- Include positive and negative controls with each FISH run
- Monitor signal intensity and background levels
- Ensure adequate tumor cellularity (>20%) in analyzed samples
- Use same FFPE block for both FISH and NGS when possible
- Document fixation time and processing conditions [28]
Correlating FISH findings with other molecular techniques is essential for accurate genomic profiling in FFPE tissue research. The case studies of MDM2 amplification and LRP1B mutation analysis demonstrate how a multi-technique approach resolves diagnostic dilemmas and provides clinically actionable information. As molecular diagnostics continues to evolve, integrating FISH with NGS, IHC, and computational methods will remain critical for advancing precision medicine and ensuring optimal patient care.
Human Epidermal Growth Factor Receptor 2 (HER2) fluorescence in situ hybridization (FISH) represents a critical companion diagnostic technology in precision oncology, enabling the identification of breast cancer patients eligible for HER2-targeted therapies [76]. The analytical validation of HER2 FISH testing on formalin-fixed paraffin-embedded (FFPE) tissue specimens remains challenging due to biological complexities and technical variables affecting assay performance [77]. This case study, situated within a broader thesis on FFPE tissue research, provides a comprehensive framework for validating HER2 FISH testing protocols in accordance with updated clinical guidelines and emerging technological advancements [78] [76]. We present detailed experimental protocols, analytical validation parameters, and innovative approaches to address key challenges in HER2 genetic assessment, providing researchers and drug development professionals with standardized methodologies for implementing robust HER2 testing pipelines.
Current Guidelines and Clinical Significance
Evolution of HER2 Testing Guidelines
The American Society of Clinical Oncology and College of American Pathologists (ASCO/CAP) guidelines for HER2 testing have undergone significant evolution, with the most recent 2023 update reaffirming the 2018 focused update [78]. This reaffirmation was propelled by results from the DESTINY-Breast04 trial, which demonstrated efficacy of trastuzumab deruxtecan in metastatic breast cancer patients with HER2 IHC 1+ or 2+/ISH-negative results [78]. The guidelines specifically do not support the use of a "HER2-Low" interpretive category, as the clinical trial did not include patients with HER2 IHC 0 results, and no evidence exists to support that IHC 1+ or 2+/ISH-negative results are predictive of treatment response when compared to IHC 0 results [78].
HER2 FISH Scoring Criteria
The 2018 ASCO/CAP guidelines established five distinct groups for HER2 FISH interpretation [76]:
Table 1: HER2 FISH Interpretation Groups Based on 2018 ASCO/CAP Guidelines
| Group | HER2/CEP17 Ratio | Average HER2 Copy Number | Interpretation |
|---|---|---|---|
| 1 | ≥2.0 | ≥4.0 | POSITIVE |
| 2 | ≥2.0 | <4.0 | Additional workup recommended |
| 3 | <2.0 | ≥6.0 | Additional workup recommended |
| 4 | <2.0 | ≥4.0 and <6.0 | Additional workup recommended |
| 5 | <2.0 | <4.0 | NEGATIVE |
Reclassification studies comparing 2013 and 2018 guidelines demonstrated that the elimination of equivocal results primarily contributed to an increase in negative results (10.7% increase) with a slight decrease in positive results (1.7% decrease) [76].
Materials and Methods
Essential Research Reagent Solutions
Table 2: Key Research Reagents for HER2 FISH Validation
| Reagent/Category | Specific Examples | Function/Application |
|---|---|---|
| Probe Systems | ZytoLight SPEC HER2/CEN17 Dual Color Probe | Dual-color detection of HER2 gene (17q12) and chromosome 17 centromere (D17Z1) |
| Fixation Systems | Neutral Buffered Formalin (NBF); PAXgene Tissue System | Tissue architecture preservation; PAXgene enables superior biomolecule preservation |
| Enzymes for Probe Preparation | DNase I; E. coli DNA Polymerase I | Nick translation for probe labeling |
| Hybridization Components | Dextran sulfate; Formamide; Human Cot-1 DNA; Saline Sodium Citrate (SSC) | Hybridization efficiency enhancement; blocking repetitive sequences; stringency control |
| Detection System | Fluorophore-conjugated dUTP (Alexa dyes); DAPI counterstain | Target visualization; nuclear demarcation |
| Microfluidic Components | Oscillatory flow chambers (5μL volume) | Accelerated hybridization via reagent recirculation |
Specimen Preparation and Fixation Protocols
Standard FFPE Processing Protocol
- Fixation: Immerse tissue specimens in 4% neutral buffered formalin for 6-72 hours (optimal 18-24 hours) using at least 20:1 fixative-to-tissue volume ratio [78] [79]
- Processing: Dehydrate through graded ethanol series (70%, 80%, 90%, 99%), clear in xylene, and infiltrate with paraffin
- Sectioning: Cut sections at 4-6μm thickness using microtome and transfer to charged slides [77]
- Storage: Store blocks at 4°C in darkness to preserve nucleic acid integrity
Alternative Fixation: PAXgene Tissue System Protocol
For enhanced biomolecular preservation without formalin-induced crosslinks:
- Primary Fixation: Submerge tissue in PAXgene Tissue Fix for 2-24 hours at room temperature
- Stabilization: Transfer to PAXgene Tissue Stabilizer for 2-72 hours at room temperature
- Processing: Identical dehydration and embedding as standard FFPE
- Post-fixation for FISH: Deparaffinize PFPE sections and post-fix in 4% formalin for 18-24 hours to enable standard FISH protocols [79]
Validation studies demonstrate 100% concordance between FFPE and post-fixed PFPE sections for HER2 amplification status [79].
HER2 FISH Experimental Workflow
The following diagram illustrates the complete HER2 FISH testing workflow:
Microfluidics-Assisted FISH (MA-FISH) Protocol
To address limitations of traditional FISH regarding time and reagent consumption:
- Chamber Assembly: Mount tissue section with 5μL microfluidic chamber
- Probe Application: Introduce diluted probe solution (5-fold reduction vs. standard)
- Hybridization: Apply square-wave oscillatory flows for 4 hours (4-fold reduction vs. standard)
- Detection: Standard washing and detection procedures
Validation across 51 FFPE breast cancer tissues demonstrated excellent agreement with standard HER2 FISH while significantly reducing time and reagent consumption [80].
Automated Quantitative Image Analysis
Implementation of automated scoring systems addresses challenges of manual interpretation:
- Slide Scanning: Acquire whole-slide images at 40x magnification
- Tumor Identification: Algorithmic recognition of invasive carcinoma regions
- Signal Enumeration: Automated counting of HER2 and CEP17 signals
- Ratio Calculation: HER2/CEP17 ratio and average HER2 copy number determination
- Quality Metrics: Assessment of signal intensity, background, and tissue preservation
Approximately 5% of clinical laboratories use exclusively automated scoring methods, while 11% utilize both manual and automated approaches [76].
Analytical Validation Parameters
Method Verification Studies
Table 3: Analytical Validation Parameters for HER2 FISH Testing
| Validation Parameter | Acceptance Criteria | Experimental Approach |
|---|---|---|
| Precision | CV <15% for replicate analyses | Consecutive sections from 10 cases with varying HER2 status |
| Accuracy | ≥95% concordance with reference method | Comparison to validated IHC (100 cases: 20×0, 30×1+, 30×2+, 20×3+) |
| Linearity | R² >0.95 across dilution series | Cell line mixtures (SKBR-3:HER2 amp; MCF-7:HER2 non-amp) |
| Reportable Range | HER2:CEP17 ratio 0.5-10.0 HER2 copies 1.0-30.0 | Serial dilutions of amplified and non-amplified controls |
| Reference Range | Negative: ratio <2.0 AND copies <4.0 Positive: ratio ≥2.0 AND copies ≥4.0 | 200 breast cancer cases with established clinical outcomes |
| Section Thickness Effect | <10% change in copy number (4-6μm vs 2μm) | Triplicate sections at 2, 4, and 6μm from same block |
Impact of Technical Variables on FISH Results
Section Thickness Optimization
A critical technical variable often overlooked is FFPE section thickness. Mathematical modeling and experimental validation demonstrate that section thickness significantly impacts observed gene copy numbers [77]:
- 2μm sections: Underestimate true gene copy number by 20-40%
- 4-6μm sections: Provide optimal balance between nuclear preservation and signal enumeration
- >6μm sections: Increase nuclear overlap and background signals
The mathematical relationship between section thickness (t) and nuclear diameter (d) follows:
P(full volume | full image) = t/d for t < d
This model explains why even apparently complete nuclear images on thin sections may represent partial nuclei, leading to underestimation of gene amplification status [77].
Emerging Technologies and Innovation
Artificial Intelligence in HER2 Classification
Recent advances in artificial intelligence (AI) demonstrate significant potential for improving HER2 testing accuracy and efficiency:
- IHC Scoring AI: Deep learning models achieve 91% overall accuracy in predicting HER2 IHC scores from whole-slide images [72]
- FISH Prediction AI: Models predicting FISH results from IHC images show specificity of 96±3% with moderate sensitivity (37±13%), potentially serving as screening tools where reflex FISH testing is unavailable [72]
- Meta-analysis Performance: Pooled analysis reveals AI achieves sensitivity of 0.97 [95% CI 0.96-0.98] and specificity of 0.82 [95% CI 0.73-0.88] for identifying T-DXd eligible patients (1+/2+/3+ vs 0) [68]
Transcriptomic Approaches for HER2-low Detection
Quantitative transcriptomics offers an alternative approach for detecting low HER2 expression:
- ERBB2 mRNA Detection: 86% of IHC 0 cases show detectable ERBB2 mRNA levels, with distribution across "low" (41%), "intermediate" (42%), and "high" (4%) expression classes [81]
- Predictive Value: Pathological complete response to anti-HER2 therapy correlates with ERBB2 expression classes beyond traditional IHC classification [81]
- Technical Advantages: RNA-based methods avoid fixation and scoring variability inherent to IHC
High-Throughput FISH Methodologies
Advanced FISH technologies enable increased throughput and multiplexing:
- hiFISH: Combines multicolor combinatorial DNA FISH with automated image acquisition to visualize hundreds of genomic loci in millions of cells [82]
- Automated Platforms: Integrated systems for probe hybridization, washing, and scanning improve reproducibility and throughput
- 3D FISH: Preservation of nuclear architecture for spatial genomics applications
Quality Assurance and Proficiency Testing
Current CAP requirements mandate rigorous quality assurance measures:
- Proficiency Testing: Laboratories performing both HER2 IHC stain and interpretation must participate in CAP-accepted PT programs [78]
- Alternative Performance Assessment: Laboratories performing only staining or only interpretation must perform semiannual alternative performance assessment [78]
- Validation Requirements: All laboratories must comply with checklist requirements for assay validation, specimen fixation, and use of ASCO/CAP scoring criteria [78]
The following diagram illustrates the decision pathway for HER2 FISH interpretation according to current guidelines:
This comprehensive case study provides detailed protocols and validation frameworks for HER2 FISH testing in cancer diagnostics. The integration of traditional methods with emerging technologies such as microfluidics, artificial intelligence, and transcriptomics represents the future of HER2 testing, enabling more precise patient stratification for targeted therapies. As the field evolves with new antibody-drug conjugates and expanded indications, robust validation methodologies will remain essential for translating biomarker discovery into clinical practice. Researchers and drug development professionals should implement these standardized approaches to ensure reproducible, accurate HER2 status determination across institutions and clinical trials.
Conclusion
FISH on FFPE tissue remains an indispensable and rapidly evolving tool that successfully bridges foundational research with clinical diagnostics. By mastering the robust protocols, implementing systematic troubleshooting, and adhering to rigorous validation standards, researchers can reliably extract crucial genetic information from archival tissues. Future directions point toward increased automation for enhanced reproducibility and cost-effectiveness, the expanded use of highly multiplexed spatial transcriptomics methods like MERFISH for novel discovery, and the deeper integration of FISH data with other omics technologies. These advancements will continue to solidify FFPE-FISH's role in unlocking the molecular secrets held within preserved tissue architecture, driving forward personalized medicine and therapeutic development.
References
- 1. Fluorescence in situ hybridization analysis of formalin fixed ... [https://pubmed.ncbi.nlm.nih.gov/20809303/]
- 2. Robust Detection of Gene Amplification in Formalin - Fixed ... [https://www.jove.com/t/66978/robust-detection-gene-amplification-formalin-fixed-paraffin-embedded]
- 3. Use of Fluorescence In Situ Hybridization (FISH) in Diagnosis ... [https://pmc.ncbi.nlm.nih.gov/articles/PMC7221545/]
- 4. Developing a routine lab test for absolute quantification of ... [https://www.nature.com/articles/s41598-020-69471-4]
- 5. Automated analysis of fluorescence in situ hybridization on ... [https://www.sciencedirect.com/science/article/pii/S089339522201763X]
- 6. Fluorescence In Situ Hybridization for Diagnosis of ... [https://www.frontiersin.org/journals/medicine/articles/10.3389/fmed.2017.00087/full]
- 7. FFPE tissue preparation and FISH protocol [https://www.ogt.com/resources/fish-resources-and-support/introduction-to-fish/fish-procedures/ffpe-tissue-preparation-and-fish-protocol/]
- 8. RNAscope Multiplex FISH Signal Assessment in FFPE and ... [https://pmc.ncbi.nlm.nih.gov/articles/PMC11755420/]
- 9. Robust detection of translocations in lymphoma FFPE samples using... [https://www.nature.com/articles/s41467-021-23695-8?error=cookies_not_supported&code=7f4d2cb8-7e2c-4779-874e-66af060bb3c6]
- 10. Fluorescence and chromogenic in situ hybridization to detect ... genetic [https://pubmed.ncbi.nlm.nih.gov/18274524/]
- 11. Genomic aberration detection by fluorescence in situ ... [https://www.sciencedirect.com/science/article/abs/pii/S0046817725001935]
- 12. One-fits-all pretreatment protocol facilitating Fluorescence In Situ... [https://molecularcytogenetics.biomedcentral.com/articles/10.1186/s13039-019-0442-4]
- 13. Cell Marque: ZytoVision [https://www.cellmarque.com/cms/zytovision/]
- 14. Hapten-labeled DNA probes can be stored and used in ... [https://pmc.ncbi.nlm.nih.gov/articles/PMC12163036/]
- 15. Applications of FFPE samples in modern research | Lexogen [https://www.lexogen.com/blog/applications-of-ffpe-samples-in-modern-research/]
- 16. Library Prep Kits for Sequencing Low-Input and Degraded FFPE Samples [https://blog.genohub.com/2025/01/31/low-input-and-degraded-ffpe-samples-in-ngs-choosing-the-right-library-prep-kit/]
- 17. Quantitative Expression Profiling in Formalin-Fixed Paraffin ... [https://pmc.ncbi.nlm.nih.gov/articles/PMC2893624/]
- 18. Fluorescent In Situ Hybridization Testing Allows the ... [https://www.mdpi.com/2072-6694/17/14/2347]
- 19. Protocol for preparing formalin-fixed paraffin-embedded ... [https://pmc.ncbi.nlm.nih.gov/articles/PMC10998190/]
- 20. Technical challenges regarding the use of formalin-fixed ... [https://bmcmicrobiol.biomedcentral.com/articles/10.1186/s12866-021-02359-z]
- 21. Optimizing cytology and small biopsy specimen processing ... [https://www.sciencedirect.com/science/article/pii/S221329452500078X]
- 22. Quantitative FISHing: Implications for Chromosomal Analysis [https://pubmed.ncbi.nlm.nih.gov/38913313/]
- 23. Preclinical validation of fluorescence in situ hybridization ... [https://www.sciencedirect.com/science/article/pii/S1098360021034031]
- 24. Quantitative detection of rare interphase chromosome breaks ... [https://genomebiology.biomedcentral.com/articles/10.1186/s13059-015-0718-x]
- 25. Optimization of Fluorescence In Situ Hybridization ... [https://pubmed.ncbi.nlm.nih.gov/38923415/]
- 26. Quantitative FISHing: Implications for Chromosomal Analysis [https://link.springer.com/protocol/10.1007/978-1-0716-3946-7_13]
- 27. Reclassification of In Situ Hybridization Test Systems ... [https://www.federalregister.gov/documents/2025/06/11/2025-10549/hematology-and-pathology-devices-reclassification-of-in-situ-hybridization-test-systems-for-use-with]
- 28. Challenges and solutions in FISH for formalin-fixed paraffin ... [https://pubmed.ncbi.nlm.nih.gov/39315587/]
- 29. How do I reduce high background in my FISH assay? [https://www.ogt.com/us/resources/fish-resources-and-support/fish-resources/optimize-your-fish-assay-simple-fixes-for-reducing-high-background-signal/]
- 30. FFPE Tissue Preparation and FISH Protocol [https://www.creative-bioarray.com/support/ffpe-tissue-preparation-and-fish-protocol.htm]
- 31. Fluorescence in situ hybridization (FISH) [https://bio-protocol.org/exchange/minidetail?id=10631582&type=30]
- 32. of Cells, Chromosomes, and... Fluorescence In Situ Hybridization [https://pmc.ncbi.nlm.nih.gov/articles/PMC5806521/]
- 33. ISH: in situ hybridization protocol [https://www.abcam.com/en-us/technical-resources/protocols/in-situ-hybridization]
- 34. Droplet digital PCR assay for precise determination of ... [https://pmc.ncbi.nlm.nih.gov/articles/PMC12291395/]
- 35. MERFISH Spatial Transcriptomics [https://vizgen.com/technology/]
- 36. Vizgen Launches MERSCOPE® Formalin-Fixed Paraffin ... [https://vizgen.com/vizgen-launches-merscope-formalin-fixed-paraffin-embedded-ffpe-solution-kit/]
- 37. Systematic benchmarking of imaging spatial ... [https://www.nature.com/articles/s41467-025-64990-y]
- 38. Protocol optimization improves the performance of ... [https://www.nature.com/articles/s41598-025-17477-1]
- 39. MERSCOPE Ultra Spatial Imaging [https://vizgen.com/merscope-ultra/]
- 40. Comparison of imaging based single-cell resolution spatial ... [https://www.nature.com/articles/s41467-025-63414-1]
- 41. Concordance of MERFISH spatial transcriptomics with bulk ... [https://pmc.ncbi.nlm.nih.gov/articles/PMC9760489/]
- 42. Standardization and optimization of fluorescence in situ ... [https://pmc.ncbi.nlm.nih.gov/articles/PMC5988532/]
- 43. Fluorescent in situ hybridisation (FISH) — Knowledge Hub [https://www.genomicseducation.hee.nhs.uk/genotes/knowledge-hub/fluorescent-in-situ-hybridisation-fish/]
- 44. Fluorescence in situ Hybridization (FISH), Paraffin Block [https://www.labcorp.com/tests/510825/fluorescence-in-situ-hybridization-fish-paraffin-block]
- 45. One-fits-all pretreatment protocol facilitating Fluorescence ... [https://pmc.ncbi.nlm.nih.gov/articles/PMC6580589/]
- 46. FISH Analysis for the Detection of Lymphoma-Associated ... [https://pmc.ncbi.nlm.nih.gov/articles/PMC1867591/]
- 47. Automated Image Analysis for Quantitative Fluorescence In ... [https://pmc.ncbi.nlm.nih.gov/articles/PMC1892889/]
- 48. FUS (For Formalin-Fixed Paraffin-Embedded Tissue) (FFPE ... [https://pathlabs.ufl.edu/tests/test-directory-f/fish-study-neoplastic-interphase-fus-16q11-2-for-formalin-fixed-paraffin-embedded-tissue-ffpe/]
- 49. A new method for real-time evaluation of pepsin digestion ... [https://pubmed.ncbi.nlm.nih.gov/28238098/]
- 50. Fluorescence in situ hybridization on formalin-fixed and ... [https://www.ucviden.dk/en/publications/fluorescence-in-situ-hybridization-on-formalin-fixed-and-paraffin/]
- 51. Systematic review and feasibility study on pre-analytical ... [https://www.nature.com/articles/s41598-024-69285-8]
- 52. Solid tumor FFPE FISH - Enzyme digestion [https://www.ogt.com/us/resources/fish-resources-and-support/fish-support/solid-tumor-ffpe-fish-enzyme-digestion/]
- 53. Hapten-labeled DNA probes can be stored and used in ... [https://pubmed.ncbi.nlm.nih.gov/40520232/]
- 54. Hapten-labeled DNA probes can be stored and used in ... [https://www.frontiersin.org/journals/genetics/articles/10.3389/fgene.2025.1569308/full]
- 55. Tetrahedral DNA dendritic nanostructure-enhanced FISH ... [https://www.nature.com/articles/s41467-025-64294-1]
- 56. SABER-FISH – Signal amplification for multiplexed ... [https://www.protocols.io/view/saber-fish-signal-amplification-for-multiplexed-fl-dzp975r6.html]
- 57. Fluorescence in situ hybridization on formalin-fixed and paraffin-embedded tissue: optimizing the method - PubMed [https://pubmed.ncbi.nlm.nih.gov/15551741/]
- 58. CytoCell FISH probe performance on FFPE tissue [https://www.ogt.com/resources/fish-resources-and-support/fish-resources/demonstration-of-excellent-cytocell-fish-probe-performance-on-ffpe-tissue-prepared-using-the-abbott-vp2000/]
- 59. Optimizing Tissue Preservation for High-Resolution Confocal Imaging of Single-Molecule RNA-FISH - PMC [https://pmc.ncbi.nlm.nih.gov/articles/PMC7202135/]
- 60. Fish Automation [https://empiregenomics.com/fish-automation/]
- 61. Solid tumour FFPE FISH protocol - Counterstain and analysis [https://www.ogt.com/resources/fish-resources-and-support/fish-support/solid-tumour-ffpe-fish-protocol-counterstain-and-analysis/]
- 62. Statistical Treatment of Fluorescence in Situ Hybridization ... [https://pmc.ncbi.nlm.nih.gov/articles/PMC2710710/]
- 63. A Multifaceted FISH Approach to Study Endogenous RNAs ... [https://pmc.ncbi.nlm.nih.gov/articles/PMC3556644/]
- 64. Hematology FISH protocol [https://www.ogt.com/us/resources/fish-resources-and-support/introduction-to-fish/fish-procedures/recommended-fish-protocol-for-cytocell-aml-and-mds-fish-probe-kits/]
- 65. U-FISH: a fluorescent spot detector for imaging-based spatial ... [https://genomebiology.biomedcentral.com/articles/10.1186/s13059-025-03736-x]
- 66. Automated 3D scoring of fluorescence in situ hybridization ... [https://pmc.ncbi.nlm.nih.gov/articles/PMC8035347/]
- 67. Automation of fluorescent in situ hybridization (FISH) ... [https://pubmed.ncbi.nlm.nih.gov/40962484/]
- 68. Systematic review and meta-analysis of artificial ... [https://www.nature.com/articles/s41746-025-01483-8]
- 69. Automated Fluorescence in situ Hybridization (FISH) ... [https://www.fda.gov/medical-devices/guidance-documents-medical-devices-and-radiation-emitting-products/automated-fluorescence-situ-hybridization-fish-enumeration-systems-class-ii-special-controls]
- 70. Fully Automated Fluorescent in situ Hybridization (FISH ... [https://journals.plos.org/plosone/article?id=10.1371/journal.pone.0123201]
- 71. Automated analysis of fluorescence in situ hybridization on ... [https://www.nature.com/articles/3800630]
- 72. Enhancing HER2 testing in breast cancer - PubMed Central [https://pmc.ncbi.nlm.nih.gov/articles/PMC11884934/]
- 73. Low-Level MDM2 Amplification by FISH: An Institutional ... [https://pubmed.ncbi.nlm.nih.gov/39563528/]
- 74. LRP1B: A Giant Lost in Cancer Translation - PMC [https://pmc.ncbi.nlm.nih.gov/articles/PMC8469001/]
- 75. LRP1B mutation is associated with tumor immune ... [https://tlcr.amegroups.org/article/view/73732/html]
- 76. HER2 FISH for Breast Cancer: Advances in Quantitative ... [https://www.lidsen.com/journals/genetics/genetics-04-02-109/1000]
- 77. A model for the impact of FFPE section thickness on gene ... [https://www.nature.com/articles/s41598-019-44015-7]
- 78. HER2 Testing in Breast Cancer - 2023 Guideline Update [https://www.cap.org/protocols-and-guidelines/cap-guidelines/current-cap-guidelines/recommendations-for-human-epidermal-growth-factor-2-testing-in-breast-cancer]
- 79. Protocol for HER2 FISH determination on PAXgene‐fixed ... [https://pmc.ncbi.nlm.nih.gov/articles/PMC4926048/]
- 80. Microfluidics-assisted fluorescence in situ hybridization for ... [https://www.sciencedirect.com/science/article/pii/S002368372201217X]
- 81. Enhancing HER2-low breast cancer detection with ... [https://www.nature.com/articles/s41523-025-00817-9]
- 82. High-Throughput DNA FISH (hiFISH) - PMC [https://pmc.ncbi.nlm.nih.gov/articles/PMC10372930/]