Mastering RNAscope for Low-Expression Genes: A Comprehensive Guide from Assay Design to Clinical Validation
Detecting low-expression genes with spatial context is critical for advancing research in disease mechanisms, biomarker discovery, and drug development.
Mastering RNAscope for Low-Expression Genes: A Comprehensive Guide from Assay Design to Clinical Validation
Abstract
Detecting low-expression genes with spatial context is critical for advancing research in disease mechanisms, biomarker discovery, and drug development. This article provides a comprehensive guide to leveraging RNAscope in situ hybridization technology for challenging low-copy RNA targets. We cover foundational principles of RNAscope's unique signal amplification chemistry that enables single-molecule sensitivity, methodological strategies for assay design and platform selection across chromogenic and fluorescent multiplex systems, essential troubleshooting and optimization techniques to maximize signal-to-noise ratio, and rigorous validation frameworks incorporating digital image analysis. Designed for researchers, scientists, and drug development professionals, this resource synthesizes current best practices to ensure reliable detection and quantification of low-abundance transcripts in both research and clinical settings.
Understanding RNAscope Technology: Why It Works for Low-Abundance Targets
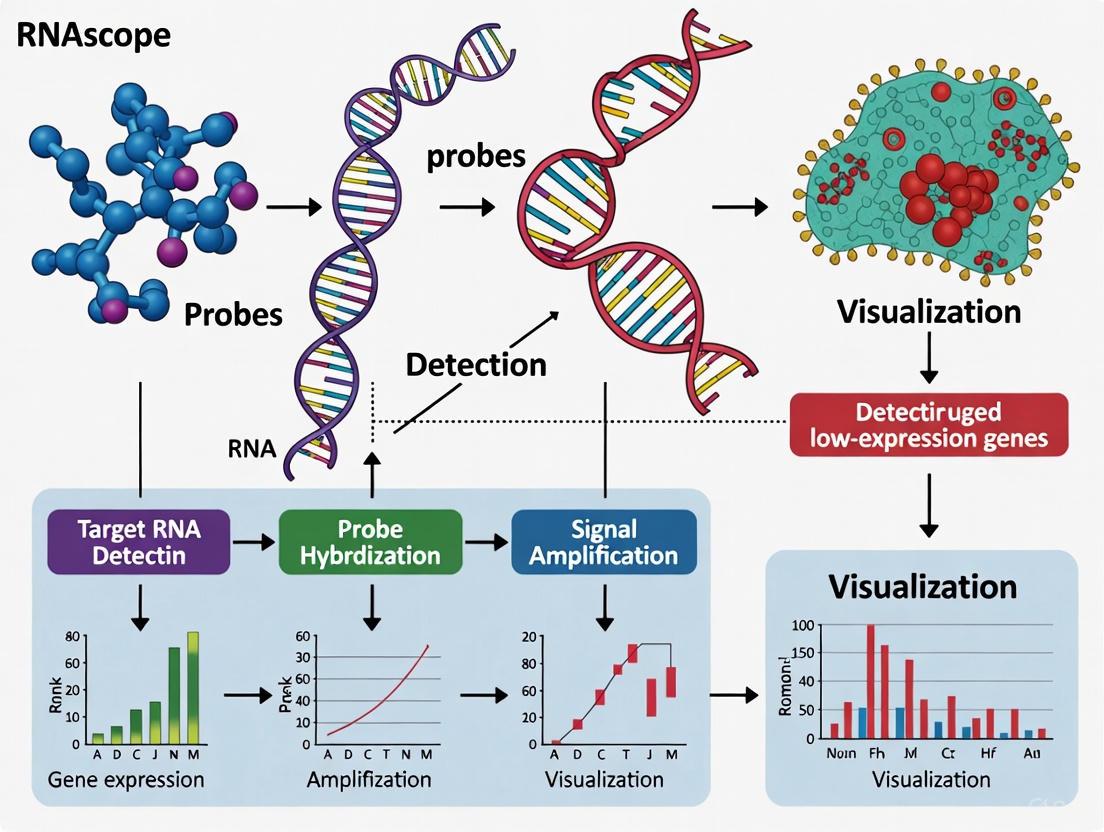
The RNAscope in situ hybridization platform represents a revolutionary advance in molecular pathology, enabling highly sensitive and specific visualization of target RNA within intact cells and tissues. For research on low-expression genes, a persistent challenge in biomedical science, the core technology—comprising the proprietary ZZ probe design and a sophisticated signal amplification chemistry—provides the single-molecule sensitivity required for reliable detection. This technical guide details the mechanics of this technology, its application in experimental protocols, and its critical role in facilitating robust, quantitative spatial gene expression analysis for researchers and drug development professionals.
The accurate localization and quantification of low-abundance RNA transcripts within their morphological context has long been a significant hurdle in molecular biology. Traditional RNA in situ hybridization (ISH) methods often lack the sensitivity and specificity required to detect these targets reliably, especially in formalin-fixed, paraffin-embedded (FFPE) tissues where RNA is frequently degraded or cross-linked. The RNAscope technology was developed specifically to overcome these limitations. Its unique dual Z (ZZ) probe design and hybridization-based signal amplification system work in concert to amplify target-specific signals while effectively suppressing background noise, enabling the detection of low-copy RNA targets with single-molecule precision [1] [2]. This capability is indispensable for research areas such as biomarker validation, characterization of cellular heterogeneity in tumors, and assessing the efficacy of oligonucleotide therapies [3].
Core Technology Mechanics
The ZZ Probe Design Strategy
The foundation of RNAscope's performance is its novel "ZZ" probe design. This architecture is engineered to generate a specific binding site only when the probe correctly hybridizes to its intended target, thereby minimizing non-specific background.
Probe Structure: Each target probe is a single oligonucleotide composed of three distinct regions [1] [4]:
- The "bottom" is an 18-25 base sequence complementary to the target RNA.
- A spacer sequence links the two hybridizing regions.
- The "tail" is a 14-base sequence (conceptualized as "Z") that serves as a binding platform for the preamplifier.
The Double-Z Principle: A minimum of two probes (a "ZZ pair") must bind contiguously to the target RNA—a statistically improbable event for non-specific hybridization. The two 14-base "Z" tails from the adjacent probes together form a single 28-base hybridization site for the preamplifier molecule [1]. This requirement is the primary mechanism for the technology's high specificity.
Design for Robustness: For a standard RNAscope probe targeting an mRNA over 300 bases, the design typically includes 20 ZZ pairs spanning approximately 1000 bases of the target sequence [4] [5]. This redundancy ensures consistent signal generation even if there is partial target inaccessibility or degradation, a critical feature for working with challenging FFPE samples [1].
Signal Amplification and Background Suppression
Following the specific hybridization of ZZ probes, a sequential, hybridization-mediated amplification cascade is initiated. This process is similar to branched DNA (bDNA) methods but is uniquely constrained by the double-Z requirement [1].
Table 1: Signal Amplification Cascade Components
| Component | Function | Binding Site | Result |
|---|---|---|---|
| Preamplifier | Binds to the 28-base site formed by a ZZ pair. | 1 site per ZZ pair | Anchors the amplification tree. |
| Amplifier | Binds multiple copies to the preamplifier. | 20 sites per preamplifier | Dramatically increases labeling capacity. |
| Label Probe | Conjugated to enzymes or fluorophores; binds to the amplifier. | 20 sites per amplifier | Generates the detectable signal. |
The theoretical maximum amplification is profound: each ZZ pair can bind one preamplifier, which can bind 20 amplifiers, each of which can subsequently bind 20 label probes. Therefore, a single ZZ pair can yield 400 label molecules. With 20 ZZ pairs targeting a single RNA molecule, a theoretical maximum of 8,000 labels can be accumulated [1]. In practice, the signal appears as a discrete, punctate dot, with each dot representing a single RNA molecule [5]. The number of dots is quantified, not the signal intensity, for semi-quantitative analysis.
Application for Low-Expression Gene Research
Assay Selection and Optimization for Sensitivity
To maximize the detection of low-expression genes, specific RNAscope assays and configurations are recommended. The RNAscope 2.5 HD Brown Reagent Kit is explicitly "designed to provide more intense Diaminobenzidine (DAB) staining when low copy target gene expression is anticipated (1–20 copies per cell)" [6] [7]. This High Definition (HD) version is noted as the most sensitive chromogenic RNA ISH method [6].
The selection of positive control probes is a critical step in qualifying a sample for low-expression analysis. ACD provides several housekeeping gene probes with varying expression levels to match the expected abundance of the target [8] [5]:
- Low-copy controls: PPIB (10-30 copies/cell) or POLR2A (5-15 copies/cell) are ideal benchmarks for low-expression targets.
- High-copy control: UBC can be used to verify overall tissue RNA integrity.
A successful assay for low-expression targets requires that the positive control (e.g., PPIB) generates a score of ≥2 and the negative control (bacterial dapB) has a score of 0, indicating minimal background [8].
Quantitative Scoring of Low-Abundance Signals
The RNAscope assay uses a semi-quantitative scoring system based on counting discrete dots per cell, which directly correlates with RNA copy number [8] [1]. For low-expression genes, the focus is on the lower end of this scoring spectrum.
Table 2: RNAscope Scoring Guidelines for Low-Expression Analysis
| Score | Criteria (Dots per Cell) | Interpretation for Low-Expression Genes |
|---|---|---|
| 0 | No staining or <1 dot/10 cells | Target not detected. |
| 1 | 1-3 dots/cell | Positive, low expression. Critical range for low-abundance targets. |
| 2 | 4-9 dots/cell; very few clusters | Positive, moderate expression. |
| 3 | 10-15 dots/cell; <10% in clusters | Positive, high expression. |
| 4 | >15 dots/cell; >10% in clusters | Positive, very high expression. |
When interpreting results, researchers should note that variation in dot intensity or size reflects the number of ZZ probes bound to a target molecule, but the critical quantitative measure remains the number of dots, not their characteristics [5].
Detailed Experimental Protocol for FFPE Tissues
The following protocol for the manual RNAscope 2.5 HD Brown Assay on FFPE tissues is critical for achieving optimal results with low-expression genes [8] [1] [5].
Sample Preparation and Pretreatment
- Sectioning: Cut FFPE tissue samples at 5 ± 1 μm thickness and mount on Superfrost Plus slides, which are required to prevent tissue detachment [8] [5].
- Deparaffinization and Dehydration: Deparaffinize slides in xylene, followed by dehydration in a series of fresh ethanol baths. The use of fresh reagents is mandatory to prevent assay failure [8] [5].
- Antigen Retrieval: Boil slides in citrate buffer (pH 6) for 15 minutes using a hot plate. A key deviation from IHC protocols is that no cooling is required; slides should be transferred directly to room-temperature water immediately after boiling [8] [5].
- Protease Digestion: Treat slides with protease (e.g., 10 μg/mL) for 30 minutes at 40°C to permeabilize the tissue. Maintaining the correct temperature during this step is crucial for accessing the target RNA without destroying tissue morphology [8] [1].
Probe Hybridization and Amplification
All hybridization and amplification steps are performed at 40°C in a HybEZ Oven, which maintains optimum humidity and temperature, preventing slides from drying out [8] [5].
- Probe Hybridization: Apply target probes, warmed to 40°C to resolute any precipitation, to the sections and incubate for 2 hours.
- Signal Amplification: Perform sequential 30-minute incubations with the preamplifier, amplifier, and label probe (HRP-conjugated), with stringent washes between each step.
- Chromogenic Development: Develop the signal using DAB, resulting in a brown, punctate stain.
- Counterstaining and Mounting: Counterstain with Gill's Hematoxylin (diluted 1:2 is suggested) [8]. Dehydrate and mount slides using xylene-based mounting media (e.g., CytoSeal XYL) as required for the Brown assay [8].
The Scientist's Toolkit: Essential Research Reagent Solutions
The following materials are essential for successfully implementing the RNAscope assay for low-expression gene research [8] [6] [5].
Table 3: Essential Reagents and Materials for RNAscope Assay
| Item | Function/Importance | Specific Recommendation |
|---|---|---|
| RNAscope 2.5 HD Brown Kit | Provides all reagents for pretreatment, detection, and signal amplification. Optimized for low-copy targets (1-20 copies/cell). | Catalog No. 322230 [6] [7] |
| Target & Control Probes | Species-specific probes for the gene of interest and essential controls. | Use C1 channel probes for single-plex; include PPIB/POLR2A (positive) and dapB (negative) [8] [5] |
| HybEZ Hybridization System | Oven that maintains precise temperature (40°C) and humidity during hybridization. Mandatory to prevent slide drying and ensure proper assay performance. | N/A [8] [5] |
| ImmEdge Hydrophobic Barrier Pen | Creates a barrier to contain reagents on the slide. The only pen validated to maintain its barrier throughout the entire procedure. | Vector Laboratories Cat. No. 310018 [8] [5] |
| Superfrost Plus Slides | Specific slides required to ensure tissue adhesion throughout the stringent assay steps. Other slide types may result in detachment. | Fisher Scientific [8] [5] |
| Mounting Media | For permanent preservation of stained slides. Must be selected based on the assay type. | CytoSeal XYL (for Brown assay) or EcoMount/PERTEX (for Red assay) [8] |
Key Advantages Over Traditional ISH and IHC for Low-Expression Targets
Accurately detecting low-expression genes represents a significant technical challenge in molecular pathology and research. Traditional techniques often fail to provide the sensitivity and specificity required for reliable detection of targets expressed at low levels (typically 3-15 copies per cell), compromising data quality in critical applications ranging from biomarker validation to therapeutic development [9]. The inherent limitations of conventional in situ hybridization (ISH) and immunohistochemistry (IHC) become particularly pronounced with these challenging targets. Traditional RNA ISH suffers from insufficient sensitivity and high background noise, while IHC struggles with antibody validation and batch-to-batch variability [10] [11]. This technical gap hinders progress in understanding subtle but biologically important gene expression patterns. RNAscope technology emerges as a transformative solution, offering a novel signal amplification and background suppression approach that enables single-molecule visualization in intact tissue contexts, thereby overcoming the critical limitations of traditional methods for low-expression targets [12].
Technical Comparison: RNAscope Versus Traditional Methods
Fundamental Limitations of Traditional Approaches
Traditional RNA ISH relies on single-probe hybridization with direct label conjugation, typically using digoxigenin (DIG) or radioactive labels. This approach generates substantial non-specific binding and consequent background noise, which obscures the detection of low-abundance RNA molecules [10]. The technique cannot reliably detect anything beyond highly expressed genes and lacks the requisite specificity for precise cellular localization of low-copy transcripts [10] [12].
Immunohistochemistry faces different but equally limiting challenges for low-expression targets. IHC detects proteins rather than RNA, introducing discordance due to post-transcriptional regulation that decouples mRNA and protein abundance [10]. Furthermore, IHC is plagued by antibody validation issues, batch-to-batch variability, and limited target availability, especially for novel biomarkers [11]. One systematic review noted a disappointingly low concordance rate (58.7-95.3%) between IHC and RNA-based detection methods, highlighting the fundamental disconnect between these measurement approaches [10].
The RNAscope Technological Breakthrough
RNAscope employs a patented double-Z probe design that fundamentally differs from traditional ISH. This design requires two independent "Z" probes to bind adjacent sequences on the same target RNA molecule before signal amplification can initiate [10] [13]. This paired-probe system virtually eliminates false-positive signals from non-specific binding. The subsequent hybridization of a pre-amplifier and amplifier structure enables massive signal amplification—up to 8,000-fold enhancement—allowing visualization of individual RNA molecules as distinct dots under microscopy [10].
Table 1: Quantitative Performance Comparison of Detection Techniques
| Technique | Sensitivity | Specificity | Concordance with PCR | Single-Molecule Detection | Background Noise |
|---|---|---|---|---|---|
| RNAscope | Very High (100%) | Very High (100%) | 81.8-100% [10] | Yes [12] | Minimal [12] |
| Traditional ISH | Low-Moderate | Low-Moderate | Not Reported | No | High [10] |
| IHC | Variable | Variable | 58.7-95.3% [10] | No | Variable [11] |
| qRT-PCR | High | High | Reference Method | No | Not Applicable |
For low-expression targets specifically, RNAscope offers single-molecule sensitivity while preserving crucial spatial context that is lost in grind-and-bind methods like qRT-PCR [12]. This combination of sensitivity and morphological preservation enables researchers to detect rare transcripts and quantify them at the cellular level, even in heterogeneous tissue samples where expression patterns vary between cell types [13].
RNAscope Mechanism for Enhanced Low-Expression Detection
Proprietary Signal Amplification and Background Suppression
The exceptional performance of RNAscope for low-expression targets stems from its unique probe design and amplification hierarchy. Each "Z" probe consists of three elements: a target-specific hybridization region, a linker spacer, and a tail sequence for amplifier binding [10]. The requirement for dual-probe binding before amplification initiation provides the foundation for exceptional specificity, as off-target binding rarely occurs in the precise spatial configuration needed for amplifier hybridization.
Following successful Z-probe pair binding, a pre-amplifier molecule attaches to the probe tails, creating a scaffolding for multiple amplifier molecules [10]. Each amplifier subsequently binds numerous label probes conjugated with chromogenic or fluorescent reporters. This cascading amplification system generates sufficient signal to visualize individual transcripts while maintaining the discrete dot-like representation that enables precise quantification [12].
Diagram 1: The RNAscope dual Z-probe mechanism enables specific detection and significant signal amplification for low-expression targets. This process allows visualization of individual RNA molecules that would be undetectable with traditional ISH methods.
Experimental Validation with Appropriate Controls
For low-expression targets, implementing rigorous controls is paramount. RNAscope protocols recommend using positive control probes matched to the expected expression level of the target. For low-expression targets (3-15 copies per cell), Polr2A serves as an appropriate positive control, while PPIB (10-30 copies per cell) is suitable for moderately expressed targets [9]. The bacterial dapB gene provides a negative control to confirm absence of background staining [9] [8].
Analysis of RNAscope results focuses on quantifying discrete dots rather than signal intensity, with each dot representing an individual RNA molecule [10] [8]. This direct correlation between signal count and transcript copy number enables precise quantification of low-expression targets that would appear as ambiguous weak staining in IHC or non-specific signals in traditional ISH.
Table 2: Essential Research Reagent Solutions for Low-Expression Targets
| Reagent Category | Specific Examples | Function in Low-Expression Detection |
|---|---|---|
| Positive Control Probes | Polr2A (3-15 copies/cell), PPIB (10-30 copies/cell) [9] | Validate assay sensitivity for low-copy targets; monitor RNA integrity |
| Negative Control Probes | dapB (bacterial gene) [9] [8] | Confirm absence of background staining; essential for low-signal scenarios |
| Detection Kits | RNAscope 2.5 HD Reagent Kit-BROWN [6] | Enhanced sensitivity for targets expressing 1-20 copies per cell |
| Tissue Preparation | FFPE, Fresh Frozen, Fixed Cells [10] | Preserve RNA integrity while maintaining tissue morphology |
| Analysis Software | Halo, QuPath, Aperio [10] | Quantitative dot counting for precise low-copy quantification |
Implementation Guidelines for Low-Expression Targets
Optimized Experimental Protocol
Successful detection of low-expression targets requires meticulous attention to tissue preparation and protocol optimization. The following workflow has been specifically validated for challenging targets:
Tissue Preparation: Use fresh 10% neutral buffered formalin for fixation (16-32 hours) followed by standard paraffin embedding [8]. Superfrost Plus slides are essential to prevent tissue detachment during stringent heating steps [8].
Pretreatment Optimization: Employ target retrieval conditions appropriate for your tissue type. For automated systems, standard conditions include 15 minutes Epitope Retrieval 2 (ER2) at 95°C followed by 15 minutes Protease digestion at 40°C [8]. For over-fixed tissues, increase ER2 time in 5-minute increments and Protease time in 10-minute increments [8].
Hybridization and Amplification: Use the RNAscope HD 2.5 assay for maximum sensitivity with low-expression targets [6]. Maintain precise temperature control (40°C) during hybridization steps using the HybEZ system [8]. Ensure all amplification steps are performed in correct sequence without omission.
Signal Detection and Microscopy: For brightfield detection, use diaminobenzidine (DAB) with careful timing to optimize signal-to-noise ratio [6]. For fluorescent detection, select high-quantum-yield fluorophores and appropriate filter sets.
Scoring and Quantification Methodology
The recommended scoring system for RNAscope is specifically designed to accommodate varying expression levels, including low-abundance targets [8]:
- Score 0: No staining or <1 dot per 10 cells
- Score 1: 1-3 dots per cell (visible but low expression)
- Score 2: 4-9 dots per cell, few or no dot clusters
- Score 3: 10-15 dots per cell, <10% dots in clusters
- Score 4: >15 dots per cell, >10% dots in clusters [8]
For low-expression targets (typically scoring 1-2), analysis should focus on dot counting per cell rather than intensity measurements. Software-assisted quantification using platforms such as Halo or QuPath significantly improves accuracy and reproducibility for these subtle signals [10].
Research Applications and Validation Studies
Integration with Complementary Techniques
RNAscope can be effectively combined with IHC to correlate transcript localization with protein expression in the same tissue section, providing particularly valuable insights for low-expression targets where discordance might occur. Studies have successfully demonstrated simultaneous detection of RNA and protein in thicker tissue sections (14μm) while preserving signal integrity for both detection methods [13].
This combined approach is especially powerful for validating antibody specificity when working with low-abundance targets. As noted in one publication, "Researchers are no longer limited to investigating only targets with available antibodies, they routinely apply RNAscope ISH to targets with no antibodies or poor-quality antibodies" [11]. This capability is transformative for novel biomarker development.
Validation in Complex Tissue Environments
In neural tissue applications, RNAscope has enabled cell-type-specific quantification of low-abundance inflammatory genes including IL-1β and NLRP3 within microglia and neurons [13]. This demonstrates the technology's capacity to detect subtle expression changes in complex cellular environments—a scenario where traditional IHC often produces ambiguous or non-specific staining.
The technology has similarly proven effective in cancer research for detecting low-level viral transcripts, heterogeneous biomarker expression, and rare cell populations within tumors [14]. The preservation of morphological context allows researchers to distinguish genuine low-level expression from technical artifacts, providing confidence in data interpretation for these challenging targets.
RNAscope technology represents a significant advancement over traditional ISH and IHC for detecting low-expression targets, offering unparalleled sensitivity, specificity, and morphological context. The unique dual-Z probe design with signal amplification enables researchers to reliably visualize and quantify transcripts expressed at as few as 3-15 copies per cell—a capability largely beyond the reach of conventional methods. As research increasingly focuses on subtle gene expression changes in development, disease pathogenesis, and therapeutic response, RNAscope provides the technical foundation for robust investigation of these biologically significant but technically challenging targets. With appropriate controls, optimized protocols, and quantitative analysis methods, researchers can confidently apply this technology to advance understanding of low-expression genes across diverse research contexts.
In the field of spatial genomics, accurately defining "low-expression" is critical for research and drug development. RNAscope technology enables precise detection and quantification of low-abundance RNA transcripts within the morphological context of tissue, achieving single-molecule sensitivity. This technical guide establishes the copy number ranges defining low-expression genes, details optimized experimental protocols for their reliable detection, and provides a standardized framework for data analysis. The robust performance of RNAscope for targets expressing as few as 1-3 copies per cell makes it an indispensable tool for biomarker discovery and validation in oncology, neuroscience, and infectious disease research.
RNAscope represents a major advance over traditional in situ hybridization (ISH) methods, overcoming long-standing challenges of sensitivity and specificity. The technology's core innovation lies in its proprietary "double Z" probe design, which allows for simultaneous signal amplification and background suppression. This design requires two independent "Z" probes to bind in tandem to the target RNA before signal amplification can proceed, making non-specific amplification of off-target sequences highly improbable [12] [15]. Each target RNA molecule is visualized as a distinct punctate dot under a standard microscope, enabling true single-molecule detection and direct quantification of transcript abundance [16] [17]. This robust signal-to-noise ratio is maintained even in formalin-fixed, paraffin-embedded (FFPE) tissue specimens, which are notoriously challenging for RNA analysis due to nucleic acid fragmentation and cross-linking [12].
The definition of "low-expression" must be considered within both technological and biological contexts. Technologically, low-expression refers to transcript abundances approaching the detection limit of the assay. Biologically, these transcripts often include key regulatory genes, receptors, and ligands that exert potent cellular effects despite low copy numbers. RNAscope is specifically engineered to detect these critical low-abundance targets with high confidence, typically achieving detection of individual RNA molecules with single-cell resolution [15]. The platform's 20ZZ probe design provides redundancy against partial target RNA degradation, ensuring consistent detection even in suboptimal samples where traditional ISH methods would fail [15].
Quantitative Framework for Low-Expression Genes
RNAscope Scoring System and Copy Number Correlation
The RNAscope assay employs a semi-quantitative scoring system that correlates directly with approximate RNA copy numbers per cell. This standardized framework is essential for consistently defining and communicating expression levels across experiments and research groups. The scoring system focuses on counting discrete punctate dots rather than assessing signal intensity, as each dot corresponds to an individual RNA molecule [8] [17].
Table 1: RNAscope Scoring Guidelines and Corresponding Copy Number Ranges
| Score | Dots per Cell Criteria | Approximate Copies per Cell | Expression Category |
|---|---|---|---|
| 0 | No staining or <1 dot/10 cells | <0.1 | Undetectable |
| 1 | 1-3 dots/cell | 1-3 | Low |
| 2 | 4-9 dots/cell; none or very few dot clusters | 4-9 | Moderate |
| 3 | 10-15 dots/cell; <10% dots in clusters | 10-15 | High |
| 4 | >15 dots/cell; >10% dots in clusters | >15 | Very High |
For low-expression genes, scores of 0 and 1 are particularly relevant. A score of 1 (1-3 dots/cell) defines the minimal confirmed expression level for a detectable signal above background [8]. This range is critical for detecting genes with important biological functions despite low transcript abundance. The low-end detection limit is approximately 1 copy per cell, though statistical confidence increases with multiple cells showing consistent signal. Targets falling into score 0 (<1 dot per 10 cells) are considered undetectable under standard assay conditions, though this may reflect either genuine absence or expression below the technical detection threshold.
Control Probes for System Validation
Proper validation of the scoring system requires appropriate control probes. The positive control housekeeping genes provide reference points for different expression levels: PPIB (Cyclophilin B) represents low-copy genes (10-30 copies per cell), POLR2A represents very low-copy genes (5-15 copies per cell), while UBC represents high-copy genes [8]. Successful assay performance requires PPIB/POLR2A scores ≥2 or UBC scores ≥3 with relatively uniform signal throughout the sample, alongside negative control bacterial dapB scores of <1, indicating minimal background [8] [18].
RNAscope Technology Workflow and Mechanism
The exceptional sensitivity of RNAscope for low-expression genes stems from its proprietary probe design and signal amplification system. Understanding this mechanism is crucial for proper experimental design and data interpretation.
The RNAscope workflow employs a cascade of hybridization events that enables single-molecule detection. First, specially designed "double Z" target probes hybridize to the RNA target. Each probe pair consists of two 18-25 base regions complementary to the target RNA, spacer sequences, and 14-base tail sequences that form a binding site when the probes hybridize in tandem [15]. This double Z structure is fundamental to the technology's specificity—single probes binding nonspecifically cannot initiate amplification. Next, pre-amplifiers hybridize to the 28-base binding site formed by each double Z probe pair. Amplifiers then bind to multiple sites on each pre-amplifier, creating a branching structure. Finally, labeled probes containing chromogenic enzymes or fluorescent molecules bind to the numerous sites on each amplifier, generating a detectable signal [15]. This multi-stage amplification creates approximately 800-1000 labels for each initial binding event, enabling visualization of individual RNA molecules as distinct dots under standard microscopy [15].
Essential Reagents and Materials
Successful detection of low-expression genes requires specific reagents and materials optimized for the RNAscope platform. Deviations from recommended materials can significantly impact sensitivity and specificity.
Table 2: Essential Research Reagent Solutions for RNAscope Detection of Low-Expression Genes
| Item | Function | Critical Specifications |
|---|---|---|
| RNAscope Target Probes | Target-specific detection | ~20 double Z probe pairs; C1 and C2 channels for duplex assays [19] |
| HybEZ Hybridization System | Maintains optimum humidity and temperature | Required for hybridization steps; prevents slide drying [8] |
| Superfrost Plus Slides | Tissue adhesion | Prevents tissue detachment; other slide types may fail [8] [18] |
| ImmEdge Hydrophobic Barrier Pen | Creates reagent containment | Maintains hydrophobic barrier throughout procedure; specific brand required [8] |
| Control Probes (PPIB, dapB) | Assay validation | PPIB (positive, 10-30 copies/cell); dapB (negative, bacterial) [8] [18] |
| Pretreatment Kit | RNA unmasking and permeabilization | Critical for FFPE samples; includes antigen retrieval and protease steps [15] [18] |
| Mounting Media | Slide preservation | Xylene-based for Brown assay; EcoMount or PERTEX for Red assay [8] |
Additional specialized reagents are required for duplex assays that enable simultaneous detection of two low-expression targets. The RNAscope 2.5 HD Duplex Assay utilizes HRP-based Green and AP-based Fast Red chromogens to generate distinct green and red signals for two different RNA targets [19]. This multiplexing capability is particularly valuable for studying co-regulation of low-expression genes or identifying cell types expressing rare transcripts. For automated platforms, specific detection kits must be used—Bond Polymer Refine Detection for Brown assays and Bond Polymer Refine Red Detection for Red assays on the Leica BOND RX system, with no substitutions recommended [8].
Experimental Protocol for Low-Expression Targets
Sample Preparation Guidelines
Optimal sample preparation is paramount for successful detection of low-expression genes. For FFPE tissues, specimens should be fixed in fresh 10% neutral-buffered formalin (NBF) for 16-32 hours at room temperature [8] [18]. Under-fixation can lead to RNA degradation, while over-fixation may mask epitopes and reduce signal. Fixed tissues should be dehydrated in graded ethanol and xylene series, then infiltrated with paraffin at temperatures not exceeding 60°C. Tissue sections should be cut at 5±1μm thickness and mounted on Fisher Scientific SuperFrost Plus slides to prevent detachment during the rigorous hybridization procedure [18]. Sections should be analyzed within three months of preparation when stored at room temperature with desiccant [18].
Pretreatment Optimization
Pretreatment conditions often require optimization, particularly for suboptimal samples. The standard RNAscope pretreatment includes two critical steps: antigen retrieval (termed "Pretreat 2") and protease digestion. For tissues fixed according to recommendations, standard conditions (15 minutes ER2 at 95°C and 15 minutes Protease at 40°C for automated systems) typically suffice [8]. For over-fixed tissues, increase the ER2 time in 5-minute increments and Protease time in 10-minute increments while maintaining standard temperatures (e.g., 20 minutes ER2 at 95°C and 25 minutes Protease at 40°C) [8]. Under-fixed tissues may require reduced protease treatment. Always include control probes to validate pretreatment efficacy.
Hybridization and Detection
The hybridization protocol must be followed precisely without modification. Key considerations for low-expression targets include warming probes and wash buffer to 40°C to resolubilize precipitates that may form during storage [8]. Maintain adequate humidity in the Humidity Control Tray throughout the procedure, as drying of slides is a common cause of failure. Apply all amplification steps in the correct sequence, as skipping any step will result in no signal [8]. For low-expression targets, ensure the hydrophobic barrier remains intact throughout the procedure to prevent localized drying and inconsistent staining.
Controls and Validation
Robust experimental design for low-expression targets requires extensive controls. Always run positive control probes (PPIB, POLR2A, or UBC) and negative control probes (dapB) alongside your target of interest [8] [18]. Use species-specific control slides provided by ACD (Human Hela Cell Pellet Cat. No. 310045 or Mouse 3T3 Cell Pellet Cat. No. 310023) to validate overall assay performance [8]. Successful staining should yield PPIB/POLR2A scores ≥2 or UBC scores ≥3 with relatively uniform signal distribution, alongside dapB scores <1 indicating acceptable background [18].
Data Analysis Strategies for Low-Expression Scenarios
Homogeneous Low Expression
When target expression is homogeneously low across a particular cell type, the overall expression level can be assessed by measuring the average number of dots per cell across the entire cell population [17]. This can be achieved through semi-quantitative histological scoring following the standard RNAscope scoring guidelines (Methodology #1) or through image-based quantitative software analysis (Methodology #2) [17]. For low-expression targets scoring 1-3 dots per cell, analysis should focus on confirmation of signal above background rather than precise quantification of small expression differences.
Heterogeneous Low Expression
For targets displaying heterogeneous expression where only a subpopulation of cells expresses the target at low levels, both the expression level and the percentage of positive cells should be determined [17]. The dynamic range of expression can be quantified by binning cells with different expression levels into separate categories (ACD scores 0-4). The data can be presented as a histogram representing expression distribution or calculated as a Histo score (H-score) using the formula: H-score = Σ (ACD score × percentage of cells per bin) [17]. This approach is particularly valuable for detecting rare positive cells against a background of negative cells.
Rare Cell Detection
When the target is expressed in a rare cell population, identifying the number of positive cells is typically more relevant than the average expression level per cell [17]. In this scenario, analysis should focus on the percentage of cells showing any detectable signal (≥1 dot/cell) rather than the average dot count across all cells. This approach maximizes sensitivity for detecting rare expressing cells that might be missed by population-averaged measurements.
The RNAscope platform provides unprecedented sensitivity for detecting low-expression genes, with a well-defined detection limit of approximately 1 copy per cell. The standardized scoring system categorizes low-expression as 1-3 dots per cell (Score 1), providing a consistent framework for reporting results across studies. The technology's unique double Z probe design and cascade amplification system enable this exceptional sensitivity while maintaining high specificity through built-in background suppression. Following optimized sample preparation protocols, utilizing recommended reagents, implementing appropriate controls, and applying tailored analysis strategies for different expression scenarios are all critical for reliable detection and quantification of low-abundance transcripts. As spatial genomics continues to advance, precisely defining and detecting low-expression genes will remain essential for understanding gene regulation, cellular heterogeneity, and disease mechanisms at the molecular level.
The integrity of ribonucleic acid (RNA) is a foundational pillar for successful gene expression analysis, particularly in the burgeoning field of spatial transcriptomics and the detection of low-expression genes. The choice of tissue preservation method is therefore not merely a logistical consideration but a critical determinant of experimental outcomes. Formalin-Fixed Paraffin-Embedded (FFPE) and Fresh Frozen (FF) tissues represent the two most prevalent archival methodologies, each with distinct advantages and compromises for RNA preservation. This whitepaper provides an in-depth technical guide to the sample compatibility of FFPE and FF tissues, framed within the context of utilizing the RNAscope in situ hybridization (ISH) platform for sensitive RNA detection. The objective is to equip researchers and drug development professionals with the data and protocols necessary to make informed decisions that align with their specific research questions and material constraints.
Fundamental Characteristics of FFPE and Fresh Frozen Tissues
The core differences between FFPE and FF tissues stem from their fundamental preservation mechanisms, which directly impact nucleic acid quantity, quality, and usability.
Fresh Frozen (FF) Tissues
This method employs cryopreservation, where biopsy specimens are rapidly cooled, often by immersion in liquid nitrogen, and stored at -80°C. This "snap-freezing" process halts cellular metabolism and enzymatic activity instantly.
- RNA Quality: If performed correctly, this process perfectly preserves nucleic acids, making FF tissue the established gold standard for next-generation sequencing (NGS) and other RNA-based assays [20]. RNA derived from FF tissues is typically intact and of high quality.
- Practical Hurdles: The primary disadvantages are logistical and economic. It requires immediate access to liquid nitrogen and -80°C freezers near the site of tissue collection, which is not always feasible in a clinical setting [20]. Furthermore, maintaining these archives is costly and demanding, with collections being vulnerable to power failures or human error [20].
Formalin-Fixed Paraffin-Embedded (FFPE) Tissues
This method uses formalin to cross-link biomolecules, preserving tissue morphology exceptionally well for pathological examination. The tissue is then dehydrated, cleared, and embedded in a paraffin block for long-term storage at room temperature.
- RNA Quality: The formalin fixation process introduces significant challenges for molecular biology. It causes fragmentation of DNA and RNA and induces cross-linking to proteins, which can negatively impact downstream applications [20]. RNA extracted from FFPE samples is typically degraded.
- Overwhelming Advantage: The most significant advantage of FFPE samples is their unparalleled availability. They are routinely collected and archived globally during patient care, with an estimated 400 million to over a billion samples stored in hospitals and biobanks worldwide [20]. Many of these samples are linked to detailed clinical outcomes, making them an indispensable resource for large-scale retrospective studies [20].
Table 1: Core Characteristics of FFPE and Fresh Frozen Tissues
| Feature | FFPE | Fresh Frozen (FF) |
|---|---|---|
| Preservation Method | Formalin cross-linking, paraffin embedding | Snap-freezing in liquid nitrogen, storage at -80°C |
| Primary Advantage | Vast archives, room-temperature storage, rich clinical data | High-quality, intact RNA (Gold Standard) |
| Primary Disadvantage | Fragmented and cross-linked RNA | Complex, costly, and logistically challenging storage |
| Ideal Use Case | Retrospective studies, clinical diagnostics, biomarker discovery | Prospective studies, NGS, applications requiring high-quality RNA |
Quantitative Data Comparison for RNA Analysis
The suitability of a sample type is ultimately measured by the quality of the data it generates. Comparative studies reveal how FFPE-derived data measures against the FF gold standard.
Next-Generation Sequencing (NGS) Performance
With optimized protocols, NGS data from FFPE samples can closely match that from FF tissues. One study comparing whole exome sequencing (WES) from matched FFPE and FF lung adenocarcinoma tumors demonstrated robust detection of alterations in FFPE-derived DNA [20]. Similarly, for RNA-Seq, optimized pipelines have enabled the use of FFPE breast cancer tissues to distinguish between molecular subtypes, with gene expression data confirming to public databases generated from fresh tissues [20]. Lexogen's internal experiments showed a significant overlap in detected protein-coding genes between FF and FFPE mouse tissues, and comparable percentages of uniquely mapped reads [20].
RNAscope Signal Integrity in Archived Tissues
RNAscope's unique probe design makes it particularly resilient to RNA fragmentation. However, signal intensity in FFPE tissues is still subject to archival duration. A 2025 systematic study on breast cancer samples quantified this effect using RNAscope multiplex fluorescent assays on four house-keeping genes (HKGs) [21].
The study confirmed that the number of RNAscope signals in FFPE tissues is lower than in FFT in an archival duration-dependent fashion. Notably, RNA degradation in FFPE samples was most pronounced in high-expressor HKGs (UBC, PPIB) compared to low-to-moderate expressors (POLR2A, HPRT1) [21]. This proves that although RNAscope probes are designed to detect fragmented RNA, performing a sample quality check using HKGs is strongly recommended to ensure accurate results [21].
Table 2: Quantitative Comparison of RNA Analysis Performance
| Analysis Type | Performance Metric | FFPE | Fresh Frozen |
|---|---|---|---|
| RNA-Seq (Lexogen) | Overlap in detected protein-coding genes (Mouse liver/colon) | Significant overlap with FF | Gold standard reference [20] |
| RNA-Seq (Lexogen) | Percentage of uniquely mapped reads | Comparable to FF | Comparable to FFPE [20] |
| RNAscope (Breast Cancer) | Signal intensity for high-expressor genes (UBC, PPIB) | Lower, degrades with archival time [21] | Higher, better preserved [21] |
| RNAscope (Breast Cancer) | Signal intensity for low/moderate genes (POLR2A, HPRT1) | More stable over time [21] | High and stable [21] |
| Whole Transcriptome Sequencing (Cardiac Tissue) | Correlation of protein-coding transcripts | ρ > 0.94 with fresh [22] | ρ > 0.94 with FFPE [22] |
RNAscope Technology: Principles and Protocols
RNAscope is a novel ISH technology that represents a paradigm shift for RNA detection in FFPE tissues, offering a level of sensitivity and specificity that overcomes many of the traditional limitations associated with degraded RNA.
Underlying Principle and Workflow
The technology employs a unique double "Z" probe design [10]. Each target RNA is detected by a set of probe pairs that hybridize to the same RNA molecule. The signal amplification cascade only initiates if both "Z" probes bind in close proximity, ensuring near 100% specificity and suppressing background noise [10] [12]. This is followed by a proprietary amplification steps, achieving up to 8000-fold signal amplification per target, which enables single-molecule visualization [10]. This design allows RNAscope to detect partially degraded RNA molecules, making it exceptionally well-suited for FFPE samples [10] [23].
Diagram 1: RNAscope Signal Amplification Workflow. The process begins with (1) target mRNA, followed by (2) specific hybridization of double "Z" probes, (3) binding of the preamplifier, (4) binding of multiple amplifiers, and (5) conjugation of labeled probes for detectable signal.
Detailed Experimental Protocol for FFPE Tissues
The following protocol is adapted for FFPE sections, which is the most common sample type for RNAscope [24] [5].
Sample Preparation and Pretreatment:
- Sectioning: Cut 5 μm ± 1 μm sections and mount them on SuperFrost Plus slides [5].
- Baking: Bake slides at 60°C for 1 hour to ensure adhesion.
- Deparaffinization: Immerse slides in xylene followed by graded ethanol washes (100%, 100%, 70%) to remove paraffin.
- Antigen Retrieval: Perform heat-induced epitope retrieval in a specific retrieval solution at 98–102°C for 15 minutes. Critical: After boiling, place slides directly into room-temperature dH₂O; do not cool down [5].
- Protease Digestion: Treat slides with a specific protease for 30 minutes at 40°C in a HybEZ oven to permeabilize the tissue. This step is crucial for probe access [5].
Hybridization, Amplification, and Detection:
- Probe Hybridization: Apply the target probe mixture (e.g., for your gene of interest and control probes) to the tissue section and incubate for 2 hours at 40°C in the HybEZ oven [24] [5].
- Signal Amplification: Perform a series of sequential amplifier steps (Amp 1–6) as per the kit manual. It is critical to apply all amplification steps in the correct order and to not let the slides dry at any time [5].
- Signal Development: For fluorescent detection, apply fluorophore-conjugated labels. For chromogenic detection, apply the appropriate enzyme-based substrate.
- Counterstaining and Mounting: Counterstain with hematoxylin (chromogenic) or DAPI (fluorescent), and mount with a suitable aqueous mounting medium [24].
Controls: Always include a positive control probe (e.g., PPIB for moderate expression, POLR2A for low expression) to validate RNA integrity and a negative control probe (bacterial dapB) to confirm the absence of background noise [10] [5].
The Scientist's Toolkit: Essential Research Reagents
Successful implementation of RNAscope, particularly for challenging low-expression targets, relies on a set of core reagents and instruments.
Table 3: Essential Research Reagent Solutions for RNAscope
| Item | Function | Key Consideration |
|---|---|---|
| HybEZ II Oven | Provides precise humidity and temperature (40°C) control for hybridization. | A critical, mandatory instrument for the manual assay; not a standard hybridization oven [5]. |
| Target & Control Probes | Species-specific probes for genes of interest and quality control (PPIB, POLR2A, UBC, dapB). | Positive control probes are species-specific. Select based on target's expected expression level [5]. |
| RNAscope Kit Reagents | Contains all necessary solutions for the multi-step hybridization and amplification process. | Always use fresh reagents; never alter the protocol. Warm probes and wash buffer at 40°C to prevent precipitation [5]. |
| SuperFrost Plus Slides | Microscope slides with an adhesive coating. | Required for successful assay; other slide types may result in tissue detachment [5]. |
| ImmEdge Hydrophobic Pen | Creates a barrier around the tissue section to retain small volumes of reagent. | Essential for maintaining a hydrophobic barrier so tissues do not dry out during the procedure [5]. |
Strategic Implementation for Low-Expression Gene Research
Integrating the above considerations into a coherent research plan is key to leveraging RNAscope effectively for low-expression genes.
Sample Selection and Quality Control
- Prioritize Sample Availability: For retrospective studies or when exploring clinical correlations, FFPE samples are the only viable option. Their vast archives allow for powerful statistical analysis [20].
- Rigorously Quality-Check FFPE Samples: Never assume RNA integrity. Always run the RNAscope assay with a positive control probe (e.g., PPIB, POLR2A). A score of 2+ for RNAscope (on a scale of 0-4) alongside a negative control (dapB) score of 0 is required to confidently interpret results for your target gene [5]. This step is non-negotiable for low-expression targets.
- Exploit Long-Term FFPE Viability: RNAscope has been successfully applied to FFPE samples archived for over 25 years, demonstrating the remarkable resilience of this technology [23]. Do not discount older samples without testing.
Protocol Optimization and Experimental Design
- Multiplexing and Channel Assignment: RNAscope allows for multiplexed detection. Assign your low-abundance gene of interest to Channel 1 (C1), as it is the most sensitive. Assign higher abundance transcripts (e.g., cell-type markers) to other channels [24].
- Combine with Immunohistochemistry (IHC): RNAscope can be performed in conjunction with IHC on the same tissue section, allowing for the direct correlation of RNA expression with protein expression and cell identity within the tissue morphology [24].
- Utilize Automated Quantification: For objective and high-throughput analysis, use quantitative image analysis software (e.g., Halo, QuPath) to count RNA dots. This is crucial for generating robust, quantifiable data for low-expression genes, especially in heterogeneous tissues [10] [25].
The dichotomy between FFPE and fresh frozen tissues for RNA preservation is not a simple question of which is superior, but rather which is optimal for a given research context. For prospective studies where highest RNA integrity is paramount, fresh frozen remains the gold standard. However, for the vast and clinically rich landscape of retrospective, translational research, FFPE tissues are an invaluable and entirely viable resource. The advent of the RNAscope platform has been a game-changer, mitigating the historical limitations of FFPE-derived RNA through its exquisitely specific and sensitive ISH technology. By adhering to rigorous quality control, employing optimized protocols, and leveraging strategic experimental design, researchers can confidently utilize FFPE samples to unlock the secrets of low-expression genes, thereby accelerating discovery and drug development in personalized medicine.
Optimized Workflows for Low-Expression Genes: From Probe Selection to Multiplexing
The advent of RNAscope in situ hybridization (ISH) technology has revolutionized the detection of target RNA within intact cells, providing single-molecule sensitivity and morphological context [8] [26]. For researchers investigating low-expression genes—a critical endeavor in fields like cardiac regeneration, cancer biology, and neuroscience—strategic probe design and channel assignment are paramount. This technical guide details a framework for assigning scarce probe channels based on quantitative transcript abundance data, enabling researchers to optimize multiplexed RNAscope assays for the precise identification of low-expression targets amidst more abundantly expressed markers. By integrating principles of mixture modeling for transcript abundance classes [27] [28] with the robust RNAscope workflow [8], this guide provides a foundational strategy for enhancing the accuracy and reliability of spatial transcriptomic data within the broader thesis of low-expression gene research.
RNAscope Technology is a novel ISH assay based on a patented signal amplification and background suppression system that allows for single-molecule visualization of target RNA within intact cells while preserving tissue morphology [8] [26]. Its proprietary "double Z" probe design enables highly specific and sensitive detection, with each dot representing a single RNA transcript [26]. This robust signal-to-noise ratio is particularly crucial for detecting low-expression genes, which are often characterized by low reads per kilobase million (RPKM) and, in qPCR assays, high Ct values (typically above 30) with poor repeatability [29].
Transcriptional variation among individuals within a population can lead to the emergence of distinct transcript abundance classes (TACs). Mixture modeling approaches have identified that a significant proportion of transcripts (7-10%) exhibit bimodal or even multimodal abundance distributions across samples [27] [28]. The distribution of these minor TACs is often skewed toward low frequencies, reminiscent of the skew observed in genotype frequencies [28]. This structured variation underscores the necessity of a strategic approach to probe design and channel assignment in multiplexed assays to accurately capture and interpret expression data, especially for low-copy targets.
A Quantitative Framework for Probe Channel Assignment
In RNAscope multiplex assays, the limited availability of detection channels necessitates a prioritized assignment strategy. Channel assignment should be guided by the quantitative abundance of the target transcripts to minimize cross-talk and ensure reliable detection of low-expression genes. The following table provides a scoring system for transcript abundance, adapted from the RNAscope semi-quantitative scoring guidelines and TAC principles [8] [28].
Table 1: Transcript Abundance Classification and Probe Assignment Priority
| Abundance Category | RNAscope Score | Approximate Copies/Cell | Description | Probe Channel Assignment Priority |
|---|---|---|---|---|
| Very High | 4 | >15 | >15 dots/cell; >10% dots in clusters [8] | Low Priority (Assign to channel 1 (C1) if possible; can saturate signal) |
| High | 3 | 10-15 | 10-15 dots/cell; <10% dots in clusters [8] | Medium Priority |
| Moderate | 2 | 4-9 | 4-9 dots/cell; very few dot clusters [8] | Medium Priority |
| Low | 1 | 1-3 | 1-3 dots/cell [8] | High Priority (Requires optimal channel for clear detection) |
| Very Low / Rare | 0 | <1 (per 10 cells) | No staining or <1 dot per 10 cells [8] | Highest Priority (Needs most sensitive channel; validation is critical) |
This classification enables a systematic approach for designing a multiplex assay. The core strategic principle is to assign the most sensitive and reliable detection channel to the lowest-abundance target of primary interest.
Experimental Protocols for Assay Design and Validation
Implementing the strategic channel assignment requires a rigorous experimental workflow, from probe design to validation. The following protocols are critical for success, particularly when working with low-expression genes.
Protocol for Sample Qualification and Pretreatment Optimization
Before running a target experiment, qualifying sample RNA quality and determining optimal pretreatment conditions is essential [8].
- Sample Preparation: Fix samples in fresh 10% Neutral Buffered Formalin (NBF) for 16–32 hours. Use Superfrost Plus slides and the ImmEdge Hydrophobic Barrier Pen to prevent tissue detachment and maintain reagent coverage [8].
- Control Probes: Always run positive control probes (e.g., housekeeping genes PPIB, POLR2A, or UBC) and a negative control probe (bacterial dapB) on consecutive sections of your sample. Successful qualification requires a PPIB score ≥2 and a dapB score of <1 [8].
- Pretreatment Optimization: Antigen retrieval and protease digestion are critical. The standard automated pretreatment on a Leica BOND RX system is 15 minutes Epitope Retrieval 2 (ER2) at 95°C and 15 minutes Protease at 40°C. For over-fixed or delicate tissues, use a milder pretreatment (e.g., 15 min ER2 at 88°C) or extend times in increments (e.g., +5 min ER2, +10 min Protease) while keeping temperatures constant [8].
- TAC Assessment: For population studies, use mixture modeling on pre-existing transcriptomic data (e.g., from microarrays or RNA-seq) to identify if your target gene exhibits bimodal abundance distributions, which would inform expected detection rates and required sample sizes [28].
Protocol for Intronic Probe Design for Nuclear Localization
Detecting low-expression genes in specific cell types, like cardiomyocytes, is confounded by the inability to reliably identify nuclei. Traditional antibody-based methods have low sensitivity (~43%) [30].
- Principle: Intronic RNAscope probes target unspliced pre-mRNA in the nucleus, providing a specific nuclear marker for the cell type expressing that gene [30].
- Probe Design: Design ZZ probe pairs targeting a ~50-base region within an intron of a cell-specific, highly expressed sarcomeric gene (e.g., Tnnt2 for cardiomyocytes, Myl2 for ventricular CMs, Myl4 for atrial CMs) [30].
- Validation: Validate probe specificity by colocalization with a genetically encoded nuclear label (e.g., Obscurin-H2B-GFP). The intronic signal should be confined to the nucleus and colocalize with the reference standard [30].
- Application: In multiplex assays, the intronic probe (high-abundance) can be assigned to a standard channel, while the low-expression target gene probe is assigned to the high-priority channel.
Protocol for qPCR Optimization for Low-Expression Gene Confirmation
qPCR can independently validate low expression levels and optimize detection [29].
- Template Quality: Assess RNA integrity via agarose gel electrophoresis and purity via NanoDrop. Increase RNA input in the reverse transcription reaction and use a less diluted cDNA stock (not exceeding 1/10 of the qPCR reaction volume) [29].
- Reagent Selection: Use master mixes specifically designed for high sensitivity, such as Vazyme's Taq Pro Universal SYBR qPCR Master Mix (Q712), which demonstrates robust detection of single-copy templates [29].
- qPCR Program: Use a three-step amplification program instead of a two-step program and increase extension time to improve efficiency for low-copy templates [29].
- Replication: Increase the number of replicate wells to account for stochastic detection effects described by Poisson statistics, where a 1.75-copy template has an expected detection rate of ~70% [29].
The Scientist's Toolkit: Research Reagent Solutions
The following table details essential materials and reagents required for implementing the strategic probe design and RNAscope workflow.
Table 2: Essential Research Reagents and Materials for RNAscope Assays
| Item | Function / Application |
|---|---|
| RNAscope Probe(s) | Target-specific probes; for 2-plex assays, C1 probes are RTU, C2 are 50X stock [8]. |
| Blank Probe – C1 (Cat. No. 300041) | Used in a 2-plex assay when no C1 target probe is needed, to maintain proper probe mixture chemistry [8]. |
| Positive Control Probes (PPIB, POLR2A, UBC) | Qualify sample RNA integrity and optimize pretreatment conditions [8]. |
| Negative Control Probe (dapB) | Assess background noise and assay specificity [8]. |
| HybEZ Oven | Maintains optimum humidity and temperature (40°C) during critical hybridization and amplification steps [8]. |
| Superfrost Plus Slides | Prevents tissue detachment during the rigorous assay procedure [8]. |
| ImmEdge Hydrophobic Barrier Pen | Creates a barrier that remains intact throughout the procedure, preventing tissue drying [8]. |
| EcoMount or PERTEX Mounting Media | Required for RNAscope 2.5 HD Red and 2-plex assays; other media are not compatible [8]. |
| Taq Pro Universal SYBR qPCR Master Mix | High-sensitivity qPCR reagent for validating low-expression genes and optimizing detection [29]. |
Workflow Visualization: From Strategy to Detection
The following diagram synthesizes the strategic, experimental, and analytical components of probe design and channel assignment into a cohesive workflow.
Strategic probe design, grounded in the quantitative principle of channel assignment based on transcript abundance, is a critical determinant for the success of RNAscope studies focusing on low-expression genes. By prioritizing scarce detection channels for the most challenging targets, researchers can overcome the technical hurdles of sensitivity and background noise. This guide provides a comprehensive framework—integrating classification tables, detailed protocols, essential reagents, and a clear workflow—to empower scientists and drug development professionals to generate more accurate, reliable, and interpretable spatial gene expression data. As RNAscope technology continues to evolve, particularly with advancements like intronic probes for precise cellular identification [30] and enhanced spatial profiling capabilities [26], the systematic approach outlined here will remain fundamental to unlocking the functional roles of low-expression genes in health and disease.
RNAscope represents a significant advancement in RNA in situ hybridization (ISH) technology, enabling the detection of RNA molecules with single-molecule sensitivity while preserving crucial morphological context [10] [31]. For researchers investigating low-expression genes, this technology offers a unique capability to visualize and quantify subtle transcriptional activity directly within individual cells of complex tissues [10]. The core innovation lies in its proprietary double-Z (ZZ) probe design, which creates a robust signal amplification system while effectively suppressing background noise through a requirement for simultaneous probe pairing [10] [12]. Each successful probe pair binding initiates a cascade amplification process that can generate up to 8,000-fold signal enhancement, making it particularly suitable for detecting low-abundance transcripts that would otherwise remain undetectable with conventional ISH methods [10]. This technical breakthrough positions RNAscope as an invaluable tool for drug development professionals seeking to validate novel targets with spatially restricted or weakly expressed gene patterns, especially in oncology, neuroscience, and infectious disease research where understanding expression heterogeneity at the single-cell level can inform therapeutic strategies [10] [31].
Technical Foundations of RNAscope
Core Principles and Probe Design
The RNAscope platform employs a uniquely structured in situ hybridization approach that fundamentally differs from traditional RNA detection methods. The technology utilizes pairs of "Z" probes (ZZ probes) that are specifically designed to bind adjacent sequences on the target RNA molecule [10]. Each Z probe consists of three distinct regions: a lower target-hybridizing region (18-25 nucleotides) that binds the RNA sequence, a spacer linker segment, and an upper tail region containing binding sites for pre-amplifier molecules [10] [31]. This architectural design creates a mandatory dual-probe binding requirement that ensures exceptional specificity—only when both probes correctly hybridize to their adjacent target sequences can the subsequent signal amplification cascade proceed [10]. This mechanism effectively eliminates background noise from non-specific binding events, a critical advantage when working with low-expression genes where signal-to-noise ratio is paramount [10] [12].
Following successful ZZ probe hybridization, a multi-stage amplification process is initiated. First, pre-amplifier molecules attach to the tail regions of the bound ZZ probe pairs. Each pre-amplifier then provides multiple binding sites for amplifier molecules, which in turn host numerous sites for enzyme-conjugated label probes [10]. This hierarchical amplification structure enables the detection of individual RNA molecules as distinct, countable dots, with each dot representing a single transcript [10]. For low-expression genes, this digital quantification approach allows researchers to precisely enumerate transcript copies per cell, providing a level of quantification that surpasses protein-based detection methods like immunohistochemistry [10].
The following diagram illustrates the core procedural workflow for RNAscope assays, highlighting the parallel paths for manual and automated implementation:
Essential Research Reagent Solutions
The following table details critical reagents and controls required for implementing RNAscope assays, with particular importance for low-expression gene research:
| Reagent Category | Specific Examples | Function & Importance |
|---|---|---|
| Control Probes | Positive: PPIB, POLR2A, UBC [18] [9] | Validate RNA quality & assay performance; POLR2A recommended for low-expression targets [9] |
| Control Probes | Negative: dapB (bacterial gene) [18] [9] | Assess background staining; essential for confirming specificity of weak signals [9] |
| Sample Types | FFPE tissues, fresh frozen tissues, fixed cells [18] [32] | FFPE most common; thickness critical (5±1μm FFPE, 10-20μm fresh frozen) [18] [32] |
| Detection System | Chromogenic (DAB) or fluorescent dyes [10] [31] | Fluorescent preferred for multiplexing; chromogenic for bright-field microscopy [10] |
| Image Analysis Software | Halo, QuPath, Aperio [10] | Enable precise dot quantification; essential for objective assessment of low-expression signals [10] |
Manual RNAscope Platform
Technical Specifications and Workflow
The manual RNAscope platform requires researcher-led execution of each procedural step, offering maximum flexibility for protocol adjustments that may be crucial when optimizing for challenging low-expression targets. The complete process extends across a single day with approximately 6-7 hours of hands-on time, though this varies based on sample type and experience level [18] [32]. For fresh-frozen tissues specifically, the protocol involves precise fixation conditions (4% PFA for at least 15 minutes, though often 2 hours recommended) followed by a dehydration series through graded ethanol solutions (50%, 70%, 100%) [32]. Critical pretreatment steps include hydrogen peroxide incubation to quench endogenous enzymatic activity and protease treatment (Protease Plus for 10 minutes at room temperature) to permeabilize tissues and expose target RNA sequences [32]. The core hybridization then occurs over 2 hours at 40°C using the HybEZ oven system, followed by the sequential amplification steps (AMP1, AMP2, AMP3) each requiring 15-30 minutes at 40°C [32]. For low-expression genes, researchers can extend protease treatment times or adjust amplification durations to enhance signal detection, though this requires careful optimization to prevent increased background or tissue damage [18].
Sensitivity Performance and Applications
The manual platform demonstrates exceptional sensitivity for low-expression genes, with published studies confirming its ability to reliably detect transcripts present at just 3-15 copies per cell when appropriate controls and optimization are implemented [10] [9]. This sensitivity range is particularly suited for targets such as transcription factors, signaling receptors, and regulatory non-coding RNAs that often exhibit critically low abundance in biological systems. The technology's single-molecule detection capability enables precise enumeration of transcript copies in individual cells, providing quantitative data that surpasses the semi-quantitative nature of immunohistochemistry [10]. A systematic review of 27 clinical studies found that RNAscope showed high concordance rates (81.8-100%) with PCR-based methods for RNA detection, though lower concordance (58.7-95.3%) with immunohistochemistry, primarily due to the fundamental differences between detecting RNA versus protein [10]. For low-expression targets, the manual method's flexibility allows researchers to troubleshoot and adjust conditions based on positive control performance—particularly using POLR2A as a rigorous low-expression control (3-15 copies/cell) to validate system capability for detecting scarce transcripts [9].
Automated RNAscope Platform
Technical Specifications and Workflow
Automated RNAscope platforms transfer the entire assay procedure to robotic systems such as the Leica Biosystems BOND RX or Roche Ventana DISCOVERY ULTRA, standardizing each step from deparaffinization through signal detection [31]. These systems maintain the core RNAscope chemistry while optimizing incubation parameters for automated fluid handling and temperature control. On the Leica platform, the process includes automated target retrieval (15 minutes at 88-95°C depending on tissue type), protease treatment (15 minutes at 40°C), and probe hybridization (2 hours at 42°C) [31]. The Ventana system employs slightly different parameters with target retrieval at 97°C for 16-24 minutes and protease treatment at 37°C for 16 minutes [31]. This automation ensures precise timing and consistent reagent application across all samples within a run, significantly reducing the inter-user variability that can particularly impact the detection threshold for low-expression genes. The standardized environment also improves batch-to-batch reproducibility, a critical factor for longitudinal studies or multi-center clinical trials where consistent sensitivity thresholds must be maintained over time and across locations [31].
Sensitivity Performance and Applications
Studies directly comparing automated versus manual RNAscope have demonstrated equivalent sensitivity between the platforms, with the automated system successfully detecting low-abundance targets including TBP (TATA-box binding protein) mRNA with high precision [31]. The consistency afforded by automation is particularly valuable for low-expression gene quantification, as it minimizes the technical noise that can obscure subtle biological signals near the detection limit. Automated platforms also enable multiplexed detection of multiple RNA targets simultaneously through sequential probe hybridization and signal development, allowing researchers to contextualize low-expression targets alongside more abundant reference transcripts within the same cellular environment [31]. This capability provides internal validation and normalization that strengthens conclusions about expression patterns for scarce transcripts. The reproducibility of automated systems has been quantitatively validated through dot quantification algorithms (such as Halo from Indica Labs), which demonstrated consistent transcript counts across multiple reagent lots and experimental runs [31]. For drug development applications requiring rigorous standardization, this reproducibility establishes automated RNAscope as a robust platform for evaluating candidate gene expression across treatment cohorts and developmental stages.
Comparative Analysis: Manual vs. Automated Platforms
Direct Performance Comparison
The following table provides a systematic comparison of key performance parameters between manual and automated RNAscope platforms, with particular emphasis on factors affecting sensitivity for low-expression genes:
| Parameter | Manual Platform | Automated Platform |
|---|---|---|
| Sensitivity Threshold | 3-15 copies/cell (with optimization) [10] [9] | Equivalent to manual (3-15 copies/cell) [31] |
| Hands-on Time | ~6-7 hours over single day [32] | ~1 hour (instrument loading) [31] |
| Throughput Capacity | Moderate (4-8 slides per run) [32] | High (30+ slides per run) [31] |
| Inter-User Variability | Higher (requires technical expertise) [10] | Minimal (standardized robotic processing) [31] |
| Reproducibility | Moderate (depends on technician skill) [10] | High (consistent automated processing) [31] |
| Multiplexing Capability | Yes (sequential detection) [32] | Enhanced (optimized for duplex/plex assays) [31] |
| Flexibility for Optimization | High (protocol adjustable per sample) [18] | Limited (fixed protocols) [31] |
| Initial Setup Cost | Lower (reagents + HybEZ oven) [32] | Higher (reagents + automated instrument) [31] |
Platform Selection Decision Framework
The following diagram outlines a systematic approach for researchers to determine the most appropriate platform based on their specific experimental requirements and constraints:
Implementation Strategies for Low-Expression Genes
Optimization Approaches for Maximum Sensitivity
Successful detection of low-expression genes requires meticulous optimization of both sample preparation and assay conditions. For manual protocols, researchers should focus on protease treatment optimization as the most critical variable—under-digestion limits probe accessibility while over-digestion degrades RNA and compromises morphology [18] [32]. A titration approach (e.g., testing 5-20 minutes of Protease Plus treatment) is recommended to establish the optimal balance for specific tissue types [32]. Fixation conditions must be carefully controlled, with under-fixation leading to protease over-digestion and RNA loss, while over-fixation creates excessive cross-linking that impedes probe access [32]. The recommended standard is 16-32 hours in fresh 10% neutral-buffered formalin at room temperature, though some tissues may require adjustment [18]. For automated platforms, optimization focuses on validating pretested protocols with appropriate controls before proceeding to experimental samples. The automated system's consistency allows for more precise determination of sensitivity limits once optimized, but offers less flexibility for real-time adjustment [31]. Both platforms benefit from signal enhancement strategies such as extended amplification times or tyramide signal amplification (TSA) when working with exceptionally low-abundance targets, though these approaches require careful validation against background controls [32].
Validation and Quality Control Framework
Rigorous validation is essential when studying low-expression genes to distinguish true biological signals from technical artifacts. The following quality control framework should be implemented:
Control Probe Strategy: Implement a tiered control system using POLR2A (3-15 copies/cell) as the primary positive control for low-expression targets, supplemented with dapB negative control to establish background thresholds [9]. Successful staining should demonstrate POLR2A scores ≥2 and dapB scores <1 [18].
RNA Quality Assessment: Evaluate sample RNA integrity through positive control performance. Samples with PPIB (moderate expression control) scores <2 should be considered suboptimal for low-expression work and may require revised fixation or processing protocols [18] [9].
Quantification Standards: Employ digital image analysis with platforms like Halo or QuPath for objective dot enumeration rather than subjective scoring, particularly important near detection limits where manual counts may vary [10]. Establish minimum dot-count thresholds based on negative control values to define positive signals statistically.
Correlative Validation: Where possible, correlate RNAscope findings with orthogonal methods such as qRT-PCR from matched samples or protein detection through immunohistochemistry, acknowledging the expected biological differences between RNA and protein abundance [10].
The selection between manual and automated RNAscope platforms for detecting low-expression genes represents a strategic decision balancing sensitivity, throughput, and reproducibility requirements. The manual platform offers superior flexibility for protocol optimization and troubleshooting, making it ideal for exploratory research with challenging targets or heterogeneous sample types. Conversely, the automated platform provides standardized processing and enhanced reproducibility advantageous for larger validation studies, diagnostic applications, and multi-site investigations. Both platforms achieve comparable sensitivity limits of 3-15 transcript copies per cell when optimally configured, enabling researchers to investigate biologically significant but scarce molecular targets with single-cell resolution. As RNAscope technology continues to evolve, its integration with complementary imaging modalities and computational analysis pipelines will further enhance its utility for characterizing low-expression genes in both basic research and clinical translation contexts.
Multiplex fluorescent assays, particularly advanced RNA in situ hybridization (RNA-ISH) techniques like RNAscope, have revolutionized the study of gene expression patterns within their native tissue context. By enabling the simultaneous detection of multiple RNA targets in a single sample, these methods preserve precious biological materials while generating comprehensive data on cellular organization, function, and interactions in the tumor microenvironment. However, a significant technical challenge inherent to these multiplexed systems is the balanced sensitivity across different fluorescent detection channels. Disparities in sensitivity can lead to inaccurate interpretation of co-expression patterns, false negatives for low-expression genes, and compromised data quality. Within the specific context of RNAscope for low-expression genes research, achieving this balance is paramount, as the accurate detection of rare transcripts is often the primary research objective. This technical guide examines the factors affecting channel-specific sensitivity and provides detailed, actionable strategies for optimizing multiplex fluorescent assays to ensure reliable, quantitative results across all targets.
The need for balanced sensitivity is particularly acute when working with challenging sample types like formalin-fixed paraffin-embedded (FFPE) tissues, where RNA integrity is inherently compromised. As [21] demonstrates, RNA degradation in FFPE samples occurs in an archival duration-dependent fashion and disproportionately affects high-expression genes. Without proper calibration, this can lead to misinterpretation of expression levels when multiple targets with varying native abundances are probed simultaneously. Furthermore, different imaging-based spatial transcriptomics (iST) platforms exhibit varying sensitivities and specificities [33], making platform-specific optimization essential for generating comparable, high-quality data across experiments and research institutions.
Understanding Sensitivity Disparities in Fluorescent Detection
Sensitivity in multiplex fluorescent assays refers to the minimum signal level that can be reliably distinguished from background for each specific target. In an ideal system, all detection channels would exhibit equivalent sensitivity, ensuring that a transcript expressed at a given level would generate a similarly detectable signal regardless of the fluorophore used for its detection. However, multiple factors create inherent imbalances in real-world applications.
Key Factors Creating Channel-to-Channel Variation
- Fluorophore Properties: Different fluorophores possess varying levels of brightness, photostability, and environmental sensitivity. These intrinsic properties directly impact the strength and longevity of the detected signal. For instance, in RNAscope multiplex assays, fluorophores like Opal 520, 570, 620, and 690 each have distinct spectral characteristics and susceptibility to quenching [21].
- Instrumentation Limitations: The microscope's light sources, filter sets, and detectors are rarely perfectly matched across all channels. Variations in detector quantum efficiency at different wavelengths and the power output of excitation sources can create significant sensitivity disparities. A comparative study of iST platforms revealed differences in optical resolution and signal-to-background ratios between systems [33].
- Sample Effects: Tissue autofluorescence typically occurs in specific wavelength ranges (often green to yellow), creating uneven background across channels that masks true signal. Additionally, fixation-induced fluorescence and variable probe penetration in dense tissue sections can affect different fluorophores unequally.
- Probe Performance: In RNAscope assays, the hybridization efficiency of different probe sets can vary based on their target sequence and design, leading to unequal signal amplification even for transcripts expressed at similar levels. As noted in [21], high-expression housekeeping genes like UBC and PPIB show more pronounced degradation effects in FFPE tissues compared to moderate expressors like POLR2A and HPRT1.
Strategic Approaches for Balancing Sensitivity
Achieving balanced sensitivity requires a systematic approach that addresses both the assay design and implementation phases. The following strategies provide a framework for optimization.
Assay Design and Fluorophore Selection
The foundation for balanced sensitivity is laid during the initial assay design phase through careful fluorophore selection and assignment:
- Match Fluorophore Brightness to Target Abundance: Assign brighter, more photostable fluorophores to low-expression targets, while reserving less bright fluorophores for highly abundant transcripts. This approach compensates for native expression differences and ensures all targets remain within detectable ranges [34] [35].
- Consider Autofluorescence Interference: Analyze tissue autofluorescence in your specific sample type and avoid fluorophores whose emission spectra overlap with strong autofluorescence regions. For many tissues, this means shifting toward far-red channels for difficult targets.
- Utilize Validated Probe Panels: When using commercial RNAscope assays, leverage their validated probe panels that have been optimized for balanced performance. The RNAscope multiplex fluorescent v2 kit incorporates four housekeeping genes with different expression levels (UBC, PPIB, POLR2A, HPRT1) that serve as useful references for assay qualification [21].
Experimental Optimization and Validation
After initial design, experimental optimization is crucial for achieving balanced sensitivity:
- Titrate Probe Concentrations: Systematically vary the concentration of each probe set to equalize signal intensities across channels while maintaining specificity. This is particularly important when developing custom panels.
- Stagger Probe Hybridization: For sequential staining protocols, consider the order of probe application, placing more robust signals later in the sequence to minimize degradation effects from multiple processing rounds [34] [35].
- Implement Cross-Validation: Confirm balanced sensitivity using control samples with known expression patterns. [21] utilized housekeeping genes with varying expression levels (low, medium, high) to assess RNA integrity and assay performance across channels.
Table 1: Housekeeping Genes for Validating Channel Performance in RNAscope
| Gene | Expression Level | Utility in Validation | Notes from FFPE Studies |
|---|---|---|---|
| UBC | High | Assess sensitivity in high-expression range | Shows pronounced degradation in FFPE over time [21] |
| PPIB | High | Similar to UBC for high-expression validation | Most degraded in FFPE; good indicator of RNA quality [21] |
| POLR2A | Moderate | Middle sensitivity range assessment | More stable in FFPE; useful for normalization [21] |
| HPRT1 | Low to Moderate | Critical for low-expression sensitivity validation | Stable detection indicates good assay sensitivity [21] |
Image Acquisition and Analysis Considerations
Finally, balanced sensitivity requires optimization at the image acquisition and analysis stages:
- Channel-Specific Exposure Settings: Determine optimal exposure times for each channel individually to maximize dynamic range without saturation. This often means using longer exposures for weaker fluorophores.
- Implement Spectral Unmixing: For complex samples with significant spectral overlap, utilize spectral unmixing algorithms to distinguish fluorophore contributions accurately [36].
- Establish Consistent Thresholds: Apply consistent signal-to-noise thresholds across all channels during image analysis to ensure comparable detection limits.
Experimental Protocols for Sensitivity Optimization
This section provides detailed methodologies for key experiments aimed at assessing and balancing sensitivity in multiplex fluorescent assays.
Protocol: Channel-Specific Sensitivity Titration
Purpose: To determine optimal probe concentrations and imaging parameters for balanced sensitivity across channels.
Materials:
- RNAscope Multiplex Fluorescent v2 Kit (Advanced Cell Diagnostics, Cat. Nos. 323100, 323120) [21]
- Control cell lines or tissue sections with known expression patterns
- Fluorophore-conjugated probes (Opal 520, 570, 620, 690 recommended) [21]
- Confocal microscope or automated imaging system (e.g., Vectra Polaris) [21]
Procedure:
- Prepare serial sections of control tissue or cell pellets.
- For each target, prepare a dilution series of the corresponding probe (e.g., 1:50, 1:100, 1:200, 1:500).
- Perform RNAscope according to manufacturer's protocol, using different probe concentrations for each serial section.
- Image all sections using identical exposure times initially.
- Quantify signal intensity and signal-to-background ratio for each probe concentration.
- Determine the concentration that provides optimal signal without saturation or increased background.
- Using optimized probe concentrations, acquire images with channel-specific exposure times to further balance intensities.
Validation: Compare expression patterns of housekeeping genes across channels; signals should reflect known relative abundances when sensitivity is properly balanced [21].
Protocol: Signal Stability Assessment Across Multiple Imaging Rounds
Purpose: To evaluate fluorophore photostability and determine optimal imaging order for multiplex assays.
Materials:
- Stained multiplex samples
- Antifade mounting medium (e.g., ProLong Gold Antifade reagent) [21]
- Automated imaging system with environmental control
Procedure:
- Prepare multiplex-stained samples using optimized conditions.
- Acquire baseline images of all channels.
- Subject samples to repeated imaging cycles (simulating full multiplex acquisition).
- After each cycle, re-image and quantify signal intensity.
- Calculate signal decay rates for each fluorophore.
- Establish imaging order from least stable to most stable fluorophore.
Analysis: Plot signal intensity versus imaging cycle for each fluorophore to determine degradation kinetics and establish appropriate imaging sequence.
The Scientist's Toolkit: Essential Research Reagent Solutions
Table 2: Key Reagents for Multiplex Fluorescent Assay Development
| Reagent/Category | Specific Examples | Function in Assay Development |
|---|---|---|
| RNAscope Kits | Multiplex Fluorescent v2 Kit (Advanced Cell Diagnostics) [21] | Provides core reagents for probe hybridization, signal amplification, and detection in a standardized system. |
| Fluorophores | Opal 520, 570, 620, 690 (Akoya Biosciences) [21] | Signal generation with distinct emission spectra enabling multiplex detection; offer varying brightness and photostability. |
| Imaging Systems | Vectra Polaris (Akoya Biosciences) [21]; Merscope, Xenium [33] | Automated quantitative pathology imaging with multiple fluorescence channels and spectral unmixing capabilities. |
| Housekeeping Gene Probes | UBC, PPIB, POLR2A, HPRT1 probes [21] | Reference standards for assessing RNA integrity, assay performance, and channel-specific sensitivity. |
| Tissue Preservation | 4% PFA for fixation; ACD decalcification buffer for calcified tissues [37] [21] | Maintain RNA integrity during sample preparation, particularly important for low-expression targets. |
| Mounting Media | ProLong Gold Antifade reagent [21] | Preserves fluorescence signals during storage and imaging, critical for photostability of sensitive fluorophores. |
Workflow Visualization and Data Analysis
The following diagram illustrates the comprehensive workflow for developing and optimizing multiplex fluorescent assays with balanced sensitivity across channels, incorporating the key strategies and validation steps discussed in this guide:
Visual workflow for assay development and optimization.
For data analysis, proper quantification methods are essential for validating balanced sensitivity:
- H-score Quantification: This method combines intensity and percentage of positive cells, providing a more nuanced view of expression patterns than simple positive/negative thresholds [21].
- Signal-to-Background Ratio Calculation: Measure mean signal intensity in positive areas versus background areas for each channel separately to identify channels requiring additional optimization.
- Cross-Channel Normalization: Use stable reference genes (like POLR2A and HPRT1 in FFPE samples [21]) to normalize expression values across channels.
Table 3: Troubleshooting Common Sensitivity Imbalance Issues
| Problem | Potential Causes | Solutions |
|---|---|---|
| Consistently weak signal in one channel | Fluorophore quenching, inefficient probe, improper filter settings | Test fluorophore stability, titrate probe concentration, verify instrument alignment |
| High background in specific channel | Tissue autofluorescence, nonspecific binding, insufficient washing | Implement spectral unmixing, optimize blocking conditions, increase wash stringency |
| Variable sensitivity between experiments | Inconsistent sample processing, reagent lot variations, imaging parameter drift | Standardize protocols, validate new reagent lots, implement daily QC procedures |
| Differential signal degradation in time-course | Varying fluorophore photostability, oxidative damage | Add antioxidant mounting media, optimize imaging order, reduce light exposure |
Achieving balanced sensitivity across channels in multiplex fluorescent assays like RNAscope requires a methodical, multi-stage approach that addresses assay design, experimental optimization, and image analysis. By carefully matching fluorophore properties to target abundance, systematically optimizing probe concentrations and imaging parameters, and implementing rigorous validation using housekeeping genes with varying expression levels, researchers can generate reliable, quantitative data even for low-expression targets. Particularly when working with challenging FFPE samples where RNA integrity varies with archival time [21], these balancing practices become essential for meaningful experimental outcomes. As spatial transcriptomics continues to advance, with platforms offering increasingly multiplexed capabilities [33], the principles of balanced sensitivity will remain fundamental to extracting accurate biological insights from complex tissue environments.
The reliability of RNAscope in situ hybridization data, particularly for low-expression genes, is fundamentally dependent on rigorous sample qualification. This technical guide outlines a strategic framework for employing housekeeping gene control probes to assess tissue RNA quality and assay technique. By providing a detailed methodology for selecting appropriate positive control probes based on target gene expression levels and a standardized workflow for sample qualification, this whitepaper establishes a critical foundation for ensuring data integrity in low-expression gene research. The implementation of this control probe strategy enables researchers to distinguish true negative results from technical failures, thereby increasing confidence in experimental outcomes for RNA biomarkers with low copy numbers.
The RNAscope technology represents a significant advancement in RNA in situ hybridization (ISH), enabling single-molecule detection of RNA within the spatial context of intact tissue [12] [10]. Its unique "double Z" probe design provides both signal amplification and background suppression, making it theoretically suitable for detecting low-abundance transcripts [24] [10]. However, this theoretical sensitivity can only be realized in practice when tissue RNA integrity is preserved and the technical execution is optimized. For researchers investigating low-expression genes, this presents a particular challenge: how to distinguish a true negative result (no expression) from a false negative result (poor RNA quality or technical failure).
Sample qualification through control probes addresses this fundamental challenge by providing an internal standard for assessing whether the experimental conditions are capable of detecting RNA molecules at the required sensitivity level [9]. Without such qualification, data interpretation for low-expression targets remains speculative. The strategic use of housekeeping genes as positive controls provides a critical benchmark for determining whether RNA preservation and assay sensitivity are sufficient to trust results for the experimental target genes, especially those with low copy numbers.
RNAscope Control Probes: Principles and Applications
The Dual-Control System
ACD recommends a two-level quality control practice for RNAscope assays that incorporates both technical and biological validation [9]:
- Technical Assay Control: Verifies that the RNAscope protocol is being performed correctly using control cell pellets and control probes.
- Sample/RNA Quality Control: Assesses the integrity of RNA in experimental tissue samples and determines if pretreatment conditions need optimization.
This dual approach ensures that both the execution of the assay and the quality of the starting material are validated before proceeding with valuable experimental samples.
Housekeeping Genes as Positive Controls
Housekeeping genes, which maintain consistent expression across cell types and conditions, serve as ideal positive controls for several reasons. Their predictable expression patterns provide a known expected outcome against which assay performance can be measured. Their presence in virtually all nucleated cells offers an internal reference for RNA preservation quality. Furthermore, the availability of housekeeping genes with varying expression levels enables matching control sensitivity to experimental target sensitivity [9].
Table 1: RNAscope Positive Control Probes for Sample Qualification
| Control Probe Gene | Expression Level (copies per cell)* | Primary Recommendations | Low-Expression Research Applications |
|---|---|---|---|
| UBC (Ubiquitin C) | High (>20) | Use with high expression targets | Not recommended for low-expression targets as it may give false assurance of sensitivity |
| PPIB (Cyclophilin B) | Medium (10-30) | Recommended for most tissues | Suitable for moderate to low-expression targets; most flexible option |
| Polr2A (RNA polymerase II subunit RPB1) | Low (3-15) | Use with low expression targets | Ideal control for low-expression gene studies; provides rigorous sensitivity assessment |
Expression levels based on ACD documentation [9]
Negative Control Probes
The standard negative control probe targets the bacterial DapB gene (dihydrodipicolinate reductase from Bacillus subtilis strain SMY), which should not be present in animal tissues [9] [10]. A properly functioning assay should show no staining with the DapB probe, confirming the absence of non-specific background signal [8]. Alternative negative control approaches include sense strand probes (though these are discouraged due to potential antisense transcription) or species-mismatched probes (e.g., using a zebrafish probe on human tissue) [9].
Strategic Selection of Housekeeping Gene Controls
Matching Control Sensitivity to Experimental Needs
The selection of an appropriate positive control probe should be guided by the expression level of the target gene under investigation. Using a high-expression control like UBC for a low-expression target can provide misleading assurance of sensitivity, as UBC may still produce detectable signal even in suboptimal conditions where lower abundance transcripts would be lost [9].
For low-expression gene research, Polr2A represents the most rigorous positive control, as its detection confirms that the assay conditions are sensitive enough to detect transcripts in the 3-15 copies per cell range [9]. PPIB serves as a reliable middle-ground control for targets with moderate expression (10-30 copies per cell). This matching principle ensures that the control probe provides a meaningful benchmark for the sensitivity required in the experiment.
Implementation Workflow for Sample Qualification
The following diagram illustrates the recommended workflow for implementing control probes in RNAscope experiments:
This systematic approach ensures that only qualified samples proceed to experimental analysis, significantly increasing the reliability of results for low-expression targets.
Experimental Protocol for Sample Qualification
Sample Preparation and Pretreatment
Proper sample preparation is foundational to successful RNAscope analysis. For formalin-fixed paraffin-embedded (FFPE) tissues, fixation in fresh 10% neutral buffered formalin for 16-32 hours is recommended [8]. Thinner sections (4-5μm) are preferable for optimal RNA preservation and probe penetration. For fresh-frozen tissues, rapid freezing in chilled 2-methylbutane at -30°C to -50°C is critical to prevent RNA degradation [38].
Pretreatment optimization follows a standardized approach:
- Begin with recommended standard conditions (15 minutes epitope retrieval at 95°C + 15 minutes protease at 40°C)
- Run parallel slides with PPIB and DapB controls
- If signal is weak or background high, adjust pretreatment times incrementally (5 minutes for epitope retrieval, 10 minutes for protease)
- Repeat until optimal signal-to-noise ratio is achieved [8]
RNAscope Assay Procedure
The RNAscope procedure follows a structured workflow:
Day 1: Sample Pretreatment and Hybridization
- Bake slides at 60°C for 1 hour (FFPE only)
- Deparaffinize in xylene and ethanol series (FFPE only)
- Antigen retrieval using target retrieval solution at 98-102°C for 15 minutes
- Protease treatment with Protease III or IV for 30 minutes at 40°C
- Probe hybridization with control probes (PPIB/Polr2A and DapB) for 2 hours at 40°C
Day 2: Signal Amplification and Detection
- Amplification steps using AMP 1-6 reagents as per manufacturer protocol
- Signal detection with appropriate chromogenic or fluorescent substrates
- Counterstaining and mounting with recommended media [8] [24]
Essential Research Reagent Solutions
Table 2: Critical Reagents for RNAscope Sample Qualification
| Reagent Category | Specific Products | Function in Assay | Technical Considerations |
|---|---|---|---|
| Control Probes | PPIB, Polr2A, UBC (positive); DapB (negative) | Assess RNA quality and technical performance | Select based on target expression level; Polr2A for low-expression targets |
| Detection Kits | RNAscope 2.5 HD BROWN/RED, Multiplex Fluorescent | Signal generation and visualization | Chromogenic for brightfield, fluorescent for multiplexing |
| Sample Preparation | 10% NBF, Superfrost Plus slides, ethanol, xylene | Tissue preservation and mounting | Strict adherence to fixation protocols critical for RNA integrity |
| Specialized Equipment | HybEZ Oven, humidity control trays, hydrophobic barrier pen | Maintain optimal hybridization conditions | Consistent temperature and humidity essential for reproducibility |
| Image Analysis | HALO, QuPath, Aperio | Quantitative analysis of RNA signals | Automated analysis recommended for objectivity [38] |
Analysis and Interpretation of Control Results
Scoring Guidelines for Control Probes
The RNAscope assay uses a semi-quantitative scoring system based on the number of dots per cell rather than signal intensity, as each dot represents an individual RNA molecule [8] [10]. The standardized scoring guidelines are as follows:
Table 3: RNAscope Control Probe Scoring Criteria
| Score | Criteria | Interpretation for Sample Qualification |
|---|---|---|
| 0 | No staining or <1 dot/10 cells | Unacceptable for positive control; indicates RNA degradation or technical failure |
| 1 | 1-3 dots/cell | Suboptimal for most applications; requires pretreatment optimization |
| 2 | 4-9 dots/cell; none or very few dot clusters | Minimum acceptable for PPIB control; indicates adequate RNA quality |
| 3 | 10-15 dots/cell; <10% dots in clusters | Good RNA quality and assay performance |
| 4 | >15 dots/cell; >10% dots in clusters | Excellent RNA preservation and assay sensitivity |
For sample qualification, successful PPIB staining should generate a score ≥2 with relatively uniform signal throughout the sample, while DapB should show a score <1 indicating minimal background [8].
Troubleshooting Control Probe Results
Common issues encountered during sample qualification and their solutions include:
- Weak or absent positive control signal: Increase protease treatment time in 10-minute increments or extend epitope retrieval time [8]
- High background with negative control: Reduce protease treatment time or decrease epitope retrieval temperature [8]
- Uneven staining across tissue: Ensure consistent heating during antigen retrieval and adequate hydration during hybridization
- Tissue detachment: Use Superfrost Plus slides and verify barrier pen compatibility [8]
Integration with Low-Expression Gene Research
Special Considerations for Low-Abundance Transcripts
When researching low-expression genes, additional rigor in sample qualification is necessary. The detection of Polr2A (3-15 copies/cell) provides greater confidence in the system's ability to detect low-abundance targets than PPIB or UBC alone [9]. Furthermore, researchers should be aware that suboptimal conditions that might still allow detection of moderate or high-expression genes could completely prevent detection of low-expression targets.
For low-expression targets, the multiplex fluorescent RNAscope assay offers advantages through its ability to simultaneously detect the target gene alongside cell type-specific markers, ensuring that expression analysis is conducted in the correct cellular context [17] [39]. This is particularly important when investigating rare cell populations or heterogeneous tissues.
Quantitative Analysis Approaches
For quantitative analysis of RNAscope results, particularly with low-expression targets, automated image analysis platforms such as QuPath provide more objective and reproducible quantification than manual counting [38]. These tools enable:
- Calculation of transcripts per cell within specific regions of interest
- Determination of the percentage of positive cells
- Assessment of expression heterogeneity within cell populations
- Generation of H-scores that incorporate both intensity and distribution [17]
The establishment of appropriate thresholds for positivity is particularly critical for low-expression genes, where the distinction between true signal and background becomes more challenging. Using the negative control (DapB) to establish background levels and set threshold values provides a statistically rigorous approach to this challenge [38].
The implementation of a rigorous control probe strategy using housekeeping genes for sample qualification represents a critical foundation for reliable RNAscope analysis, particularly in the context of low-expression gene research. By strategically selecting control probes matched to the sensitivity requirements of the experimental targets, systematically qualifying samples before proceeding with expensive and time-consuming experiments, and establishing objective criteria for assay success, researchers can significantly enhance the reliability and interpretability of their spatial gene expression data. As RNAscope continues to evolve with capabilities for detecting an expanding range of RNA targets, including therapeutic oligonucleotides [3] and splice variants, the fundamental importance of robust control strategies only increases.
The precise analysis of gene expression with spatial context in complex tissues represents a cornerstone of modern biological research and therapeutic development. Within the broader thesis of utilizing RNAscope for investigating low-expression genes, two advanced technological applications emerge as particularly powerful: intronic probes for nuclear localization and BaseScope for splice variant detection. These methodologies address fundamental challenges in spatial biology, enabling researchers to precisely identify cell types based on nascent RNA transcription and to distinguish between nearly identical RNA sequences with single-base resolution. The integration of these techniques provides a comprehensive framework for validating gene targets, understanding cellular mechanisms in disease pathology, and advancing drug development programs with enhanced morphological context.
RNAscope technology has established itself as a robust platform for detecting RNA molecules within intact tissues, but conventional applications typically target exonic regions of mature mRNAs located predominantly in the cytoplasm. This approach, while highly valuable, presents limitations for precisely localizing nuclei of specific cell types, particularly in complex tissues where multiple cell populations intermingle. Similarly, while RNA sequencing can identify potential splice variants, confirming their cellular origin and distribution within tissue architecture has remained challenging. The applications discussed herein directly address these limitations through specialized probe design strategies that expand the analytical capabilities of in situ hybridization for both basic research and clinical applications.
Intronic Probes for Nuclear Localization and Cell Type Identification
Principles and Mechanisms of Intronic Probes
Intronic probes represent a sophisticated application of RNA in situ hybridization that targets nascent RNA transcripts still within the nucleus. In eukaryotic cells, pre-messenger RNA containing both introns and exons is first transcribed from DNA templates in the nucleus before undergoing splicing to remove introns and produce mature mRNA [30]. This fundamental biological process creates a transient population of intronic RNA sequences that remain exclusively nuclear due to their rapid degradation after splicing, typically with half-lives of less than 60 minutes [40]. By designing probes complementary to these intronic sequences, researchers can achieve specific nuclear labeling of cells actively transcribing a particular gene, regardless of the ultimate cytoplasmic abundance of the mature mRNA.
The strategic value of intronic probes lies in their ability to resolve a critical challenge in spatial biology: unequivocally identifying nuclei belonging to specific cell types in complex tissues. Traditional approaches using antibodies against sarcomeric or cytoplasmic proteins often suffer from imprecise nuclear localization, particularly when nuclei of different cell types are closely juxtaposed [41] [30]. Similarly, many putative nuclear markers display inadequate specificity for particular cell lineages. Intronic probes overcome these limitations by leveraging the fundamental process of gene transcription to mark nuclei based on their active expression of cell-type-specific genes, providing a direct functional link between nuclear identity and cellular phenotype.
Experimental Implementation and Validation
The practical implementation of intronic probes utilizes the RNAscope platform with specially designed probes targeting intronic regions of genes encoding cell-type-specific proteins. In a definitive demonstration of this approach, researchers developed a Tnnt2 (cardiac troponin T) intronic RNAscope probe that highly colocalized with Obscurin-H2B-GFP in adult mouse hearts, confirming its specificity for cardiomyocyte nuclei [41] [30]. This validation was crucial for establishing the reliability of the method, as genetically encoded nuclear labels provide an independent benchmark for assessing probe performance.
The experimental workflow for utilizing intronic probes follows the standard RNAscope protocol with specific considerations for probe design and validation:
- Probe Design: Probes target intronic regions (typically 50-300 bases) of cell-type-specific genes, avoiding sequences with significant homology to other genomic regions.
- Tissue Preparation: Tissues are fixed in 4% paraformaldehyde (1 hour to overnight at 4°C), saturated with sucrose gradient (5%-20%), and frozen in O.C.T. compound [30].
- Sectioning: Cryosections are prepared at thicknesses optimized for the tissue type (8µm for embryos, 16µm for adult hearts) [30].
- Hybridization: Standard RNAscope hybridization protocol is followed with appropriate positive and negative control probes.
- Validation: Initial validation should include comparison with established nuclear markers when available, assessment of signal specificity in different cell types, and confirmation of expected biological patterns.
The Tnnt2 intronic probe demonstrated remarkable utility in embryonic studies, where it labeled cardiomyocyte nuclei undergoing DNA replication and remained closely associated with chromatin throughout all mitotic stages, including after nuclear envelope breakdown [41] [30]. This "perdurance" throughout cell division enables reliable investigation of dynamic processes like DNA synthesis and mitosis in developing and regenerating tissues.
Applications in Cardiac Regeneration Research
Intronic probes have proven particularly valuable in cardiac regeneration studies, where accurately identifying cardiomyocyte nuclei is essential for assessing cell cycle activity but has been historically challenging. Traditional methods using antibodies to sarcomeric proteins together with DNA dyes have estimated sensitivity and specificity of only 43% and 89%, respectively, for identifying cardiomyocyte nuclei—figures that only improve to 65% and 97% even when combined with wheat germ agglutinin staining to outline cell membranes [30].
Table 1: Performance Comparison of Methods for Identifying Cardiomyocyte Nuclei
| Method | Sensitivity | Specificity | Advantages | Limitations |
|---|---|---|---|---|
| Antibodies to sarcomeric proteins + DAPI | 43% | 89% | Widely available, works with standard protocols | Poor nuclear localization, ambiguous assignments |
| + Wheat germ agglutinin | 65% | 97% | Improved membrane delineation | Still imperfect for closely apposed nuclei |
| Nuclear markers (Nkx2.5, Gata4, etc.) | Variable | Variable | Direct nuclear targeting | Often expressed in non-cardiomyocytes, low expression |
| Genetic models (e.g., Obscurin-H2B-GFP) | High | High | Specific and reliable | Costly, potential phenotypic effects |
| Tnnt2 intronic RNAscope probe | High | High | Specific, sensitive, no genetic manipulation | Requires specialized probe design |
The application of Tnnt2 intronic probes has enabled reliable investigation of DNA synthesis and potential mitoses in cardiomyocytes in both border and infarct zones after myocardial infarction [41] [30]. Furthermore, researchers have designed additional subtype-specific intronic probes, such as Myl2 and Myl4, which selectively label ventricular and atrial cardiomyocyte nuclei, respectively [41]. These tools facilitate precise characterization of cardiomyocyte subtypes generated during in vitro differentiation protocols, with significant implications for regenerative medicine and disease modeling.
BaseScope for Splice Variant Detection
Technical Basis of BaseScope Technology
BaseScope technology represents a significant advancement in the detection of RNA sequences with high sequence similarity, building upon the proven RNAscope platform with enhanced specificity for challenging targets. This method enables sensitive and specific detection of short RNA sequences (50-300 bases), exon junctions, and point mutations at single-molecule sensitivity while preserving tissue morphology [42]. The exceptional specificity of BaseScope allows it to distinguish between RNA sequences with as little as a single nucleotide difference, making it uniquely suited for applications where conventional RNA in situ hybridization techniques are inadequate.
The key innovation of BaseScope lies in its proprietary probe design strategy that targets specific exon-exon junctions to reliably identify splice variants. While conventional RNA in situ hybridization techniques often target exonic sequences present in both pre-mRNA and mature mRNA, BaseScope probes are uniquely designed to span the specific junction between exons created when a particular splicing event occurs [43]. This design ensures that the signal specifically identifies the mature mRNA variant of interest rather than pre-mRNA or other transcripts sharing exonic sequences, resolving a critical limitation of previous methodologies for splice variant analysis.
Probe Design Strategy for Splice Variants
The BaseScope approach to splice variant detection employs a rational probe design strategy that differentiates between alternative transcripts originating from the same gene. A representative example is the detection of METΔ14, an exon-skipping variant of the MET receptor tyrosine kinase relevant to lung cancer. To comprehensively analyze MET splicing, three separate BaseScope probes are typically designed [43]:
- A "common" probe targeting an exon junction present in all MET transcripts (e.g., exon junction 12/13)
- A wild-type-specific probe targeting the junction that includes the skipped exon (e.g., exon junction 14/15)
- A variant-specific probe targeting the novel junction created by exon skipping (e.g., exon junction 13/15)
This multi-probe strategy enables researchers to not only detect the presence of the specific splice variant but also to quantify its abundance relative to the wild-type transcript and total gene expression levels within the morphological context of tissue architecture.
Table 2: BaseScope Probe Design Strategy for METΔ14 Detection
| Probe Target | Specificity | Detection Purpose | Expression in A549 (WT) | Expression in H596 (METΔ14) |
|---|---|---|---|---|
| Exon junctions 12/13 | All MET transcripts | Total MET expression | Positive | Positive |
| Exon junctions 14/15 | Wild-type MET only | Wild-type-specific expression | Positive | Negative |
| Exon junctions 13/15 | METΔ14 only | Exon-skipped variant expression | Negative | Positive |
The technology has been successfully applied to various research areas, including the detection of EGFRvIII in glioblastoma, KRAS G12D point mutations, and analysis of gene editing outcomes [42]. Its ability to work across multiple sample types, including FFPE tissues, fresh frozen tissues, and cultured cells, makes it particularly valuable for both basic research and translational applications.
Experimental Workflow and Applications
The BaseScope assay follows a workflow similar to RNAscope with modifications to optimize sensitivity for shorter targets. The standard protocol includes:
- Sample Preparation: Tissues are fixed, processed, and sectioned following protocols compatible with FFPE or fresh frozen samples.
- Pretreatment: Sections undergo protease digestion to enhance probe accessibility while preserving tissue morphology.
- Probe Hybridization: BaseScope ZZ probes are hybridized to the target RNA sequence.
- Signal Amplification: A multi-step amplification system creates a detectable signal from single probe-binding events.
- Detection: Colorimetric or fluorescent detection enables visualization of target RNA within tissue morphology.
The application of BaseScope to complex tissues has revealed important biological insights that were previously obscured by bulk analysis methods. For instance, researchers utilized BaseScope to detect the e37a-Cacna1b splice variant of the presynaptic calcium channel CaV2.2, discovering that this heavily underrepresented variant (relative to the e37b-Cacna1b isoform) is specifically expressed in excitatory pyramidal neurons of the hippocampus and cortex, as well as motor neurons of the spinal cord [44]. This cell-type-specific splicing pattern would have been difficult to discern using conventional RNA extraction and sequencing methods that average expression across multiple cell populations.
Integrated Workflows and Multiomics Applications
The combination of intronic probes, BaseScope, and complementary molecular techniques creates powerful integrated workflows for comprehensive gene expression analysis. Recent advancements have facilitated the development of multiomics approaches that simultaneously detect RNA and protein biomarkers within the same tissue section, providing a more complete picture of cellular states [45]. The introduction of RNAscope protease-free assays now enables detection of proteins with protease-sensitive epitopes alongside RNA targets, expanding the range of compatible biomarkers [45].
For oligonucleotide therapeutics development, these technologies enable comprehensive evaluation of drug distribution, target engagement, and therapeutic effects. RNAscope in situ hybridization services can visualize and quantify oligonucleotide therapy delivery, spatial biodistribution, and efficacy with single-cell and single-molecule precision [3]. This application is particularly valuable for characterizing antisense oligonucleotides, siRNAs, and other RNA-targeting therapeutics, allowing researchers to simultaneously detect the synthetic oligonucleotide along with target mRNA and relevant protein markers.
Quality control considerations are essential when implementing these advanced applications, particularly when working with archived samples. Studies have demonstrated that RNA degradation in formalin-fixed paraffin-embedded tissues (FFPET) occurs in an archival duration-dependent fashion, with high-expression genes like UBC and PPIB showing more pronounced degradation effects compared to low-to-moderate expressors like POLR2A and HPRT1 [21]. Therefore, performing sample quality checks using housekeeping gene probes is strongly recommended to ensure accurate interpretation of results.
The Scientist's Toolkit: Essential Research Reagents
Table 3: Key Research Reagents for Advanced RNA Detection Applications
| Reagent/Technology | Function | Specific Applications |
|---|---|---|
| Intronic RNAscope Probes | Nuclear localization of specific cell types | Identifying cardiomyocyte nuclei (Tnnt2), ventricular CM (Myl2), atrial CM (Myl4) |
| BaseScope Assay | Detection of short sequences/splice variants | Exon junctions, point mutations, gene editing outcomes |
| RNAscope Multiplex Fluorescent v2 Kit | Simultaneous detection of multiple RNA targets | Spatial transcriptomics, cell type identification |
| Housekeeping Gene Probes (UBC, PPIB, POLR2A, HPRT1) | Sample quality control | RNA integrity assessment, assay validation |
| Protease-Free RNAscope Assays | Combined RNA and protein detection | Multiomics analysis, sensitive epitopes |
Visualizing Experimental Approaches
The following diagram illustrates the fundamental mechanistic differences between intronic probes for nuclear localization and BaseScope probes for splice variant detection, highlighting their complementary applications in spatial transcriptomics:
Intronic probes for nuclear localization and BaseScope for variant detection represent sophisticated applications of in situ hybridization technology that significantly expand our ability to study gene expression with spatial and morphological context. These methodologies address critical challenges in identifying specific cell types in complex tissues and discriminating between highly similar RNA sequences, respectively. When framed within the broader thesis of RNAscope utility for low-expression gene research, these advanced applications demonstrate how strategic probe design and assay optimization can overcome fundamental limitations in spatial biology. As these technologies continue to evolve and integrate with multiomics approaches, they promise to further accelerate discovery in basic research and therapeutic development across diverse fields including cancer biology, neuroscience, and regenerative medicine.
Maximizing Signal-to-Noise Ratio: Critical Troubleshooting and Enhancement Strategies
The accurate in-situ detection of low-expression genes represents a significant challenge in molecular pathology and drug development research. Techniques like RNAscope have revolutionized the detection of RNA biomarkers within their histopathological context, providing single-molecule sensitivity and high specificity in formalin-fixed, paraffin-embedded (FFPE) tissues [10] [12]. However, the full potential of this technology, particularly for genes with low transcript abundance (3-15 copies per cell), is only realized through meticulous pretreatment optimization [10] [9]. The process of tissue fixation, especially with formalin, creates methylene bridges that cross-link proteins and mask nucleic acids, substantially reducing the accessibility of target biomolecules to probes and antibodies [46] [47]. This physical barrier is the primary obstacle to consistent, reproducible results.
Within the context of a broader thesis on optimizing RNAscope for low-expression genes, this whitepaper details the core pretreatment methodologies of antigen retrieval and protease titration. These procedures work synergistically to reverse the masking effects of fixation: heat-induced antigen retrieval disrupts protein cross-links through thermal energy, while enzymatic digestion with proteases cleaves peptide bonds to further expose targets [48] [47]. A systematic approach to optimizing these parameters is not merely beneficial—it is fundamental for achieving the signal-to-noise ratio required to confidently visualize and quantify rare transcripts, thereby enabling robust biomarker studies and supporting the development of targeted therapeutics.
Theoretical Foundations: Unmasking Targets for Enhanced Detection
The Problem of Formalin Fixation and Epitope Masking
Formalin fixation has been the standard for histopathological tissue processing since 1893 due to its excellent preservation of tissue morphology. Its primary mechanism of action involves forming methylene bridges between protein molecules, creating cross-links that stabilize tissue architecture [47]. While essential for structural integrity, this process inadvertently alters protein structure and masks antigenic epitopes and nucleic acid targets, rendering them inaccessible to primary antibodies and molecular probes [46] [47] [49]. For RNA in situ hybridization, these cross-links can physically block probe access to the target RNA sequence. The discovery in 1991 that these cross-linkages could be reversed through high-temperature heating or enzymatic treatment laid the groundwork for modern antigen retrieval techniques, which are equally critical for successful RNAscope analysis [47].
RNAscope is a novel in situ RNA analysis platform that represents a significant advancement over traditional RNA ISH methods. Its exceptional sensitivity and specificity stem from a unique patented probe design [10] [12]. The technology uses paired "Z" probes that require dual hybridization to the target RNA sequence before a signal amplification cascade can proceed. This design suppresses background noise by making nonspecific binding and subsequent amplification statistically improbable [10]. Each RNA molecule is visualized as a distinct, punctate dot, allowing for single-molecule quantification—a feature paramount for researching low-expression genes [10] [12]. The universal assay conditions mean that once pretreatment is optimized for a given tissue type, the same hybridization conditions can be applied to numerous targets, streamlining the workflow for research and diagnostic applications [9].
The Synergy of HIER and Protease Treatment for RNAscope
For RNAscope, particularly on FFPE tissues, pretreatment aims to expose target RNA molecules without destroying tissue morphology or the RNA itself. Heat-induced epitope retrieval (HIER) and protease-induced epitope retrieval (PIER) operate through complementary mechanisms. HIER uses wet heat treatment at temperatures greater than 95°C in buffer solutions to disrupt protein cross-links, potentially by hydrolytic cleavage of formaldehyde-induced bridges and calcium ion chelation [46] [50]. Following HIER, a controlled protease digestion (titration) can further cleave peptides that may still be obscuring the target, providing a second level of unmasking. The sequential application of these methods is often the key to achieving optimal RNA exposure for probe hybridization, balancing sufficient signal amplification against background noise and tissue integrity [9].
Figure 1: Sequential Pretreatment Workflow for RNAscope. The diagram illustrates the critical steps from fixed tissue to successful probe binding, highlighting the complementary roles of HIER and protease treatment in unmasking targets.
Methodologies: A Systematic Optimization Approach
Heat-Induced Epitope Retrieval (HIER) Optimization
Buffer and pH Selection
The chemical environment during heating is a critical determinant of HIER success. The pH and composition of the retrieval buffer must be empirically determined for each antigen-antibody pair or RNA target [46] [50] [51]. The most commonly used buffers are citrate-based (pH 6.0) for an acidic environment and Tris-EDTA (pH 9.0) for an alkaline environment [46] [50] [47]. The working mechanism is thought to involve the hydrolytic cleavage of cross-links and the chelation of calcium ions that coordinate with proteins [50]. A neutral buffer like PBS (pH 7.2–7.6) can be a starting point, but switching to an acidic or basic buffer often dramatically improves results [51] [49].
Table 1: Common HIER Buffer Formulations
| Buffer Solution | Composition | Final pH | Typical Use Cases |
|---|---|---|---|
| Sodium Citrate [46] | 10 mM Tri-sodium citrate, 0.05% Tween 20 | 6.0 | A very popular general-purpose buffer; often a first choice. |
| Tris-EDTA [46] | 10 mM Tris base, 1 mM EDTA, 0.05% Tween 20 | 9.0 | Ideal for many nuclear antigens and difficult targets; provides excellent recovery. |
| EDTA [46] | 1 mM EDTA | 8.0 | Effective but may cause more tissue damage; requires monitoring. |
Heating Methods and Parameters
HIER can be performed using various heating devices, each with distinct advantages. The key is achieving and maintaining a temperature sufficient to reverse cross-links, typically between 95°C and 120°C [46] [47].
- Pressure Cooker: This method is highly effective and reproducible. It operates above the atmospheric boiling point (≈120°C), allowing for shorter incubation times (e.g., 1-5 minutes at full pressure) [46] [47]. It is crucial to cool the slides rapidly after heating by running cold water over the cooker for 10 minutes, which also helps the antigenic site to re-form [46].
- Microwave Oven: Using a domestic or scientific microwave, slides are heated until the buffer boils and then maintained for 20 minutes [46]. A scientific microwave with temperature control is preferred to avoid hot/cold spots and ensure a constant 98°C, preventing section dissociation [46]. The buffer level must be monitored to prevent slides from drying out.
- Steamer/Water Bath: Using a vegetable steamer or water bath set at 95–100°C, slides are incubated for 20 minutes [46] [50]. This method is gentler than microwaving as it avoids vigorous boiling, making it suitable for delicate tissues [46].
The optimal combination of time and temperature is best determined by a control experiment where slides of the same tissue section are retrieved for different durations (e.g., 1, 2, 3, 4, and 5 minutes) before being stained [46].
Protease-Induced Epitope Retrieval (PIER) and Titration
Enzyme Selection and Working Conditions
Proteolytic retrieval employs enzymes to cleave peptide bonds and break the protein cross-links formed during fixation [46] [48]. This method is generally harsher on tissue morphology than HIER and requires precise titration to avoid under-digestion (leading to weak signal) or over-digestion (causing tissue damage, high background, and false positives) [48] [47]. The choice of enzyme, concentration, and incubation time is critical.
Table 2: Common Protease Digestion Conditions for PIER
| Enzyme | Typical Working Concentration | Digestion Conditions | Notes |
|---|---|---|---|
| Trypsin [48] [47] | 0.05% to 0.1% | 37°C for 10 to 40 minutes | pH is critical and should be adjusted to 7.6–7.8 for optimal activity. |
| Proteinase K [48] [47] | 20 µg/mL | 37°C for 20 minutes | A broad-spectrum serine protease; effective but requires careful timing. |
| Pepsin [48] | 0.4% | 37°C for 30 to 180 minutes | An aspartic protease that functions well in acidic environments. |
Titration Strategy for Protease Digestion
A systematic matrix approach is indispensable for finding the optimal protease treatment. The goal is to titrate the digestion time to achieve maximal signal without degrading morphology [51] [49].
- Prepare Slides: A set of consecutive tissue sections from the same FFPE block.
- Apply Enzyme: Subject slides to the chosen protease at a fixed concentration and temperature (37°C), but vary the incubation time (e.g., 0, 5, 10, 15, 20 minutes).
- Evaluate Results: Process all slides with RNAscope using your target probe and the appropriate positive control probe (e.g., PPIB). Compare the signal intensity and tissue integrity across the different time points.
- Select Optimal Time: The condition that yields the strongest specific signal while maintaining the best-preserved tissue morphology should be selected for future experiments.
Integrated Pretreatment Workflow for RNAscope
For the most challenging low-expression targets, a combined HIER and protease titration approach is often necessary. The recommended workflow is to perform HIER first, followed by a titrated protease step [9]. This sequence leverages the power of heat to break the majority of cross-links, followed by a fine-tuned enzymatic "clean-up" to expose any remaining obscured targets. This integrated method is supported by ACD's guidelines, which recommend optimizing pretreatment conditions using control probes before running valuable target-specific experiments [9].
Figure 2: Pretreatment Optimization Decision Algorithm. This flowchart guides researchers through the logical steps of optimizing HIER and protease titration, emphasizing iterative testing based on signal and morphology feedback.
Quality Control and Validation
Rigorous quality control is non-negotiable for generating reliable and interpretable data, especially when detecting low-expression genes.
Control Probes for RNAscope
ACD strongly recommends incorporating control probes into every RNAscope assay to assess technique, sample quality, and RNA integrity [10] [9].
- Positive Control Probes: These validate the entire workflow. The choice depends on the expression level of your target gene:
- PPIB (Peptidylprolyl Isomerase B): A medium-expression (10-30 copies/cell) housekeeping gene recommended for most tissues and targets [10] [9].
- POLR2A: A low-expression (3-15 copies/cell) control, ideal for validating assays targeting rare transcripts [10] [9].
- UBC (Ubiquitin C): A high-expression (>20 copies/cell) control. Its use with low-expression targets is not recommended as it may give false confidence in suboptimal conditions [9].
- Negative Control Probe: The DapB gene, from a bacterium not found in human tissues, confirms the absence of nonspecific background staining [10] [9]. A clean DapB result is essential for trusting positive signals in your target probe.
Validation of Antigen Retrieval
For IHC-based validation or combined IHC/ISH protocols, controls are equally critical [47] [49].
- No-Retrieval Control: A section processed without any retrieval highlights the necessity of the step and helps identify non-specific staining [51] [49].
- Positive Tissue Control: A tissue with known expression of the target confirms that the protocol and reagents are working correctly [47].
- Negative Control: Omitting the primary antibody checks for non-specific binding from the detection system [47].
The Scientist's Toolkit: Essential Research Reagent Solutions
A successful pretreatment optimization protocol relies on high-quality, specific reagents. The following table details key materials and their functions.
Table 3: Essential Reagents for Pretreatment Optimization
| Item Category | Specific Examples | Function & Importance |
|---|---|---|
| Retrieval Buffers [46] [49] | Sodium Citrate (pH 6.0), Tris-EDTA (pH 9.0), Commercial kits (e.g., Dako TRS, R&D Systems CTS013/014) | Creates the chemical environment for HIER. pH and composition are critical for efficiently breaking cross-links. Pre-formulated solutions ensure consistency. |
| Proteolytic Enzymes [48] [47] | Trypsin, Proteinase K, Pepsin | Enzymatically cleaves peptides and cross-links to expose targets. Must be titrated carefully to balance signal with tissue preservation. |
| RNAscope Control Probes [10] [9] | Positive: PPIB, POLR2A, UBC. Negative: DapB. | Essential for validating technical performance, sample/RNA quality, and assay specificity. POLR2A is key for low-expression gene work. |
| Heating Equipment [46] [50] | Pressure Cooker, Scientific Microwave, Vegetable Steamer, Water Bath | Provides the controlled heat source for HIER. Reproducible, temperature-controlled equipment is vital for inter-experiment consistency. |
| Analysis Software [10] [52] | HALO (Indica Labs), QuPath, Aperio RNA ISH Algorithm | Enables accurate quantification of RNA molecules (dots), especially important for low-expression targets where manual counting is arduous and prone to error. |
The integrity of ribonucleic acid (RNA) is a foundational requirement for meaningful gene expression analysis, especially when employing advanced in situ hybridization techniques like RNAscope for detecting low-expression genes. RNA's single-stranded structure and ubiquitous ribonucleases (RNases) make it exceptionally vulnerable to degradation, which can compromise data accuracy and reproducibility. This guide details the essential best practices for preventing RNA degradation, with a specific focus on workflows relevant to RNAscope technology, ensuring that researchers can reliably preserve the molecular information critical for their studies in drug development and basic research.
The Ever-Present Threat: Understanding RNA Degradation
RNA degradation is an ongoing challenge that can occur at any stage, from sample collection to analysis. The single-stranded nature of RNA provides flexibility for biological functions but also makes it inherently susceptible to enzymatic and chemical breakdown [53].
The primary adversaries of RNA integrity are:
- RNases: These enzymes, which specifically cleave RNA, are both ubiquitous in the environment and present endogenously within biological samples. They are remarkably stable and do not require cofactors to function, making them a persistent threat [53] [54].
- Chemical Hydrolysis: The presence of a 2’-hydroxyl group on the ribose sugar of RNA makes it susceptible to hydrolysis, particularly under conditions of high temperature, alkaline pH, or in the presence of divalent cations like Mg²⁺, which can catalyze the cleavage of the phosphate backbone [53].
For sensitive techniques like RNAscope, which is designed to detect individual RNA molecules visualized as punctate dots, any degradation can lead to significant underestimation of gene expression levels, particularly for low-abundance transcripts [17] [10]. Preventing this degradation is not merely a preliminary step but a critical component that underpins the entire experimental process.
Establishing an RNase-Free Workspace
Creating and maintaining a dedicated RNase-free environment is the first and most crucial line of defense in protecting RNA samples.
Personal and Workspace Hygiene
- Designate a Clean Area: Use a dedicated, clean workspace specifically for RNA work. Avoid general-use benches to minimize contamination risks [53].
- Wear Protective Gear: Always wear disposable gloves and replace them frequently, especially after touching non-sterile surfaces like door handles, keyboards, or skin. Avoid breathing or speaking directly over open samples, and some researchers even wear masks for added protection [53] [54].
- Decontaminate Surfaces: Regularly clean workbenches, pipettors, and other equipment with RNase-deactivating reagents, such as commercial products like RNaseZap, disinfectant, or alcohol [53] [54]. Treatment of non-disposable plasticware with 0.1 M NaOH/1 mM EDTA is recommended, followed by rinsing with RNase-free water [53].
Equipment and Reagents
- Use Certified RNase-Free Consumables: Opt for single-use, certified RNase-free plasticware, including tubes and pipette tips. Do not autoclave pipette tips for RNase decontamination, as the water vapor in most autoclaves can contain RNases [53] [54].
- Employ Nuclease-Free Solutions: Ensure all buffers, water, and reagents used in RNA work are certified RNase-free, filtered, or autoclaved to eliminate potential RNase contamination. It is crucial to use nuclease-free, ultra-filtered water or reagents [53].
Table: Essential Components for an RNase-Free Workspace
| Component | Recommendation | Rationale |
|---|---|---|
| Work Surface | Clean with RNase-deactivating reagents (e.g., RNaseZap, alcohol) [54] | Inactivates resilient RNase enzymes on surfaces. |
| Pipettors & Tools | Decontaminate regularly; treat with NaOH/EDTA if reusable [53] | Prevents introduction of RNases during liquid handling. |
| Plasticware & Tips | Use single-use, certified RNase-free items [53] | Guarantees no nuclease contamination from consumables. |
| Water & Buffers | Use certified nuclease-free or DEPC-treated water [53] | Ensures solvents and reagents do not introduce RNases. |
| Personal Protection | Wear gloves and change frequently; avoid speaking over samples [53] [54] | Prevents contamination from skin and saliva. |
Best Practices for Tissue Handling and Stabilization
Proper handling of biological samples immediately after collection is critical for preserving the in vivo gene expression profile and preventing degradation by endogenous RNases.
Sample Collection and Stabilization
- Stabilize Immediately: RNA degradation begins the moment a sample is harvested. To preserve RNA integrity, use stabilizing agents (e.g., RNAlater, RNAprotect) or flash-freeze samples in liquid nitrogen. This step halts enzymatic activity and is crucial for preserving the RNA expression pattern [53] [54].
- Minimize Processing Time: Process biological samples as rapidly as possible after collection to stabilize RNA [53].
- Avoid Freeze-Thaw Cycles: Handle frozen samples on dry ice or in liquid nitrogen until lysis or stabilization occurs. Repeated thawing can lead to RNase activation and RNA degradation [53] [54]. For RNAscope, fresh frozen brains should be snap-frozen in chilled 2-methylbutane at -30°C to -80°C for long-term storage, as mRNA degrades progressively over time [38].
Tissue Disruption and Homogenization
- Grind Frozen Tissue: For tissue samples, grind tissue that has been frozen on dry ice or in liquid nitrogen with a mortar and pestle. Keeping the tissue frozen during initial disruption inactivates endogenous RNases [54].
- Use Appropriate Lysis Buffers: Homogenize tissue in a lysis buffer containing strong denaturants like guanidine isothiocyanate or other RNase inhibitors to protect RNA integrity during processing [53] [54].
- Prevent Cross-Contamination: Clean homogenizers and other tools between samples using lysis buffer to eliminate carryover contamination [54].
Optimal RNA Storage Conditions
Proper storage is essential for maintaining RNA quality between extraction and downstream applications like the RNAscope assay.
For purified RNA, divide it into small aliquots to avoid repeated freeze-thaw cycles, which can cause degradation [53]. Store these aliquots in RNase-free water or TE buffer. The choice of storage temperature depends on the duration:
- Short-Term Storage (up to a few weeks): Store at -20°C [53].
- Long-Term Storage (several months to years): Store at -70°C or below [53].
Ensure that storage containers are tightly sealed to prevent moisture buildup or contamination, and regularly monitor freezer temperatures to maintain consistent conditions [53]. For RNAscope, prepared slides from formalin-fixed paraffin-embedded (FFPE) tissue can be stored with desiccant at room temperature for up to 3 months, while frozen tissue slides should be stored at -80°C in an airtight container for up to 3 months [5].
Table: RNA Storage Guidelines for Different Sample Types
| Sample Type | Short-Term Storage | Long-Term Storage | Key Considerations |
|---|---|---|---|
| Purified RNA | -20°C in RNase-free water or TE buffer [53] | -70°C or below in aliquots [53] | Avoid repeated freeze-thaw cycles; use aliquots. |
| Flash-Frozen Tissue | -80°C | -80°C or liquid nitrogen | Keep frozen until lysis; no thawing. |
| Tissue in Stabilization Reagent | According to manufacturer's protocol (often 4°C or -20°C) | -80°C | Provides protection during thawing. |
| RNAscope FFPE Slides | Room temperature with desiccant (up to 3 months) [5] | Room temperature with desiccant (up to 3 months) [5] | Protect from moisture and light. |
| RNAscope Frozen Slides | -80°C in airtight container (up to 3 months) [5] | -80°C in airtight container (up to 3 months) [5] | Prevent freezer burn and condensation. |
The Scientist's Toolkit: Key Reagents and Equipment for RNAscope
Success in RNAscope and related RNA work relies on using specific, high-quality reagents and equipment designed to maintain RNA integrity and ensure assay performance.
Table: Essential Research Reagent Solutions for RNAscope and RNA Integrity
| Item | Function | Example Products / Notes |
|---|---|---|
| RNA Stabilization Reagents | Preserves RNA integrity in fresh tissues immediately after collection by inactivating RNases. | RNAlater, RNAprotect [53] [54] |
| HybEZ II Oven | Provides critical humidity and temperature control (40°C) during RNAscope probe hybridization; essential for manual assay performance [5]. | Bio-Techne [5] |
| RNase Decontamination Solution | Efficiently removes RNases from work surfaces, pipettors, and other equipment. | RNaseZap, RNase AWAY [54] [38] |
| RNAscope Probe Sets | Target-specific probes designed with proprietary "Z" probe architecture for high-sensitivity and single-molecule detection [10]. | Advanced Cell Diagnostics (ACD) [17] [5] |
| Positive & Negative Control Probes | Validates assay success and tissue RNA quality. Positive control: housekeeping genes (e.g., PPIB, POLR2A). Negative control: bacterial dapB gene [5] [10]. | Essential for interpreting target RNA results [5] |
| SuperFrost Plus Slides | Recommended microscope slides that ensure tissue adhesion throughout the rigorous RNAscope procedure [5]. | Fisher Scientific [38] [5] |
| ImmEdge Hydrophobic Barrier Pen | Creates a barrier around the tissue section on the slide, preventing reagents from running off and ensuring the tissue does not dry out during the assay [5]. | Vector Labs [5] |
RNA Degradation Pathways and Prevention Strategies
The following diagram illustrates the primary pathways of RNA degradation and the corresponding best practices to prevent it at each stage, integrating core concepts for a successful RNAscope workflow.
RNAscope-Specific Workflow and Integrity Controls
The RNAscope assay, with its unique probe design and amplification steps, places particular demands on RNA quality. The following diagram outlines the critical pre-assay steps to ensure sample integrity, which is paramount for detecting low-expression genes.
For RNAscope, the use of appropriate controls is non-negotiable for validating RNA integrity and assay performance. It is recommended to run a minimum of three slides per sample: one with your target probe, one with a positive control probe (e.g., the housekeeping gene PPIB for moderate expression), and one with a negative control probe (the bacterial dapB gene) [5] [10]. A sample is only valid for interpretation when the positive control shows strong, expected staining (score of 2 or higher for RNAscope) and the negative control shows no staining (score of 0) [5]. This rigorous QC step ensures that any absence of target signal is due to biology and not RNA degradation or assay failure.
Preventing RNA degradation through meticulous tissue handling and unwavering adherence to RNase-free best practices is not merely a technical formality but a critical determinant of success in RNA-based research, particularly for demanding applications like the RNAscope assay. The integrity of your RNA directly dictates the reliability and interpretability of your gene expression data. By institutionalizing the protocols outlined in this guide—from establishing a rigorous RNase-free workspace and implementing immediate sample stabilization to employing stringent controls within the RNAscope workflow—researchers can confidently preserve the molecular truth of their samples. This foundational discipline ensures that the subsequent sophisticated analysis of low-expression genes yields biologically accurate and meaningful insights, ultimately advancing our understanding in drug development and biomedical science.
Troubleshooting No Signal vs. High Background in Low-Expression Contexts
In the pursuit of visualizing low-expression genes using RNAscope in situ hybridization (ISH), researchers often face the dual challenge of distinguishing true negative results from technical failures and suppressing background noise that can obscure genuine signal. This technical guide provides a systematic framework for troubleshooting these issues, grounded in robust experimental design and optimization. By implementing controlled workflows, precise sample preparation protocols, and quantitative analysis methods, scientists can reliably detect low-copy RNA transcripts, thereby advancing research in gene function validation, biomarker discovery, and therapeutic development.
The RNAscope ISH assay represents a significant advancement for detecting low-expression genes within intact cells and tissues. Its proprietary signal amplification and background suppression technology enables single-molecule sensitivity, making it uniquely suited for targets with copy numbers as low as 5-15 copies per cell [55] [16]. Unlike traditional RNA ISH, the RNAscope platform does not require an RNase-free environment, simplifying its implementation in standard laboratory settings [55] [56]. The core of the technology lies in its "double Z" probe design, which ensures high specificity by preventing the amplification of non-specific signals, while the signal amplification system generates discrete dots corresponding to individual RNA molecules [16]. This dot-forming characteristic is particularly valuable for low-expression contexts, as it enables precise quantification and differentiation from non-specific background staining.
Systematic Approach to Troubleshooting
Effective troubleshooting of RNAscope assays for low-expression genes requires a systematic approach that begins with proper controls and validation before proceeding to target-specific experiments. The fundamental principle is to first verify that the entire experimental system—from sample preparation to final detection—is functioning optimally using well-characterized control probes and samples.
The Critical Role of Controls
Implementing a comprehensive control strategy is non-negotiable when working with low-expression targets. Always include:
- Positive control probes targeting housekeeping genes with varying expression levels: PPIB (10-30 copies/cell), POLR2A (5-15 copies/cell), or UBC (high copy) [55] [56] [18]. POLR2A is particularly relevant for low-expression contexts due to its copy number range.
- Negative control probes targeting the bacterial dapB gene, which should not generate specific signal in properly fixed tissue [55] [18].
- Control slides with known performance characteristics, such as Human Hela Cell Pellet (Cat. No. 310045) or Mouse 3T3 Cell Pellet (Cat. No. 310023) [56] [18].
Interpretation criteria dictate that successful staining should yield a PPIB/POLR2A score ≥2 or UBC score ≥3, with relatively uniform signal distribution throughout the sample, while the dapB negative control should score <1, indicating minimal background [55] [56] [18].
Diagnostic Workflow
The flowchart below illustrates a systematic diagnostic approach for investigating signal issues in low-expression RNAscope experiments:
Troubleshooting No Signal Conditions
When confronted with absent signal in low-expression targets, investigate these key technical areas sequentially.
Sample Preparation and RNA Integrity
Suboptimal sample preparation represents the most common cause of signal failure [57]. For FFPE tissues, strict adherence to these protocols is essential:
- Fixation: Use fresh 10% Neutral Buffered Formalin (NBF) for 16-32 hours at room temperature [55] [57] [18].
- Tissue processing: Block tissue to 3-4 mm thickness before fixation; infiltrate with paraffin at ≤60°C [57] [18].
- Sectioning: Cut sections at 5±1 μm thickness and mount on Superfrost Plus slides [55] [57] [18].
- Storage: Analyze within 3 months of sectioning when stored at room temperature with desiccant [18].
Under-fixation results in significant RNA loss during storage, while over-fixation reduces RNA accessibility, both leading to diminished signal in low-expression contexts [57].
Protocol Execution and Reagent Quality
Meticulous attention to protocol details is paramount when working with low-abundance targets:
- Follow the detection protocol exactly without modifications or omissions—skipping any amplification step will result in no signal [55] [56].
- Prevent slide drying at any point during the procedure, as this causes irreversible damage [55] [56].
- Use fresh reagents, including ethanol and xylene, throughout the process [55] [56].
- Warm probes and wash buffer to 40°C before use to resolubilize components that may precipitate during storage [55] [56].
- Maintain optimal humidity using the HybEZ Humidity Control Tray during hybridization steps [55] [56].
Instrument-Specific Optimization
For automated platforms, specific optimization is required:
Table: Automated Platform Pretreatment Optimization
| Platform | Standard Pretreatment | Milder Conditions | Extended Conditions |
|---|---|---|---|
| Leica BOND RX | 15 min ER2 at 95°C + 15 min Protease at 40°C [55] [56] | 15 min ER2 at 88°C + 15 min Protease at 40°C [55] [56] | Increase ER2 in 5-min & Protease in 10-min increments [55] [56] |
| Roche DISCOVERY ULTRA | Follow mRNA universal procedure [56] | Adjust Pretreat 2 and/or Protease times [55] | Contact ACD Technical Support for guidance [56] |
For Leica BOND RX systems, the recommended standard tissue pretreatment consists of 15 minutes Epitope Retrieval 2 (ER2) at 95°C followed by 15 minutes of Enzyme (Protease) at 40°C [55] [56]. For more delicate targets or tissues, milder conditions (15 min ER2 at 88°C and 15 min Protease at 40°C) are recommended [55] [56]. For over-fixed tissues or challenging targets, extend pretreatment by increasing ER2 time in 5-minute increments and Protease time in 10-minute increments while maintaining constant temperatures [55] [56].
Managing High Background
Excessive background staining obscures genuine signal, particularly problematic for low-expression targets where signal-to-noise ratio is critical.
- Inadequate protease digestion: Results in poor probe accessibility and non-specific binding. Optimize protease concentration and incubation time based on control probe performance [55] [56].
- Over-digestion: Causes tissue damage and increased non-specific probe binding, manifesting as diffuse background staining [58].
- Improper wash conditions: Use strict wash buffer formulations—for Roche DISCOVERY ULTRA systems, use DISCOVERY 1X SSC Buffer only (diluted 1:10) rather than Benchmark 10X SSC Buffer [55].
- Endogenous enzymatic activity: Ensure proper fixation and use recommended blocking reagents to minimize non-specific signal amplification.
Signal-Background Discrimination
For low-expression targets, correct interpretation of staining patterns is essential. The diagram below illustrates the decision process for distinguishing true signal from background:
Quantitative Analysis in Low-Expression Contexts
Accurate quantification of low-copy RNA molecules requires specialized approaches that differ from conventional high-expression target analysis.
Scoring Guidelines for Low-Expression Targets
Traditional RNAscope scoring guidelines may require modification for targets with very low expression levels:
Table: Modified Scoring Guidelines for Low-Expression Targets
| Score | Traditional Criteria | Low-Expression Adaptation |
|---|---|---|
| 0 | No staining or <1 dot/10 cells | No staining or <1 dot/10 cells |
| 0.5 | - | 1-3 dots/10 cells to 1 dot/3 cells |
| 1 | 1-3 dots/cell | 1-3 dots/cell (but in <30% of cells) |
| 2 | 4-9 dots/cell | 4-9 dots/cell (but in <30% of cells) |
Scoring should be performed at 20x magnification, with careful examination of multiple representative fields [55] [56]. If <5% of cells score 1 and >95% of cells score 0, assign a score of 0. If 5-30% of cells score 1 and >70% of cells score 0, assign a score of 0.5 [56].
Digital Image Analysis for Low-Copy Detection
Advanced image analysis platforms like HALO enable more sensitive detection and quantification of low-expression targets [58] [59]. Key considerations include:
- Image acquisition: Capture images at 40x magnification for optimal resolution of individual dots [58].
- Background subtraction: Measure average background intensity in regions with no specific staining and subtract this value during analysis [60].
- Dot counting algorithms: Use particle analysis tools to count discrete dots, setting intensity thresholds above background levels [60].
- Cluster resolution: For regions with dot clusters, quantify average intensity per single dot and calculate equivalent dot numbers based on total intensity [60].
The quantification workflow involves: (1) ensuring staining is within linear range without saturation, (2) analyzing each fluorophore channel separately, (3) measuring background intensity in representative regions, (4) counting signal dots as particles with intensity above threshold, and (5) normalizing dot counts to cell number based on DAPI staining [60].
The Scientist's Toolkit: Essential Reagents and Materials
Successful RNAscope experiments for low-expression targets require specific, high-quality materials.
Table: Essential Research Reagent Solutions for RNAscope
| Reagent/Material | Function | Low-Expression Specific Notes |
|---|---|---|
| Superfrost Plus Slides | Tissue adhesion | Critical to prevent tissue detachment during stringent washes [55] [56] [18] |
| ImmEdge Hydrophobic Barrier Pen | Creates reaction zone | Only pen that maintains barrier throughout procedure [55] [56] |
| POLR2A Positive Control Probe | Low-copy positive control (5-15 copies/cell) | More relevant than high-copy controls for low-expression contexts [55] [56] |
| HybEZ Hybridization System | Maintains temperature and humidity | Essential for precise hybridization conditions [55] [56] [18] |
| Protease Solution | Tissue permeabilization | Requires precise optimization time for each tissue type [55] [56] |
| RNAscope Probe Diluent | Probe preparation | Essential for preparing custom probe mixtures [56] |
| Appropriate Mounting Media | Slide preservation | Assay-specific: xylene-based for Brown; EcoMount/PERTEX for Red [55] [56] |
Mastering RNAscope technology for low-expression gene detection requires meticulous attention to sample preparation, systematic optimization using appropriate controls, and careful interpretation of staining patterns. By implementing the troubleshooting strategies and analytical approaches outlined in this guide, researchers can confidently distinguish true negative results from technical failures and extract meaningful biological insights from challenging low-expression targets. The continued refinement of these methodologies supports critical advancements in spatial biology, biomarker validation, and therapeutic development.
Image Analysis Optimization for Faint Signals and Heterogeneous Staining
In the context of RNAscope research for low-expression genes, the precise quantification of faint signals and the accurate interpretation of heterogeneous staining patterns are critical, yet challenging, tasks. The RNAscope assay's ability to detect RNA at single-molecule sensitivity, with each dot representing an individual transcript, makes it a powerful tool for investigating low-abundance targets [17] [24]. However, the analytical process requires specialized optimization to distinguish genuine signal from background, particularly when expression is sparse or varies significantly between cell populations. This technical guide outlines structured methodologies and quantitative approaches to enhance the reliability of image analysis for these demanding scenarios, providing a framework essential for rigorous preclinical and drug development research.
Core Analysis Strategies for Complex Expression Patterns
Defining Expression Scenarios and Analytical Responses
RNAscope data can present several distinct expression patterns, each requiring a tailored analytical approach to ensure accurate quantification, especially for low-expression genes where signal can be faint [17].
Table 1: Expression Scenarios and Corresponding Analysis Methods
| Expression Scenario | Description | Recommended Analysis Method(s) |
|---|---|---|
| Homogeneous Expression | Uniform staining level for the target RNA within a particular cell type [17]. | - Average dots per cell (Methodology #1 or #2) [17]. |
| Heterogeneous Expression | Different staining levels for the target RNA among the same cell type [17]. | - H-score (Methodology #3); Cell binning into expression levels; Histogram presentation [17]. |
| Subpopulation/Rare Cell Expression | Target expression confined to a specific (sub)population or a small number of cells [17]. | - Analysis of relevant (sub)population/region; Percentage of positive cells (cells with ≥1 dot) [17]. |
| Target Co-expression | Simultaneous expression of two genes within the same cell [17]. | - Percentage of dual-positive cells; Image-based quantitative software analysis [17]. |
Quantitative Scoring and Threshold Determination
For low-expression genes, establishing a clear threshold for signal positivity is paramount. The RNAscope assay uses a semi-quantitative scoring system based on dots per cell, which correlates with RNA copy numbers [55].
Table 2: RNAscope Semi-Quantitative Scoring Guidelines
| Score | Criteria | Interpretation for Low-Expression Genes |
|---|---|---|
| 0 | No staining or <1 dot/10 cells [55]. | Negative; target not detected. |
| 1 | 1-3 dots/cell [55]. | Crucial category for faint signals; indicates low but detectable expression. |
| 2 | 4-9 dots/cell; very few dot clusters [55]. | Moderate expression. |
| 3 | 10-15 dots/cell; <10% dots in clusters [55]. | High expression. |
| 4 | >15 dots/cell; >10% dots in clusters [55]. | Very high expression. |
For rigorous quantification, it is essential to derive mRNA signal thresholds using negative controls. One established protocol involves using negative control probes (e.g., bacterial DapB) to set a baseline. The fluorescence intensity distribution of the negative control is analyzed, and a threshold is set at a certain number of standard deviations above the mean negative signal. This statistically defined threshold is then applied to experimental samples to identify transcript-positive cells reliably, minimizing false positives from background noise [38].
Experimental Protocols for Optimized Detection and Quantification
Sample Preparation and Staining Workflow
Proper sample preparation is the foundation for successful detection of faint signals. The following protocol is optimized for fresh-frozen tissue, which offers better RNA preservation [24] [38].
A. Tissue Collection and Preparation (Fresh-Frozen)
- Snap-Freezing: Deeply anesthetize the animal and decapitate. Rapidly remove the brain and immerse it in chilled 2-methylbutane (-30°C) for 25 seconds for snap-freezing [38].
- Storage: Wrap the snap-frozen brain in aluminum foil and store it at -80°C to prevent RNA degradation. Avoid freeze-thaw cycles [38].
- Sectioning: Cut 10-20 μm thick sections using a cryostat and mount them on Superfrost Plus slides, which are required to prevent tissue detachment during the assay [55] [24].
B. RNAscope Multiplex Fluorescent Assay
- Fixation: Fix fresh-frozen sections in 4% Paraformaldehyde (PFA) for 60 minutes at 4°C [24].
- Dehydration: Dehydrate slides in a series of ethanol baths (50%, 70%, 100%) [24].
- Protease Digestion: Use RNAscope Protease IV for 30 minutes at 40°C for permeabilization, a critical step for probe access [38].
- Probe Hybridization:
- Probe Design: Use probes designed against the specific species and target sequence. For low-abundance transcripts, assign them to Channel 1 (C1), which is the most sensitive and produces slightly larger signals [24].
- Probe Mixing: Channel C1 target probes are ready-to-use (RTU). Probes for Channels C2 and C3 are 50x concentrated stocks and must be diluted 50-fold into a C1 probe mix. If no specific C1 probe is used, a "Blank Probe – C1" is used as the diluent [55] [38].
- Hybridization: Apply the probe mix and incubate for 2 hours at 40°C in a HybEZ oven, which maintains optimum humidity and temperature [55] [24].
- Signal Amplification: Follow the RNAscope Fluorescent Multiplex kit protocol for the sequential amplification steps (Amp 1-4). Use amplification solution AMP4B for standard applications, which yields Atto550 (red) on C1, Alexa488 (green) on C2, and Atto647 (far-red) on C3 [24].
- Counterstaining and Mounting: Apply DAPI nuclear counterstain and mount slides with an aqueous mounting medium like Mowiol or Fluoro-Gel II [24] [38].
Image Acquisition and Automated Analysis Workflow
High-quality image acquisition and automated analysis are indispensable for objective and reproducible quantification, particularly for heterogeneous staining [61] [38].
A. Image Acquisition
- Use a high-resolution slide scanner or fluorescence microscope with a 20x to 63x objective.
- Acquire images for each fluorescent channel and the DAPI channel.
- Maintain consistent exposure times and light intensity across all samples being compared.
B. Automated Quantification in QuPath The following workflow uses the open-source software QuPath for automated cell detection and transcript quantification [38].
- Import and Cell Detection:
- Import whole-slide images or regions of interest (ROIs) into QuPath.
- Run the automated cell detection algorithm on the DAPI channel to identify individual nuclei.
- Signal Threshold Optimization:
- Analyze tissue stained with the negative control probe (DapB).
- Measure the fluorescence intensity (e.g., mean or max pixel intensity) per cell for the relevant channel.
- Set a quantification threshold at a specific number of standard deviations above the mean intensity of the negative control population (e.g., 99th percentile) [38].
- Application to Experimental Samples:
- Apply the pre-defined threshold to images from experimental probes.
- Classify cells with a signal intensity above the threshold as "positive."
- The software can then output the number and percentage of positive cells, as well as the transcript count (dots) per cell [38].
The Scientist's Toolkit: Essential Research Reagents and Materials
Table 3: Key Research Reagent Solutions for RNAscope
| Item | Function/Description | Example Catalog Number |
|---|---|---|
| RNAscope Fluorescent Multiplex Kit | Core reagents for probe hybridization, amplification, and detection. | ACD, 320851 [24] |
| Target-Specific Probes (C1, C2, C3) | Probes designed against specific RNA targets; C1 is most sensitive. | Species- and target-specific [24] |
| Positive Control Probes (PPIB, POLR2A, UBC) | Housekeeping gene probes to assess sample RNA quality and assay performance. | ACD, 320881 (mouse 3-plex) [24] |
| Negative Control Probe (DapB) | Bacterial gene probe to assess background and set signal thresholds. | ACD, 320871 [24] |
| Protease IV | Enzyme for tissue permeabilization, critical for probe access. | ACD, 322340 [38] |
| HybEZ Oven System | Maintains optimal humidity and temperature during hybridization. | ACD, 321710/321720 [38] |
| Superfrost Plus Microscope Slides | Required to prevent tissue detachment during the assay. | Fisher Scientific, 12-550-15 [55] [38] |
| ImmEdge Hydrophobic Barrier Pen | Creates a barrier to maintain reagent volume over tissue. | Vector Labs, H-4000 [55] [24] |
Visualization of the End-to-End Workflow
A consolidated view of the entire process—from experimental design to quantitative result—helps in planning and troubleshooting studies of low-expression genes.
Optimizing image analysis for faint signals and heterogeneous staining in RNAscope requires a methodical approach that integrates careful experimental design, rigorous sample preparation, and sophisticated quantitative image analysis. By leveraging the strategies outlined in this guide—such as assigning low-abundance targets to sensitive channels, using negative controls to define objective positivity thresholds, and employing automated analysis pipelines like QuPath—researchers can reliably extract meaningful biological data from challenging samples. This robust framework is essential for advancing the application of RNAscope in critical research areas, including the spatial biodistribution and efficacy assessment of oligonucleotide therapies targeting previously undruggable genes [3] [61].
In the precise field of low-expression gene research using RNAscope technology, implementing appropriate experimental controls is not merely a recommendation but a fundamental requirement for generating scientifically valid data. The RNAscope assay represents a major advance over traditional RNA in situ hybridization, enabling single-molecule sensitivity and high specificity within intact cells and tissues [55]. For researchers investigating low-expression genes, proper controls are indispensable for verifying that negative results reflect true biological reality rather than technical failures or suboptimal RNA quality.
This technical guide establishes a framework for implementing three essential controls—PPIB, POLR2A, and dapB—in every RNAscope experiment. These controls serve distinct but complementary functions: PPIB and POLR2A validate sample RNA quality and assay performance, while dapB establishes background levels and ensures assay specificity [55] [9]. By rigorously incorporating these controls, researchers can confidently interpret their results, particularly when working with challenging low-expression targets where signal can be minimal and background concerns are heightened. The implementation of these controls becomes especially critical in drug development contexts, where decisions about target engagement and biomarker expression may influence clinical development pathways.
Control Probe Characteristics and Selection Criteria
Understanding Control Probe Properties
The selection of appropriate positive control probes should be guided by the expression level of the target gene under investigation. Using controls with expression levels similar to your target provides the most rigorous assessment of whether your assay conditions are sufficient for target detection.
Table 1: Control Probe Properties and Applications
| Control Probe | Expression Level (Copies/Cell) | Primary Function | Recommended Application Context |
|---|---|---|---|
| dapB (Negative) | N/A (Bacterial gene) | Assess background staining; verify assay specificity | Required for every experiment |
| POLR2A (Positive) | Low (3-15 copies) | Rigorous positive control for low-expression targets | Essential for low-expression targets; alternative to PPIB for proliferating tissues |
| PPIB (Positive) | Medium (10-30 copies) | General-purpose positive control; balanced sensitivity | Recommended for most tissues as primary control |
| UBC (Positive) | Medium/High (>20 copies) | Less stringent control for highly expressed targets | Use only with high-expression targets; can detect signal even with suboptimal conditions |
Selection Guidelines for Different Research Scenarios
The expression level of your target gene should dictate which positive control is most appropriate. For low-expression targets (typically <10 copies/cell), POLR2A serves as the most rigorous positive control because its detection confirms that the assay is sensitive enough to detect low-abundance transcripts [9]. When POLR2A staining is successful, researchers can be confident that the experimental conditions would support detection of a similarly low-expressing target gene.
For most applications where the target expression level is unknown or expected to be moderate, PPIB represents the most flexible and informative positive control [9]. Its medium expression level provides a balanced assessment of assay performance—successful detection demonstrates adequate RNA preservation and technical execution without being so highly expressed that it might detect signal under suboptimal conditions.
The dapB negative control must be included in every experiment regardless of the target expression level [55] [9]. This probe targets a bacterial gene not present in eukaryotic tissues and establishes the background staining level specific to your sample and assay conditions. A clean dapB signal (score <1) confirms that any punctate dots observed with target probes represent specific hybridization rather than non-specific background [55].
Table 2: Control Probe Performance Standards for Sample Qualification
| Control Probe | Minimum Passing Score | Performance Interpretation |
|---|---|---|
| dapB (Negative) | <1 (less than 1 dot/10 cells) | Indicates minimal background; assay is specific |
| PPIB (Positive) | ≥2 (4-9 dots/cell) | Confirms adequate RNA quality and assay performance |
| POLR2A (Positive) | ≥2 (4-9 dots/cell) | Validates sensitivity for low-expression targets |
| UBC (Positive) | ≥3 (10-15 dots/cell) | Confirms detection of medium/high expression targets |
Experimental Protocol for Control Implementation
Sample Preparation and Pretreatment
Proper sample preparation is foundational to successful RNAscope experiments. For FFPE tissues, section thickness should be 5 ± 1 μm and mounted on SuperFrost Plus slides to prevent tissue detachment [18]. Tissue fixation should follow ACD's recommended guideline of 10% neutral-buffered formalin (NBF) for 16-32 hours at room temperature [55] [18]. When these conditions cannot be met, pretreatment optimization using control probes becomes essential.
The pretreatment process requires careful attention to several critical steps:
- Deparaffinization: Use fresh xylene and ethanol reagents to ensure complete paraffin removal.
- Antigen Retrieval: Place slides in pre-warmed target retrieval reagent and incubate at 90-99°C for 15 minutes, then transfer to room temperature water to stop the reaction.
- Protease Digestion: Apply Protease Plus reagent and incubate for 30 minutes at 40°C, maintaining precise temperature control throughout [55].
For automated systems on Leica BOND RX platforms, standard pretreatment conditions include 15 minutes Epitope Retrieval 2 (ER2) at 95°C followed by 15 minutes Protease at 40°C [55]. For more sensitive tissues or over-fixed samples, a milder pretreatment of 15 minutes ER2 at 88°C and 15 minutes Protease at 40°C may be preferable.
RNAscope Assay Workflow with Integrated Controls
The RNAscope assay follows a structured workflow that can be performed manually or on automated platforms. The integration of control probes should be planned at the experimental design stage.
Table 3: RNAscope Workflow Comparison Across Platforms
| Step | Stage | Manual Assay | Leica Automated Systems | Roche Automated Systems |
|---|---|---|---|---|
| 1. Pretreatment | a. Deparaffinization | Manual processing | On-instrument | On-instrument |
| b. H₂O₂ block | Included | After epitope retrieval | After epitope retrieval | |
| c. Epitope retrieval | Boiling water bath | ER2 buffer, 95°C | Cell Conditioning solution | |
| d. Protease | Protease Plus, 40°C | Protease, 40°C | Protease, 40°C | |
| 2. Hybridize | a. Target probes | 2 hrs at 40°C | 2 hrs at 40°C | 2 hrs at 40°C |
| 3. Amplify | a. AMP 1-6 | Sequential 30-min steps | Sequential 30-min steps | Sequential 30-min steps |
| 4. Detect | a. DAB/Red | Chromogenic development | Chromogenic development | Chromogenic development |
| b. Counterstain | Hematoxylin | Hematoxylin | Hematoxylin |
Scoring and Interpretation of Control Results
The RNAscope assay uses a semi-quantitative scoring system based on the number of punctate dots per cell rather than signal intensity [55]. Each dot represents an individual RNA molecule, and the count provides a direct correlation to RNA copy number [62].
For control probes to be considered successful, the following criteria must be met:
- PPIB should demonstrate a score of ≥2 (4-9 dots/cell) with relatively uniform signal distribution throughout the sample [55]
- POLR2A should similarly show a score of ≥2 (4-9 dots/cell) when used as the primary control for low-expression targets
- dapB should show a score of <1 (less than 1 dot per 10 cells) indicating minimal background staining [55]
When these standards are not achieved, the experiment requires optimization before proceeding with valuable target probes. Low positive control signals may indicate RNA degradation or insufficient permeabilization, while elevated dapB signal suggests excessive background that could lead to false positive interpretations.
Troubleshooting and Optimization Strategies
Addressing Common Control Failure Scenarios
When control probes fail to meet quality standards, systematic troubleshooting is required to identify and resolve the underlying issue:
Low PPIB/POLR2A Signal with Clean dapB: This pattern indicates insufficient signal rather than excessive background. Increase protease treatment time in 10-minute increments or adjust epitope retrieval conditions [55]. For automated systems on the Leica BOND RX, extend ER2 time in 5-minute increments while maintaining temperature [55].
Elevated dapB Background Signal: This suggests non-specific probe binding or inadequate washing. Ensure proper hydration during assay steps using the HybEZ Humidity Control Tray [55]. Verify that the hydrophobic barrier remains intact throughout the procedure using only the ImmEdge Hydrophobic Barrier Pen [55].
Inconsistent Control Performance Across Tissue Regions: This may indicate variable fixation or processing. Qualify different tissue regions separately and consider adjusting pretreatment conditions for specific tissue types. Different tissues may require individualized optimization—lymphoid tissues often perform better with POLR2A, while many other tissues work optimally with PPIB [9].
Advanced Applications in Challenging Samples
RNAscope controls remain essential even in challenging sample types, though they may require additional optimization:
For post-mortem tissues where RNA degradation is a concern, research demonstrates that PPIB, POLR2A, and UBC RNAs can be reliably detected in mouse brain sections with post-mortem delays up to 24 hours at room temperature, and up to 48 hours with refrigeration [63]. The consistent implementation of controls becomes even more critical in these suboptimal samples.
In multiplexed assays combining RNA and protein detection, control probes verify that the more complex workflow maintains specificity [64]. Similarly, in spatial transcriptomics applications, controls ensure that spatial patterns reflect biology rather than technical artifacts.
The Researcher's Toolkit: Essential Materials for Control Implementation
Table 4: Essential Research Reagent Solutions for RNAscope Controls
| Reagent/Category | Specific Product Recommendations | Function in Control Experiments |
|---|---|---|
| Control Probes | PPIB, POLR2A, dapB (ACD) | Assess sample quality, assay performance, and background |
| Microscopy Slides | SuperFrost Plus (Fisher Scientific) | Prevent tissue detachment during stringent hybridization |
| Barrier Pen | ImmEdge Hydrophobic Barrier Pen (Vector Labs) | Maintain reagent containment and prevent tissue drying |
| Mounting Media | EcoMount, PERTEX, or CytoSeal XYL | Preserve signal for microscopy; media type depends on assay |
| Automation Kits | RNAscope 2.5 LS Reagent Kit (BROWN/RED) | Ensure compatibility and performance on automated platforms |
| Detection System | RNAscope Multiplex Fluorescent Detection Kit | Enable multiplexed control visualization |
The rigorous implementation of PPIB, POLR2A, and dapB controls represents a non-negotiable standard for generating reliable data in RNAscope experiments, particularly when investigating low-expression genes. These controls provide the quality framework that enables correct interpretation of both positive and negative results. By establishing that the assay is technically sound, that RNA is adequately preserved, and that background is minimal, researchers can confidently draw biological conclusions about their target of interest.
In the context of drug development, where decisions may have significant resource and clinical implications, this control framework provides the evidentiary foundation for target validation and biomarker assessment. As RNAscope technology continues to evolve with more complex multiplexed applications and automated platforms, the fundamental need for these essential controls remains constant—they are the bedrock upon which scientifically valid spatial transcriptomics data is built.
Validation Frameworks and Technology Comparisons for Confident Results
The Clinical Laboratory Improvement Amendments (CLIA) of 1988 established federal standards for all clinical laboratory testing performed on human specimens in the United States, with the goal of ensuring the accuracy, reliability, and timeliness of patient test results regardless of where a test is performed [65]. For researchers and drug development professionals working with advanced molecular techniques like RNAscope, particularly in the context of low-expression gene research, understanding and applying CLIA validation benchmarks is paramount for translating discoveries from the research bench to clinical applications. The RNAscope technology, with its single-molecule sensitivity and high specificity, presents unique opportunities for detecting low-expression genes in their morphological context, but requires rigorous validation to meet clinical standards [10]. This technical guide examines the core CLIA requirements and their specific application to RNAscope assay validation, providing a framework for robust assay implementation in clinical and translational research settings.
CLIA Fundamentals: Categorizations and Implications
Test Complexity Categorization
Under CLIA regulations, clinical laboratory tests are categorized based on their complexity, which determines the specific regulatory requirements applicable to their use [66]. The FDA categorizes tests using a scorecard system across seven criteria, with scores of 1 indicating low complexity and 3 indicating high complexity for each criterion [67]. The total score determines the test's classification:
- Total score ≤ 12: Moderate complexity
- Total score > 12: High complexity [67]
Laboratory-developed tests or modified FDA-cleared tests automatically default to high complexity under CLIA regulations [66]. This is particularly relevant for research applications of RNAscope where assays are often developed in-house for investigational targets.
The Seven CLIA Categorization Criteria
The FDA uses seven specific criteria to determine test complexity [67]:
- Knowledge: Specialized scientific knowledge required
- Training and Experience: Need for specialized training or substantial experience
- Reagents and Materials Preparation: Stability and preparation complexity
- Characteristics of Operational Steps: Need for close monitoring or control
- Calibration, Quality Control, and Proficiency Testing Materials: Stability and availability
- Test System Troubleshooting: Level of judgment required
- Interpretation and Judgment: Degree of independent interpretation needed
RNAscope assays typically score highly in multiple categories due to the specialized knowledge required for probe design, the need for precise control of procedural steps, and the significant interpretation needed for data analysis, generally placing them in the high complexity category [10] [8].
Core CLIA Validation Parameters for RNAscope Assays
For an RNAscope assay to be used in a CLIA-certified laboratory, it must undergo rigorous validation across multiple performance parameters. The validation must demonstrate that the assay is accurate, reliable, and clinically useful. The following parameters are essential components of CLIA-compliant assay validation, with specific considerations for RNAscope technology and low-expression gene detection.
Sensitivity and Specificity
Sensitivity in RNAscope refers to the ability to correctly detect low levels of target RNA. The technology's proprietary signal amplification system provides exceptional sensitivity, enabling detection of individual RNA molecules [10]. For low-expression genes, this sensitivity is crucial, as it allows detection of transcripts present at only a few copies per cell. Validation must demonstrate consistent detection of target RNA across the expected expression range.
Specificity ensures the assay detects only the intended target RNA without cross-reacting with similar sequences. The RNAscope "Z-probe" design provides inherent specificity, as it requires two independent probe binding events for signal generation [10]. Specificity validation should include:
- Testing against cell lines expressing related gene family members
- Using negative control probes (e.g., bacterial dapB gene) [9]
- Blocking experiments with complementary oligonucleotides
- Comparison with orthogonal methods when possible
Accuracy and Precision
Accuracy represents how close the measured expression values are to the true values. For RNAscope validation, accuracy can be demonstrated through multiple approaches:
- Comparison with quantitative PCR results from the same samples [10]
- Correlation with RNA sequencing data [68]
- Testing on cell lines with known expression levels
- Comparison with immunohistochemistry when appropriate antibodies are available [10]
Precision measures the reproducibility of results under defined conditions, including both intra-run and inter-run precision:
- Intra-run precision: Multiple replicates within the same assay run
- Inter-run precision: Same samples across different runs, operators, days, and reagent lots
- Precision for low-expression targets: Particularly important for low-expression genes where variability may have greater impact on interpretation
Reportable Range and Reference Intervals
The reportable range for RNAscope assays defines the expression levels over which the assay provides quantitatively reliable results. For low-expression genes, the lower limit of detection (LLOD) is particularly important and should be rigorously established using dilution series of samples with known expression levels.
Reference intervals establish the expected range of expression in relevant populations or sample types. For biomarker applications, establishing thresholds for clinical decision-making (e.g., positive vs. negative) is essential. In the validation of a DKK1 RNAscope assay for gastric cancer, an H-score threshold of 35 was established based on clinical outcome associations [68].
Implementing CLIA-Validated RNAscope Assays: Experimental Protocols
Sample Preparation and Quality Assessment
Proper sample preparation is foundational to successful RNAscope assays, particularly for low-expression targets where RNA preservation is critical [8].
Tissue Processing Protocol:
- Fixation: Fix tissues in fresh 10% neutral buffered formalin for 16-32 hours
- Processing: Standard paraffin embedding with minimal delay
- Sectioning: Cut 5μm sections onto Superfrost Plus slides
- Storage: Store at 4°C with desiccant for minimal RNA degradation
RNA Quality Assessment:
- Run positive control probes (PPIB, POLR2A, or UBC) based on expected target expression level [9]
- Use negative control probe (dapB) to assess background [8]
- Accept samples with PPIB scores ≥2 and dapB scores <1 [8]
- For low-expression targets, use POLR2A as a more rigorous control [9]
RNAscope Hybridization and Detection
The RNAscope procedure follows a standardized workflow with specific requirements for optimal results [8]:
Day 1 Protocol:
- Deparaffinization and Dehydration: Xylene and ethanol series
- Antigen Retrieval: Use recommended conditions without cooling step
- Protease Digestion: Optimize time based on tissue type (typically 15-30 minutes at 40°C)
- Probe Hybridization: Incubate with target-specific probes for 2 hours at 40°C
Day 2 Protocol:
- Signal Amplification: Sequential amplifier applications per manufacturer instructions
- Chromogenic Development: Apply chromogenic substrate
- Counterstaining: Hematoxylin (Gill's Hematoxylin I diluted 1:2 recommended)
- Mounting: Use xylene-based mounting media for brown chromogen
Digital Image Analysis and Quantification
For clinical applications, especially with low-expression targets, digital image analysis provides objective quantification and reduces pathologist variability [68].
Digital Analysis Workflow:
- Whole Slide Scanning: Scan at 20x-40x magnification
- Tumor Region Annotation: Pathologist identifies regions of interest
- Algorithm Application: Custom algorithms to identify tumor cells and quantify RNA signals
- H-score Calculation: (Percentage of cells with low staining × 1) + (Percentage with medium staining × 2) + (Percentage with high staining × 3) [17]
Validation of Digital Analysis:
- Compare digital scores with manual pathologist scoring
- Establish correlation coefficients (e.g., Spearman's rho >0.8) [68]
- Verify algorithm performance across expression range, particularly at low end
Essential Research Reagents and Controls
Successful implementation of CLIA-compliant RNAscope assays requires careful selection and validation of reagents and controls. The table below outlines essential components for robust assay performance.
Table 1: Essential Research Reagent Solutions for RNAscope Validation
| Reagent Category | Specific Examples | Function and Importance | Validation Considerations |
|---|---|---|---|
| Positive Control Probes | PPIB (medium expression), POLR2A (low expression), UBC (high expression) [9] | Verify RNA integrity, assay performance, and tissue quality | Match control to target expression level; POLR2A recommended for low-expression genes [9] |
| Negative Control Probes | dapB (bacterial gene), sense probes, scrambled probes [9] | Assess background staining and assay specificity | dapB is standard negative control; should show minimal staining (<1 dot/10 cells) [8] |
| Reference Cell Lines | PC3 (high DKK1), A549 (medium), HeLa (low), Pfeiffer (none) [68] | Establish assay dynamic range and sensitivity | Characterize with orthogonal methods (qPCR, RNA-seq); use for precision studies |
| Image Analysis Software | QuPath, Halo, Aperio [10] | Objective quantification, reduced variability | Validate against manual scoring; establish correlation coefficients |
Visualizing RNAscope Workflow and Validation Pathways
RNAscope Assay Workflow
The following diagram illustrates the key steps in the RNAscope assay procedure, highlighting critical validation points:
CLIA Validation Pathway for RNAscope Assays
This diagram outlines the systematic approach to CLIA validation of RNAscope assays, with particular emphasis on low-expression gene detection:
Establishing CLIA-compliant validation benchmarks for RNAscope assays, particularly for low-expression gene research, requires meticulous attention to regulatory requirements combined with scientific understanding of the technology's capabilities and limitations. The framework presented in this guide provides researchers and drug development professionals with a structured approach to assay validation that meets regulatory standards while supporting robust scientific discovery. As RNAscope technology continues to evolve and find new applications in biomarker detection and companion diagnostic development, adherence to these validation principles will ensure that research findings can be successfully translated into clinically meaningful applications. Through proper validation of sensitivity, specificity, accuracy, and precision—with special consideration for the challenges of low-expression gene detection—researchers can confidently employ RNAscope technology to advance our understanding of disease biology and therapeutic response.
The rapid expansion of RNA biomarkers discovered through genome-wide expression profiling has created an urgent need for robust and reliable detection methods in clinical research and diagnostic contexts [1]. RNA in situ hybridization (ISH) technologies, particularly the RNAscope platform, have emerged as a powerful tool for measuring gene expression while preserving precious spatial context within tissue morphology [1] [69]. However, the adoption of any new technological platform in biomedical research and drug development requires rigorous validation against established orthogonal methods. This technical guide examines the correlation and concordance between RNAscope, quantitative PCR (qPCR), RNA sequencing (RNA-seq), and immunohistochemistry (IHC) for gene expression analysis, with special consideration to the challenges of low-expression genes.
For researchers and drug development professionals, understanding the strengths and limitations of each method is crucial for experimental design and data interpretation. Each technique measures different molecular entities—RNA or protein—with varying sensitivity, specificity, and throughput characteristics. This review synthesizes quantitative correlation data across multiple studies and provides detailed methodological protocols to facilitate robust experimental design for validating RNAscope assays within a comprehensive biomarker development strategy.
Technical Foundations: Methodologies Compared
RNAscope represents a significant advancement in RNA in situ hybridization technology through its novel double-Z probe design strategy, which enables simultaneous signal amplification and background suppression [1]. This proprietary technology achieves single-molecule visualization while maintaining tissue morphology in formalin-fixed, paraffin-embedded (FFPE) samples—the standard preservation method in clinical pathology [1] [69].
The fundamental innovation lies in the probe design scheme where pairs of target probes (double Z) hybridize contiguously to a target region of approximately 50 bases [1]. This architecture requires that both probes bind correctly to form a 28-base hybridization site for the preamplifier, making it highly unlikely that nonspecific hybridization events will generate false-positive signals [1]. Typical assays target a 1-kb region on the RNA molecule with 20 probe pairs, theoretically yielding up to 8000 labels for each target RNA molecule through sequential hybridizations [1]. This robust signal amplification system makes RNAscope particularly valuable for detecting low-abundance transcripts that challenge conventional RNA ISH methods.
Established Orthogonal Methods
Quantitative PCR (qPCR) remains a gold standard for quantitative gene expression analysis due to its exceptional sensitivity and dynamic range [1]. However, as a "grind-and-bind" approach, it destroys tissue architecture and eliminates spatial context, making it susceptible to interference from non-target cell types and tissue elements [1].
RNA sequencing (RNA-seq) provides comprehensive, high-throughput profiling of gene expression at the transcriptional level and is increasingly important in cancer research and molecular diagnostics [70]. However, different reagents and protocols can produce incompatible results due to dramatic batch effects [70].
Immunohistochemistry (IHC) represents the clinical standard for protein biomarker assessment, allowing examination within histopathological context [1]. While it measures functional gene products (proteins), its effectiveness depends on antibody quality and it exhibits subjective interpretation in scoring [71].
Quantitative Concordance Data Analysis
RNA-seq versus IHC Correlation
Multiple studies have demonstrated significant correlations between RNA-seq and IHC measurements for clinically actionable biomarkers, supporting the use of transcriptomic data as a proxy for protein expression in many scenarios.
Table 1: RNA-seq and IHC Correlation for Key Biomarkers in Solid Tumors
| Biomarker | Cancer Type | Spearman's rho | AUC | Sample Size | Reference |
|---|---|---|---|---|---|
| HER2/ERBB2 | Breast Cancer | 0.65-0.798 | 0.963 | 39 | [70] |
| ER/ESR1 | Breast Cancer | 0.65-0.798 | 0.921 | 39 | [70] |
| PGR | Breast Cancer | 0.65-0.798 | 0.912 | 39 | [70] |
| PD-L1/CD274 | Lung Cancer | 0.65-0.798 | 0.922 | 19 | [70] |
| Multiple biomarkers* | Multiple Carcinomas | 0.53-0.89 | N/A | 365 | [71] |
*Multiple biomarkers include ESR1, PGR, AR, MKI67, ERBB2, CD274, CDX2, KRT7, and KRT20 across breast, lung, gastrointestinal, and other solid carcinomas [71].
A 2025 study of 365 FFPE samples across multiple solid carcinomas demonstrated strong correlations for most biomarkers, with coefficients ranging from 0.53 to 0.89 [71]. The research established RNA-seq thresholds that accurately reflected clinical IHC classifications, demonstrating high diagnostic accuracy (up to 98%) and precision in identifying biomarker expression levels [71].
RNAscope versus Established Methods
RNAscope shows high concordance with molecular techniques but variable agreement with IHC, reflecting the biological complexity of transcript-protein relationships.
Table 2: RNAscope Concordance with Orthogonal Methods
| Comparison Method | Concordance Rate | Key Factors Influencing Concordance | Clinical/Research Utility |
|---|---|---|---|
| qPCR and qRT-PCR | 81.8-100% | Target abundance, sample quality | High sensitivity for transcript detection |
| DNA ISH | 81.8-100% | Probe design, target accessibility | Viral transcript detection (e.g., EBV) |
| IHC | 58.7-95.3% | Post-transcriptional regulation, protein turnover | Complementary information on RNA-protein correlation |
A systematic review of 27 studies conducted in 2022 confirmed that RNAscope is a highly sensitive and specific method with high concordance rates for qPCR, qRT-PCR, and DNA ISH [69]. The lower concordance with IHC (58.7-95.3%) is expected, as these techniques measure different molecular entities (RNA versus protein) that are subject to different regulatory mechanisms [69].
qPCR versus RNA-seq Technical Comparison
The correlation between qPCR and RNA-seq reveals methodological challenges in quantifying gene expression, particularly for complex gene families like HLA.
Table 3: qPCR vs. RNA-seq Correlation for HLA Class I Genes
| Gene | Correlation Coefficient (rho) | Technical Challenges | Recommended Approach |
|---|---|---|---|
| HLA-A | 0.2-0.53 | Extreme polymorphism, paralog cross-alignments | HLA-tailored bioinformatic pipelines |
| HLA-B | 0.2-0.53 | Reference genome representation issues | Custom references accounting for diversity |
| HLA-C | 0.2-0.53 | Sequence similarity between paralogs | Specialized alignment tools |
A 2023 study comparing expression data for HLA class I genes found only moderate correlation between qPCR and RNA-seq (0.2 ≤ rho ≤ 0.53) [72]. This highlights the significant technical challenges in quantifying expression of highly polymorphic genes, requiring specialized bioinformatic approaches that account for known HLA diversity rather than standard alignment to a single reference genome [72].
Experimental Protocols for Method Comparison
RNAscope Assay Procedure for FFPE Tissues
The RNAscope protocol for formalin-fixed paraffin-embedded tissues requires careful attention to pre-treatment conditions to ensure optimal RNA accessibility while preserving tissue morphology:
- Sectioning: Cut tissue sections at 5μm thickness and mount on slides.
- Deparaffinization: Immerse slides in xylene followed by ethanol series dehydration.
- Retrieval: Boil slides in citrate buffer (10 mmol/L, pH 6) for 15 minutes.
- Protease Digestion: Treat with protease (10 μg/mL) at 40°C for 30 minutes.
- Hybridization: Incubate with target probes in hybridization buffer at 40°C for 2 hours.
- Signal Amplification: Perform sequential hybridizations with preamplifier, amplifier, and label probe.
- Detection: Use chromogenic detection (DAB or Fast Red) followed by counterstaining.
- Controls: Include positive control (housekeeping gene UBC) and negative control (bacterial dapB) [1].
Optimal results require standardization of pre-treatment conditions, including citrate buffer temperature, pH, incubation time, and protease concentrations, especially for samples fixed according to ASCO/CAP guidelines (10% neutral buffered formalin for 6 to 72 hours) [1].
RNA-seq Library Preparation from FFPE Samples
Working with FFPE-derived RNA presents specific challenges due to RNA degradation, requiring modified protocols:
- RNA Isolation: Extract RNA from 10 paraffin slices (10μm thick) using RNAeasy mini kit.
- Quality Assessment: Evaluate RNA integrity (RIN scores typically range from 1.0-2.5 for FFPE).
- Library Preparation: Use target enrichment with SureSelect XT HS2 RNA kit.
- Hybridization and Capture: Apply SureSelect Human All Exon V7 + UTR exome probe set.
- Sequencing: Perform on NovaSeq 6000 as paired-end reads (2 × 150bp) [71] [73].
For low-expression genes, the coverage depth should be increased (>50 million mapped reads) to ensure sufficient representation of rare transcripts [70].
Integrated DNA and RNA Sequencing Protocol
Combining RNA-seq with whole exome sequencing (WES) from a single sample enhances detection of clinically relevant alterations:
- Nucleic Acid Isolation: Use AllPrep DNA/RNA FFPE Kit for simultaneous extraction.
- Quality Control: Assess DNA and RNA quantity and quality via Qubit, NanoDrop, and TapeStation.
- Library Construction:
- DNA: SureSelect XTHS2 DNA kit (Agilent Technologies)
- RNA: TruSeq stranded mRNA kit (Illumina) or SureSelect XTHS2 RNA kit for FFPE
- Exome Capture:
- DNA: SureSelect Human All Exon V7
- RNA: SureSelect Human All Exon V7 + UTR
- Sequencing: Perform on NovaSeq 6000 with monitoring of QC metrics (Q30 > 90%, PF > 80%) [73].
This integrated approach enables direct correlation of somatic alterations with gene expression and improves detection of gene fusions, uncovering clinically actionable alterations in 98% of cases in a recent validation study of 2230 clinical tumor samples [73].
Visualizing Experimental Workflows and Relationships
RNAscope Validation Workflow
Method Comparison Logic
Research Reagent Solutions
Table 4: Essential Research Reagents for Orthogonal Method Validation
| Reagent/Category | Specific Examples | Function in Validation | Technical Considerations |
|---|---|---|---|
| RNAscope Reagents | Target probes, Preamplifier, Amplifier, Label probes | Signal amplification and detection | Double-Z design for background suppression [1] |
| Nucleic Acid Extraction Kits | AllPrep DNA/RNA FFPE Kit (Qiagen), RNAeasy mini kit | Simultaneous DNA/RNA extraction from limited samples | Optimized for degraded FFPE-derived RNA [71] [73] |
| Library Prep Kits | SureSelect XT HS2 RNA kit, TruSeq stranded mRNA kit | RNA-seq library preparation | Target enrichment for low-expression genes [71] |
| Positive Controls | Ubiquitin C (UBC), PPIB | Assessment of RNA quality and technique | Essential for interpreting negative results [1] [69] |
| Negative Controls | Bacterial dapB gene | Background signal assessment | Critical for specificity determination [1] |
Discussion and Research Implications
Contextualizing Concordance Rates
The correlation data between orthogonal methods must be interpreted with consideration of several biological and technical factors. The moderate correlation between qPCR and RNA-seq for HLA genes (0.2 ≤ rho ≤ 0.53) reflects both technical challenges and biological complexity [72]. Technically, the extreme polymorphism of HLA genes creates alignment difficulties for RNA-seq, while the sequence similarity between paralogs results in cross-alignments and quantification bias [72]. Biologically, different primer efficiencies in qPCR and the presence of alternative isoforms affect these correlations.
For RNAscope and IHC concordance, the range (58.7-95.3%) reflects the fundamental biological disconnection between mRNA transcription and protein translation [69]. Post-transcriptional regulation, protein turnover rates, and post-translational modifications all contribute to discrepancies. However, this complementary information can be valuable for understanding gene regulation rather than representing a limitation.
Special Considerations for Low-Expression Genes
Research on low-expression genes presents particular challenges that affect correlation between methods:
- Technical Sensitivity Limits: Each method has different detection thresholds, with qPCR generally being the most sensitive.
- Statistical Power: Low-expression genes require larger sample sizes to achieve significant correlation coefficients.
- Background Noise: The signal-to-noise ratio becomes problematic near detection limits.
- Spatial Heterogeneity: For localized expression, bulk methods like RNA-seq and qPCR may dilute signals.
RNAscope provides particular advantage for low-expression genes by offering single-molecule sensitivity while preserving spatial context, allowing researchers to determine whether low expression is uniform or restricted to specific cell subpopulations [1].
Best Practices for Method Validation
Based on the synthesized evidence, the following best practices are recommended for validating RNAscope assays:
- Implement Multiple Orthogonal Methods: Use both qPCR (for sensitivity) and RNA-seq (for comprehensiveness) as molecular correlates.
- Include IHC for Functional Correlation: Assess protein-level expression when possible, acknowledging expected discrepancies.
- Standardize Pre-Analytical Conditions: Control for fixation time, sample age, and RNA quality metrics.
- Use Appropriate Controls: Include both positive (housekeeping genes) and negative (bacterial genes) controls in every experiment.
- Establish Cohort-Specific thresholds: Determine expression cut-offs for each biomarker in specific sample types.
- Account for Tumor Purity: Consider the influence of tumor microenvironment on expression measurements, particularly for bulk assays [71].
The correlation data between qPCR, RNA-seq, IHC, and RNAscope demonstrates that these methods provide complementary rather than redundant information for gene expression analysis. While strong correlations exist for many biomarkers between RNA-seq and IHC (Spearman's rho 0.53-0.89) [71] and between RNAscope and molecular methods (concordance 81.8-100%) [69], each platform offers unique advantages. RNAscope excels in spatial context preservation and single-molecule sensitivity, making it particularly valuable for low-expression gene research where cellular heterogeneity is significant.
For researchers and drug development professionals, a strategic combination of these methods provides the most comprehensive approach to biomarker validation. RNAscope can serve as a bridge between bulk molecular measurements and protein expression analysis, especially when optimized using the experimental protocols and reagent solutions outlined in this technical guide. As molecular diagnostics continue to evolve, the integration of spatial context with quantitative expression data will be increasingly crucial for understanding complex biological systems and developing targeted therapeutics.
The RNAscope in situ hybridization (ISH) assay represents a major advance over traditional RNA ISH by enabling highly sensitive detection of target RNA within intact cells, with each visualized dot corresponding to a single RNA transcript [55] [17]. For researchers investigating low-expression genes—a central focus of modern biomarker discovery and therapeutic development—the technology's proprietary signal amplification and background suppression provide the necessary sensitivity for reliable detection [74]. However, the traditional semi-quantitative histological scoring of RNAscope data introduces subjectivity, particularly challenging when evaluating subtle expression differences in low-copy genes. Manual scoring requires counting dots per cell across multiple fields of view, a process that is both time-consuming and vulnerable to inter-observer variability [55] [17].
Digital image analysis integration addresses these limitations by enabling fully automated, objective quantification of RNAscope results. This technical guide explores the methodologies, validation frameworks, and implementation strategies for automated quantification systems, with particular emphasis on applications in low-expression gene research. The transition from subjective manual scoring to quantitative digital analysis represents a paradigm shift that enhances reproducibility, increases throughput, and unlocks subtle biological insights that might otherwise remain undetected in conventional analysis pipelines [74] [17] [75].
Core Principles of RNAscope Quantification
Foundation of Single-Molecule Detection
The fundamental principle enabling automated quantification of RNAscope data is the technology's unique probe design, which allows each detected dot to represent a single RNA molecule [17]. This one-to-one relationship forms the basis for all digital quantification approaches. Unlike immunohistochemistry (IHC) where signal intensity represents a continuum of protein expression, RNAscope generates discrete, countable signals that correlate directly with transcript numbers [55] [17]. This digital characteristic makes the technology particularly amenable to automated image analysis algorithms that can identify, count, and map individual transcripts within their spatial tissue context.
When analyzing low-expression genes, the distinction between specific signal and background becomes critical. The recommended quality control framework requires that successful staining demonstrates a positive control probe (PPIB, POLR2A, or UBC) score of ≥2, ≥2, or ≥3 respectively, while the negative control bacterial dapB should yield a score of <1, indicating minimal background [55] [18]. This validation framework ensures that automated systems are quantifying true biological signals rather than technical artifacts, a particularly crucial consideration when working with genes expressed at the limit of detection.
Traditional Scoring Framework
The established manual scoring system for RNAscope assays provides a reference point for developing automated algorithms. This semi-quantitative framework categorizes expression levels based on dots per cell, as outlined in Table 1 [55].
Table 1: Conventional RNAscope Scoring Guidelines for Single-Plex Analysis
| Score | Criteria | Interpretation |
|---|---|---|
| 0 | No staining or <1 dot/10 cells | Negative |
| 1 | 1-3 dots/cell | Low expression |
| 2 | 4-9 dots/cell; none or very few dot clusters | Moderate expression |
| 3 | 10-15 dots/cell; <10% dots in clusters | High expression |
| 4 | >15 dots/cell; >10% dots in clusters | Very high expression |
While this scoring system has proven valuable for manual assessment, it has significant limitations when applied to low-expression genes, where the difference between score 0 and 1 can represent biologically meaningful information that might be overlooked in categorical scoring [17]. Automated quantification addresses this limitation by providing continuous rather than categorical data, enabling detection of more subtle expression differences.
Automated Analysis Methodologies
Core Analytical Approaches
Digital image analysis systems for RNAscope data employ multiple methodological frameworks, each suited to different experimental requirements and expression patterns. These approaches can be implemented individually or in combination, depending on the research objectives and characteristics of the target genes.
Methodology #1: Semi-Quantitative Histological Scoring Emulation This approach replicates the traditional manual scoring system but with automated dot counting and cell segmentation. Algorithms identify individual cells based on nuclear counterstains (DAPI or hematoxylin), then count dots within each cellular boundary to assign categorical scores (0-4). While this method maintains familiarity with existing scoring systems, it perpetuates the resolution limitations of categorical scoring for low-expression genes [17].
Methodology #2: Image-Based Quantitative Software Analysis This fully quantitative approach measures the average number of dots per cell across the entire tissue section or defined regions of interest. It provides continuous numerical data rather than categorical scores, offering greater statistical power for detecting subtle expression differences—particularly valuable for low-expression genes where small variations may be biologically significant [17].
Methodology #3: Histoscore (H-Score) Calculation For heterogeneous expression patterns, the H-score system provides a weighted index that incorporates both expression intensity and the percentage of cells at each expression level. The H-score (range 0-400) is calculated as: H-score = Σ (ACD score or bin number × percentage of cells per bin). This approach is particularly valuable for tumors with mixed cell populations or when analyzing genes with variable expression within a cell type [17].
Expression Scenario-Specific Analysis Strategies
Different biological contexts require tailored analytical approaches, as summarized in Table 2.
Table 2: Analysis Methods for Different Expression Scenarios
| Expression Scenario | Recommended Analysis Methods | Key Applications in Low-Expression Research |
|---|---|---|
| Homogeneous target expression | Methodology #1 or #2 | Baseline expression in uniform cell populations |
| Heterogeneous target expression | Methodology #3 (H-score) with binning | Tumor heterogeneity, mixed cell populations |
| Target expression in ≥2 cell types | Methodologies #1, #2, or #3 per cell type | Cell-type specific low-expression patterns |
| Subpopulation-specific expression | Region-specific application of #1 or #2 | Rare cell populations, tumor subclones |
| Co-expression of multiple targets | Dual-positive cell quantification | Pathway analysis, receptor-ligand pairs |
For low-expression genes, the subpopulation-specific analysis approach is particularly valuable, as it enables researchers to determine whether minimal overall expression is explained by high expression in a small cell subset versus uniform low expression across all cells [17].
Experimental Protocols for Automated Quantification
Tissue Preparation and Pre-Analysis Processing
Optimal tissue preparation is fundamental to successful automated analysis, especially for low-expression targets where suboptimal preparation can obscure already subtle signals. The recommended protocol begins with proper fixation in fresh 10% neutral-buffered formalin (NBF) for 16-32 hours at room temperature, followed by paraffin embedding and sectioning at 5±1μm thickness [55] [18]. Sections must be placed on Superfrost Plus slides to prevent tissue detachment throughout the rigorous hybridization procedure [55].
For automated analysis consistency, the following pre-analysis steps are critical:
- Bake slides at 60°C for 1-2 hours prior to assay initiation
- Deparaffinize sections in fresh xylene and ethanol series
- Perform antigen retrieval without cooling steps; immediately transfer slides to room temperature water to stop the reaction
- Apply protease treatment at precisely 40°C to permeabilize tissue without excessive RNA degradation [55]
These standardized preparation methods ensure maximum RNA accessibility and preservation, particularly crucial when working with low-abundance transcripts where small variations in preparation quality can significantly impact detection sensitivity [55] [18].
Control and Validation Framework
Robust automated analysis requires stringent controls to distinguish true signal from background, especially when quantifying low-expression genes. The recommended control framework includes:
- Positive controls: Housekeeping genes PPIB (medium expression, 10-30 copies/cell), POLR2A (low expression, 5-15 copies/cell), or UBC (high expression) to assess RNA quality and permeabilization efficiency [55] [74]
- Negative control: Bacterial dapB gene which should not generate signal in properly fixed tissue [55] [18]
- Control slides: Commercially available Hela or 3T3 cell pellets (ACD Cat. No. 310045 and 310023) to validate assay performance [18]
Successful staining for low-expression gene analysis should demonstrate a PPIB/POLR2A score ≥2 or UBC score ≥3 with relatively uniform signal throughout the sample, while dapB should show a score <1, indicating minimal background [55] [18]. This validation is particularly critical when implementing automated analysis systems, as it ensures that algorithms are quantifying biologically relevant signals rather than technical artifacts.
Automated Platform Implementation
For high-throughput applications, RNAscope assays can be automated on platforms including the Ventana DISCOVERY XT/ULTRA or Leica BOND RX systems [55]. Each platform requires specific configuration:
- Ventana systems: Disable slide cleaning option; use DISCOVERY 1X SSC Buffer only; ensure regular instrument decontamination every three months to prevent microbial growth in fluidic lines [55]
- BOND RX systems: Standard pretreatment of 15 minutes Epitope Retrieval 2 (ER2) at 95°C and 15 minutes protease at 40°C; for delicate samples or over-fixed tissues, adjust to 15 minutes ER2 at 88°C or increase durations in 5-minute (ER2) and 10-minute (protease) increments [55]
These automated systems maintain the precise temperature and humidity control critical for reproducible results, while enabling standardized processing of multiple samples simultaneously—particularly valuable for large-scale studies of low-expression genes where technical variability must be minimized [55].
Performance Comparison of Spatial Technologies
Recent advances in spatial transcriptomics have yielded multiple platforms capable of highly multiplexed RNA detection. Table 3 compares the performance characteristics of four imaging-based spatial transcriptomics methods relative to RNAscope as a reference standard, based on a 2025 study analyzing medulloblastoma samples [75].
Table 3: Performance Comparison of Imaging-Based Spatial Transcriptomics Technologies
| Parameter | RNAscope HiPlex | Molecular Cartography | Merscope | Xenium |
|---|---|---|---|---|
| Genes in panel | 10 | 100 | 138 | 345 |
| Detected transcripts per cell | Reference | 74 ± 11 | 62 ± 14 | 71 ± 13 |
| Correlation with RNAscope | Self | r = 0.74 | r = 0.65 | r = 0.82 |
| Average FDR (%) | Not specified | 0.35 ± 0.2 | 5.23 ± 0.9 | 0.47 ± 0.1 |
| Probes with low specificity | Not specified | 12 ± 3 | 17 ± 3 | 7 ± 3 |
| Reimaging capability | Yes [75] | Yes | No | Yes |
This comparative analysis demonstrates that while newer multiplexed platforms offer greater gene coverage, RNAscope maintains advantages in specificity and reliability—particularly valuable attributes when studying low-expression genes where false positives can substantially impact data interpretation [75]. The high correlation between Xenium and RNAscope (r = 0.82) suggests that automated multiplexed systems can reliably replicate reference standard results while dramatically increasing throughput.
Essential Research Reagent Solutions
Successful implementation of automated RNAscope quantification requires specific reagents and materials optimized for the technology's requirements. Table 4 details the essential components and their functions within the automated analysis workflow.
Table 4: Essential Research Reagents for Automated RNAscope Analysis
| Reagent/Material | Function | Application Notes |
|---|---|---|
| Superfrost Plus slides | Tissue adhesion | Critical to prevent detachment; other slide types not recommended [55] |
| ImmEdge Hydrophobic Barrier Pen | Creates reaction boundaries | Only pen validated to maintain barrier throughout procedure [55] |
| HybEZ Hybridization System | Maintains optimum humidity and temperature | Required for manual hybridization steps [55] |
| Positive control probes (PPIB, POLR2A, UBC) | Assess sample RNA quality and permeabilization | PPIB: medium expression; POLR2A: low expression; UBC: high expression [55] [74] |
| Negative control probe (dapB) | Assess background and specificity | Bacterial gene should not generate signal in properly fixed tissue [55] [18] |
| Xylene-based mounting media | Slide preservation for Brown assay | Required for 2.5 HD Brown assay only [55] |
| EcoMount or PERTEX | Slide preservation for Red assay | Required for 2.5 HD Red and 2-plex assays [55] |
| Gill's Hematoxylin I | Nuclear counterstain | Dilute 1:2 for optimal results [55] |
These specialized reagents ensure the technical success of both the wet-bench assay and subsequent digital analysis, providing the standardized conditions necessary for reproducible quantification, particularly when comparing low-expression levels across multiple samples or experimental conditions [55].
Workflow Visualization and Integration Strategies
The complete integration of digital image analysis with RNAscope experimentation follows a systematic workflow that begins with experimental design and continues through computational analysis. The diagram below outlines this comprehensive process.
Automated RNAscope Analysis Workflow
For low-expression gene studies, the control validation and image preprocessing steps are particularly critical, as they establish the signal-to-noise ratio thresholds that will determine detection sensitivity. Proper implementation of each workflow stage ensures that subtle expression signals are preserved and accurately quantified throughout the analytical pipeline.
Advanced Applications in Low-Expression Gene Research
Single-Cell Resolution of Heterogeneous Expression
Automated image analysis excels at resolving heterogeneous expression patterns that are characteristic of many low-expression genes in complex tissues. By combining cell segmentation algorithms with transcript counting, these systems can identify rare cell populations or subtle expression gradients that might be averaged out in bulk analysis approaches. For example, in tumor microenvironment studies, automated analysis can reveal distinct expression patterns in malignant, stromal, and immune cell compartments, even when overall expression is low [17] [75].
This capability is particularly valuable for distinguishing between two biologically distinct scenarios: (1) uniform low expression across all cells versus (2) variable expression with some cells exhibiting moderate expression while others remain negative. This distinction has significant implications for understanding gene regulation, cellular heterogeneity, and drug target distribution [17].
Multiplexed Analysis for Pathway Mapping
For low-expression genes functioning within complex regulatory networks, simultaneous detection of multiple targets provides critical contextual information. RNAscope multiplex assays (both chromogenic and fluorescent) enable co-detection of up to 12 targets in the same tissue section, with automated systems providing precise assignment of expression patterns to specific cellular compartments [17] [75].
The analytical approaches for multiplexed data include:
- Co-expression analysis: Quantifying the percentage of cells expressing both target A and target B, revealing potential regulatory relationships or pathway activities
- Cell typing through marker combination: Identifying specific cell populations based on unique marker combinations, then quantifying low-expression target levels within these defined populations
- Spatial relationship mapping: Analyzing how expression correlates with cellular neighborhood characteristics, revealing potential paracrine signaling relationships [17]
These advanced applications demonstrate how automated analysis transforms RNAscope from a simple detection tool into a powerful system for understanding functional genomics within morphological context.
The integration of digital image analysis with RNAscope technology represents a transformative advancement for quantitative spatial biology, particularly in the challenging domain of low-expression gene research. By replacing subjective manual scoring with automated, objective quantification, researchers achieve the reproducibility, sensitivity, and statistical power required for robust biomarker validation and therapeutic target assessment.
The methodologies and frameworks presented in this technical guide provide a roadmap for implementing automated quantification systems that maintain the robust detection capabilities of RNAscope while adding the precision of computational analysis. As spatial transcriptomics continues to evolve, with increasingly multiplexed platforms becoming available, the fundamental principles of rigorous validation, appropriate control strategies, and scenario-specific analytical approaches will remain essential for generating biologically meaningful insights from low-abundance transcripts.
For drug development professionals and translational researchers, this integration of sensitive detection with objective quantification offers a powerful approach to bridge the gap between molecular discovery and clinical application, ensuring that subtle but biologically critical expression patterns are accurately measured and appropriately interpreted within their pathological context.
Spatial transcriptomics has revolutionized molecular biology by enabling researchers to visualize gene expression within the intact tissue context, preserving critical spatial information lost in single-cell RNA sequencing approaches. For researchers focusing on low-expression genes, selecting the appropriate spatial transcriptomics platform is crucial for generating reliable, interpretable data. This technical guide provides a comprehensive comparison of RNAscope—a well-established in situ hybridization technology—against newer, high-plex spatial transcriptomics platforms. We frame this analysis within the context of optimizing spatial transcriptomics for challenging low-expression gene research, providing drug development professionals and researchers with practical guidance for technology selection and implementation.
The fundamental challenge in studying low-expression genes lies in achieving sufficient sensitivity and specificity to detect rare transcripts while minimizing background noise. RNAscope's unique probe design addresses this challenge through signal amplification and background suppression, making it particularly valuable for validating RNA biomarkers discovered through whole-genome expression profiling [1]. As newer platforms emerge, understanding their comparative performance characteristics for detecting subtle expression signals becomes essential for advancing research in neurobiology, oncology, and developmental biology.
RNAscope Platform Fundamentals
RNAscope employs a novel in situ hybridization technology with a unique double-Z probe design strategy that enables simultaneous signal amplification and background suppression. This design achieves single-molecule visualization while preserving tissue morphology, making it particularly suitable for analyzing low-expression genes in complex tissues [1]. The technology works through several key steps:
- Probe Design: Pairs of target probes (double Z), each containing an 18-25-base region complementary to the target RNA, a spacer sequence, and a 14-base tail sequence, hybridize contiguously to a target region (~50 bases). The two tail sequences together form a 28-base hybridization site for the preamplifier [1].
- Signal Amplification: The preamplifier contains 20 binding sites for the amplifier, which in turn contains 20 binding sites for the label probe. Typically, a 1-kb region on the RNA molecule is targeted by 20 probe pairs, theoretically yielding up to 8000 labels for each target RNA molecule [1].
- Detection System: The label probe can be conjugated to fluorescent dyes for multiplex analysis or to enzymes for chromogenic detection, compatible with standard bright-field microscopy [1].
This robust methodology forms the foundation for RNAscope's application in low-expression gene research, with over 1,000 publications demonstrating its utility across various research areas, including neuroscience, immuno-oncology, and infectious diseases [76].
Emerging High-Plex Spatial Transcriptomics Platforms
Recent years have seen the development of several high-plex spatial transcriptomics platforms that utilize different approaches for transcript detection and localization:
Xenium (10x Genomics): A hybrid technology combining in situ sequencing and in situ hybridization. It uses padlock probes containing gene-specific barcodes that hybridize to target RNA transcripts, followed by rolling circle amplification for signal enhancement. Detection involves multiple rounds of hybridization with fluorescently labeled oligonucleotides that bind to the barcodes, generating unique optical signatures for each gene [77] [75].
Merscope (Vizgen): Utilizes a binary barcoding strategy based on MERFISH (Multiplexed Error-Robust Fluorescence in Situ Hybridization) technology. Each gene is assigned a unique binary barcode consisting of a series of "0"s and "1"s. Thirty to fifty gene-specific primary probes hybridize to different regions of the target gene, with fluorescence detection across multiple imaging rounds used to decipher the barcodes [77] [33].
Molecular Cartography (Resolve Biosciences): Employs highly sensitive single-molecule detection with proprietary signal amplification and background suppression chemistry. The technology offers subcellular resolution and claims superior signal-to-noise ratios for detecting low-abundance transcripts [33] [75].
CosMx (NanoString/Bruker): Uses a combination of hybridization and optical signature approaches similar to both MERSCOPE and Xenium, while incorporating an additional positional dimension for gene identification. Its readout domain with 16 sub-domains enables combinatorial barcoding for high-plex detection [77] [78].
Figure 1: Comparative Workflow Diagrams of Major Spatial Transcriptomics Platforms. Each technology employs distinct biochemical approaches for transcript detection and localization, with implications for sensitivity, specificity, and multiplexing capability.
Performance Comparison for Low-Expression Gene Research
Sensitivity and Specificity Metrics
Detection of low-expression genes demands technologies with high sensitivity (probability of detecting a given transcript) and specificity (minimizing false discovery rates). Recent comparative studies reveal significant differences between platforms:
Table 1: Performance Metrics of Spatial Transcriptomics Platforms for Low-Expression Gene Detection
| Platform | Detection Sensitivity | False Discovery Rate (FDR) | Probes with Low Specificity | Correlation with RNAscope |
|---|---|---|---|---|
| RNAscope | Single-molecule sensitivity | Not reported | Not reported | Reference standard |
| Xenium | 25 ± 1 features per cell [75] | 0.47% ± 0.1 [75] | 7 ± 3 [75] | r = 0.82 [75] |
| Merscope | 23 ± 4 features per cell [75] | 5.23% ± 0.9 [75] | 17 ± 3 [75] | r = 0.65 [75] |
| Molecular Cartography | 21 ± 2 features per cell [75] | 0.35% ± 0.2 [75] | 12 ± 3 [75] | r = 0.74 [75] |
The data reveal that Xenium and Molecular Cartography offer the lowest false discovery rates (0.47% and 0.35% respectively), which is critical for confident detection of low-expression genes. Merscope demonstrates a substantially higher FDR at 5.23%, potentially limiting its utility for low-abundance transcripts where signal-to-noise ratio is paramount [75]. RNAscope establishes the reference standard for specific detection, with Xenium showing the highest correlation (r=0.82) with RNAscope data [75].
Technical Specifications and Operational Considerations
Platform selection involves balancing multiple technical parameters with research objectives and practical constraints:
Table 2: Technical Specifications and Operational Parameters of Spatial Transcriptomics Platforms
| Parameter | RNAscope | Xenium | Merscope | Molecular Cartography |
|---|---|---|---|---|
| Multiplexing Capacity | 1-12 plex (HiPlex) [79] | 345-5000 genes [33] [77] | 138-500 genes [33] [78] | 100-500 genes [33] |
| Spatial Resolution | Single-molecule [1] | Single-cell to subcellular [33] | Single-cell to subcellular [33] | Subcellular [33] |
| Tissue Compatibility | FFPE, fresh frozen [1] | FFPE, fresh frozen [78] | FFPE, fresh frozen [78] | Fresh frozen (primary) [33] |
| Run Time | 1 day (manual) [1] | 2 days [75] | 1-2 days [75] | 4 days [75] |
| Hands-on Time | Moderate | 1.5 days [75] | 5-7 days [75] | 1.5 days [75] |
| Approach | Targeted imaging-based [33] | Targeted imaging-based [33] | Targeted imaging-based [33] | Targeted imaging-based [33] |
For studies focusing on a limited panel of low-expression genes, RNAscope HiPlex (up to 12-plex) offers robust performance with established protocols. When larger gene panels are necessary, Xenium provides a favorable balance of multiplexing capacity (up to 5000 genes) with low false discovery rates. Molecular Cartography requires longer instrument run times (4 days) but achieves excellent subcellular resolution, while Merscope demands substantial hands-on time (5-7 days) which impacts operational throughput [75].
Experimental Design and Protocol Optimization
Sample Preparation and Quality Control
Proper sample preparation is critical for successful detection of low-expression genes across all platforms:
Tissue Preservation: RNAscope, Xenium, and Merscope all support FFPE tissues, the standard for clinical archives, though with different RNA integrity requirements. MERSCOPE typically recommends DV200 > 60%, while Xenium and CosMx suggest pre-screening based on H&E [78]. For fresh frozen tissues, RNAscope maintains RNA integrity well, facilitating detection of low-abundance transcripts [33].
Fixation Conditions: RNAscope has been optimized for tissues fixed according to ASCO/CAP guidelines (10% neutral buffered formalin for 6-72 hours at room temperature) [1]. Over-fixation can reduce sensitivity for low-expression genes, while under-fixation compromises morphology.
Protease Treatment: RNAscope employs precise protease digestion (typically 10 μg/mL protease at 40°C for 30 minutes for FFPE tissues) to balance tissue permeability with RNA preservation [1]. Similar enzymatic treatments are adapted across platforms, with concentrations requiring optimization for different tissue types.
Probe Design and Validation Strategies
Effective probe design is paramount for detecting low-expression genes:
RNAscope Probe Design: Custom software automatically selects target probe sequences with compatible melting temperature and minimal cross-hybridization to off-target sequences. Typically, 10-20 probe pairs are used for optimal signals and robustness against variable target accessibility and partial RNA degradation [1].
Control Probes: Each platform incorporates control probes for assay validation. RNAscope uses the housekeeping gene UBC as a positive control to assess tissue RNA integrity and bacterial dapB as a negative control [1]. Xenium includes 20 negative control probes and 141 blank code words, while CosMx incorporates 10 negative control probes [80].
Specificity Validation: Comparative studies show varying levels of non-specific detection across platforms. CosMx displayed multiple target gene probes expressing similarly to negative control probes (up to 31.9% in MESO2 TMA), including important markers for cell type annotation like CD3D and FOXP3 [80]. This highlights the importance of including control probes when studying low-expression genes.
The Scientist's Toolkit: Essential Research Reagents and Materials
Table 3: Essential Research Reagents for Spatial Transcriptomics Experiments
| Reagent/Category | Function | Platform Applications |
|---|---|---|
| RNAscope Target Probes | Double-Z probes for specific transcript hybridization | RNAscope HiPlex [1] |
| RNAscope Preamp/Amp/Label Probes | Hierarchical signal amplification system | RNAscope HiPlex [1] |
| Xenium Gene Panel | Padlock probes with gene-specific barcodes | Xenium [77] |
| MERSCOPE Primary Probes | Gene-specific probes with readout tails | MERSCOPE [77] |
| HybEZ Hybridization Oven | Temperature-controlled hybridization system | RNAscope [1] |
| Protease Enzyme | Tissue permeabilization for probe access | RNAscope, Xenium, MERSCOPE [1] |
| Formalin-Fixed Paraffin-Embedded (FFPE) Tissue Sections | Preserved tissue morphology with RNA integrity | All major platforms [1] [78] |
| DAPI Stain | Nuclear counterstain for cell segmentation | All imaging-based platforms [33] |
| Fluorophore-Conjugated Label Probes | Signal detection via fluorescence microscopy | RNAscope (fluorescent mode), Xenium, MERSCOPE [1] [77] |
| Chromogenic Substrates (DAB, Fast Red) | Enzyme-based signal detection for bright-field microscopy | RNAscope (chromogenic mode) [1] |
Applications in Low-Expression Gene Research
Tumor Microenvironment and Cancer Research
The tumor microenvironment presents particular challenges for studying low-expression genes due to cellular heterogeneity and complex tissue architecture. A comparative study of medulloblastoma with extensive nodularity (MBEN) demonstrated that automated imaging-based spatial transcriptomics methods, including Xenium, Merscope, and Molecular Cartography, effectively delineated intricate tumor microanatomy and captured cell-type-specific transcriptome profiles [33]. RNAscope served as a reliable reference method for validating expression patterns of key markers like NRXN3 and LAMA2 that define tumor compartments [33] [75].
For immune oncology applications, detection of low-expression immune checkpoint genes and cytokines is essential. Studies comparing platforms across FFPE tumor samples found that Xenium consistently generated higher transcript counts per gene without sacrificing specificity, advantageous for detecting low-abundance immune markers [78]. CosMx detected the highest transcript counts and uniquely expressed gene counts per cell among all platforms tested, though with some target genes expressing similarly to negative controls [80].
Neuroscience Applications
Neuroscience research frequently involves studying low-expression genes including neuropeptides, receptors, and transcription factors. RNAscope has established itself as a gold standard in this field due to its single-molecule sensitivity and compatibility with complex neural tissues [76]. The technology's ability to preserve tissue morphology while detecting rare transcripts has enabled mapping of intricate neural circuits and rare cell populations.
Recent comparisons in mouse brain tissues have shown that newer platforms like Xenium and Molecular Cartography approach similar sensitivity levels while offering higher multiplexing capabilities [33]. However, for focused studies of a limited panel of low-expression neural genes, RNAscope remains a preferred option due to its established protocols and robust performance across diverse neural tissues.
The optimal choice between RNAscope and other spatial transcriptomics platforms for low-expression gene research depends on specific research objectives, sample types, and resource constraints. RNAscope maintains distinct advantages for studies requiring the highest specificity for a limited panel of genes, particularly in clinical validation settings. Its established track record, single-molecule sensitivity, and robust performance across diverse tissue types make it ideal for confirmatory studies of low-abundance transcripts.
Newer high-plex platforms like Xenium offer compelling capabilities for discovery-phase research, combining broader transcriptome coverage with good sensitivity and low false discovery rates. Molecular Cartography provides exceptional resolution for subcellular localization of low-expression genes, while Merscope offers unique binary barcoding with error-correction features.
For researchers focusing on low-expression genes, a hybrid approach often proves most effective: using high-plex platforms for discovery and initial mapping, followed by targeted RNAscope validation of key low-expression targets. As spatial technologies continue to evolve, improvements in sensitivity, specificity, and multiplexing capabilities will further enhance our ability to study low-expression genes within their native tissue context, advancing both basic research and drug development programs.
The Wnt signaling pathway is a multifaceted pathway that controls embryonic development, adult tissue homeostasis, cell proliferation, survival, and migration [68]. Dickkopf-1 (DKK1), a secreted modulator of Wnt signaling, is frequently overexpressed in tumors and is associated with poor clinical outcomes [68]. In gastric and gastroesophageal junction (G/GEJ) adenocarcinomas, elevated DKK1 expression is linked to tumor growth, angiogenesis, metastasis, and an immunosuppressive tumor microenvironment [68] [81]. DKN-01, a humanized monoclonal therapeutic antibody that binds DKK1 with high affinity, has demonstrated clinical activity in G/GEJ patients with elevated tumoral DKK1, making accurate assessment of DKK1 expression crucial for patient selection [68] [81].
The development of a reliable diagnostic assay for DKK1 faced significant challenges. Traditional immunohistochemistry (IHC) suffered from limitations in sensitivity and specificity, while available antibodies for DKK1 were limited [68] [82]. Furthermore, DKK1 is often expressed at low levels, requiring an exceptionally sensitive detection method. This case study details the successful validation of a DKK1 RNAscope chromogenic in situ hybridization (CISH) assay—a novel in situ RNA analysis platform that provides single-molecule sensitivity while preserving tissue morphology—to overcome these challenges and enable precise patient stratification for targeted therapy [68] [12].
The RNAscope Technology: A Robust Platform for Low-Expression Genes
Core Principle and Advantages
The RNAscope technology represents a significant advancement over traditional RNA in situ hybridization (ISH) methods. Its unique double-Z (ZZ) probe design enables simultaneous signal amplification and background suppression, achieving single-molecule visualization [10] [12]. Each RNA molecule is detected as a distinct punctate dot, allowing for direct quantification [12]. This design makes it particularly suited for detecting low-expression genes like DKK1, where traditional methods lack sufficient sensitivity and specificity.
Key technological advantages include:
- Exquisite Sensitivity: Capable of detecting a single RNA molecule per cell [68] [10].
- High Specificity: The double-Z probe design requires two independent probe binding events for signal amplification, dramatically reducing non-specific background [10] [12].
- Degraded RNA Compatibility: The use of a pool of probes targeting different regions of the RNA allows for detection of partially degraded RNA in routine formalin-fixed, paraffin-embedded (FFPE) clinical specimens [68].
- Spatial Context Preservation: Unlike grind-and-bind methods like RT-PCR, RNAscope allows examination of biomarker status within the histopathological context of clinical specimens [12].
Experimental Workflow
The RNAscope assay follows a standardized, automated workflow that can be completed within a single day. The following diagram illustrates the key procedural stages:
Figure 1: RNAscope Automated Workflow for DKK1 Detection. The assay involves pretreatement to permit probe access, hybridization with target-specific probes, signal amplification, chromogenic detection, and quantitative analysis [68] [62].
Experimental Protocol: Validation of the DKK1 RNAscope Assay
Assay Development and Initial Specificity Testing
The validation followed Clinical Laboratory Improvement Amendments (CLIA) guidelines to ensure clinical applicability [68]. Initial development involved a systematic approach to establish assay specificity and dynamic range:
- Cell Line Selection: Four cell lines (PC3, A549, HeLa, and Pfeiffer) expressing a range of DKK1 were identified using publicly available RNA-Seq data from the Cancer Cell Line Encyclopedia (CCLE) database [68]. These cell lines were used to create a control FFPE cell pellet array (CPA).
- Specificity Assessment: To evaluate potential cross-reactivity with other Dickkopf family members, a specificity FFPE CPA was generated with cell lines expressing high levels of DKK2, DKK3, DKK4, or DKKL1 but low levels of DKK1 [68].
- Control Probes: Each experiment incorporated recommended control probes [9]:
- Positive Control: PPIB (peptidylprolyl isomerase B), a moderately expressed housekeeping gene, to verify RNA integrity and assay performance.
- Negative Control: dapB (a bacterial gene), to confirm absence of background staining.
Digital Image Analysis Algorithm
To reduce pathologist time and variability associated with manual scoring, a digital image analysis algorithm was developed using the open-source software QuPath [68]. The algorithm was designed to:
- Identify and segment tumor cells within the tissue section.
- Quantify the DKK1 signal by counting the number of dots per tumor cell.
- Categorize cells based on expression levels: negative (0 dots/cell), low (1-3 dots/cell), medium (4-9 dots/cell), or high (≥10 dots/cell) [68] [81].
- Calculate an H-score for each sample using the formula: H-score = (% low cells × 1) + (% medium cells × 2) + (% high cells × 3), providing a semi-quantitative assessment of DKK1 expression with a range of 0-300 [81].
Validation Study Design
The final validation was performed on 40 G/GEJ adenocarcinoma tumor resection specimens [68]. Key performance metrics were evaluated according to CLIA guidelines:
- Specificity: Assessed by examining signal localization to tumor cells and absence of signal in non-tumoral cells.
- Sensitivity: Confirmed by detecting tumor cells with a range of DKK1 expression, including cells with only a single dot (representing one RNA molecule).
- Accuracy: Determined by comparing RNAscope results with orthogonal methods including quantitative PCR (qPCR), ELISA, RNA-Seq, and IHC across multiple cancer cell lines.
- Precision: Evaluated through repeat testing and comparison between digital algorithm scoring and manual pathologist scoring.
Key Results and Performance Data
Validation Outcomes
The DKK1 RNAscope CISH assay successfully met all pre-defined acceptance criteria for clinical application. The results demonstrated robust performance across all validated metrics:
Table 1: Summary of DKK1 RNAscope Assay Validation Performance
| Performance Metric | Experimental Method | Key Finding | Result |
|---|---|---|---|
| Specificity | Staining of cell lines expressing other Dickkopf family members (DKK2-4, DKKL1) | Minimal to no cross-reactivity observed | No detectable off-target signal [68] |
| Sensitivity | Detection of single RNA molecules in tumor cells | Capable of detecting low-expression levels down to 1 dot/cell | Single-molecule sensitivity achieved [68] |
| Accuracy | Comparison with RNA-Seq data from 48 cell lines | Strong correlation with orthogonal method | Spearman's rho = 0.86 (p < 0.0001) [68] |
| Precision | Comparison between digital and manual pathologist scoring | Reduced variability with digital analysis | Lower coefficient of variation with algorithm [68] [82] |
DKK1 Scoring and Clinical Utility
The validation established a digital H-score system for classifying DKK1 expression levels. The scoring methodology and its clinical correlation are detailed below:
Table 2: DKK1 RNAscope Scoring System and Clinical Correlation
| Expression Category | Dots per Cell | H-Score Components | Clinical Response in Anti-PD-1/PD-L1-naïve GEJ/GC Patients |
|---|---|---|---|
| Negative | 0 | Not included in H-score | Objective Response Rate (ORR): 0% in DKK1-low patients [81] |
| Low | 1-3 | (% low cells) × 1 | |
| Medium | 4-9 | (% medium cells) × 2 | |
| High | ≥10 | (% high cells) × 3 | ORR: 50% in DKK1-high patients (H-score ≥35) [81] |
The clinical utility of the assay was demonstrated in a phase Ib trial where patients with G/GEJ adenocarcinoma receiving DKN-01 plus pembrolizumab showed significantly improved outcomes when their tumors had high DKK1 expression [81]. Patients with DKK1-high tumors (H-score ≥35, the upper tertile of expression) had an objective response rate of 50% compared to 0% in DKK1-low patients, with significantly improved progression-free survival (22.1 weeks vs. 5.9 weeks; HR, 0.24) [81].
The Scientist's Toolkit: Essential Research Reagent Solutions
Successful implementation of the DKK1 RNAscope assay requires specific reagents and controls. The following table details the essential components used in the validation study:
Table 3: Key Research Reagent Solutions for DKK1 RNAscope Assay
| Reagent / Solution | Function / Purpose | Specific Examples / Notes |
|---|---|---|
| DKK1 Target Probe | Specifically hybridizes to DKK1 mRNA sequence | Custom-designed by Advanced Cell Diagnostics; targets human DKK1 transcript [68] |
| Control Probes | Verify assay performance and RNA quality | PPIB: Positive control; dapB: Negative control [68] [9] |
| Automated Staining Platform | Standardize and automate assay procedure | Leica Biosystems BOND RX platform [68] [62] |
| Digital Analysis Software | Quantify signal and calculate H-score | QuPath open-source software for tumor cell identification and dot quantification [68] |
| Cell Pellet Array (CPA) | Assay development and control | FFPE pellets of PC3 (high DKK1), A549/HeLa (medium), Pfeiffer (negative) [68] |
The successful validation of the DKK1 RNAscope assay demonstrates the transformative potential of this technology for detecting low-expression genes in cancer research and diagnostic applications. By overcoming the limitations of traditional IHC and conventional ISH methods, RNAscope enables precise spatial quantification of challenging targets like DKK1 within the tumor microenvironment [68] [12] [82]. The incorporation of a digital image analysis algorithm further enhances the objectivity, reproducibility, and efficiency of the assessment, making it suitable for high-throughput clinical settings [68].
This case study establishes a generalizable framework for validating RNAscope assays with digital image quantification, providing a roadmap for developing companion diagnostics for other targeted therapies [68]. The ability to accurately measure DKK1 expression has enabled the identification of gastric cancer patients most likely to benefit from DKN-01 therapy, advancing the field of precision oncology and highlighting the critical role of robust biomarker assays in drug development [68] [81] [83]. As RNAscope technology continues to evolve, its application to other low-expression targets will further expand our understanding of cancer biology and therapeutic response mechanisms.
Conclusion
RNAscope technology represents a transformative approach for detecting low-expression genes with unprecedented sensitivity and spatial resolution, making previously undetectable targets accessible for research and clinical applications. Success hinges on understanding the foundational technology, implementing optimized methodological workflows, rigorous troubleshooting to maximize signal detection, and comprehensive validation against orthogonal methods. The integration of digital image analysis and proper control strategies provides the objectivity and reproducibility required for confident interpretation of low-abundance transcripts. As spatial biology continues to evolve, RNAscope for low-expression genes will play an increasingly vital role in uncovering novel biomarkers, understanding disease mechanisms at the molecular level, and advancing targeted therapeutic development. Future directions will likely see expanded multiplexing capabilities, enhanced sensitivity through chemistry improvements, and broader integration with protein detection for truly multi-omic spatial analysis.
References
- 1. RNAscope: A Novel in Situ RNA Analysis Platform for ... [https://pmc.ncbi.nlm.nih.gov/articles/PMC3338343/]
- 2. RNAscope ISH Technology [https://www.creative-bioarray.com/support/rnascope-ish-technology.htm]
- 3. 2025 Mar 25 - Visualize and Quantify Oligonucleotide ... [https://acdbio.com/2025-mar-25-visualize-and-quantify-oligonucleotide-therapy-delivery-spatial-biodistribution-and]
- 4. Probe Design | In Situ Hybridization, RNA-ISH [https://acdbio.com/support-solution-category/probe-design]
- 5. RNAscope in situ hybridization (ISH) FAQs [https://www.bio-techne.com/reagents/rnascope-ish-technology/getting-started/faqs]
- 6. RNAscope 2.5 HD Assay—BROWN | In Situ Hybridization, ... [https://acdbio.com/rnascope-25-hd-assay%E2%80%94brown]
- 7. RNAscope™ Assay [https://lifescience.invitro.com.au/applications-and-techniques/spatial-biology/rnascope-assay]
- 8. RNAscope Troubleshooting Guide and FAQ [https://acdbio.com/technical-support/solutions/faq]
- 9. Control Slides and Control Probes for RNAscope [https://acdbio.com/control-slides-and-control-probes-rnascope]
- 10. Evaluation of the Suitability of RNAscope as a Technique ... [https://pmc.ncbi.nlm.nih.gov/articles/PMC8710359/]
- 11. Antibody Validation & Challenges [https://acdbio.com/science/applications/research-solutions/antibody-validation-and-challenges]
- 12. RNAscope: A Novel in Situ RNA Analysis Platform for ... [https://www.sciencedirect.com/science/article/pii/S1525157811002571]
- 13. Combining RNAscope and immunohistochemistry to ... [https://www.frontiersin.org/journals/molecular-neuroscience/articles/10.3389/fnmol.2023.1225847/full]
- 14. Anatomic pathology in situ hybridization panels [https://acdbio.com/science/applications/research-solutions/anatomic-pathology-panels]
- 15. RNAscope Enables Spatial Genomic ISH ... [https://acdbio.com/science/how-it-works]
- 16. RNAscope® technology | In Situ Hybridization, RNA-ISH [https://acdbio.com/dataanalysisguide]
- 17. A Guide for RNAscope™ Data Analysis [https://www.bio-techne.com/reagents/rnascope-ish-technology/rnascope/guide-rnascope-data-analysis]
- 18. RNAscope Assay Technical Support and FAQ [https://acdbio.com/technical-support/getting-started]
- 19. RNAscope 2.5 HD Duplex Assay [https://acdbio.com/rnascope-25-hd-duplex-assay]
- 20. Fresh frozen vs FFPE samples for next-generation ... [https://www.lexogen.com/blog/fresh-frozen-vs-ffpe-samples-for-next-generation-sequencing-studies/]
- 21. RNAscope Multiplex FISH Signal Assessment in FFPE and ... [https://pmc.ncbi.nlm.nih.gov/articles/PMC11755420/]
- 22. Comparison of whole transcriptome sequencing of fresh, ... [https://pmc.ncbi.nlm.nih.gov/articles/PMC10058139/]
- 23. FFPE | In Situ Hybridization, RNA-ISH [https://acdbio.com/innovation/ffpe]
- 24. Detection and Quantification of Multiple RNA Sequences ... [https://pmc.ncbi.nlm.nih.gov/articles/PMC7476812/]
- 25. Automated Quantitative RNA in Situ Hybridization for ... [https://www.sciencedirect.com/science/article/pii/S1525157812003157]
- 26. 2025 Jan 14 - Unlock the role of spatial profiling in ... [https://acdbio.com/2025-jan-14-unlock-role-spatial-profiling-detecting-diverse-mrna-markers-and-short-targets]
- 27. Mixture modeling of transcript abundance classes in natural ... [https://pmc.ncbi.nlm.nih.gov/articles/PMC2394757/]
- 28. Mixture modeling of transcript abundance classes in natural ... [https://genomebiology.biomedcentral.com/articles/10.1186/gb-2007-8-6-r98]
- 29. Improving the Accuracy of qPCR for Low-Express [https://www.vazymeglobal.com/News/MediaReleases/1788840731881361410.html]
- 30. Intronic RNAscope probes enable precise identification of ... [https://pmc.ncbi.nlm.nih.gov/articles/PMC11977257/]
- 31. Fully Automated RNAscope In Situ Hybridization Assays for Formalin‐Fixed Paraffin‐Embedded Cells and Tissues - PMC [https://pmc.ncbi.nlm.nih.gov/articles/PMC5132049/]
- 32. Fresh Frozen RNAScope Protocol [https://www.protocols.io/view/fresh-frozen-rnascope-protocol-hfnab3maf.html]
- 33. Comparison of spatial transcriptomics technologies using ... [https://genomebiology.biomedcentral.com/articles/10.1186/s13059-025-03624-4]
- 34. How to choose chromogen colors for multiplex [https://www.leicabiosystems.com/es/articles/ls-articles/tips-tricks-to-multiplexing-how-to-choose-chromogen-colors-for-multiplex-and/]
- 35. How to choose chromogen colors for multiplex [https://www.leicabiosystems.com/pt-br/articles/ls-articles/tips-tricks-to-multiplexing-how-to-choose-chromogen-colors-for-multiplex-and/]
- 36. Society for Immunotherapy of Cancer - PubMed Central - NIH [https://pmc.ncbi.nlm.nih.gov/articles/PMC11749220/]
- 37. Identification of Optimal Decalcification Method and Tissue ... [https://www.mdpi.com/2304-6767/13/11/538]
- 38. Quantitative Analysis of Gene Expression in RNAscope ... [https://pmc.ncbi.nlm.nih.gov/articles/PMC9901451/]
- 39. in situ Hybridization Kits, Hybridization Assays [https://acdbio.com/manual-assays-rnascope]
- 40. Intron-Specific Neuropeptide Probes - PMC [https://pmc.ncbi.nlm.nih.gov/articles/PMC5079187/]
- 41. Intronic RNAscope probes enable precise identification of ... [https://pubmed.ncbi.nlm.nih.gov/40195462/]
- 42. Explore BaseScope™ Assays, a unique product from ACD [https://acdbio.com/basescope-assays-0]
- 43. Splice Variant | In Situ Hybridization, RNA-ISH [https://acdbio.com/science/applications/research-areas/splice-variant]
- 44. BaseScope™ Approach to Visualize Alternative Splice ... [https://pubmed.ncbi.nlm.nih.gov/35895265/]
- 45. 2025 Mar 18 - Accelerate RNA and Protein Biomarker ... [https://acdbio.com/2025-mar-18-accelerate-rna-and-protein-biomarker-development-new-rnascope%E2%84%A2-ish-protease-free-assays]
- 46. IHC antigen retrieval protocol [https://www.abcam.com/en-us/technical-resources/protocols/ihc-antigen-retrieval]
- 47. Antigen Retrieval in IHC: Why It Matters and How to Get ... [https://www.atlasantibodies.com/knowledge-hub/blog/antigen-retrieval-in-ihc-why-it-matters-and-how-to-get-it-right/]
- 48. Optimizing Your Antigen Retrieval Method - HIER vs PIER [https://www.bosterbio.com/blog/post/optimizing-your-antigen-retrieval-method-hier-vs-pier?srsltid=AfmBOorj75ro-B0HKOCKRqsVLaLut5UfkG5bMzH5Du86n28Qh_WmanlK]
- 49. Antigen Retrieval Methods [https://www.rndsystems.com/resources/protocols/antigen-retrieval-methods]
- 50. Heat-Induced Antigen Retrieval for Immunohistochemical ... [https://pmc.ncbi.nlm.nih.gov/articles/PMC7604828/]
- 51. Optimizing HIER Antigen Retrieval for IHC [https://www.bosterbio.com/blog/post/protocol-for-optimizing-hier-antigen-retrieval-conditions?srsltid=AfmBOopP5usDGXI3i8msFNAY441Nv9SKbABzTpVvolfI8NFNuweZA5hQ]
- 52. RNAscope Workflow, In Situ Hybridization Steps | ACD [https://acdbio.com/ebook/introduction/rnascope-workflow]
- 53. Best practices for RNA storage and sample handling [https://www.qiagen.com/us/knowledge-and-support/knowledge-hub/bench-guide/rna/introduction/general-remarks-on-rna-handling-storage-and-stabilization]
- 54. The Do's and Don'ts of Total RNA Isolation [https://www.thermofisher.com/us/en/home/references/ambion-tech-support/rna-isolation/general-articles/the-do-s-and-don-ts-of-total-rna-isolation.html]
- 55. RNAscope Troubleshooting Guide and FAQ [https://acdbio.com/technical-support/solutions]
- 56. RNAscope ISH Troubleshooting [https://www.bio-techne.com/resources/protocols-troubleshooting/rnascope-ish-troubleshooting]
- 57. Troubleshooting | In Situ Hybridization, RNA-ISH [https://acdbio.com/ebook/troubleshooting]
- 58. RNAscope common questions, troubleshooting, and tips ... [https://indicalab.com/news/rnascope-common-questions-troubleshooting-and-tips-and-tricks-2/]
- 59. An Overview of Quantitative Image Analysis of RNAscope ... [https://acdbio.com/2023-oct-10-overview-quantitative-image-analysis-rnascope-ish-data-professional-assay-services]
- 60. Guideline on how to quantify RNAscope™ Fluorescent ... [https://www.bio-techne.com/resources/protocols-troubleshooting/guidelines-quantify-rnascope-fluorescent-assay-results]
- 61. RNAscope compatibility with image analysis platforms for ... [https://www.sciencedirect.com/science/article/pii/S0065128121000878]
- 62. RNAscope ISH Reference Guide [https://www.bio-techne.com/reagents/rnascope-ish-technology/rnascope/rnascope-ish-reference-guide]
- 63. Reliable detection of RNA in hippocampus sections of mice ... [https://link.springer.com/article/10.1007/s00418-024-02277-x]
- 64. Simultaneous Multiplexed Imaging of mRNA and Proteins ... [https://www.sciencedirect.com/science/article/pii/S2405471217305434]
- 65. Clinical Laboratory Improvement Amendments (CLIA) [https://www.cdc.gov/clia/php/about/index.html]
- 66. Test Complexities | Clinical Laboratory Improvement ... [https://www.cdc.gov/clia/php/test-complexities/index.html]
- 67. CLIA Categorizations [https://www.fda.gov/medical-devices/ivd-regulatory-assistance/clia-categorizations]
- 68. Validation of a DKK1 RNAscope chromogenic in situ ... [https://www.nature.com/articles/s41598-021-89060-3]
- 69. Evaluation of the Suitability of RNAscope as a Technique to Measure Gene Expression in Clinical Diagnostics: A Systematic Review | Molecular Diagnosis & Therapy [https://link.springer.com/article/10.1007/s40291-021-00570-2]
- 70. RNA Sequencing in Comparison to Immunohistochemistry for Measuring Cancer Biomarkers in Breast Cancer and Lung Cancer Specimens - PMC [https://pmc.ncbi.nlm.nih.gov/articles/PMC7277916/]
- 71. RNA sequencing and immunohistochemistry jointly ... [https://pmc.ncbi.nlm.nih.gov/articles/PMC12318096/]
- 72. Comparison between qPCR and RNA-seq reveals challenges of quantifying HLA expression - PMC [https://pmc.ncbi.nlm.nih.gov/articles/PMC9883133/]
- 73. Clinical and analytical validation of a combined RNA ... [https://www.nature.com/articles/s43856-025-00934-3]
- 74. RNAscope in situ hybridization confirms mRNA integrity ... [https://pmc.ncbi.nlm.nih.gov/articles/PMC5706804/]
- 75. Comparison of spatial transcriptomics technologies using ... [https://pmc.ncbi.nlm.nih.gov/articles/PMC12180266/]
- 76. Bio-Techne's RNAscope® Technology Enabling Robust ... [https://acdbio.com/bio-technes-rnascope%C2%AE-technology-enabling-robust-gene-expression-and-biomarker-analysis-advances]
- 77. A practical guide for choosing an optimal spatial ... [https://bmcgenomics.biomedcentral.com/articles/10.1186/s12864-025-11235-3]
- 78. Systematic benchmarking of imaging spatial ... [https://www.nature.com/articles/s41467-025-64990-y]
- 79. Spatial Transcriptomic Analysis and ... [https://acdbio.com/2022-nov-30-becoming-spatial-experts-spatial-transcriptomic-analysis-and-cell-type-characterization]
- 80. Comparison of imaging based single-cell resolution spatial ... [https://www.nature.com/articles/s41467-025-63414-1]
- 81. Safety, Efficacy, and Biomarker Results from a Phase Ib ... [https://pmc.ncbi.nlm.nih.gov/articles/PMC9398109/]
- 82. Validation of a DKK1 RNAscope chromogenic in situ ... [https://epistem.co.uk/spotlights/histology/dkk1-rnascope-validation-gastric-adenocarcinoma/]
- 83. Original Research Article: Validation of a DKK1 RNAscope ... [https://flagshipbio.com/leap-therapeutics-dkk1-research-article/]