Mastering the RNAscope Manual Assay: A Comprehensive Guide from Workflow to Troubleshooting and Validation
This article provides a complete guide to the RNAscope manual assay, a revolutionary in situ hybridization technique for visualizing RNA within intact cells.
Mastering the RNAscope Manual Assay: A Comprehensive Guide from Workflow to Troubleshooting and Validation
Abstract
This article provides a complete guide to the RNAscope manual assay, a revolutionary in situ hybridization technique for visualizing RNA within intact cells. Tailored for researchers, scientists, and drug development professionals, it covers the foundational principles of the technology, delivers a detailed step-by-step methodological workflow, offers essential troubleshooting and optimization strategies, and discusses validation through control probes and comparative analysis with other gene expression methods. The content synthesizes official protocols and recent technical advances to empower users in achieving robust, publication-quality results in their research.
Understanding RNAscope Technology: Principles and Advantages for Spatial Gene Expression Analysis
RNAscope represents a transformative advancement in RNA in situ hybridization (ISH) technology, enabling highly sensitive and specific visualization of RNA expression within intact cells and tissues. This application note provides a comprehensive overview of the RNAscope platform, detailing its proprietary probe design, manual assay workflow, and key variations. Designed for researchers, scientists, and drug development professionals, this guide includes structured protocols for different sample types, a detailed reagent toolkit, and data comparing its performance to traditional methods. By providing single-molecule sensitivity in a morphological context, RNAscope is an indispensable tool for gene expression validation, biomarker development, and therapeutic research [1] [2].
The RNAscope assay is a novel ISH platform based on a patented double Z (ZZ) probe design that enables simultaneous signal amplification and background suppression [1] [2]. This technology allows for quantitative, sensitive, and specific detection of RNA species with single-cell resolution, making it an ideal tool to complement other methods like immunohistochemistry (IHC), qPCR, or next-generation sequencing (NGS) [1].
- Probe Design: RNAscope uses pairs of independently binding "Z probe" oligonucleotides, called "ZZ" probes, that are designed to hybridize to adjacent sequences of the target RNA. This double-Z design ensures that a signal is generated only when both probes bind in close proximity, dramatically enhancing specificity and minimizing off-target binding and background noise [3] [2].
- Signal Amplification: After the ZZ probes bind to the target RNA, a series of sequential hybridization steps with pre-amplifier and amplifier molecules create a large branching complex. This complex can then be detected through chromogenic precipitation or fluorescent labels, with each detected dot representing an individual RNA molecule [4] [2].
The following diagram illustrates the core mechanism of the RNAscope assay.
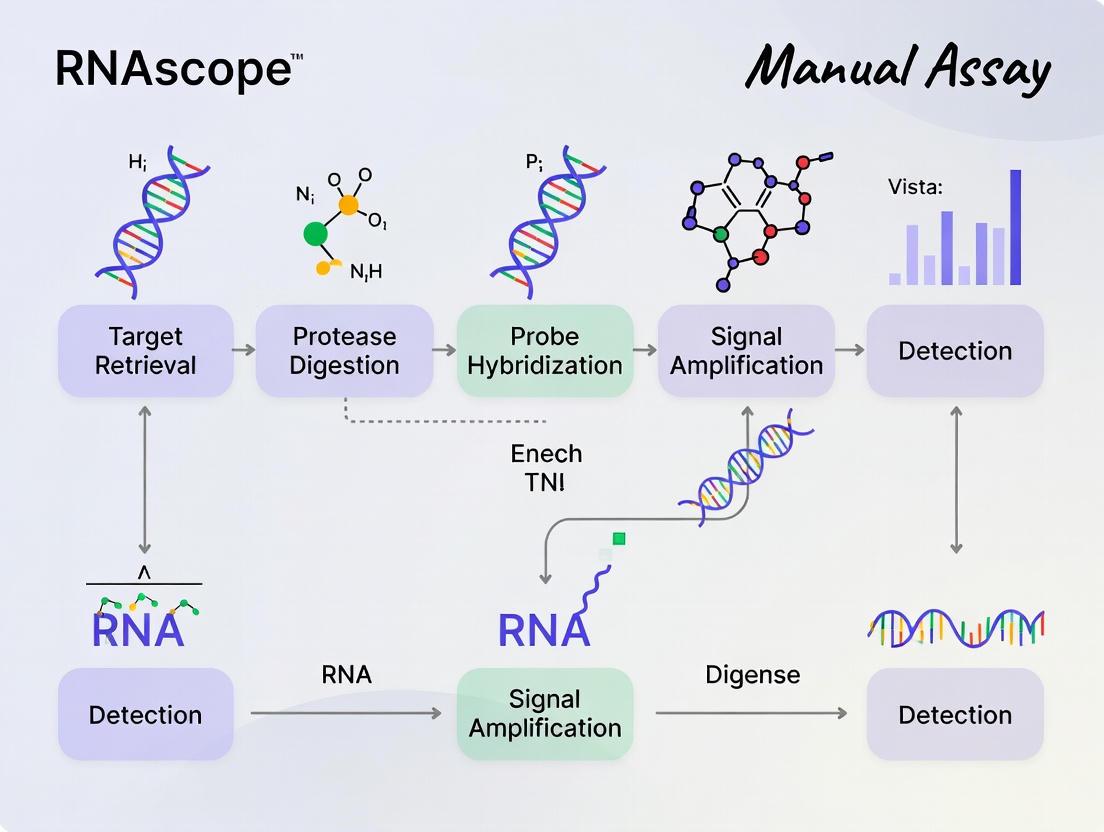
RNAscope Workflow and Experimental Design
The standard RNAscope manual assay can be completed within a single day [4]. The workflow is consistent across sample types, though key pretreatment steps differ significantly between formalin-fixed paraffin-embedded (FFPE) and fresh-frozen (F-F) tissues. The following chart outlines the core steps and major variations.
Sample Preparation and Pretreatment Guidelines
Proper sample preparation is critical for assay success. Under-fixation can lead to RNA degradation and poor morphology, while over-fixation can mask the target and reduce probe accessibility [5].
Table 1: Recommended Pretreatment Conditions by Sample Type
| Sample Type | Fixation | Target Retrieval | Protease Treatment |
|---|---|---|---|
| FFPE Tissues [3] | 4% Formaldehyde (standard) | 15 min at 99°C (required) | Protease Plus (15-20 min, RT) |
| Fresh-Frozen Tissues [5] | 4% PFA for 2 hours (min. 15 min) at RT | Not required | Protease IV (recommended) |
| Adherent/Non-adherent Cells [3] | 4% PFA (standard) | Not required | Protease III (recommended) |
Key Protocol Variations
Fresh-Frozen Mouse Brain Tissue Protocol [5]:
- Sample Prep: Perfuse mouse with PBS, harvest brain, embed in OCT, and freeze in 2-methylbutane chilled by dry ice. Section at 16 μm thickness.
- Fixation & Dehydration: Immerse slides in 4% PFA for 2 hours at RT. Wash in PBS. Dehydrate through a series of 50%, 70%, and two changes of 100% ethanol (5 min each).
- Pretreatment: Apply Hydrogen Peroxide for 10 min. Wash, then apply Protease Plus for 10 min at RT.
- Hybridization & Amplification: Apply probe mix and incubate for 2 hours at 40°C. Perform sequential amplifications with AMP1 (30 min), AMP2 (30 min), and AMP3 (15 min) at 40°C.
- Signal Development & Mounting: For fluorescent detection, apply HRC-C1 and corresponding Opal fluorophore (1:750 in TSA buffer). Repeat for other channels. Counterstain with DAPI and mount with ProLong Gold.
FFPE Plant Reproductive Tissue Protocol [6]:
- Fixation & Embedding: Submerge tissue in 4% formaldehyde with Silwet-L77. Perform vacuum infiltration. Dehydrate through a graded ethanol series (50%, 70%, 85%, 95%, 100%) and clear with Citrisolv. Infiltrate with paraffin.
- Pretreatment: Deparaffinize and rehydrate slides. Perform target retrieval. Protease treatment is also used.
- Hybridization & Detection: Follow standard RNAscope hybridization and amplification steps. Detect signal using Fast Red.
Applications and Research Solutions
RNAscope technology has broad applications across multiple research fields due to its sensitivity and flexibility [2].
Table 2: Key Applications of RNAscope Technology
| Application Field | Primary Use Case | Probe Examples/ Targets |
|---|---|---|
| Neuroscience | Mapping gene expression patterns in brain tissue [5] [2] | Neuronal activity markers, receptors |
| Oncology & Biomarker Validation | Identifying tumor biomarkers, understanding tumor microenvironment [7] [2] | PPIB, cytokine genes, immune markers |
| Infectious Disease Research | Visualizing viral RNA in host tissues [2] | SARS-CoV-2 RNA |
| Developmental Biology | Tracking gene expression during embryonic growth [2] | CYCLOIDEA, Histone H4 [6] |
| Therapeutic Development (ASOs, siRNA) | Evaluating biodistribution and efficacy of oligonucleotide therapies [8] | Synthetic small RNAs, target mRNAs |
Dual RNA and Protein Detection
A significant advancement is the ability to perform sequential RNAscope ISH and IHC/IF on the same tissue section. This allows for simultaneous detection of RNA and protein targets within their morphological context [9]. A new protease-free pretreatment workflow further facilitates this by preserving protease-sensitive protein epitopes that might be damaged in standard protocols [7].
Sequential ISH-IHC Protocol for FFPE Tissue [10]:
- Perform RNAscope assay first using the standard protocol for your sample type (see Table 1 for FFPE conditions).
- Following the ISH chromogenic detection, wash slides twice in wash buffer.
- Block with Normal Serum Blocking Reagent for 15 minutes.
- Incubate with primary antibody (using predetermined optimal conditions).
- Wash and apply HRP-conjugated secondary antibody for 30 minutes.
- Wash and apply a compatible chromogen (e.g., Green HRP solution for 10-15 minutes).
- Counterstain, dehydrate, and mount.
The Scientist's Toolkit: Essential Research Reagents
Successful execution of the RNAscope assay requires specific reagents and materials. The following table details the core components of the research toolkit.
Table 3: Essential Reagents and Materials for RNAscope Manual Assays
| Item Category | Specific Examples | Function |
|---|---|---|
| Core Assay Kits | RNAscope Multiplex Fluorescent Reagent Kit v2 [5]; RNAscope 2.5 HD Reagent Kit (Brown or Red) [10] | Provides core reagents for signal amplification and detection. |
| Protease Reagents | Protease Plus [5], Protease III [3], Protease IV [3] | Digests proteins to allow probe access to target RNA; strength varies by sample type. |
| Probes | Target-specific Z-probes (C1, C2, C3 channels) [5]; Positive Control (e.g., PPIB) & Negative Control (e.g., DapB) probes [5] | Target-specific reagents for RNA detection; controls validate assay performance. |
| Signal Detection | Opal fluorophores (520, 570, 690) [5]; Fast Red A & B [6]; HRP-blockers [5] | Fluorophores or chromogens for visualization; blockers for multiplexing. |
| Specialized Equipment | HybEZ Oven [5]; Hydrophobic Barrier Pen [5]; SuperFrost Plus slides [5] | Provides controlled hybridization temperature and defines hybridization area. |
| Mounting & Counterstaining | ProLong Gold Antifade Reagent [5]; DAPI [5]; VectaMount [10]; Gill's Hematoxylin [10] | Preserves fluorescence, stains nuclei, and prepares slides for microscopy. |
Performance and Comparison to Other Methods
RNAscope offers distinct advantages over traditional RNA detection methods.
Table 4: RNAscope vs. Traditional RNA and Protein Detection Techniques
| Feature | RNAscope | Traditional ISH | qPCR | Immunohistochemistry (IHC) |
|---|---|---|---|---|
| Sensitivity | Very high (single-molecule detection) [2] | Moderate [2] | High [2] | Protein-level only (variable) [2] |
| Spatial Resolution | Single-cell (morphological context preserved) [4] [2] | Limited [2] | None (tissue homogenate) [2] | Single-cell (morphological context preserved) [2] |
| Specificity | Very high (double-Z probe design) [1] [2] | Moderate (prone to background) [2] | High | Dependent on antibody quality |
| Multiplexing Capability | Yes (up to 3-4 targets with kits, 12 with HiPlex) [2] | Rare [2] | No | Limited (typically 1-2 targets) [2] |
| Sample Type Compatibility | FFPE, Frozen, Cells [2] | Mostly frozen [2] | RNA extracts [2] | FFPE, Frozen [2] |
Data Quantification and Analysis
RNAscope results in a punctate signal pattern, where each dot represents an individual RNA molecule [4]. These signals can be quantified manually or by using image analysis tools such as HALO software (Indica Labs) or Aperio RNA ISH Algorithm (Leica Biosystems) to count the number of dots per cell [4].
The RNAscope platform provides a robust and highly specific method for visualizing RNA in situ, addressing key limitations of traditional ISH. Its manual workflow is well-established for various sample types, and its compatibility with automated systems and IHC/IF makes it a cornerstone for spatial biology. The ability to co-detect RNA and protein biomarkers in the same tissue section with the new protease-free workflow offers researchers an powerful tool for comprehensive biomarker development and validation, particularly in complex fields like oncology, neuroscience, and therapeutic development [9] [7].
RNAscope represents a major advancement in in situ hybridization (ISH) technology, addressing the long-standing challenges of insufficient sensitivity and specificity that have limited the clinical and research application of traditional RNA ISH methods [11]. This novel signal amplification and background suppression technology achieves single-molecule visualization while preserving tissue morphology, enabling researchers to examine biomarker status within the complete histopathological context of clinical specimens [12] [11].
The fundamental breakthrough of RNAscope lies in its unique probe design strategy that allows simultaneous signal amplification and background suppression to achieve single-molecule visualization while preserving tissue morphology [11]. Unlike traditional "grind-and-bind" RNA analysis methods such as real-time RT-PCR that destroy tissue context, RNAscope brings the benefits of in situ analysis to RNA biomarkers, enabling precise localization of gene expression within individual cells in routine formalin-fixed, paraffin-embedded (FFPE) tissue specimens [11]. This technological advancement has opened new possibilities for translating RNA biomarkers into clinical use and has become an powerful tool for researchers and drug development professionals requiring precise spatial gene expression analysis.
The Double-Z Probe Design: Core Mechanism
Molecular Architecture
The RNAscope platform employs a patented double-Z probe design that forms the foundation of its exceptional performance characteristics [11]. This proprietary design fundamentally differs from traditional single-probe ISH approaches through its requirement for probe pair hybridization to generate a detectable signal.
The molecular architecture consists of a series of target probes specifically designed to hybridize to the target RNA molecule [11]. Each individual target probe contains three distinct regions:
- An 18-25 base region complementary to the target RNA sequence
- A spacer sequence that provides appropriate molecular distance
- A 14-base tail sequence (designated as "Z") that serves as a binding platform for subsequent amplification steps [11]
The critical innovation requires that a pair of target probes (the "double Z"), each possessing a different type of tail sequence (Z1 and Z2), must hybridize contiguously to the target RNA molecule, spanning approximately 50 bases [11]. Only when these two probes bind immediately adjacent to each other do their tail sequences combine to form a single 28-base hybridization site for the preamplifier molecule. This contiguous binding requirement is the fundamental mechanism that provides the technology's exceptional specificity and background suppression.
Signal Amplification Cascade
Following successful probe pair hybridization, RNAscope employs a hybridization-mediated signal amplification system that progressively builds detectable signals [11]. This multi-tiered cascade creates substantial amplification while maintaining tight spatial localization:
- Preamplifier Binding: The combined 28-base site formed by the double-Z probe pairs binds a single preamplifier molecule
- Amplifier Assembly: Each preamplifier contains 20 binding sites for amplifier molecules
- Label Probe Attachment: Each amplifier subsequently contains 20 binding sites for label probes [11]
This hierarchical structure creates a theoretical maximum of 8000 labels for each target RNA molecule when targeting a 1-kb region with 20 probe pairs [11]. The label probes can be conjugated with either fluorescent dyes for multiplex detection using epifluorescent microscopy or with enzyme reporters (horseradish peroxidase or alkaline phosphatase) for chromogenic detection using standard bright-field microscopy [11].
Table 1: Components of the RNAscope Signal Amplification System
| Component | Function | Binding Capacity |
|---|---|---|
| Target Probe Pair | Binds contiguously to target RNA | Forms 28-base preamplifier site |
| Preamplifier | Recognizes combined probe tails | Binds 20 amplifier molecules |
| Amplifier | Intermediate amplifier | Binds 20 label probes |
| Label Probe | Delivers detectable signal | Conjugated to enzymes or fluorophores |
Background Suppression Mechanism
The double-Z probe design incorporates a sophisticated background suppression mechanism that effectively distinguishes true signals from nonspecific hybridization [11]. This system operates through two primary specificity filters that eliminate background noise:
First, the requirement for contiguous hybridization of two separate probes dramatically reduces the probability of false-positive signals. It is statistically highly unlikely that nonspecific hybridization would position two different probe types immediately adjacent to each other along an off-target RNA molecule to form the required 28-base preamplifier binding site [11].
Second, individual 14-base tail sequences from single mis-hybridized probes lack sufficient binding strength to retain the preamplifier molecule during stringent washing steps. Even if a single probe were to bind nonspecifically, its isolated 14-base tail would not stably bind the preamplifier, preventing the initiation of the amplification cascade [11].
This dual mechanism of background suppression enables RNAscope to achieve an exceptional signal-to-noise ratio, allowing clear detection of individual RNA molecules as distinct punctate dots without the diffuse background staining that often plagues conventional ISH methods [12] [11]. Each discrete dot visualized under microscopy corresponds to a single RNA transcript, enabling true single-molecule sensitivity and precise quantification capabilities [4] [12].
Experimental Protocols for RNAscope Assay
Sample Preparation Requirements
Proper sample preparation is critical for successful RNAscope analysis, as RNA preservation quality directly impacts assay performance [13]. The technology is compatible with multiple sample types, including formalin-fixed paraffin-embedded (FFPE) tissues, fresh-frozen tissues, and cultured cells [11] [13]. For FFPE samples, which represent the most common specimen type in molecular pathology, fixation in 10% neutral buffered formalin for 6-72 hours at room temperature following ASCO/CAP guidelines provides optimal results [11].
The RNAscope procedure can be completed within a single day and consists of sequential steps that can be performed manually or on fully automated staining systems such as the Roche DISCOVERY ULTRA, Discovery XT, or Leica Biosystems' BOND RX Research Advanced Staining System [4]. The manual assay procedure typically requires 7-8 hours and can be conveniently divided over two days if necessary [13]. A critical advantage of RNAscope over traditional ISH methods is that it does not require an RNase-free environment, significantly simplifying laboratory workflow requirements [14] [15] [13].
Detailed Step-by-Step Protocol
The RNAscope assay follows a standardized workflow with specific requirements for each step to ensure optimal results:
Deparaffinization and Dehydration: For FFPE samples, complete paraffin removal is essential using xylene followed by ethanol series dehydration [11] [16]. This ensures adequate probe penetration to target RNA.
Endogenous Peroxidase Blocking: For chromogenic detection using enzyme-based systems, endogenous peroxidase activity must be blocked using hydrogen peroxide treatment to prevent hazy background after detection [16].
Target Retrieval: Heat-induced epitope retrieval reverses cross-linking caused by formalin fixation using citrate buffer (10 mM, pH 6) at boiling temperature (100-103°C) for 15 minutes [11] [16]. This can be performed using either a steamer or hot plate method.
Protease Digestion: Protease treatment (typically 10 μg/mL for 30 minutes at 40°C) permeabilizes samples to allow probe access to target mRNA [11] [16]. Protease Plus, a broad-spectrum protease, is commonly used for this purpose.
Target Probe Hybridization: Target probes in hybridization buffer (6× SSC, 25% formamide, 0.2% lithium dodecyl sulfate) are applied and incubated at 40°C for 2 hours [11] [16]. The proprietary double-Z oligo probes are designed to hybridize to specific RNA targets.
Amplification Steps (Amp 1-6): Sequential hybridization with preamplifier, amplifier, and label probe with stringent washing between each step builds the signal amplification cascade [11] [16].
Chromogenic or Fluorescent Detection: Enzyme-based detection uses DAB (brown) for HRP or Fast Red for alkaline phosphatase, while fluorescent detection uses dye-conjugated label probes [14] [11] [16].
Counterstaining and Mounting: Hematoxylin counterstaining provides morphological context for bright-field microscopy, followed by appropriate mounting medium application and coverslipping [11] [16].
Table 2: Critical Steps in RNAscope Experimental Protocol
| Step | Key Parameters | Purpose | Quality Control Check |
|---|---|---|---|
| Target Retrieval | Citrate buffer, pH 6, 15 min at 100°C | Reverse formalin cross-links | Tissue adhesion maintained |
| Protease Digestion | 10 μg/mL, 30 min at 40°C | Permeabilize tissue | Optimized for each tissue type |
| Probe Hybridization | 40°C for 2 hours in hybridization buffer | Specific target binding | Use control probes |
| Signal Amplification | Sequential Amp 1-6 steps with washes | Build detection system | No step omission |
| Chromogenic Detection | DAB or Fast Red reaction monitoring | Visualize target RNA | Prevent over-development |
Control and Validation Procedures
rigorous control strategy is essential for validating RNAscope results and ensuring assay specificity [13]. The recommended approach includes:
Positive Control Probes: Housekeeping genes including ubiquitin C (UBC), cyclophilin B (PPIB), or POLR2A assess tissue RNA integrity and assay procedure [11] [13]. Successful staining should generate a UBC score ≥3 or PPIB/POLR2A score ≥2 with relatively uniform signal throughout the sample.
Negative Control Probes: The bacterial gene dapB should not generate signal in properly fixed tissue, with ideal scores <1 indicating low to no background [11] [13].
Scoring Guidelines: RNAscope uses a semi-quantitative scoring system based on dots per cell rather than signal intensity [13]. The number of dots correlates directly to RNA copy numbers, with scoring criteria ranging from 0 (no staining) to 4 (>15 dots/cell with >10% dot clusters) [13].
Research Applications and Reagent Solutions
Advanced Research Applications
The unique capabilities of RNAscope technology have enabled sophisticated research applications across multiple biological fields:
The RNAscope 2.5 HD Duplex Assay permits simultaneous visualization of two RNA targets while maintaining single-cell resolution using HRP-based green and AP-based Fast Red chromogens to generate detectable green and red signals respectively [14]. This enables researchers to study gene co-regulation, profile gene expression in specific cell types, and map co-expression of two targets within the same cellular context [14].
Recent advances include intronic RNAscope probes that enable precise identification of cell type-specific nuclei by targeting unspliced pre-mRNA transcripts within nuclei [17]. This application has proven particularly valuable in cardiac regeneration studies, where identifying cardiomyocyte nuclei has been technically challenging using conventional antibody-based methods [17]. The Tnnt2 intronic RNAscope probe specifically labels cardiomyocyte nuclei and remains associated with chromatin throughout all mitotic stages, including after nuclear envelope breakdown [17].
The technology has been adapted for spatial profiling in disease research, such as mapping diverse RNA markers implicated in body weight regulation and obesity research at single-cell resolution [12]. The high specificity and sensitivity allow detection of gene transcripts at the single-molecule level while seamlessly fitting into existing anatomic pathology workflows [12].
Essential Research Reagent Solutions
Table 3: Key Research Reagent Solutions for RNAscope Experiments
| Reagent/Category | Specific Examples | Function and Application |
|---|---|---|
| Detection Kits | RNAscope 2.5 HD BROWN Reagent Kit [15], RNAscope 2.5 HD Duplex Reagent Kit [14] | Provide core reagents for signal amplification and detection; optimized for low-copy targets (1-20 copies/cell) |
| Control Probes | PPIB, UBC, POLR2A (positive) [13]; dapB (negative) [11] [13] | Validate assay performance, assess RNA quality, establish specificity |
| Target Probes | Catalog probes, Made-to-Order probes [14] | Target-specific detection; double-Z design for specific RNA recognition |
| Pretreatment Reagents | Target Retrieval Reagents, Protease Plus [16] | Unmask target RNA, permeabilize tissue sections |
| Auxiliary Supplies | HybEZ Hybridization System [14], ImmEdge Hydrophobic Barrier Pen [14] | Maintain optimal hybridization conditions, create liquid barrier on slides |
| Mounting Media | VectaMount Permanent Mounting Medium [14] | Preserve staining, enhance optical clarity for microscopy |
Technical Considerations and Troubleshooting
Successful implementation of RNAscope technology requires attention to several technical considerations that significantly impact assay performance:
For sample fixation, 10% neutral buffered formalin (NBF) or 4% paraformaldehyde (PFA) is recommended, with fixation duration optimized for different tissue types [13]. Over-fixed tissues may require extended target retrieval and protease digestion times, while under-fixed tissues may exhibit poor morphology and RNA retention [13].
The HybEZ Hybridization System maintains optimum humidity and temperature (40°C) during hybridization and amplification steps, which is critical for consistent results [13]. Throughout the procedure, slides must not be allowed to dry out, as this causes irreversible damage to tissue morphology and increases background staining [13].
Troubleshooting common issues involves systematic evaluation of control probe performance. Poor signal with positive control probes indicates issues with RNA quality or pretreatment conditions, while high background with negative control probes suggests excessive protease treatment or suboptimal washing [13]. For automated systems, regular instrument maintenance and solution replacement are essential to prevent microbial growth in fluidic lines that can cause inconsistent staining [13].
The RNAscope technology represents a robust platform for in situ RNA analysis that combines exceptional sensitivity with high specificity through its unique double-Z probe design and hierarchical amplification system. By enabling single-molecule visualization of RNA targets within morphological context, it provides researchers and drug development professionals with a powerful tool for spatial gene expression analysis across diverse research applications.
Key Advantages Over Traditional RNA ISH and IHC
RNAscope represents a significant advancement in the field of in situ hybridization (ISH), enabling highly sensitive and specific visualization of RNA within the context of intact cells and tissues. This technology addresses longstanding limitations of traditional RNA ISH and immunohistochemistry (IHC) by combining single-molecule detection sensitivity with precise spatial resolution. The core innovation lies in a unique double-Z probe design that facilitates signal amplification while simultaneously suppressing background noise [11] [18]. This application note details the key advantages of the RNAscope platform and provides detailed protocols for researchers seeking to implement this technology in their molecular pathology and drug development workflows.
Proprietary Double-Z Probe Design
The RNAscope platform utilizes a patented probe design strategy that fundamentally differs from traditional single-probe ISH approaches. This design employs pairs of "Z" probes that must bind contiguously to the target RNA molecule—a mechanism often compared to a two-key security system where both components are required for activation [18].
- Enhanced Specificity: Each target probe contains an 18-25 base region complementary to the target RNA, a spacer sequence, and a 14-base tail sequence. The requirement for two adjacent probes to hybridize correctly dramatically reduces non-specific binding, as it is statistically unlikely that nonspecific hybridization events would position two probes appropriately along an off-target sequence [11].
- Modular Signal Amplification: When a Z-probe pair correctly hybridizes to the target RNA, their tail sequences combine to form a 28-base hybridization site for a preamplifier molecule. This preamplifier contains 20 binding sites for an amplifier, which in turn contains 20 binding sites for enzyme-conjugated label probes [11]. This hierarchical amplification system can theoretically yield up to 8,000 labels for each target RNA molecule [11].
Comparative Performance Data
Extensive validation studies have demonstrated RNAscope's advantages over traditional techniques across various applications and target molecules. The table below summarizes key performance metrics from published comparative studies.
Table 1: Comparative Performance of RNAscope vs. Traditional Methods
| Target/Biomarker | Application Context | RNAscope Performance | Traditional Method Performance | Key Advantage | Citation |
|---|---|---|---|---|---|
| UPK2 | Urothelial carcinoma diagnosis | 68.0% positivity rate | IHC: 62.6% positivity rate | Higher detection sensitivity, particularly in variant bladder UC (53.3% vs 35.6%) | [19] |
| General RNA Targets | Clinical diagnostic applications | 81.8-100% concordance with qPCR/qRT-PCR | Traditional RNA ISH: Limited to highly expressed genes | Enables detection of low-abundance transcripts impossible with traditional ISH | [20] |
| Housekeeping Genes | RNA quality control | Single-molecule sensitivity for PPIB, Polr2A, UBC | Conventional ISH: Poor sensitivity for moderate/low expression | Provides internal controls for tissue RNA integrity assessment | [20] |
| Multiple Targets | Multiplexed analysis | Simultaneous 4-plex detection in same tissue section | Traditional ISH: Typically single-plex | Enables co-localization studies and complex biomarker panels | [11] [21] |
Direct Comparison with Traditional ISH and IHC
RNAscope addresses fundamental limitations of both traditional RNA ISH and IHC, positioning it as a superior platform for many research and diagnostic applications.
Table 2: Key Advantages of RNAscope Over Traditional Techniques
| Feature | Traditional RNA ISH | Traditional IHC | RNAscope |
|---|---|---|---|
| Sensitivity | Limited to highly expressed genes [11] | Dependent on antibody affinity and epitope preservation | Single-molecule detection capability [11] [18] |
| Specificity | High background noise common [20] | Cross-reactivity concerns with polyclonal antibodies | Dual-Z probe design ensures minimal background [11] |
| Target Preservation | RNA vulnerable to degradation during processing | Protein epitopes sensitive to fixation conditions | Compatible with routine FFPE specimens [11] |
| Multiplexing Capacity | Technically challenging | Limited by antibody host species and color separation | Up to 4 targets simultaneously with distinct channels [21] |
| Quantification | Qualitative or semi-quantitative | Subjective scoring systems | Digital dot counting enables precise quantification [20] |
| Workflow | Complex, often radioactive | Standardized but variable between antibodies | Standardized protocol under 6 hours [4] |
Research Reagent Solutions
Successful implementation of RNAscope requires specific reagents and equipment optimized for the technology. The following table outlines essential components for establishing this methodology in research laboratories.
Table 3: Essential Research Reagents and Equipment for RNAscope
| Item Category | Specific Product/System | Function/Purpose | Critical Notes |
|---|---|---|---|
| Probe Systems | Target-specific Z-probe pairs | Hybridize to RNA target of interest | 20 probe pairs typically target 1kb region [11] |
| Control Probes | PPIB, Polr2A, UBC (positive); dapB (negative) | Assay validation and RNA quality assessment | Positive control selection based on expected expression level [20] |
| Detection Reagents | RNAscope reagent kits (chromogenic/fluorescent) | Signal amplification and detection | HRP- or alkaline phosphatase-based systems available [11] |
| Equipment | HybEZ Oven System | Temperature and humidity control | Critical for consistent assay performance [21] |
| Automation Options | Roche Discovery Ultra, Leica BOND RX | Automated staining | Standardized results and higher throughput [4] |
| Analysis Software | HALO, Aperio, QuPath | Signal quantification and analysis | Enable digital dot counting for precise quantification [20] |
Detailed Experimental Protocols
RNAscope Manual Assay Workflow for FFPE Tissues
The following protocol outlines the standard manual workflow for formalin-fixed, paraffin-embedded (FFPE) tissue sections, which represents the most common application in molecular pathology.
Sample Preparation and Pretreatment
- Sectioning: Cut FFPE tissue sections at 4-5 μm thickness and mount on charged slides. Dry slides overnight at room temperature or 60°C for 1 hour.
- Deparaffinization and Hydration:
- Immerse slides in xylene for 5 minutes (repeat twice)
- Transfer through ethanol series: 100% ethanol (twice), 70% ethanol (once), 50% ethanol (once) - 2 minutes each
- Rinse in distilled water
- Antigen Retrieval:
- Incubate slides in citrate buffer (10 mM, pH 6.0) at 100-103°C for 15 minutes using a hot plate or water bath
- Rinse in deionized water and immediately proceed to protease digestion
- Protease Digestion:
- Treat slides with Protease Plus (10 μg/mL) at 40°C for 30 minutes in a HybEZ oven
- Rinse briefly in distilled water or 1× PBS
Critical Step Note: Protease concentration and incubation time must be optimized for each tissue type. Under-digestion results in lower signal, while over-digestion causes poor morphology and RNA loss [21].
Probe Hybridization
- Probe Preparation:
- Prepare target probe mixture in hybridization buffer
- For multiplex assays, mix C1, C2, C3, and/or C4 probes according to manufacturer's recommendations [21]
- Include positive control (PPIB for moderate expression, UBC for high expression) and negative control (dapB) probes
- Hybridization:
- Apply probe mixture to completely cover tissue sections
- Incubate slides at 40°C for 2 hours in a HybEZ oven with humidity control
- Post-Hybridization Washes:
- Wash slides in 1× wash buffer (provided in kit) for 2 minutes at room temperature (repeat twice)
Signal Amplification and Detection
- Amplification Steps:
- Apply AMP1 reagent; incubate at 40°C for 30 minutes; wash twice in wash buffer
- Apply AMP2 reagent; incubate at 40°C for 30 minutes; wash twice in wash buffer
- Apply AMP3 reagent; incubate at 40°C for 15 minutes; wash twice in wash buffer
- Signal Development:
- For chromogenic detection: Apply HRP-based label probe followed by DAB substrate development
- For fluorescent detection: Apply HRP-based label probe followed by tyramide signal amplification with fluorophores (Opal dyes)
- Counterstaining and Mounting:
- Counterstain with hematoxylin (chromogenic) or DAPI (fluorescent)
- Coverslip using aqueous mounting medium
Modified Protocol for Fresh-Frozen Tissues
For fresh-frozen tissues, modifications to the standard FFPE protocol are required to address differences in tissue preservation and RNA accessibility [5].
- Tissue Preparation:
- Embed fresh tissue in OCT compound and freeze in 2-methylbutane cooled by dry ice
- Section at 7-16 μm thickness using a cryostat and mount on SuperFrost Plus slides
- Store slides at -80°C until use
- Fixation:
- Immerse slides in 4% PFA in 1× PBS for 2 hours at room temperature (minimum 15 minutes)
- Wash twice in 1× PBS
- Dehydration:
- Immerse sequentially in 50% ethanol (5 min), 70% ethanol (5 min), and 100% ethanol (twice, 5 min each)
- Air dry slides and draw a hydrophobic barrier around sections
- Tissue Pretreatment:
- Apply hydrogen peroxide solution for 10 minutes at room temperature to quench endogenous peroxidases
- Wash in distilled water
- Apply Protease Plus for 10 minutes at room temperature
- Wash in 1× PBS
- Probe Hybridization and Amplification: Follow standard FFPE protocol from section 4.1.2 onward
Note: For fresh-frozen tissues, fixation time is critical. Under-fixation leads to protease over-digestion and RNA loss, while over-fixation reduces probe accessibility and signal intensity [5].
Advanced Applications and Integration
Multiplex RNA Detection
RNAscope enables simultaneous detection of multiple RNA targets within the same tissue section through its channel-specific probe system:
- Four-Channel System: Independent detection of up to four targets using C1, C2, C3, and C4 probe channels [21]
- Probe Configuration: C1 probes are ready-to-use, while C2, C3, and C4 probes are supplied as 50× concentrates that must be mixed with C1 probes or blank probe diluent [21]
- Experimental Design: Include appropriate controls for each channel and validate single-plex detection before attempting multiplex experiments
Sequential RNA-Protein Detection (Dual ISH-IHC)
The platform supports combined detection of RNA and protein biomarkers on the same tissue section, providing comprehensive molecular profiling:
- Workflow Options: Perform RNAscope first followed by IHC, or vice versa, depending on target sensitivity requirements [9]
- Protease-Free Pretreatment: Newer workflow options eliminate protease treatment that might damage protein epitopes [9]
- Validation Applications: Confirmed successful detection in human lung cancer (PPIB RNA with CAM5.2 cytokeratin protein) and other tissue contexts [9]
Quantitative Analysis Methods
RNAscope enables precise quantification through digital analysis of signal dots, with each dot representing an individual RNA molecule:
- Manual Counting: Score multiple representative regions following manufacturer's guidelines for standardized assessment [20]
- Automated Analysis: Utilize specialized software platforms including HALO (Indica Labs) or Aperio (Leica Biosystems) for high-throughput quantification [4] [20]
- Scoring Criteria: Evaluate based on dots per cell or dots per unit area, with thresholds established for positive expression based on negative control signals
RNAscope technology represents a transformative advancement in RNA analysis, offering researchers and drug development professionals unprecedented capability to study gene expression within morphological context. The platform's unique double-Z probe design enables specific detection of individual RNA molecules while maintaining tissue architecture—a capability that bridges the gap between traditional molecular techniques and morphological analysis. With robust performance across FFPE and frozen tissues, compatibility with automated staining platforms, and flexible multiplexing options, RNAscope provides a powerful tool for validating transcriptomic discoveries, characterizing disease biomarkers, and advancing personalized medicine approaches. The standardized protocols and quantitative output further enhance its utility in both research and clinical translation settings.
Proper pre-assay planning is a critical determinant of success for the RNAscope manual assay. This application note provides a detailed checklist of essential materials, reagents, and equipment required to execute a reliable RNAscope in situ hybridization workflow. The RNAscope technology enables sensitive visualization of individual RNA molecules within intact cells and tissues, but this sensitivity depends heavily on proper sample preparation, reagent quality, and appropriate equipment configuration. This guide synthesizes the core requirements for establishing the RNAscope assay in a research laboratory, focusing on the manual workflow that can be completed within a single day [4]. By adhering to this pre-assay planning guide, researchers can minimize procedural errors, reduce assay variability, and generate high-quality, publication-ready data for drug development and basic research applications.
Materials and Equipment Checklist
A comprehensive collection of the necessary reagents, probes, and specialized equipment forms the foundation of a successful RNAscope assay. The following tables provide a systematic overview of these essential components.
Table 1: Core Reagent Kits and Probe Components
| Component Category | Specific Items | Description and Purpose |
|---|---|---|
| Reagent Kits | RNAScope Multiplex Fluorescent Reagent Kit v2 [5] | Contains amplification reagents (AMP 1, 2, 3), HRP channels (HRP-C1, C2, C3), HRP blockers, and wash buffer necessary for signal development. |
| Target Probes | C1 Ready-To-Use (RTU) Probes [21] | Target-specific probes for Channel 1, supplied ready for use. |
| C2, C3, C4 50X Concentrated Probes [21] | Target-specific probes for additional channels, requiring dilution with a C1 RTU probe or Blank Probe Diluent. | |
| Control Probes & Slides | Positive Control Probes (e.g., PPIB, UBC, POLR2A) [22] [23] | Species-specific probes for housekeeping genes to verify RNA quality and assay performance. |
| Negative Control Probe (dapB) [22] [23] | Probe targeting a bacterial gene to assess non-specific background signal. | |
| RNAscope Control Slides (e.g., Human Hela or Mouse 3T3 Cell Pellets) [22] | Pre-made control slides to validate the entire assay workflow. |
Table 2: Essential Laboratory Equipment and Consumables
| Category | Item | Critical Notes |
|---|---|---|
| Specialized Equipment | HybEZ Oven System [21] | A critical, validated benchtop hybridization oven for maintaining consistent temperature (40°C) and humidity during incubations. |
| Microscope (Bright-field/Fluorescent) [4] | For visualizing chromogenic punctate dots or fluorescent signals. | |
| Cryostat (for frozen tissues) [5] | For sectioning fresh-frozen or fixed-frozen tissues at 7-15 µm thickness. | |
| General Lab Supplies | SuperFrost Plus Microscope Slides [5] [22] | Recommended to prevent tissue loss during the rigorous protocol. |
| Hydrophobic Barrier Pen [5] | Creates a liquid barrier around tissue sections to prevent reagent evaporation and tissue drying. | |
| Coverslips (e.g., 24x60mm No. 1.5) [5] | For mounting slides with appropriate mounting medium. | |
| Slide Staining Chambers or Holders | For performing wash and immersion steps. | |
| Reagents & Solutions | 4% Paraformaldehyde (PFA) in PBS [5] | For post-sectioning fixation of frozen tissues. |
| Fresh Ethanol Gradients (50%, 70%, 100%) [21] [5] | For tissue dehydration; always use fresh aliquots. | |
| 1X Phosphate-Buffered Saline (PBS) [5] | For washing steps; prepared using autoclaved, nuclease-free water. | |
| ProLong Gold Antifade Reagent with DAPI [5] | For fluorescent mounting and nuclear counterstaining. |
Sample Preparation Guidelines
Proper sample preparation is the most critical pre-assay variable for achieving optimal RNAscope results. The protocol varies significantly based on sample type, and deviations from recommended guidelines are a primary source of assay failure.
Sample Type-Specific Considerations
Formalin-Fixed Paraffin-Embedded (FFPE) Tissues: Tissues must be fixed in 10% neutral-buffered formalin (NBF) for 16–32 hours at room temperature [22] [23]. Under-fixation or over-fixation can severely impact results. Fixed tissues should be processed into paraffin blocks with a thickness of 3-4 mm. Sections should be cut at 5 ± 1 μm thickness and mounted on SuperFrost Plus slides. Slides must be air-dried and baked at 60°C for 1-2 hours prior to the assay, and analyzed within 3 months of sectioning when stored with desiccant at room temperature [22].
Fresh-Frozen and Fixed-Frozen Tissues: For fresh-frozen mouse brain tissue, immediately place the harvested brain in OCT compound and freeze it in a metal beaker filled with 2-methylbutane, surrounded by a dry ice-methanol mixture [5]. Section the tissue on a cryostat at a thickness of 10–20 μm for fresh frozen or 7–15 μm for fixed frozen tissue [22]. After sectioning, immerse slides in 4% PFA for at least 15 minutes (up to 2 hours) at room temperature for post-fixation [5]. Subsequently, dehydrate the sections through a series of ethanol baths (50%, 70%, and two changes of 100%, 5 minutes each) [5]. Dehydrated slides can be stored in 100% ethanol at -20°C for up to one week, although proceeding immediately is recommended [5].
Critical Control Setup
Always include control probes and slides in every run. Control slides (e.g., HeLa or 3T3 cell pellets) test the assay conditions, while control probes test the sample's RNA quality [22]. A successful staining is indicated by a positive control (e.g., PPIB/POLR2A) score of ≥2 and a negative control (dapB) score of <1 [22] [23].
The RNAscope manual assay follows a sequential workflow from sample pretreatment through hybridization, signal amplification, and detection. The following diagram visualizes the key stages and critical decision points in the protocol.
Diagram 1: RNAscope Manual Assay Workflow. The process involves sequential stages of sample preparation, pretreatment, hybridization, amplification, and detection, with specific time and temperature requirements for each step [4] [21] [5].
Critical Success Factors and Troubleshooting
Several factors require meticulous attention to ensure assay success. The following guidelines address the most common pitfalls in the RNAscope workflow.
Temperature and Humidity Control: The HybEZ oven is critically important as it is the only hybridization system extensively validated by ACD for consistent temperature and humidity control [21]. Using non-validated incubators may lead to inconsistent results.
Protease Digestion Optimization: Protease digestion is a critical step that requires precise optimization. Under-digestion results in low signal and high background, while over-digestion causes poor morphology and RNA loss [21]. The optimal protease incubation time may need adjustment based on fixation conditions.
Probe Handling and Multiplexing Setup: For multiplex assays, each target probe must be in a different channel (C1, C2, C3, C4). C1 probe is mandatory for multiplexing; it can be substituted with a Blank Probe Diluent if no specific C1 target is needed [21]. Channel C2, C3, and C4 probes (shipped as 50X concentrates) must be mixed with a C1 Ready-to-Use probe or Blank Probe Diluent.
Reagent Quality and Slide Handling: Always use fresh reagents, including ethanol and xylene [21]. Flick or tap slides to remove residual reagent, but never let the slides dry at any point during the assay [21]. Ensure the hydrophobic barrier remains intact to prevent tissue drying, which can cause high background.
Thorough pre-assay planning using this comprehensive checklist provides the foundation for successful implementation of the RNAscope manual assay. Attention to sample preparation guidelines, meticulous control of incubation conditions, and adherence to optimized reagent protocols are essential for generating reliable, high-quality data. By ensuring that all materials, reagents, and equipment are available and properly validated before beginning the assay, researchers can maximize the world-leading sensitivity and specificity of the RNAscope platform for their research and drug development applications.
The quality of Formalin-Fixed Paraffin-Embedded (FFPE) tissue preparation directly determines the success and reliability of subsequent molecular analyses, including the RNAscope manual assay workflow. Proper fixation, embedding, and sectioning preserve tissue morphology and protect RNA integrity, enabling accurate visualization and quantification of RNA molecules within their native spatial context. For researchers and drug development professionals, adherence to standardized protocols is not merely a preliminary step but a critical determinant in generating meaningful, reproducible data for research and diagnostic applications. This application note provides detailed, evidence-based guidelines for FFPE tissue preparation, specifically framed within the context of optimizing samples for RNAscope in situ hybridization technology.
The widespread use of FFPE samples in biomedical research is largely due to the simple, reliable, and cost-effective nature of the preservation method, which allows for long-term storage of tissue specimens at room temperature for decades [24]. Archives of FFPE-preserved specimens in hospital pathology sections represent an invaluable resource, overcoming barriers to tissue acquisition for large cohort investigations [25]. However, the process of creating FFPE blocks is a meticulous one designed to preserve tissue integrity for all subsequent analyses [26]. When properly prepared, FFPE samples are remarkably stable; however, any deviations from optimal protocols can compromise molecular information and undermine experimental outcomes.
FFPE Sample Preparation: A Step-by-Step Protocol
The preparation of FFPE samples is a multi-stage process that requires careful attention at each step to ensure the preservation of both morphological detail and molecular integrity, particularly for RNA molecules that will be targeted in RNAscope assays.
Tissue Acquisition and Fixation
The process begins with tissue acquisition, where fresh material is obtained through biopsies or surgical resection of organs or tissues of interest [26]. To preserve biological structures in a state that closely mimics native tissue, fixation must be performed as soon as possible after removal from the patient, donor, or laboratory animal [26]. The time between tissue removal and fixation, known as ischemic time, can significantly affect sample quality; prolonged ischemic times lead to cellular degradation, compromising molecular and structural integrity [26].
For optimal results in RNAscope assays, FFPE tissue specimens should be fixed for 24 +/- 8 hours in 10% neutral-buffered formalin (NBF) at room temperature [22]. The fixation duration is critical and varies with tissue type and size, with optimal fixation times typically ranging from 6 to 24 hours [26]. Inadequate fixation times result in poor preservation, making samples unsuitable for molecular studies, while over-fixation can lead to excessive protein cross-linking, which may affect the quality of nucleic acids [26]. Formalin fixation preserves tissue through extensive cross-linking of biomolecules, which subsequently complicates molecular analyses but effectively halts all cellular processes, preserving the structural and molecular components of the tissue [25] [26].
Table 1: Critical Parameters for Tissue Fixation
| Parameter | Optimal Specification | Consequence of Deviation |
|---|---|---|
| Fixative | 10% Neutral Buffered Formalin (NBF) | Alternative fixatives may compromise RNA integrity |
| Fixation Time | 16-32 hours (24 ± 8 hours) | Under-fixation: poor preservation; Over-fixation: excessive cross-linking |
| Tissue Thickness | 3-4 mm blocks | Thicker tissues impede formalin penetration |
| Temperature | Room temperature | Elevated temperatures may accelerate RNA degradation |
| Ischemic Time | As short as possible | Prolonged time leads to cellular degradation and RNA loss |
Tissue Dehydration, Clearing, and Paraffin Embedding
Following fixation, the tissue undergoes dehydration to remove water molecules, as the subsequent paraffin wax is not water-soluble [26]. This is achieved by immersing samples in a graded series of ethanol solutions, ending with pure 100% ethanol [26]. Proper dehydration is essential, as immersion directly in 100% ethanol could cause sample degradation and protein denaturation [26].
The dehydration step is followed by clearing, where a clearing agent (typically xylene or less toxic alternatives like isopropanol) displaces ethanol and removes fat from the tissue [26]. This process "clears" the tissue to allow complete penetration of paraffin wax for the final preservation step [26]. Due to the toxicity of xylene, isopropanol is often used as an alternative, though this requires embedding with higher-temperature wax [26].
The final preparation step is paraffin embedding, where the cleared tissue is embedded in hot paraffin at approximately 60°C [26]. The paraffin solidifies as it cools, providing structural support for the tissue, which enables sectioning for various types of examination [26]. The embedding process must be performed carefully, as improper embedding may result in incomplete or uneven sections, affecting the accuracy of all subsequent analyses [26].
Diagram 1: Comprehensive FFPE Tissue Preparation Workflow. This diagram outlines the critical steps in preparing FFPE tissues optimized for RNAscope assays, highlighting key parameters at each stage.
Sectioning and Storage
For RNAscope assays, FFPE tissue sections should be cut into sections of 5 +/- 1μm thickness [22]. Using the appropriate microscope slides is essential; Fisher Scientific SuperFrost Plus Slides are recommended for all tissue types to avoid tissue loss [22]. Once sectioned, the slides need to be air-dried and baked at 60°C for 1-2 hours prior to the RNAscope assay [22].
For preservation of RNA integrity, specimens should be analyzed within 3 months of sectioning when stored at room temperature with desiccant [22]. While FFPE blocks themselves are stable for years or even decades at room temperature [26], sectioned slides have a more limited shelf-life due to the exposed tissue surface and potential for RNA degradation over time.
Optimization for RNAscope Assays
Critical Factors for RNAscope Performance
The RNAscope assay is particularly sensitive to sample preparation conditions. Several factors are critical for optimal assay performance. Both temperature and humidity during the assay procedure are crucial, which is why the HybEZ oven is the only hybridization oven that ACD has extensively tested and validated [21]. Other incubators or hybridization stations may not provide consistent results [21].
Protease digestion is another critical step in the RNAscope workflow. Under-digestion will result in lower signal and a ubiquitous background, while over-digestion will result in poor morphology and loss of RNA [21]. This step often requires optimization depending on the tissue type and fixation method [22].
For tissues not prepared according to ACD's recommended guidelines, particularly those fixed differently than the 16-32 hours in fresh 10% NBF, optimization of antigen retrieval conditions may be necessary [22]. The pretreatment guidelines documented in the RNAscope assay user manual should serve as the starting point, with adjustments made based on tissue type and fixation history [22].
Quality Control and Validation
Implementing rigorous quality control measures is essential for successful RNAscope experiments. Always use control probes and slides to validate assay conditions and sample RNA quality [22]. Housekeeping genes like PPIB (Cyclophilin B), often used as reference genes for RT-PCR, can serve as positive controls, while the bacterial dapB gene is used as a negative control [22].
When interpreting RNAscope staining, it's recommended to score the number of dots per cell rather than signal intensity [22]. The number of dots correlates to the number of RNA copy numbers, whereas dot intensity reflects the number of probe pairs bound to each molecule [22]. Successful staining should have a PPIB/POLR2A score ≥2 or UBC score ≥3 and a dapB score <1 when compared with both negative and positive controls [22].
Table 2: RNAscope Quality Control Standards
| Quality Metric | Acceptance Criteria | Interpretation Guidelines |
|---|---|---|
| Positive Control (PPIB/POLR2A) | Score ≥2 | Verifies RNA integrity and assay performance |
| Negative Control (dapB) | Score <1 | Confirms specificity of signal; higher scores indicate background |
| RNA Quality Assessment | DV200 values and RQS | Sample-specific quality metrics for RNA integrity |
| Morphology Preservation | Intact cellular structure | Poor morphology suggests over-digestion or fixation issues |
| Staining Interpretation | Punctate dots per cell | Dot count correlates with RNA copy number; intensity is secondary |
RNA Extraction and Quality Assessment
While RNAscope is an in situ method that does not require RNA extraction, understanding the quality and quantity of RNA recoverable from FFPE samples provides valuable insight into sample suitability. Recent studies have systematically compared the effectiveness of commercially available RNA extraction kits specifically designed for use with FFPE samples [27].
The quantity and quality of RNA recovered can vary significantly across different extraction kits and tissue types [27]. Key metrics for assessing RNA quality include the RNA Quality Score (RQS), a parameter that assesses RNA integrity on a scale of 1 to 10, with a score of 10 corresponding to intact RNA and a score of 1 corresponding to highly degraded RNA [27]. The DV200 value, which represents the percentage of RNA fragments longer than 200 nucleotides, is another important quality metric [27].
Studies have found notable differences in both the quantity and quality of RNA recovered when using different extraction kits, with some kits performing better than others in terms of RQS and DV200 values [27]. When extracting RNA from FFPE samples, the Promega ReliaPrep FFPE Total RNA miniprep system yielded the best ratio of both quantity and quality across tested tissue samples, while the Roche kit provided systematically better quality recovery than other kits [27].
The Scientist's Toolkit: Essential Research Reagents and Materials
Table 3: Essential Research Reagents for FFPE Tissue Preparation and RNAscope Assay
| Reagent/Material | Function/Application | Specification Notes |
|---|---|---|
| 10% Neutral Buffered Formalin (NBF) | Tissue fixation | Preserves tissue architecture through protein cross-linking |
| Ethanol Series | Tissue dehydration | Graded concentrations (70%, 95%, 100%) to remove water |
| Xylene/Isopropanol | Tissue clearing | Removes alcohol and fat; enables paraffin infiltration |
| Paraffin Wax | Tissue embedding | Provides structural support for microtomy |
| SuperFrost Plus Slides | Tissue section mounting | Adhesive coating prevents tissue loss during processing |
| RNAscope Target Probes | Target RNA detection | Species-specific probes for genes of interest |
| Control Probes (PPIB, dapB) | Assay validation | Verify RNA integrity and assay specificity |
| HybEZ Oven System | Hybridization incubation | Maintains precise temperature and humidity control |
| Protease Reagents | Tissue permeabilization | Enzyme-based treatment to enable probe access |
Meticulous attention to FFPE tissue preparation protocols is a prerequisite for successful RNAscope assays and reliable research outcomes. By adhering to the detailed guidelines presented for fixation, embedding, sectioning, and quality control, researchers can ensure optimal preservation of both morphological structure and RNA integrity. The standardized protocols and optimization strategies outlined in this application note provide a foundation for generating robust, reproducible data that advances scientific discovery and drug development efforts. As the field continues to evolve, these fundamental sample preparation techniques will remain critical to harnessing the full potential of FFPE tissue archives for spatial transcriptomics and molecular pathology applications.
Executing the RNAscope Manual Assay: A Detailed Step-by-Step Protocol
In the manual RNAscope assay workflow, the pretreatment phase is critical for successful detection of target RNA within intact cells. This phase prepares formalin-fixed, paraffin-embedded (FFPE) tissue sections by removing the paraffin embedding medium, blocking endogenous enzymatic activity that causes background staining, and retrieving target epitopes that become masked during fixation. Proper execution of these steps ensures optimal RNA accessibility while preserving tissue morphology, forming the foundation for the specific hybridization and amplification steps that follow in the RNAscope protocol [28].
Deparaffinization and Rehydration
Protocol Objective
The objective of deparaffinization and rehydration is to completely remove paraffin from the embedded tissue sections and gradually hydrate them to an aqueous state, preparing the tissues for subsequent aqueous-based solutions used in staining and hybridization steps.
Detailed Methodology
- Xylene Incubation: Immerse slides in xylene or xylene substitute for 2-3 changes, 5 minutes each [29].
- Ethanol Dehydration Series:
- Final Hydration: Rinse in distilled water, PBS, or Tris buffer: 2 changes, 3 minutes each [29].
Critical Note: Once tissue sections have been rehydrated, do not allow them to dry at any point during subsequent procedures. Drying causes irreversible tissue damage and increased non-specific background staining [29] [28].
Technical Specifications
Table 1: Deparaffinization and Rehydration Solutions and Incubation Times
| Processing Step | Solution | Number of Changes | Incubation Time |
|---|---|---|---|
| Deparaffinization | Xylene | 2-3 | 5 minutes each |
| Dehydration | 100% Ethanol | 2 | 3 minutes each |
| Dehydration | 95% Ethanol | 2 | 3 minutes each |
| Hydration | 80% Ethanol | 1 | 3 minutes |
| Hydration | 50% Ethanol | 1 | 3 minutes |
| Final Rinse | dH₂O/PBS/Tris | 2 | 3 minutes each |
Endogenous Enzyme Blocking
Principles and Rationale
Endogenous peroxidases, pseudoperoxidases, and alkaline phosphatases present in tissues can react with chromogenic substrates used for detection, generating nonspecific background staining that obscures specific signal [30] [31]. This interference is particularly problematic in highly metabolic tissues such as liver, kidney, and tissues rich in erythrocytes [30].
Peroxidase Blocking Methods
- Hydrogen Peroxide-Methanol Solution: Prepare a solution of 0.3-3% hydrogen peroxide in 100% methanol. Immerse slides for 10-30 minutes at room temperature [29].
- Commercial Peroxidase Blockers: Pre-formulated solutions such as Peroxidase Suppressor (0.3% hydrogen peroxide in aqueous 0.1% sodium azide) or BLOXALL Endogenous Blocking Solution can be applied for 10-15 minutes at ambient temperature or 37°C [30] [31].
Alkaline Phosphatase Blocking
- Levamisole Solution: Add levamisole to a final concentration of 1 mM to inhibit endogenous alkaline phosphatase activity [30].
- Dual Enzyme Blockers: BLOXALL Endogenous Blocking Solution simultaneously blocks both peroxidase and alkaline phosphatase activity in a single 10-minute incubation step [31].
Method Selection Guidelines
Table 2: Endogenous Enzyme Blocking Methods and Applications
| Enzyme Type | Blocking Method | Concentration/Format | Incubation Time | Compatible Detection |
|---|---|---|---|---|
| Peroxidase | H₂O₂ in Methanol | 0.3-3% in 100% methanol | 10-30 minutes | HRP-based systems |
| Peroxidase | Peroxidase Suppressor | Ready-to-use solution | 10-15 minutes | HRP-based systems |
| Alkaline Phosphatase | Levamisole | 1 mM final concentration | With secondary AB | AP-based systems |
| Both Enzymes | BLOXALL Solution | Ready-to-use solution | 10 minutes | HRP or AP systems |
Target Retrieval
Heat-Induced Epitope Retrieval (HIER)
Heat-Induced Epitope Retrieval (HIER) uses high temperatures and specific buffers to break protein cross-links formed during formalin fixation, thereby restoring epitope accessibility [32].
Buffer Selection
- Citrate Buffer (10 mM sodium citrate, 0.05% Tween 20, pH 6.0): Effective for many targets, particularly nuclear antigens [32].
- Tris-EDTA Buffer (10 mM Tris base, 1 mM EDTA, 0.05% Tween 20, pH 9.0): Suitable for more challenging epitopes, especially cytoplasmic and membrane antigens [32] [33].
- EDTA Buffer (1 mM EDTA, pH 8.0): An alternative high-pH retrieval solution [32].
HIER Methods
- Pressure Cooker Method:
- Add antigen retrieval buffer to pressure cooker and bring to a boil.
- Transfer deparaffinized slides to boiling buffer and secure lid.
- Once full pressure is reached, time for 3 minutes.
- Release pressure and run cold water over cooker for 10 minutes [32].
- Microwave Method:
- Place slides in microwaveable vessel with retrieval buffer.
- Heat at full power until boiling, then continue boiling for 20 minutes.
- Monitor buffer level to prevent drying.
- Cool slides by running cold tap water into vessel for 10 minutes [32].
- Steamer Method:
RNAscope-Specific Retrieval Considerations
For RNAscope assays, antigen retrieval conditions may require optimization depending on tissue type and fixation method [28]. Unlike IHC, no cooling is required after retrieval; slides can be directly transferred to room temperature water to stop the reaction [28].
Retrieval Buffer Performance
Table 3: Antigen Retrieval Buffer Properties and Applications
| Retrieval Buffer | pH | Composition | Optimal For | Considerations |
|---|---|---|---|---|
| Sodium Citrate | 6.0 | 10 mM sodium citrate, 0.05% Tween 20 | Nuclear antigens, most common targets | Widely compatible with various tissues |
| Tris-EDTA | 9.0 | 10 mM Tris, 1 mM EDTA, 0.05% Tween 20 | Challenging epitopes, cytoplasmic/membrane antigens | Higher pH may enhance retrieval for some targets |
| EDTA | 8.0 | 1 mM EDTA | Alternative high-pH retrieval | Simpler composition |
Integrated Workflow
Diagram 1: Integrated workflow for RNAscope pretreatment phase.
Research Reagent Solutions
Table 4: Essential Reagents for RNAscope Pretreatment Phase
| Reagent Category | Specific Product/Composition | Function | Application Notes |
|---|---|---|---|
| Deparaffinization | Xylene or xylene substitute | Dissolves and removes paraffin from tissue sections | Essential for transitioning from embedded to aqueous state [29] |
| Hydration Series | 100%, 95%, 80%, 50% Ethanol | Gradual replacement of organic solvent with water | Prevents tissue damage from abrupt chemical changes [29] |
| Peroxidase Block | 3% Hydrogen Peroxide in methanol | Quenches endogenous peroxidase activity | Critical for reducing background in HRP-based detection [30] [29] |
| Alkaline Phosphatase Block | Levamisole (1 mM) or BLOXALL | Inhibits endogenous alkaline phosphatase | Necessary for AP-based detection systems [30] [31] |
| Antigen Retrieval Buffer | Citrate pH 6.0 or Tris-EDTA pH 9.0 | Unmasks epitopes cross-linked during fixation | Buffer selection depends on target antigen [32] [33] |
| Specialized Slides | Superfrost Plus slides | Provides superior tissue adhesion | Required for RNAscope to prevent tissue detachment [28] |
| Hydrophobic Barrier | ImmEdge Hydrophobic Barrier Pen | Creates barrier to retain solutions on section | Maintains proper hydration throughout assay [28] |
Protease digestion is a critical pretreatment step in the RNAscope in situ hybridization (ISH) assay, serving as the primary method for tissue permeabilization to enable probe access to target RNA. This enzymatic treatment directly influences both signal intensity and background noise, making its optimization essential for assay performance. The RNAscope technology represents a major advance over traditional RNA ISH, allowing for sensitive detection of target RNA within intact cells through a patented signal amplification and background suppression system [28]. Unlike traditional ISH, the RNAscope assay does not require an RNase-free environment, but it does demand precise execution of its protocol, where protease digestion stands out as a particularly sensitive step [28] [21].
The fundamental purpose of protease digestion in the RNAscope workflow is to adequately permeabilize the fixed tissue sample without compromising its morphological integrity. This delicate balance requires careful optimization, as under-digestion will result in lower signal and potential ubiquitous background, while over-digestion leads to poor morphology and irreversible RNA loss [21]. For researchers working within the broader context of RNAscope manual assay workflow optimization, understanding and mastering this step is paramount for generating publication-quality data that accurately reflects gene expression patterns within their experimental models.
Scientific Principles of Protease-Mediated Permeabilization
Mechanism of Action
Protease digestion functions by selectively digesting protein components within the fixed tissue matrix, thereby creating physical channels that allow the RNAscope probes to access their target mRNA sequences. The fixation process, typically with formalin, creates protein-RNA and protein-protein cross-links that shield target RNA molecules from detection. Protease treatment reverses this masking effect by cleaving peptide bonds and breaking down these cross-links, effectively increasing tissue porosity and enabling probe penetration [34].
The protease enzyme targets specific amino acid sequences within the fixed tissue, with the extent of digestion determining the size and distribution of the created access points. This mechanism differs fundamentally from detergent-based permeabilization methods, which solubilize lipid membranes rather than digest protein structures. The enzymatic nature of protease digestion provides greater specificity and control over the permeabilization process, though it also introduces additional variables that require optimization, including enzyme concentration, incubation time, and temperature [34].
Critical Parameters for Optimal Permeabilization
Several interdependent parameters dictate the effectiveness of protease digestion in the RNAscope assay. Temperature maintenance at precisely 40°C during the protease digestion step is essential for consistent enzyme activity and reproducible results [28]. The incubation duration must be carefully calibrated based on tissue type and fixation history, with typical ranges between 15-30 minutes for most formalin-fixed paraffin-embedded (FFPE) tissues [28].
Tissue characteristics significantly influence protease requirements. Under-fixed tissues generally require milder digestion, while over-fixed tissues need more extensive treatment to achieve adequate permeabilization. Similarly, tissue thickness and cellular density affect protease penetration rates, necessitating adjustment of digestion times. The specific protease formulation used also impacts digestion efficiency, with RNAscope assays typically utilizing Protease Plus, a broad-spectrum protease specifically optimized for this application [16].
Experimental Protocols for Protease Digestion Optimization
Standard RNAscope Protease Digestion Protocol
The following protocol outlines the standard protease digestion procedure for RNAscope assays using FFPE tissue sections:
- Sample Preparation: Cut FFPE tissue sections at 5 μm thickness and mount on Superfrost Plus slides. Bake slides at 60°C for 1 hour to ensure adhesion [28].
- Deparaffinization and Rehydration: Immerse slides in xylene for 5 minutes, repeat with fresh xylene, then sequentially transfer through 100% ethanol (2×), 95% ethanol, and 70% ethanol for 1 minute each [16].
- Hydrophobic Barrier Application: Circle samples with an ImmEdge Hydrophobic Barrier Pen to create a well for reagent containment [28].
- Protease Application: Apply RNAscope Protease Plus solution to completely cover the tissue section within the hydrophobic barrier.
- Incubation: Place slides in a pre-warmed Humidity Control Tray and incubate in the HybEZ Oven at 40°C for 30 minutes (standard condition) [28] [16].
- Rinsing: Gently rinse slides with distilled water to terminate protease activity.
- Proceeding to Hybridization: Immediately continue with the target probe hybridization step according to the RNAscope protocol.
Table 1: Required Reagents and Equipment for Standard Protease Digestion
| Item | Specification | Purpose |
|---|---|---|
| Protease | RNAscope Protease Plus | Tissue permeabilization |
| Slides | Superfrost Plus | Tissue adhesion during processing |
| Barrier Pen | ImmEdge Hydrophobic Barrier | Contain reagents on tissue section |
| Incubation System | HybEZ Oven with Humidity Control Tray | Maintain precise temperature and humidity |
Optimization Strategies for Challenging Samples
For tissues that deviate from ideal fixation conditions or present unique challenges, the following optimization approaches are recommended:
For over-fixed tissues (fixation >32 hours in 10% NBF):
- Increase Protease Plus incubation time in 10-minute increments up to 60 minutes maximum
- Alternatively, increase incubation temperature to 45°C with monitoring of morphology
- Combine with extended target retrieval time (5-minute increments) [28]
For delicate tissues (e.g., brain, embryonic tissues):
- Reduce Protease Plus incubation time to 15-20 minutes
- Decrease incubation temperature to 37°C
- Monitor morphology closely with control sections [28]
For decalcified tissues (bone, teeth):
- Use gentle decalcification methods (ACD decalcification buffer or Morse's solution)
- Extend Protease Plus incubation to 35-45 minutes based on validation results
- Include additional control sections to verify RNA integrity [35]
Automated platform adjustments (BOND RX system):
- Standard: 15 minutes Protease at 40°C
- Mild: 15 minutes Protease at 40°C with reduced ER2 (15 min at 88°C)
- Extended: Incrementally increase Protease time by 10 minutes while maintaining 40°C [28]
Diagram 1: Protease Digestion Workflow and Optimization Pathways. This diagram illustrates the standard protease digestion protocol with integrated troubleshooting pathways for various tissue types.
Quantitative Optimization Data and Analysis
Protease Digestion Conditions and Outcomes
Systematic optimization of protease digestion parameters directly impacts RNAscope assay performance. The following table summarizes quantitative relationships between digestion conditions and experimental outcomes based on empirical data:
Table 2: Protease Digestion Optimization Parameters and Outcomes
| Tissue Condition | Protease Time | Temperature | Target Retrieval | Expected RNAscope Score | Morphology Preservation |
|---|---|---|---|---|---|
| Ideal Fixation (16-32h 10% NBF) | 30 minutes | 40°C | Standard (15 min) | PPIB ≥2, dapB <1 | Excellent |
| Under-fixed (<16h) | 20-25 minutes | 40°C | Standard (15 min) | Variable, potential background | Good to excellent |
| Over-fixed (>32h) | 35-45 minutes | 40°C | Extended (+5 min increments) | Potentially reduced | Moderate, potential degradation |
| Decalcified (ACD buffer) | 35-45 minutes | 40°C | Standard (15 min) | PPIB ≥2 (if RNA preserved) | Good |
| Delicate Tissues (brain, embryo) | 15-20 minutes | 37-40°C | Reduced (10 min) | Target-dependent | Excellent with optimization |
Protease Activity Under Different Conditions
Understanding protease performance under various conditions is essential for troubleshooting. The following data, adapted from membrane protein digestion studies, illustrates how different additives affect enzymatic activity:
Table 3: Protease Activity Under Different Chemical Environments
| Condition | Additive Concentration | Relative Trypsin Activity | Relative Chymotrypsin Activity | Application Notes |
|---|---|---|---|---|
| Standard Buffer | None | 100% | 100% | Baseline activity |
| Methanol | 10% | 85-90% | 80-85% | Mild membrane permeabilization |
| Methanol | 30% | 60-70% | 55-65% | Significant activity reduction |
| RapiGest | 0.01% | 90-95% | 85-90% | Compatible with digestion |
| SDS | 0.01% | 70-80% | 65-75% | Use with caution |
| SDS | 0.1% | 40-50% | 30-40% | Strong inhibition |
Troubleshooting Common Protease Digestion Issues
Problem Identification and Resolution
Despite careful optimization, researchers may encounter issues related to protease digestion. The following table outlines common problems, their probable causes, and recommended solutions:
Table 4: Troubleshooting Guide for Protease Digestion Issues
| Problem | Possible Causes | Recommended Solutions | Validation Approach |
|---|---|---|---|
| No Signal | Under-digestion, incomplete permeabilization | Increase protease time in 5-10 min increments; verify temperature maintenance at 40°C | Run positive control (PPIB); check negative control (dapB) |
| High Background | Over-digestion, non-specific probe access | Reduce protease time by 5-10 min; ensure fresh reagents are used | Compare dapB background to established baseline |
| Poor Morphology | Excessive protease digestion, tissue degradation | Reduce protease time and/or temperature; use milder target retrieval | Examine H&E stained section for structural integrity |
| Inconsistent Signal | Variable protease activity, uneven heating | Calibrate incubator; pre-warm all reagents; ensure consistent slide orientation | Run multiple controls across different slide positions |
| Tissue Detachment | Inadequate slide coating, vigorous washing | Use Superfrost Plus slides; ensure proper baking; gentle washing technique | Include extra control sections to monitor adhesion |
Quality Control Measures
Implementing rigorous quality control measures ensures consistent protease digestion performance:
- Control Probes: Always include positive control probes (PPIB, POLR2A, or UBC) and negative control probes (dapB) with each assay run to assess sample RNA quality and optimal permeabilization [28].
- Staining Evaluation: Successful protease digestion should yield a positive control score ≥2 for PPIB and <1 for dapB, with relatively uniform signal distribution throughout the sample [28].
- Morphological Assessment: Examine hematoxylin counterstain to verify tissue integrity after protease treatment, noting any significant degradation or detachment.
- Signal Pattern Analysis: Evaluate whether signal distribution aligns with expected expression patterns for validated targets.
The Scientist's Toolkit: Essential Research Reagent Solutions
Table 5: Essential Research Reagents for RNAscope Protease Digestion
| Reagent/Equipment | Specification | Function | Validation Notes |
|---|---|---|---|
| Protease Plus | RNAscope proprietary formulation | Broad-spectrum protease for tissue permeabilization | Optimized specifically for RNAscope workflow; alternative proteases not recommended |
| HybEZ Oven | ACD validated system | Maintains precise 40°C temperature during incubation | Critical for consistent results; other incubators may not provide uniform heating |
| Humidity Control Tray | ACD accessory | Prevents slide drying during extended incubations | Essential for maintaining reagent volume and concentration |
| ImmEdge Hydrophobic Barrier Pen | Vector Laboratories Cat. No. 310018 | Creates barrier to contain reagents | Only pen validated to maintain barrier throughout RNAscope procedure |
| Superfrost Plus Slides | Fisher Scientific specified | Provides superior tissue adhesion | Required to prevent tissue detachment during protease treatment |
| Control Probes | PPIB, POLR2A, UBC (positive); dapB (negative) | Assay performance validation | Qualifies sample RNA and checks permeabilization efficiency |
Protease digestion represents a critical determinant of success in the RNAscope assay workflow, serving as the gateway for probe access to target RNA while maintaining tissue morphological integrity. Through systematic optimization of digestion parameters based on tissue-specific characteristics and fixation history, researchers can achieve optimal permeabilization that balances signal intensity with background control. The protocols and troubleshooting guidelines presented here provide a framework for reliable implementation of this crucial step, enabling researchers across drug development and basic research to generate robust, reproducible spatial gene expression data using RNAscope technology. As with all aspects of the RNAscope workflow, adherence to validated protocols—without modification—ensures consistent performance and reliable results [28] [21].
Nucleic acid hybridization is a fundamental technique in molecular biology that enables the detection and localization of specific DNA or RNA sequences within a complex biological sample. This process relies on the inherent ability of complementary nucleic acid strands to anneal to one another through hydrogen bonding between base pairs. A labeled, target-specific probe is used to locate its complementary sequence, allowing researchers to obtain temporal and spatial information about gene expression and genetic loci [36]. The utility of this method is based on the original discovery by Watson and Crick that DNA is a double-stranded molecule held together by hydrogen bonds between complementary bases, which allows denatured DNA from the same parent molecule to reanneal under appropriate conditions of pH, temperature, and ionic strength [37].
The hybridization process consists of several critical steps: preparation of the target nucleic acid (which may be immobilized on membranes, within tissues, or in solution), application of the labeled probe, incubation under controlled conditions to facilitate specific binding, removal of unbound probe through washing, and finally detection of the hybridized probe [38] [37]. The specificity and efficiency of hybridization depend on multiple factors including probe design, hybridization temperature, buffer composition, and washing stringency. These parameters must be carefully optimized to distinguish between perfectly matched sequences and those with mismatches, especially when working with highly variable viral genomes or single-nucleotide polymorphisms [39].
Hybridization Techniques and Their Applications
Various hybridization techniques have been developed to address different research needs, each with distinct advantages and applications. The table below summarizes the primary hybridization methods used in research and diagnostics:
Table 1: Major Hybridization Techniques and Their Characteristics
| Technique | Principle | Detection Method | Primary Applications | Key Advantages |
|---|---|---|---|---|
| RNAscope (ISH) [4] [21] | In situ hybridization with signal amplification | Bright-field or fluorescence microscopy | RNA localization and expression in tissue contexts | Single-molecule sensitivity, preserved morphology |
| FISH [36] | Fluorescence-labeled probes hybridized to targets | Fluorescence microscopy | Gene presence, copy number, location, and mutation analysis | Multiplexing capability, visual co-localization |
| CISH [36] | Chromogenic probes hybridized to targets | Bright-field microscopy | Molecular pathology diagnostics | Simultaneous viewing of signal and tissue morphology |
| Hybridization Capture for NGS [40] [41] | Solution-based capture using biotinylated probes | Next-generation sequencing | Targeted genomic sequencing, variant discovery | Uniform coverage, ability to target large regions |
| DNA Probe Hybridization [38] | Membrane-based hybridization | Colorimetric, chemiluminescent, or radioactive detection | Microbial identification, colony hybridization | Qualitative and semi-quantitative results |
In Situ Hybridization Techniques
In situ hybridization (ISH) represents a powerful category of hybridization techniques that enables localization of specific nucleic acid targets within fixed tissues and cells, providing spatial information about gene expression that cannot be obtained through extraction-based methods [36]. The two main visualization approaches for ISH are fluorescence (FISH) and chromogenic (CISH) detection, each with distinct advantages. FISH utilizes fluorophore-labeled probes and allows multiplex detection of several targets simultaneously by using spectrally distinct labels for different probes [36]. This capability makes FISH particularly valuable for studying co-localization of genetic elements or multiple gene expression patterns within a single specimen. RNA FISH using branched DNA signal amplification, such as in ViewRNA and PrimeFlow assays, provides greater specificity, lower background, and higher signal-to-noise ratios through a multi-step process involving sample preparation, target hybridization, signal amplification, and detection [36].
CISH, in contrast, uses enzyme-linked probes that produce a permanent, precipitable chromogenic signal visible under standard bright-field microscopy [36]. The primary advantage of CISH is the ability to simultaneously view the hybridization signal and tissue morphology without requiring specialized fluorescence microscopy equipment, making it particularly useful for diagnostic applications in molecular pathology [36]. Both FISH and CISH maintain the architectural context of the sample, allowing researchers to correlate nucleic acid presence with specific cell types, subcellular localization, and tissue structures.
Hybridization Capture for Targeted Sequencing
Hybridization-based target enrichment has become an essential tool for next-generation sequencing applications where focusing on specific genomic regions of interest provides cost and efficiency benefits [40] [41]. This approach involves using biotinylated oligonucleotide probes that hybridize to targeted genomic regions in solution, followed by capture with streptavidin-coated magnetic beads and purification before sequencing [40]. The method provides depth and uniformity of coverage required for genetic variant discovery studies while maximizing on-target reads and saving sequencing effort by focusing on specific regions [40].
Compared to amplicon-based enrichment, hybridization capture offers several advantages, including more uniform coverage across targeted regions and the ability to cover larger genomic areas more efficiently [41]. This technique is particularly valuable for applications requiring detection of single nucleotide polymorphisms, insertions/deletions, copy number variations, and structural variants [40]. The approach has proven especially useful for challenging targets such as diverse and hypervariable viral taxa, where careful probe design is necessary to accommodate extensive sequence variation while maintaining specificity [42].
RNAscope Technology: Principles and Workflow
The RNAscope assay represents a significant advancement in RNA in situ hybridization technology, providing single-molecule sensitivity while maintaining minimal background signal [4]. This proprietary technology utilizes a novel probe design strategy and signal amplification system to visualize individual RNA molecules as punctate dots under a standard bright-field or fluorescent microscope [4]. The method can be performed manually or on automated staining systems and typically be completed within a single day [4]. The exceptional sensitivity and specificity of RNAscope make it particularly valuable for detecting low-abundance transcripts in heterogeneous tissue samples, where both the presence and spatial distribution of RNA provide critical biological insights.
A key innovation in the RNAscope system is its use of a unique probe design consisting of approximately 20 ZZ probe pairs that hybridize to the target RNA [21]. Each Z probe contains an 18–25 base pair region that hybridizes to the target RNA and a 14 base pair tail sequence that serves as a binding site for preamplifier molecules in the signal amplification system. This split-probe design significantly enhances specificity because the signal amplification process requires two independent Z probes to bind adjacent to each other on the target RNA, preventing amplification from non-specifically bound probes.
Critical Steps in the RNAscope Workflow
The RNAscope manual assay involves several critical steps that must be carefully executed to ensure optimal performance. The following workflow details the essential procedures and their key considerations:
Sample Preparation: Proper tissue collection, fixation, and sectioning are crucial first steps. Tissues are typically fixed in neutral-buffered formalin and embedded in paraffin (FFPE). Sections are cut at 4–5 μm thickness, mounted on charged slides, and dried thoroughly. Under-fixation can lead to RNA degradation, while over-fixation may reduce probe accessibility.
Pretreatment: This step includes deparaffinization, rehydration, and target retrieval to make the target RNA accessible to probes. Protease digestion is particularly critical to assay performance [21]. Under-digestion will result in lower signal and ubiquitous background, while over-digestion will result in poor morphology and loss of RNA [21]. The protease treatment must be carefully optimized for each tissue type and fixation condition.
Probe Hybridization: Target probes are applied to the samples and incubated at 40°C in a specialized hybridization oven for 2 hours. The HybEZ oven is the only hybridization oven that ACD has extensively tested and validated, and other incubators/hybridization stations may not provide consistent results [21]. Both temperature and humidity are critical to assay performance [21].
Signal Amplification: The RNAscope assay employs a multistep amplification process that uses preamplifier, amplifier, and enzyme-labeled probes to dramatically enhance the signal while maintaining specificity. It is crucial to apply all amplification steps in the right order; missing any step may result in no signal [21].
Detection and Counterstaining: For chromogenic detection, the enzyme label (typically alkaline phosphatase or horseradish peroxidase) reacts with a substrate to produce a precipitable colorimetric signal. The slides are then counterstained, dehydrated, cleared, and mounted for microscopy.
Visualization and Analysis: The hybridized RNA molecules appear as distinct dots that can be quantified by counting the number of signal dots in individual cells, either manually or by using image analysis tools such as HALO software or Aperio RNA ISH Algorithm [4].
Table 2: Critical Factors Affecting RNAscope Assay Performance
| Parameter | Optimal Condition | Effect of Deviation | Quality Control Indicator |
|---|---|---|---|
| Protease Digestion [21] | Tissue-dependent optimization | Under-digestion: lower signal, ubiquitous background; Over-digestion: poor morphology, RNA loss | Balanced signal-to-background with preserved tissue architecture |
| Hybridization Temperature [21] | 40°C in HybEZ oven | Non-specific binding or reduced hybridization efficiency | Specific punctate dots without diffuse background |
| Humidity Control [21] | Maintained throughout assay | Evaporation leading to increased background and non-specific signal | Consistent staining across entire tissue section |
| Reagent Freshness [21] | Always use fresh reagents | Reduced signal intensity and increased background | Strong specific signal with minimal background |
| Hydrophobic Barrier | Intact throughout process | Tissue drying leading to elevated non-specific signal | Uniform staining without edge effects |
RNAscope Multiplexing Capabilities
The RNAscope platform enables multiplex detection of up to four different RNA targets in a single sample through its channel-specific probe system [21]. The technology employs four independent probe channels (C1, C2, C3, and C4) that utilize orthogonal amplification systems to prevent cross-talk between targets. To set up a multiplex assay, each target probe must be in a different channel, and one of the target probes must be in the C1 channel [21]. Channel C1 target probes are Ready-To-Use (RTU), while channel C2, C3, and C4 probes are shipped as a 50X concentrated stock [21]. The 50X probes for C2, C3, or C4 must be mixed with a C1 Ready to Use Probe, and if no specific C1 probe is used, then a Blank Probe Diluent is used to dilute the probes [21].
This multiplexing capability enables researchers to study complex gene expression patterns, cellular interactions, and co-expression of multiple markers within the architectural context of intact tissues. The ability to visualize several RNA targets simultaneously provides valuable information about cellular heterogeneity and functional states that would be difficult to obtain through other methods.
Probe Design and Hybridization Optimization
Fundamental Principles of Probe Design
The design of hybridization probes is a critical factor determining the success and specificity of any hybridization-based assay. Effective probes must balance several competing requirements: sufficient length for specific binding, appropriate melting temperature for the hybridization conditions, minimal self-complementarity to prevent secondary structure formation, and specificity for the intended target sequence [39]. For conventional DNA probes, lengths typically range from 20 to 70 nucleotides, with longer probes generally offering higher sensitivity but potentially reduced specificity [39].
The sequence composition of probes significantly impacts their hybridization characteristics. The GC content should be optimized to achieve appropriate melting temperature, typically between 60–75°C for standard hybridization conditions. Probes should be screened for repetitive elements that might cause non-specific binding and avoided when possible. For applications requiring detection of variable targets, such as viral genomes, specialized design strategies incorporating degenerate bases or universal nucleotides may be employed [39]. Deoxyribose-Inosine (dInosine) has proven particularly valuable as a universal base that can pair with all four natural nucleotides, thereby creating mismatch tolerance while preserving specificity [39].
Hybridization Conditions and Stringency Control
The conditions under which hybridization is performed profoundly impact both the efficiency and specificity of probe-target binding. Key parameters that must be optimized include temperature, buffer composition, incubation time, and probe concentration. The stringency of hybridization—the ability to discriminate between perfectly matched and mismatched sequences—is primarily controlled by temperature and salt concentration, with higher temperatures and lower salt concentrations increasing stringency [37].
Tetramethylammonium chloride (TMAC) is a particularly useful hybridization buffer component that equalizes the melting temperatures of probes with different GC contents by selectively stabilizing A-T base pairs [39]. This property makes TMAC valuable when using multiple probes with varying sequences under standardized hybridization conditions. For membrane-based hybridizations, blocking reagents such as casein, bovine serum albumin, or denatured salmon sperm DNA are essential to reduce non-specific attachment of probes to the membrane surface [37].
Table 3: Hybridization Parameters and Their Optimization
| Parameter | Standard Conditions | Effect on Hybridization | Stringency Control |
|---|---|---|---|
| Temperature | Target-dependent (typically 37–65°C) | Higher temperatures increase specificity but may reduce signal | Primary stringency factor |
| Salt Concentration | Varies by method (e.g., SSC-based buffers) | Lower salt increases discrimination of mismatches | Secondary stringency factor |
| Time | 2–16 hours depending on application | Longer incubation increases completeness of hybridization | Affects signal intensity |
| Probe Concentration | Target-dependent optimization | Higher concentration increases hybridization rate | Must be optimized to balance signal and background |
| Buffer Additives | TMAC, formamide, dextran sulfate | TMAC normalizes Tm based on length rather than GC content [39] | Enhances specificity and signal |
Addressing Hybridization Challenges
Hybridization-based assays face several technical challenges that must be addressed through careful optimization. Spatial uniformity of hybridization remains a significant concern, particularly in large-format assays where variations in probe distribution can lead to intra-assay variability [43]. This non-uniformity can result from uneven dilution of probe solutions, evaporation at edges, or variable penetration into tissues or hydrogels [43]. Implementing consistent covering methods, using specialized equipment such as the HybEZ oven for RNAscope, and including appropriate controls can help mitigate these issues.
Another significant challenge arises when working with highly variable targets, such as viral genomes. For these applications, specialized design tools like ProbeTools implement k-mer clustering and incremental design strategies to create compact probe panels that provide broad coverage of diverse sequences [42]. These approaches first enumerate all possible probe-length sequences from reference datasets, then cluster similar sequences to reduce redundancy while maintaining coverage of genetic diversity [42]. The incremental design strategy focuses subsequent batches of probes on regions not adequately covered by the initial panel, significantly improving coverage of variable targets [42].
Essential Reagents and Research Tools
The successful implementation of hybridization protocols requires careful selection of reagents and specialized equipment. The following table outlines key components of the hybridization researcher's toolkit:
Table 4: Essential Research Reagents and Tools for Hybridization Experiments
| Reagent/Tool | Function | Application Notes |
|---|---|---|
| Hybridization Probes | Target-specific detection | DNA, RNA, or synthetic oligonucleotides with appropriate labels (fluorescent, chromogenic, biotin) |
| Hybridization Buffer | Maintains optimal hybridization conditions | Contains salts for ionic strength, buffering agents, and potentially formamide or TMAC for stringency control |
| Blocking Reagents [37] | Reduce non-specific binding | Proteins (BSA, casein) or heterologous DNA (salmon sperm) prevent probe attachment to surfaces |
| Stringency Wash Buffers | Remove imperfectly matched probes | Typically SSC-based with varying concentrations; lower salt increases stringency [37] |
| Signal Detection Reagents | Visualize hybridized probes | Enzyme substrates, fluorophore-conjugated antibodies, or streptavidin conjugates |
| HybEZ Oven System [21] | Temperature and humidity control | Critical for RNAscope assays; provides consistent heating and prevents evaporation |
| Protease Enzymes [21] | Tissue pretreatment | Must be carefully optimized for each tissue type and fixation condition |
| Mounting Media | Preserve and visualize samples | Aqueous for fluorescence; organic for chromogenic detection |
Hybridization of target-specific probes remains an indispensable methodology in molecular biology, providing critical insights into gene expression, genetic variation, and spatial organization of nucleic acids within cells and tissues. The continued refinement of techniques such as RNAscope, hybridization capture for NGS, and highly multiplexed FISH demonstrates the ongoing vitality and importance of this fundamental approach. As researchers continue to push the boundaries of what is detectable and quantifiable, proper attention to the principles of probe design, hybridization optimization, and careful protocol execution will remain essential for generating reliable, reproducible results. The integration of hybridization-based methods with emerging technologies promises to further expand our ability to explore complex biological systems with unprecedented resolution and context.
Diagram 1: Hybridization Method Workflows. The diagram illustrates two key hybridization approaches: (top) RNAscope probe binding and signal amplification system showing the sequential binding of Z probes, preamplifier, amplifier, and enzyme-labeled probes to produce a detectable signal; (bottom) Hybridization capture process for targeted next-generation sequencing showing fragmentation, probe hybridization, magnetic capture, and sequencing of enriched targets.
The RNAscope assay represents a significant advancement in in situ hybridization (ISH) technology, enabling highly sensitive and specific visualization of target RNA within the morphological context of intact cells and tissues. The core of this technology is a proprietary, multiplex signal amplification system that operates through sequential amplifier steps (Amp 1-6) to achieve single-molecule detection sensitivity while effectively suppressing background noise. This technical note details the application protocol and methodology for the signal amplification phase of the RNAscope manual assay, providing researchers and drug development professionals with a precise framework for executing and interpreting this critical procedure within the broader RNAscope workflow [44] [20].
Unlike traditional RNA ISH methods, which often suffer from high background and poor sensitivity, the RNAscope assay utilizes a unique double "Z" probe design. This design requires two independent "Z" probes to bind adjacent to each other on the target RNA before the pre-amplifier can attach, initiating the amplification cascade. This paired-probe system is the foundation for the technology's high specificity, as it drastically reduces non-specific binding and off-target signal [20]. The subsequent sequential hybridization of amplifiers builds upon this foundation, creating a powerful yet controlled signal amplification process that allows individual RNA molecules to be visualized as distinct, punctate dots under a standard bright-field or fluorescent microscope [44] [45].
Technical Principles of Sequential Amplification
The "Double Z" Probe Design and Mechanism
The initial and most critical determinant of the entire RNAscope assay's success is the specific binding of the double "Z" probes to the target RNA sequence. Each probe pair consists of two oligonucleotides engineered to hybridize to adjacent regions of the same target RNA molecule. Structurally, each "Z" probe comprises three distinct regions [20]:
- A lower region containing 18-25 base pairs that are complementary to the target RNA sequence.
- A spacer or linker sequence that connects the target-binding region to the tail.
- A tail sequence that serves as the binding site for the pre-amplifier molecule.
The fundamental innovation of this system is that the binding of a single pre-amplifier requires the formation of a probe dimer on the target RNA. This means that if only one "Z" probe binds to an off-target sequence, the pre-amplifier has no docking site, and the amplification cascade cannot initiate. This mechanism is responsible for the exceptional specificity of the assay, effectively eliminating background noise from non-specific probe binding [20].
The Signal Amplification Cascade
Once the "Z" probe dimer is formed and the pre-amplifier is bound, a multi-step, branched DNA (bDNA) amplification cascade begins. This process results in a significant amplification of the signal, transforming a single RNA molecule into a detectable dot.
- Binding of the Pre-Amplifier: The pre-amplifier molecule binds to the tail regions of the "Z" probe dimer. Each successfully bound "Z" dimer can accommodate one pre-amplifier [20].
- Hybridization of Amplifiers: Multiple amplifier molecules then bind to each pre-amplifier through complementary base pairing. The design allows each pre-amplifier to hybridize with multiple amplifier molecules [20].
- Conjugation of Label Probes: Finally, numerous enzyme-linked label probes (e.g., horseradish peroxidase or alkaline phosphatase) conjugate to their specific binding sites on each amplifier molecule. Research indicates that this sequential process can result in an amplification factor of up to 8,000x for each target RNA molecule, as hundreds of label probes can be concentrated at the site of a single transcript [20].
This entire process is highly dependent on the correct sequential application of reagents (Amp 1 through Amp 6) with appropriate wash steps in between to remove unbound molecules and prevent non-specific hybridization.
Experimental Protocol: Amplification and Wash Steps
Materials and Reagent Setup
The following essential materials and research reagent solutions are required for the amplification phase of the manual RNAscope assay [16] [46] [45]:
Table 1: Essential Research Reagent Solutions for Amplification
| Item Name | Function/Description | Critical Notes |
|---|---|---|
| RNAscope 2.5 HD Reagent Kit | Contains the core reagents (Amp 1-6, wash buffer) for the assay. | Kit is specific for chromogenic (BROWN/RED) or fluorescent detection. |
| HybEZ Humidity Control Tray | Maintains optimum humidity during hybridization and amplification steps. | Prevents slides from drying out, which can cause high background. |
| HybEZ Oven | Maintains a constant temperature of 40°C for all hybridization steps. | Critical for consistent and efficient reagent binding. |
| Probe Diluent | Ready-to-use solution for diluting target-specific RNAscope probes. | --- |
| Wash Buffer | Saline solution used to remove unbound reagents between steps. | Must be pre-warmed to 40°C for wash steps following hybridization. |
| Hydrophobic Barrier Pen (e.g., ImmEdge Pen) | Creates a barrier around the tissue section to contain reagents. | Essential for maintaining a small, consistent reagent volume over the tissue. |
Before commencing the protocol, ensure the HybEZ Oven is pre-heated to 40°C and the Humidity Control Tray is prepared with an adequate amount of water to maintain humidity. The Wash Buffer should be pre-warmed to 40°C for use in later steps [45].
Step-by-Step Methodology
The protocol below follows the successful hybridization of target-specific probes to the RNA [16] [46].
Post-Hybridization Wash: Following the final probe hybridization step, gently remove the coverslip and wash the slides by immersing them in fresh 1X Wash Buffer at room temperature. Repeat this wash two more times, for a total of three washes, with each wash lasting approximately 2 minutes. This thoroughly removes any unbound probes [46].
Amp 1 Hybridization:
- Blot excess wash buffer from around the tissue section without letting the tissue dry completely.
- Apply a few drops of Amp 1 reagent to completely cover the tissue section.
- Carefully place a coverslip over the tissue to ensure even distribution of the reagent.
- Place the slide in the humidified HybEZ Tray and incubate for 30 minutes at 40°C in the HybEZ Oven [16] [46].
Post-Amp 1 Wash:
- Gently remove the coverslip and wash the slides by immersing them in pre-warmed 1X Wash Buffer (40°C). Agitate gently.
- Perform a total of three washes, each for 2 minutes, using fresh wash buffer each time [46].
Amp 2 Hybridization:
Post-Amp 2 Wash:
- Remove the coverslip and wash the slides three times for 2 minutes each in pre-warmed 1X Wash Buffer (40°C) [46].
Amp 3 Hybridization:
Post-Amp 3 Wash:
- Remove the coverslip and perform three washes of 2 minutes each in pre-warmed 1X Wash Buffer (40°C) [46].
Amp 4 - 6 Br Hybridization (Fluorescent Assay): For the fluorescent multiplex assay, the process continues with Amp 4, Amp 5, and Amp 6 Br, each followed by the standard wash procedure of three 2-minute washes in pre-warmed wash buffer [46].
Signal Detection: Following the final amplifier step and wash, the assay proceeds to the detection phase. For chromogenic assays (BROWN or RED), this involves an enzyme-substrate reaction using DAB or Fast Red respectively. For fluorescent assays, this involves the application of fluorophore-labeled tyramide (e.g., Opal dyes) for signal development [47].
Data Analysis and Interpretation
Quantitative and Semi-Quantitative Scoring
Analysis of RNAscope results focuses on the quantification of punctate dots, where each dot represents a single RNA molecule. Scoring can be performed manually or using specialized image analysis software such as Halo, QuPath, or Aperio [20] [45].
For manual scoring, the manufacturer recommends a semi-quantitative scoring system based on the average number of dots per cell. It is critical to score multiple representative regions of the tissue section to obtain a comprehensive and accurate assessment [45].
Table 2: RNAscope Semi-Quantitative Scoring Guidelines [45]
| Score | Criteria | Interpretation |
|---|---|---|
| 0 | No staining or <1 dot per 10 cells | Negative or negligible expression |
| 1 | 1-3 dots per cell (visible at 20-40X magnification) | Low expression level |
| 2 | 4-9 dots per cell; very few dot clusters | Moderate expression level |
| 3 | 10-15 dots per cell; <10% of dots are in clusters | High expression level |
| 4 | >15 dots per cell; >10% of dots are in clusters | Very high expression level |
Troubleshooting Common Issues
Successful implementation of the amplification steps is crucial for optimal signal-to-noise ratio. The following table addresses common issues and their solutions.
Table 3: Troubleshooting Amplification and Wash Steps
| Observation | Potential Cause | Recommended Solution |
|---|---|---|
| Weak or No Signal | Incomplete amplification series (missing an Amp step) | Strictly follow the protocol order for Amp 1-6. Do not skip or alter steps [45]. |
| Slides dried out during incubation | Ensure the Humidity Control Tray is properly sealed and contains sufficient water [45]. | |
| High Background | Inadequate washing between steps | Perform all three 2-minute washes with fresh, pre-warmed buffer as specified [46]. |
| Non-specific probe binding | Ensure the negative control (dapB) is run and shows a score of 0. Optimize protease treatment time if needed [20] [45]. | |
| Clustered Dots | Over-expression of the target gene | This is an expected biological result for highly expressed genes. Refer to Score 4 criteria [45]. |
| Over-amplification | Ensure incubation times and temperatures are strictly adhered to; do not exceed recommended durations [45]. |
The sequential amplifier steps (Amp 1-6) and their associated washes constitute the core signal generation engine of the RNAscope assay. The meticulous execution of this protocol, with strict attention to incubation times, temperatures, and wash stringency, is non-negotiable for achieving the technology's hallmark high sensitivity and specificity. When performed correctly, this phase of the workflow enables the precise visualization and quantification of RNA expression at the single-cell level, providing invaluable spatial context for gene expression data. This makes RNAscope an indispensable tool for researchers and drug development professionals advancing our understanding of disease mechanisms and biomarker discovery.
Chromogenic development is a fundamental process in the RNAscope manual assay workflow that enables the visualization of target RNA molecules within the context of intact tissue and cellular architecture. This detection method relies on enzymatic reactions that produce insoluble, colored precipitates at the sites of specific RNA hybridization, allowing for analysis using standard bright-field microscopy [48]. The precision of this technique is critical for researchers and drug development professionals who require accurate spatial gene expression data to advance their investigations into disease mechanisms and therapeutic targets.
The RNAscope technology achieves unparalleled sensitivity and specificity through its unique probe design and signal amplification system. This platform provides a reliable method for detecting individual RNA molecules as distinct punctate dots, which can be quantified manually or using automated image analysis tools [4] [23]. When integrated with chromogenic development and appropriate counterstaining, this approach yields high-quality data that faithfully represents gene expression patterns while preserving excellent tissue morphology.
Principles of Chromogenic Chemistry
Enzyme-Substrate Systems
Chromogenic detection in RNAscope assays primarily utilizes enzyme-substrate systems that generate colored precipitates at the site of target recognition. The two most common enzymatic systems employed are Horseradish Peroxidase (HRP) and Alkaline Phosphatase (AP), each with distinct chromogen options optimized for different experimental requirements [48].
Horseradish Peroxidase (HRP) catalyzes the oxidation of chromogenic substrates in the presence of hydrogen peroxide. The reaction mechanism involves HRP utilizing H₂O₂ as an oxidant to convert the soluble chromogen into an insoluble colored precipitate that deposits at the target site [48]. For RNAscope assays, this typically occurs after the hybridization and amplification steps, where HRP is conjugated to the detection system.
Alkaline Phosphatase (AP) functions through a different mechanism, catalyzing the hydrolysis of phosphate groups from chromogenic substrates to produce an insoluble colored product. AP-based detection is particularly valuable in multiplexing applications where multiple targets need to be visualized simultaneously, as it offers chromogen options distinct from HRP-based detection [48].
Chromogen Characteristics and Selection
The selection of appropriate chromogens is crucial for achieving optimal results in RNAscope experiments. Different chromogens offer varying properties in terms of color, stability, and compatibility with specific tissue types.
Table 1: Common Chromogens for RNAscope Detection
| Enzyme | Chromogen | Color | Stability | Best Applications |
|---|---|---|---|---|
| HRP | DAB (3,3'-Diaminobenzidine) | Brown | Highly stable, alcohol-insoluble | General use, permanent preparations [48] |
| HRP | DISCOVERY Purple | Purple | Stable in ethanol and xylene | Multiplexing, translucent for co-localization [48] |
| HRP | DISCOVERY Red | Red | High contrast, prone to fading in alcohol | Pigmented tissues [48] |
| HRP | DISCOVERY Yellow | Yellow | Stable in ethanol and xylene | Multiplexing, translucent for co-localization [48] |
| AP | ChromoMap Red | Red | Alcohol-sensitive | High contrast to hematoxylin [48] |
| AP | ChromoMap Blue | Blue | Alcohol-sensitive | Low background tissues [48] |
Traditional chromogens like DAB produce a dark, opaque signal that provides excellent contrast with hematoxylin counterstains and is highly stable for long-term storage [48]. However, newer chromogen technologies based on fluorophores, such as the DISCOVERY series from Roche, offer narrow-range light absorption that improves compatibility for multiplexing applications [48]. These advanced chromogens are permanently bound through tyramide chemistry, providing enhanced stability in organic solvents compared to traditional alternatives.
Chromogenic Development Protocol for RNAscope Assays
Materials and Reagents
The following materials and reagents are essential for successful chromogenic development in RNAscope assays:
- RNAscope Probe(s): Target-specific probes, positive control (e.g., PPIB), and negative control (e.g., dapB) [23]
- Chromogenic Detection Kit: HRP- or AP-based detection system compatible with RNAscope
- Chromogen Solution: DAB substrate or alternative chromogen selected based on experimental needs [48]
- Hydrogen Peroxide: For blocking endogenous peroxidase activity (if using HRP-based detection) [23] [5]
- Protease Reagents: Protease Plus, Protease III, or Protease IV for tissue pretreatment [23] [5]
- Target Retrieval Reagents: Citrate or EDTA-based buffers for heat-induced epitope retrieval [23]
- Hematoxylin: For nuclear counterstaining (e.g., Gill's Hematoxylin) [49]
- Ethanol Gradients: 50%, 70%, 95%, and 100% ethanol for dehydration [49] [5]
- Xylene: For clearing steps prior to mounting [49]
- Mounting Medium: Aqueous media for red chromogens or organic mounting media for DAB [49]
- Hydrophobic Barrier Pen: For creating boundaries around tissue sections [49] [5]
Step-by-Step Protocol
Tissue Preparation and Pretreatment
Section Cutting and Mounting: Cut formalin-fixed paraffin-embedded (FFPE) tissue sections at 4-10μm thickness using a microtome and mount on charged slides. For frozen tissues, section at 7-16μm using a cryotome [50] [5].
Deparaffinization and Rehydration (FFPE tissues only):
- Immerse slides in xylene, three washes for 5 minutes each
- Transfer through ethanol series: 100% ethanol (two washes, 10 minutes each), 95% ethanol (two washes, 10 minutes each), 70% ethanol (two washes, 10 minutes each), 50% ethanol (two washes, 10 minutes each)
- Rinse in deionized water, two washes for 5 minutes each [49]
Tissue Pretreatment:
- Target Retrieval: Incubate slides in target retrieval buffer (e.g., 10mM Sodium Citrate, pH 6.0) at sub-boiling temperature for 10 minutes using a microwave or water bath. Cool for 30 minutes at room temperature [49] [23].
- Hydrogen Peroxide Treatment: Apply RNAscope Hydrogen Peroxide reagent and incubate for 10 minutes at room temperature to quench endogenous peroxidase activity [23] [5].
- Protease Treatment: Apply appropriate protease (Protease Plus for most applications) and incubate for 10-30 minutes at room temperature [23] [5].
Probe Hybridization and Amplification
Probe Hybridization:
- Prepare probe solution according to manufacturer's instructions.
- Apply probe to tissue sections and incubate in a humidified chamber at 40°C for 2 hours using the HybEZ Hybridization System [5].
Signal Amplification:
- Perform sequential amplifications using AMP1, AMP2, and AMP3 reagents:
- Apply AMP1 and incubate for 30 minutes at 40°C
- Wash in 1x wash buffer for 2 minutes, twice
- Apply AMP2 and incubate for 30 minutes at 40°C
- Wash in 1x wash buffer for 2 minutes, twice
- Apply AMP3 and incubate for 15 minutes at 40°C
- Wash in 1x wash buffer for 2 minutes, twice [5]
- Perform sequential amplifications using AMP1, AMP2, and AMP3 reagents:
Chromogenic Development
Enzyme Application:
- Apply enzyme conjugate (HRP-C1, HRP-C2, or HRP-C3 for multiplex detection) and incubate for 15 minutes at 40°C [5].
Chromogen Reaction:
- Prepare chromogen working solution according to manufacturer's instructions.
- Apply chromogen to tissue sections and monitor development closely under a microscope.
- Development time may vary from a few seconds to 10 minutes depending on target abundance [49].
- When optimal signal intensity is achieved, immediately immerse slides in deionized water to stop the reaction [49].
Counterstaining:
Dehydration and Mounting:
Workflow Visualization
Counterstaining Principles and Techniques
Purpose of Counterstaining
Counterstaining serves multiple essential functions in chromogenically developed RNAscope samples. Primarily, it provides contrast to the specific chromogenic signal by staining cellular structures, particularly nuclei, enabling better visualization of tissue architecture and cellular context [49]. This architectural context is crucial for accurate interpretation of RNA expression patterns within specific cell types or tissue regions. Additionally, counterstaining aids in focusing during microscopic analysis and provides orientation within the tissue section.
Hematoxylin Counterstaining Protocol
Hematoxylin is the most widely used nuclear counterstain in chromogenic RNAscope applications. The following protocol ensures optimal results:
- Following Chromogen Development: After completing the chromogenic reaction and rinsing in deionized water, apply hematoxylin to cover the entire tissue section.
- Incubation Time: Incubate for 30 seconds to 5 minutes, depending on the hematoxylin formulation and desired intensity [49] [5].
- Rinsing: Rinse thoroughly in deionized water to remove excess stain.
- Differentiation (Optional): For some hematoxylin formulations, a brief dip in acid alcohol may be necessary to optimize nuclear detail.
- Bluing: Immerse sections in a bluing reagent (e.g., alkaline water or ammonia water) to convert the hematoxylin color from red to blue, enhancing contrast.
- Final Rinse: Rinse in deionized water before proceeding to dehydration.
Table 2: Counterstaining Options for Chromogenic RNAscope
| Counterstain | Staining Pattern | Compatibility | Application Notes |
|---|---|---|---|
| Hematoxylin | Nuclear | All chromogens, especially DAB | Provides blue nuclear contrast; avoid over-staining [49] |
| Nuclear Fast Red | Nuclear | DAB, Purple, Blue | Red nuclear stain; less intense than hematoxylin [48] |
| Methyl Green | Nuclear | Red, Purple chromogens | Green nuclear stain; useful for alternative color schemes |
| DAPI | Nuclear | Fluorescent detection | For fluorescent RNAscope; requires fluorescence microscopy [5] |
Troubleshooting and Optimization
Common Issues and Solutions
Successful chromogenic development and counterstaining requires careful attention to potential challenges that may arise during the process:
- Weak or Absent Signal: This may result from insufficient protease treatment, under-fixed tissue, or inadequate amplification. Increase protease incubation time incrementally (by 2-5 minutes) while monitoring tissue morphology. Ensure proper fixation (15 minutes to 2 hours in 4% PFA for frozen tissues) [5].
- High Background: Often caused by over-fixed tissue, excessive protease treatment, or inadequate blocking. Reduce protease incubation time, ensure proper hydrogen peroxide treatment to block endogenous peroxidases, and verify wash buffer freshness [23].
- Precipitate Formation: May occur with aged chromogen solutions or contaminated buffers. Filter chromogen solution before use and prepare fresh solutions according to manufacturer recommendations [49].
- Over- or Under-Counterstaining: Adjust hematoxylin incubation time based on the specific formulation used. Over-staining can mask weak signals, while under-staining provides insufficient architectural context [49].
Quantitative Analysis Considerations
For researchers requiring quantitative data from chromogenically developed RNAscope results, several factors must be considered:
- Signal Quantification: RNAscope signals appear as punctate dots, with each dot representing an individual RNA molecule. Score the number of dots per cell rather than signal intensity for accurate quantification [23].
- Control Probes: Always include positive control probes (e.g., PPIB, POLR2A) and negative control probes (dapB) to validate assay performance. Successful staining should demonstrate a PPIB/POLR2A score ≥2 and a dapB score <1 [23].
- Image Analysis: Utilize image analysis software such as HALO, QuPath, or ImageJ for automated dot counting and cell segmentation to ensure objective, reproducible results [4] [23].
Research Reagent Solutions
Table 3: Essential Research Reagents for Chromogenic RNAscope
| Reagent Category | Specific Examples | Function | Application Notes |
|---|---|---|---|
| Probe Technology | RNAscope Target Probes | Hybridize to target RNA sequences | Design includes 20-40 ZZ probe pairs for single-molecule sensitivity [23] |
| Detection Systems | HRP-based detection | Enzyme conjugation for signal generation | Compatible with multiple chromogens including DAB, Purple, Yellow [48] |
| Chromogen Solutions | DAB, DISCOVERY Purple | Enzyme substrate producing colored precipitate | DAB provides permanent staining; newer chromogens enable multiplexing [48] |
| Protease Reagents | Protease Plus, Protease III | Tissue permeabilization and target unmasking | Critical for probe accessibility; requires optimization [23] |
| Counterstains | Hematoxylin, Nuclear Fast Red | Provides cellular context | Hematoxylin most common; intensity must be balanced with chromogen [49] |
| Mounting Media | Organic mounting media | Preserves staining and enables microscopy | Use non-aqueous media for DAB; aqueous for red chromogens [49] |
Within the comprehensive RNAscope manual assay workflow, the final steps of mounting, coverslipping, and slide storage are critical for preserving the experimental results. Proper execution ensures that the meticulously generated signal, visualized as punctate dots representing individual RNA molecules, remains robust for quantitative analysis [5] [51]. This application note details standardized protocols for these concluding procedures, enabling researchers to reliably conserve data integrity for microscopy and spatial analysis.
Experimental Protocols
Detailed Methodology: Counterstaining, Mounting, and Coverslipping
The following peer-reviewed protocol is adapted for fresh-frozen tissue sections following RNAscope Multiplex Fluorescent v2 assay completion [5] [52].
Materials:
- DAPI Stain: Ready-to-use solution for nuclear counterstaining.
- ProLong Gold Antifade Reagent: (e.g., Life Technologies, P36930) [5].
- Microscope Cover Glass: 24x60 mm, No. 1.5 thickness (e.g., Fisherbrand) [5].
- Fluoro-Gel II with DAPI: Alternative mounting medium with integrated counterstain [52].
Procedure:
- Counterstaining:
- Apply DAPI to the tissue section on the slide and incubate at room temperature. The incubation duration can range from 30 seconds to 5 minutes, and should be optimized based on the desired nuclear signal intensity [5].
- Decant the DAPI solution from the slide.
Mounting:
- Immediately after decanting DAPI, apply a sufficient volume of ProLong Gold Antifade Reagent to completely cover the tissue section [5].
- Avoid introducing air bubbles during application.
Coverslipping:
- Gently lower a 24x60 mm No. 1.5 thickness coverslip onto the slide, ensuring even contact and avoiding bubble formation [5].
Curing:
Slide Storage Protocols
Post-processing storage conditions are determined by the detection method and mounting medium used. Adherence to these protocols is essential to prevent signal degradation.
Table 1: Quantitative Slide Storage Specifications
| Storage Condition | Detection Method | Recommended Maximum Duration | Key Consideration |
|---|---|---|---|
| Dark, 4°C [5] | Fluorescent, with ProLong Gold | Long-term (>2 weeks) | Preserves fluorophore intensity; scan when fully dry [5]. |
| -20°C [5] | Unstained, dehydrated | Up to 1 week | For slides in 100% EtOH after fixation/dehydration; not recommended for long-term [5]. |
| Room Temperature [5] | Stained, intermediate step | Overnight | For slides stored in 5x SSC buffer during assay; not recommended [5]. |
The Scientist's Toolkit
Table 2: Essential Research Reagent Solutions
| Item | Function in Protocol | Specification |
|---|---|---|
| ProLong Gold Antifade [5] | Preserves fluorescence and reduces photobleaching under the coverslip. | Critical for long-term integrity of fluorescent signals. |
| DAPI [5] [52] | Nuclear counterstain for identifying cellular architecture. | Incubation time is variable (30s-5min). |
| No. 1.5 Coverslips [5] | High-resolution imaging compatibility. | 0.17 mm thickness for optimal microscopy. |
| Hydrophobic Barrier Pen [5] [52] | Creates a liquid barrier around sections, ensuring reagents fully cover the tissue and preventing drying. | Applied after tissue dehydration, before hybridization. |
| HybEZ Oven [5] [52] | Provides precise temperature (40°C) and humidity control for hybridization and amplification steps. | Essential for assay robustness and reproducibility. |
Workflow and Decision Pathway
The final wet-lab procedures and subsequent handling of slides can be visualized in the following workflow, which integrates the key protocols and storage decisions.
Troubleshooting and Quality Control
Successful implementation of the final steps involves mitigating common risks to data quality.
- Signal Fading: Fluorophore signals, particularly for some RNAscope probes, can begin to fade a few weeks after processing [5]. For critical experiments, acquire images as soon as possible after the slides have cured. Using a proven commercial antifade mountant like ProLong Gold is highly recommended to maximize signal longevity [5].
- Inadequate Mounting: Applying insufficient mounting medium can lead to dried-out sections and increased autofluorescence. Ensure the medium covers the entire section under the coverslip without excess. Letting the slides dry fully in the dark before imaging is crucial for image stability [5].
- Storage Conditions: Storing slides in a light-proof container at 4°C is the standard for long-term preservation of fluorescent signal. The protocol strongly advises against long-term storage of unstained slides in ethanol, recommending a maximum of one week at -20°C if absolutely necessary [5].
RNAscope Troubleshooting Guide: Solving Common Problems and Optimizing Assay Performance
Systematic Approach to Qualifying Samples and Pretreatment Optimization
Within the RNAscope manual assay workflow, proper sample qualification and pretreatment optimization are foundational steps that directly determine the success or failure of an experiment. This application note provides a systematic framework for researchers to evaluate sample quality and optimize pretreatment conditions, thereby ensuring the high sensitivity and specificity that the RNAscope in situ hybridization technology is renowned for. The proprietary "double Z" probe design enables highly specific detection of target RNA with single-molecule sensitivity, but this performance is contingent upon proper sample handling and preparation [53]. This guide details standardized methodologies to qualify samples and establish optimal pretreatment parameters, providing a critical resource for obtaining publication-quality data in drug development and research settings.
Sample Qualification: Assessing RNA Integrity and Assay Performance
Before attempting target-specific detection, systematically qualifying samples through control probes is essential to confirm RNA integrity and validate assay conditions. This initial phase determines whether a sample possesses sufficient quality to yield meaningful results.
Control Probes for Sample Qualification
Always incorporate control probes during assay development to distinguish between true negative results and those caused by compromised sample quality. The table below outlines the recommended control probes and their interpretation criteria:
Table 1: Control Probes for RNAscope Sample Qualification
| Control Type | Target | Purpose | Interpretation of Successful Staining |
|---|---|---|---|
| Positive Control | Housekeeping genes (e.g., PPIB, UBC, POLR2A) [22] [54] | Assess RNA integrity and assay technique; confirms target mRNA is accessible. | PPIB/POLR2A score ≥2; UBC score ≥3 [22]. |
| Negative Control | Bacterial dapB gene [22] | Evaluate non-specific background staining and assay specificity. | Score of <1 indicates minimal background [22]. |
| Control Slides | Fixed cell pellets (e.g., Human HeLa, Mouse 3T3) [22] | Verify proper execution of the entire assay procedure independently of the sample. | Staining meets expected patterns for the control slide. |
Quantitative Assessment of Control Probes
A systematic approach to control probes, as demonstrated in a study adapting RNAscope for frozen mouse brain sections, involves using multiple housekeeping genes with varying expression levels to thoroughly assess sample quality and optimize conditions [54]. Researchers used UBC (high expression), PPIB (medium expression), and Polr2A (low expression) to fine-tune pretreatment protocols [54]. This multi-level verification provides a robust assessment of mRNA preservation across different abundance levels.
The semi-quantitative scoring system for RNAscope staining evaluates the number of dots per cell, which correlates directly with RNA copy numbers, rather than signal intensity [22] [55]. Successful staining is confirmed when positive controls meet their threshold scores and the negative control shows minimal signal.
Diagram 1: Sample Qualification Workflow
Pretreatment Optimization for Diverse Sample Types
Pretreatment is a critical step that balances RNA accessibility with tissue morphology preservation. The standard protocol requires optimization when working with suboptimal samples or specific tissue types.
Standard Pretreatment Protocol
For FFPE tissues prepared according to ACD recommendations (fixed in 10% NBF for 16-32 hours at room temperature), the standard RNAscope manual assay protocol typically yields excellent results [22]. The key steps include:
- Bake slides at 60°C for 30-60 minutes [22] [56].
- Deparaffinize and rehydrate slides using fresh xylene and ethanol series [22] [21].
- Target Retrieval using retrieval solution at 95-100°C for 3-15 minutes [57] [56].
- Protease Digestion with Protease III (or equivalent) at 40°C for 15-30 minutes [21] [56].
Deviations from recommended fixation protocols necessitate pretreatment optimization. Antigen retrieval conditions are particularly variable and depend on both tissue type and fixation parameters [22].
Optimization Strategies for Suboptimal Samples
When sample preparation history is unknown or suboptimal, a systematic approach to optimization is required. The following table compares standard and mild pretreatment conditions validated in automated RNAscope assays, which provide guidance for manual assay optimization:
Table 2: Pretreatment Condition Optimization Guide
| Condition | Target Retrieval | Protease Treatment | Recommended Applications |
|---|---|---|---|
| Standard | 95°C for 15 min [57] | Protease at 40°C for 15 min [57] | Most FFPE tissues (non-lymphoid) [57]. |
| Mild | 88°C for 15 min [57] | Protease at 40°C for 15 min [57] | Lymphoid tissues, retina, and delicate tissues [57]. |
| Protease-only | Omit or reduce | Vary concentration (e.g., 1-15 min) [22] | Over-fixed tissues or when morphology is poor. |
| Extended Retrieval | Increase time (e.g., 5-10 min) [22] | Standard treatment | Under-fixed tissues or when signal is weak. |
Systematic Optimization Workflow
A methodical approach to pretreatment optimization minimizes experimental variability and efficiently identifies optimal conditions. The workflow below outlines a stepwise strategy:
Diagram 2: Pretreatment Optimization Workflow
For delicate tissues like lymphoid tissue or retina, begin with mild pretreatment conditions (lower temperature retrieval) [57]. Conversely, for tissues that were under-fixed or have weak signal, increasing retrieval time or temperature may enhance RNA accessibility. Protease digestion time is particularly critical—under-digestion results in lower signal and background, while over-digestion causes poor morphology and RNA loss [21].
The Scientist's Toolkit: Essential Research Reagent Solutions
Successful implementation of the RNAscope manual assay requires specific reagents and equipment designed to maintain assay robustness. The following table details essential materials and their functions:
Table 3: Essential Research Reagent Solutions for RNAscope Manual Assay
| Item | Function | Examples/Specifications |
|---|---|---|
| RNAscope Probe Sets | Target-specific detection | C1 (Ready-To-Use), C2/C3/C4 (50X concentrate) [21]. |
| Control Probes | Sample qualification | PPIB (positive), dapB (negative) [22]. |
| RNAscope Reagent Kit | Signal amplification | Contains AMP1, AMP2, AMP3, HRP blockers [56]. |
| Protease III | Controlled tissue permeabilization | Critical for RNA accessibility; overtreatment degrades morphology [21]. |
| Target Retrieval Reagents | Antigen retrieval | Unmasks target RNA; temperature-sensitive [57]. |
| HybEZ Oven | Temperature-controlled hybridization | Maintains precise 40°C for hybridization steps [21]. |
| Hydrophobic Barrier Pen | Creates liquid barrier on slides | Prevents evaporation and reagent mixing [56]. |
| SuperFrost Plus Slides | Tissue adhesion | Prevents tissue loss during stringent washes [22]. |
Proper storage and handling of reagents are critical. Always use fresh reagents, including alcohol and xylene, and do not alter the protocol sequence [21]. Applying amplification steps in the correct order is essential, as skipping any step may result in no signal.
A systematic approach to sample qualification and pretreatment optimization forms the foundation of success with the RNAscope manual assay. By rigorously implementing control probes, methodically optimizing pretreatment conditions based on tissue type, and utilizing validated reagents and equipment, researchers can reliably generate robust, reproducible data. This structured methodology ensures that the sophisticated RNAscope technology performs at its optimal capability, revealing precise spatial gene expression patterns within the tissue context and accelerating discoveries in drug development and biomedical research.
The RNAscope in situ hybridization assay is a powerful technique for visualizing RNA within intact cells, offering high sensitivity and single-molecule resolution. However, successful implementation relies on precise execution of the protocol. Researchers often encounter three primary challenges: absence of signal, high background, and poor tissue morphology. This application note details the root causes of these issues within the manual assay workflow and provides systematic troubleshooting protocols to resolve them, ensuring reliable and interpretable results for critical research and drug development applications.
The Scientist's Toolkit: Essential Research Reagents and Materials
The following table catalogues the essential materials and reagents critical for the successful execution of the RNAscope manual assay and for effective troubleshooting.
Table 1: Key Research Reagent Solutions for the RNAscope Assay
| Item | Function & Importance in Troubleshooting |
|---|---|
| Control Probes (PPIB, POLR2A, UBC, dapB) | Essential for diagnosing assay performance. Positive controls (e.g., PPIB) verify RNA integrity and assay function. The negative control (dapB) assesses background levels. [58] |
| HybEZ II Hybridization System | A critical benchtop oven validated to maintain consistent temperature and humidity during hybridization and amplification steps. Using non-validated equipment is a common source of failure [58] [21]. |
| Protease Plus | A broad-spectrum protease for sample permeabilization. Digestion time is a primary variable optimized to resolve no signal (under-digestion) or poor morphology (over-digestion) [58] [16] [21]. |
| Target Retrieval Reagent | A heat-induced epitope retrieval solution used to reverse cross-links from formalin fixation, making the target RNA accessible to probes [16]. |
| ImmEdge Hydrophobic Barrier Pen | Used to create a barrier around the sample, preventing reagent evaporation and ensuring the tissue section remains hydrated throughout the assay. A broken barrier can cause drying and high background [58]. |
| RNAscope 1X Wash Buffer | Used for all post-hybridization wash steps. Precipitates can form during storage; warming the buffer to 40°C before use is critical to avoid assay artifacts [58]. |
Troubleshooting Common RNAscope Assay Issues
A systematic approach to troubleshooting, guided by control probes, is essential. The following workflow provides a logical pathway for diagnosing and resolving the most common issues.
Issue 1: No Signal
A complete absence of expected punctate dots requires investigation of both assay-wide and target-specific factors.
Root Causes and Diagnostic Steps:
- Assay-Wide Failure: If both your target probe and the positive control probe (e.g., PPIB, UBC) show no signal, the issue lies in the core assay procedure [58].
- Target-Specific Failure: If positive controls show a strong signal but your target probe does not, the issue is specific to the target or its expression level [59].
Experimental Protocol for Resolution:
- Verify Reagents and Protocol Fidelity: Confirm all amplification steps were performed in the correct order, as omitting any step can result in no signal [58] [21]. Use fresh, warmed reagents and ensure wash buffer is free of precipitates by warming to 40°C [58].
- Assess RNA Integrity: Use the appropriate housekeeping gene control. For low-expression targets, the POLR2A positive control probe is recommended over UBC [58] [59].
- Optimize Sample Pretreatment: Insufficient pretreatment is a common cause of no signal.
- Target Retrieval: Ensure the target retrieval step is performed correctly using a steamer or hot plate to reverse formalin cross-links [16].
- Protease Digestion: Under-digestion with Protease Plus prevents probe access. Adhere to the standard protocol first (15 minutes at 40°C), and if signal is absent, increase the protease time in increments of 10 minutes while monitoring morphology [58].
Issue 2: High Background
High background is characterized by non-specific staining, diffuse signal, or a high dot count in the negative control (dapB) sample.
Root Causes and Diagnostic Steps:
- Insufficient Protease Digestion: Under-digested tissue results in a high, ubiquitous background as probes cannot efficiently penetrate to the target [21].
- Inadequate Blocking: Failure to adequately block endogenous peroxidase activity with H₂O₂ can cause a hazy background in chromogenic assays [16].
- Slide Drying: If the hydrophobic barrier fails or reagents evaporate, tissue drying will cause severe background [58] [21].
Experimental Protocol for Resolution:
- Titrate Protease Digestion: If the dapB negative control shows a score ≥1, gradually increase Protease Plus digestion time. For example, progress from 15 minutes to 25 or 35 minutes at 40°C, evaluating background and morphology at each increment [58].
- Validate Peroxidase Block: Ensure the H₂O₂ incubation step is performed for the full recommended time and with fresh reagent [16].
- Prevent Slide Drying: Check that the ImmEdge barrier is intact before applying any reagent. Throughout the protocol, ensure slides never dry out between steps [58].
Issue 3: Poor Morphology
Poor morphology, characterized by loss of cellular and nuclear detail, compromises the ability to localize signal and interpret results.
Root Causes and Diagnostic Steps:
- Excessive Protease Digestion: This is the most common cause of poor morphology. Over-digestion degrades the tissue structure [58] [21].
- Over-fixation: Tissues fixed in formalin for excessively long periods may require optimized pretreatment.
Experimental Protocol for Resolution:
- Reduce Protease Digestion Time: If morphology is poor, reduce the Protease Plus digestion time in 5-10 minute decrements. The goal is to find a balance where signal is retained but tissue architecture is preserved [58].
- Optimize for Over-fixed Tissues: For suspected over-fixed tissues, a milder target retrieval (e.g., 15 min at 88°C instead of 95°C) can be attempted alongside reduced protease time [58].
Quantitative Scoring and Analysis Guidelines
Accurate interpretation of RNAscope results relies on a semi-quantitative scoring system based on punctate dots per cell, not signal intensity.
Table 2: RNAscope Semi-Quantitative Scoring Guidelines [58]
| Score | Criteria (Dots per Cell) | Interpretation |
|---|---|---|
| 0 | <1 dot/10 cells | No staining or negligible expression |
| 0.5 | 1-3 dots/cell (in 5-30% of cells) | Very low expression |
| 1 | 1-3 dots/cell (widespread) | Low expression |
| 2 | 4-9 dots/cell, very few clusters | Moderate expression |
| 3 | 10-15 dots/cell, <10% in clusters | High expression |
| 4 | >15 dots/cell, >10% in clusters | Very high expression |
A successful assay is indicated by a positive control score (PPIB/POLR2A ≥2 or UBC ≥3) and a negative control (dapB) score of <1 [58]. For image analysis, acquisition at 40x magnification is recommended for optimal dot resolution [59] [60].
Success in the RNAscope manual assay is achieved by understanding the key variables in the workflow and systematically addressing deviations. By rigorously implementing the controls, optimizing the critical pretreatment steps of target retrieval and protease digestion, and adhering to the quantitative scoring guidelines, researchers can confidently overcome the challenges of no signal, high background, and poor morphology. This ensures the generation of robust, high-quality data that can reliably inform scientific conclusions and drug development efforts.
Protease digestion represents one of the most critical and delicate steps in the RNAscope manual assay workflow. This enzymatic process must be precisely balanced to ensure optimal target RNA accessibility while preserving tissue morphology and RNA integrity. Under-digestion results in insufficient probe penetration and diminished signal intensity, whereas over-digestion compromises cellular structure and can lead to RNA degradation. Within the context of a broader thesis on RNAscope manual assay optimization, this application note provides detailed protocols and evidence-based guidelines for achieving perfect protease digestion balance, specifically tailored for researchers, scientists, and drug development professionals working with diverse tissue specimens.
The fundamental challenge stems from the need to reverse formaldehyde-induced cross-links that mask target RNA sequences, without destroying the tissue architecture necessary for morphological context. Protease Plus, a broad-spectrum protease reagent, is integral to this process, serving to permeabilize samples adequately to allow probe access to target mRNA [16]. The following sections present a systematic approach to optimizing this crucial parameter, complete with quantitative assessment methods, troubleshooting guidelines, and tissue-specific recommendations to ensure reproducible, high-quality RNA in situ hybridization results.
The Role of Protease Digestion in RNAscope Assay
In the RNAscope workflow, protease digestion constitutes "Pretreatment 3" and is performed after deparaffinization and target retrieval steps [16]. Its primary function is the enzymatic permeabilization of fixed tissue samples to enable probe access to the target RNA. The proprietary double "ZZ" oligo probes designed to hybridize to specific RNA targets require adequate tissue penetration to form the hybridization complexes that ultimately generate the detectable signal [16] [11].
The molecular mechanism involves the controlled cleavage of peptide bonds within proteins that have been cross-linked through formalin fixation. This process exposes target RNA molecules that would otherwise remain inaccessible to hybridization probes. The exquisite sensitivity of the RNAscope platform—capable of detecting single RNA molecules with single-molecule resolution—makes precise protease optimization particularly crucial [11]. When properly executed, protease treatment enables the distinctive punctate dot pattern characteristic of successful RNAscope detection, with each dot representing an individual RNA molecule.
Quantitative Optimization Parameters
Critical Variables and Their Optimal Ranges
Successful protease digestion requires simultaneous optimization of multiple parameters. The table below summarizes the key variables and their recommended ranges based on empirical data from RNAscope assay development:
Table 1: Key Optimization Parameters for Protease Digestion
| Parameter | Recommended Range | Impact of Deviation |
|---|---|---|
| Temperature | 40°C ± 2°C [45] | Lower temperatures reduce enzyme activity, causing under-digestion; higher temperatures accelerate activity, risking over-digestion |
| Time | 15-30 minutes (tissue-dependent) [61] | Shorter durations limit probe access; longer durations degrade morphology |
| Concentration | Manufacturer's recommendation (Protease Plus) [16] | Must be determined empirically for different tissue types and fixation conditions |
| Tissue Type | Varies by cellular density and fixation [61] | Dense tissues (e.g., skin) often require longer digestion; delicate tissues (e.g., lymph node) need shorter treatment |
Tissue-Specific Optimization Guidelines
Different tissue types present unique challenges for protease digestion due to variations in cellular density, extracellular matrix composition, and fixation history. The following table provides tissue-specific recommendations based on data from preclinical studies using multiple tissue types from rat, dog, and cynomolgus monkey models:
Table 2: Tissue-Specific Protease Digestion Guidelines
| Tissue Type | Characteristics Affecting Digestion | Recommended Approach |
|---|---|---|
| Liver & Pancreas | High protein content, dense cytoplasm | Standard protocol typically effective [61] |
| Neural Tissues (Brain, Spinal Cord) | Delicate cell processes, prone to morphological damage | Milder conditions (lower end of time range) |
| GI Tract | Variable layers with different densities | May require optimization for specific regions |
| Skin | High keratin content, dense structure | Potentially extended digestion time |
| Lymphoid Tissues (Spleen, Lymph Node) | Delicate architecture, high nucleus:cytoplasm ratio | Careful monitoring to prevent over-digestion |
Experimental Protocols for Optimization
Systematic Titration Approach
For researchers implementing RNAscope with new tissue types or fixation conditions, the following systematic titration protocol is recommended:
- Prepare a test series of consecutive tissue sections (5μm thickness from FFPE blocks)
- Apply a range of protease digestion times (e.g., 10, 15, 20, 25, 30 minutes) at constant temperature (40°C)
- Hybridize with control probes including:
- Process through standard RNAscope detection following manufacturer's protocol
- Evaluate results using standardized scoring criteria
Assessment Criteria and Scoring
The optimized protease digestion condition should yield:
- Maximum signal intensity for positive control probes with minimal background
- Score ≥2 for PPIB (4-9 dots/cell, very few dot clusters) and score ≥3 for UBC (>10 dots/cell, <10% dots in clusters) in properly qualified samples [45]
- Score <1 for dapB negative control (no staining or <1 dot per 10 cells) [45]
- Excellent preservation of tissue morphology allowing clear cellular identification
The following workflow diagram illustrates the decision process for optimizing protease digestion conditions:
Troubleshooting Protease Digestion Issues
Problem Identification and Resolution
Even with standardized protocols, protease digestion issues may occur. The table below outlines common problems, their likely causes, and recommended solutions:
Table 3: Troubleshooting Guide for Protease Digestion Problems
| Problem | Possible Indicators | Likely Cause | Recommended Solution |
|---|---|---|---|
| Under-digestion | Low signal with positive controls; high background possible [21] | Insufficient enzymatic activity; inadequate tissue permeabilization | Increase digestion time incrementally (5-10 min steps); verify temperature maintenance at 40°C [45] |
| Over-digestion | Poor tissue morphology; tissue detachment; weak or absent signal [21] | Excessive enzymatic activity; destruction of cellular RNA | Reduce digestion time; ensure protease concentration is correct; verify tissue fixation quality |
| Inconsistent Results | Variable staining within or between samples | Inconsistent temperature; expired reagents; uneven protease application | Calibrate equipment; use fresh reagents; ensure even coverage with Protease Plus |
Quality Control Measures
Implementing rigorous quality control is essential for reproducible protease digestion:
- Always include control slides with positive and negative reference probes to assess sample RNA quality and optimal permeabilization [45]
- Monitor temperature precisely throughout digestion using calibrated equipment
- Use fresh reagents including proper storage of Protease Plus according to manufacturer specifications
- Document all parameters including lot numbers, exact times, and temperature variations for troubleshooting
Research Reagent Solutions
The following essential materials are required for implementing optimized protease digestion in RNAscope assays:
Table 4: Essential Research Reagents for Protease Digestion Optimization
| Reagent/Equipment | Function | Usage Notes |
|---|---|---|
| Protease Plus [16] | Broad-spectrum protease for tissue permeabilization | Critical for accessing target mRNA; requires precise timing |
| HybEZ Oven [45] [21] | Maintains optimum humidity and temperature (40°C) | Essential for consistent hybridization and digestion conditions |
| Control Probes (PPIB, POLR2A, UBC, dapB) [45] [61] | Assess sample RNA quality and optimal permeabilization | PPIB and UBC as positive controls; dapB as negative control |
| SuperFrost Plus Slides [45] | Provide superior tissue adhesion | Prevent tissue detachment during protease digestion |
| ImmEdge Hydrophobic Barrier Pen [45] | Creates defined reaction areas | Maintains reagent volume over tissue sections |
Achieving the critical balance in protease digestion is fundamental to success with the RNAscope platform. Neither a universal protocol nor a simplistic approach will yield optimal results across diverse tissue types and experimental conditions. Instead, researchers must adopt a systematic optimization strategy that acknowledges the tissue-specific nature of protease requirements while maintaining rigorous quality control measures.
The protocols and guidelines presented here provide a structured framework for determining ideal protease digestion parameters that maximize target RNA accessibility while preserving morphological integrity. By implementing these evidence-based recommendations—including systematic titration, comprehensive controls, and careful troubleshooting—researchers can overcome one of the most significant technical challenges in RNA in situ hybridization and unlock the full potential of the RNAscope platform for sophisticated spatial transcriptomics in both research and diagnostic applications.
Application Note: Mastering Critical RNAscope Workflow Parameters
The manual RNAscope in situ hybridization (ISH) assay represents a major advance over traditional RNA ISH for detecting target RNA within intact cells, but its success hinges on several critical workflow parameters often overlooked in routine immunohistochemistry (IHC) [28]. This application note addresses three foundational pillars of assay success—humidity control, slide hydration management, and reagent freshness—within the broader context of optimizing spatial transcriptomics research. For researchers and drug development professionals, meticulous attention to these factors ensures reliable single-cell and single-molecule resolution data, particularly when validating findings from next-generation sequencing (NGS) or investigating oligonucleotide therapy biodistribution [8] [62].
The Role of Humidity in Hybridization Efficiency
Maintaining optimum humidity throughout the RNAscope procedure is non-negotiable for successful probe hybridization and signal amplification. Inadequate humidity leads to evaporation of small reagent volumes applied to tissue sections, ultimately resulting in elevated background noise, non-specific staining, or complete assay failure [28] [21]. The HybEZ Hybridization System is specifically engineered to maintain optimum humidity and temperature during critical incubation steps and is extensively validated by ACD for this purpose [28] [21].
- Practical Implementation: The system includes a Humidity Control Tray that must contain wet paper to maintain adequate humidity levels throughout the hybridization process [28] [5]. Researchers should verify that the humidifying paper remains sufficiently wet before initiating the assay and before each incubation step when using the manual workflow.
- Protocol Integration: For the standard 2-hour hybridization at 40°C, the Humidity Control Tray must be pre-warmed with the oven with the wet paper in place before slides are added [5]. This ensures immediate stabilization of the humidity environment when sensitive probe mixtures are applied.
Preventing Slide Dry-Out: Techniques and Materials
Tissue section dehydration during the RNAscope workflow compromises RNA integrity and probe binding accessibility, making slide dry-out prevention a critical consideration. The transient nature of the liquid phase during reagent changes presents particular vulnerability windows.
- Hydrophobic Barrier Integrity: The ImmEdge Hydrophobic Barrier Pen (Vector Laboratories) is explicitly recommended by ACD as the only barrier pen that maintains its hydrophobic properties throughout the entire RNAscope procedure, including high-temperature incubation steps [28]. The barrier must be drawn completely around sections after the initial ethanol dehydration steps and allowed to dry completely before proceeding with the assay. Researchers should visually confirm barrier integrity remains intact after temperature cycling.
- Workflow Technique: When changing reagents, "flick or tap the slides to remove residual reagent, but do not let the slides dry out at any time" [28] [21]. This technique ensures continuous hydration while preventing carryover contamination between different reagent steps. Immediately applying the next reagent after removing the previous one is essential, with pauses between steps kept to an absolute minimum.
The Impact of Reagent Freshness on Signal-to-Noise Ratio
Reagent freshness directly impacts the signal-to-noise ratio in RNAscope assays, with compromised reagents contributing to increased background or diminished target signal. The assay's signal amplification and background suppression technology depends on optimal reagent activity [28].
Table: Critical Reagent Specifications for RNAscope Assays
| Reagent Category | Freshness Requirements | Consequences of Aged Reagents | Quality Control Tips |
|---|---|---|---|
| Ethanol and Xylene [28] [21] | Always use fresh reagents | Increased background staining; poor morphology | Use fresh absolute ethanol for dehydration series |
| 50x Wash Buffer [28] [5] | Pre-warm at 40°C before use; stable 4 weeks at RT after dilution | Probe precipitation; uneven staining | Ensure crystals are fully dissolved before use |
| Probe Mixtures [28] [5] | Pre-warm at 40°C before use; precipitation occurs during storage | Reduced signal intensity; failed assay | Warm probes and wash buffer at 40°C before use |
| Target Probes [28] | Stable at 4°C for 6 months when properly stored | Loss of signal amplification | Use positive control probes (PPIB) to verify performance |
Integrated Workflow Strategy
These three critical elements—humidity, hydration, and reagent freshness—function interdependently throughout the RNAscope workflow. The following diagram illustrates their relationship and critical control points in a standard protocol:
Comprehensive Protocol for Fresh-Frozen Tissue
Special Considerations for Fresh-Frozen Samples
While the core principles of RNAscope apply across sample types, fresh-frozen tissues present unique challenges for humidity control and reagent management due to the absence of paraffin embedding and different fixation requirements [5] [63]. This protocol section specifically addresses these considerations with procedural details validated for mouse brain tissue but applicable to other central nervous system areas [5].
Materials and Specialized Equipment
Table: Essential Research Reagent Solutions for RNAscope Fresh-Frozen Protocol
| Item Name | Specification/Catalog Number | Critical Function |
|---|---|---|
| SuperFrost Plus Slides [28] [5] | Fisher Scientific #1255015 | Prevents tissue detachment during assay |
| ImmEdge Hydrophobic Barrier Pen [28] [5] | Vector Laboratories #310018 | Maintains hydrophobic barrier to prevent dry-out |
| HybEZ Hybridization System [28] [5] | ACD Bio | Maintains optimum humidity and temperature |
| RNAscope Multiplex Fluorescent v2 Kit [5] [63] | ACD Bio #323100 | Contains amplification reagents for detection |
| Protease Plus [5] [63] | Included in Pretreatment Reagents | Tissue permeabilization for probe access |
| 50x Wash Buffer [28] [5] | ACD Bio #310091 | Removes unbound reagents; requires fresh preparation |
| Positive/Negative Control Probes [28] [22] | PPIB (positive) & dapB (negative) | Assess sample RNA quality and assay performance |
Step-by-Step Procedural Guide
Sample Preparation and Fixation
- Cryosectioning: Section fresh-frozen tissue at 16 μm thickness onto SuperFrost Plus slides [5]. Store slides at -80°C overnight before proceeding with fixation.
- Fixation: Immerse slides in freshly prepared 4% PFA in 1x PBS for 2 hours at room temperature (minimum 15 minutes) [5].
- Dehydration: Process slides through a graded ethanol series (50%, 70%, 100%, 100%) for 5 minutes each at room temperature [5]. Slides can be stored in 100% ethanol at -20°C for up to one week, though immediate processing is recommended.
Pre-Hybridization Setup
- Barrier Application: After ethanol dehydration, air-dry slides for approximately 1 minute at room temperature and draw a complete barrier around sections using the ImmEdge Hydrophobic Barrier Pen [5].
- System Preparation: Turn on the HybEZ oven at 40°C with the Humidity Control Tray inside. Place wet paper inside the tray to establish proper humidity before beginning hybridization steps [5].
Tissue Pretreatment and Hybridization
- Hydrogen Peroxide Incubation: Apply RNAscope Hydrogen Peroxide to tissue sections and incubate for 10 minutes at room temperature to quench endogenous peroxidase activity [5].
- Protease Treatment: Apply Protease Plus and incubate for 10 minutes at room temperature [5]. During this incubation, warm target probes and 50x wash buffer at 40°C to redissolve any precipitates that formed during storage [28] [5].
- Probe Hybridization: Prepare probe master mix and apply to entirely cover each section. Place slides in the pre-equilibrated Humidity Control Tray and incubate for 2 hours at 40°C in the HybEZ oven [5].
Signal Amplification and Detection
- Amplification Steps: Apply AMP 1, 2, and 3 in sequence with wash buffer rinses between each step, ensuring no amplification step is omitted [28] [21].
- Signal Development: For multiplex fluorescent detection, apply HRP-based channel blockers and Opal fluorophores according to manufacturer specifications [5].
- Counterstaining and Mounting: Apply DAPI for 30 seconds to 5 minutes at room temperature, then immediately cover slides with ProLong Gold Antifade Reagent and apply coverslips [5].
Quality Assessment and Troubleshooting
- Control Probes: Always run positive control probes (PPIB, POLR2A, or UBC) and negative control probes (dapB) on consecutive sections to assess sample RNA quality and optimal permeabilization [28] [22].
- Scoring Guidelines: Use semi-quantitative scoring based on dots per cell rather than signal intensity. Successful staining should yield a PPIB/POLR2A score ≥2 or UBC score ≥3 with dapB score <1 [28] [22].
The following workflow diagram integrates these critical parameters specifically for fresh-frozen tissue applications:
The RNAscope multiplex in situ hybridization (ISH) technology represents a significant advancement over traditional single-plex assays, enabling researchers to simultaneously detect and localize multiple RNA targets within intact cells and tissues. This capability is crucial for understanding complex biological processes, cellular heterogeneity, and spatial relationships in pathological and developmental contexts. The core principle of RNAscope multiplexing relies on a sophisticated signal amplification and background suppression system that visualizes individual RNA molecules as punctate dots, with each dot corresponding to a single transcript [45] [4].
Successful multiplex experimentation hinges on two critical technical aspects: proper probe mixing ratios and correct channel selection. These parameters ensure specific, unambiguous detection of each target without cross-reactivity or signal bleed-through. This application note provides detailed guidance on these essential components within the broader context of RNAscope manual assay workflow steps, enabling researchers to generate reliable, publication-quality data for drug development and basic research applications.
Key Principles of RNAscope Multiplex Assay Design
Channel Architecture and Probe Organization
The RNAscope multiplex system employs a structured channel approach where each target is assigned to a specific detection channel. Understanding this architecture is fundamental to proper experimental design:
- Channel Designations: The system utilizes four distinct channels labeled C1, C2, C3, and C4 [64] [21].
- Probe Format Differences: Channel C1 probes are provided as Ready-To-Use (RTU) solutions, while channels C2, C3, and C4 probes are shipped as 50X concentrated stocks that require dilution before use [45] [64].
- Channel Dependency: A critical requirement for any RNAscope multiplex assay is that one target probe must be in the C1 channel. This channel serves as a foundational element in the detection hierarchy [64] [21].
Table 1: RNAscope Multiplex Probe Channel Specifications
| Channel | Probe Format | Dilution Required | Presence Required in Assay |
|---|---|---|---|
| C1 | Ready-To-Use (RTU) | No | Yes |
| C2 | 50X concentrated | Yes (1:50) | No |
| C3 | 50X concentrated | Yes (1:50) | No |
| C4 | 50X concentrated | Yes (1:50) | No |
Probe Mixing Guidelines and Ratios
Proper probe preparation is essential for optimal assay performance. The following guidelines ensure correct probe mixtures:
- Mixing Ratio: For multiplex assays requiring C2, C3, or C4 probes, a consistent 1:50 dilution ratio must be used when combining the concentrated probe with either a specific C1 RTU probe or a Blank Probe Diluent [45] [64].
- Blank Probe Application: When no specific C1 target is needed in the assay, the C1 probe can be substituted with Blank Probe Diluent. This diluent serves as a placeholder to maintain the required channel architecture while allowing detection of targets in C2-C4 channels only [64] [21].
- Single-Plex Limitation: It is important to note that Channel C2 or C3 probes cannot be used with RNAscope 2.5 HD singleplex Brown or Red assays. These single-plex assays are specifically designed to work only with C1 probes [21].
Table 2: Recommended Probe Configurations for Different Assay Types
| Assay Type | Recommended Probe Channels | Blank Probe Usage | Compatible Detection Kits |
|---|---|---|---|
| Single-Plex | C1 only | Not applicable | RNAscope 2.5 HD Brown/Red |
| Duplex | C1 + C2 | Optional | Multiplex Fluorescent v2 |
| Triplex | C1 + C2 + C3 | Optional | Multiplex Fluorescent v2 |
| 4-Plex | C1 + C2 + C3 + C4 | Optional | HiPlex, Multiplex Fluorescent |
Experimental Protocol: Multiplex Probe Setup
Materials and Equipment
The following research reagent solutions are essential for performing RNAscope multiplex assays:
Table 3: Essential Research Reagent Solutions for RNAscope Multiplex Assays
| Item | Function/Application | Specific Recommendations |
|---|---|---|
| Target Probes | Specific detection of RNA targets | C1 (RTU), C2-C4 (50X concentrated) [64] |
| Control Probes | Assay quality control | Positive: PPIB, POLR2A, UBC; Negative: dapB [45] [22] |
| RNAscope Reagent Kit | Provides detection reagents | Kit selection depends on assay type (chromogenic/fluorescent) [64] |
| HybEZ Oven System | Maintains optimal hybridization conditions | Critical for temperature (40°C) and humidity control [45] [64] |
| SuperFrost Plus Slides | Tissue section adhesion | Required to prevent tissue detachment [45] [22] |
| ImmEdge Hydrophobic Barrier Pen | Creates reaction boundaries | Maintains hydrophobic barrier throughout procedure [45] [64] |
| Blank Probe Diluent | C1 channel placeholder | Used when no specific C1 target is included [64] [21] |
Step-by-Step Probe Preparation Protocol
Preliminary Assay Design:
- Determine the number of targets to be detected and select appropriate channels based on expression levels
- Assign higher expression targets to channels with potential autofluorescence concerns (e.g., 488/green) [64]
- Ensure at least one target is designated for the C1 channel or plan to use Blank Probe Diluent
Probe Mixture Preparation:
Control Slide Setup:
Hybridization and Detection:
Troubleshooting and Quality Control
Optimization Strategies
Successful multiplex detection requires careful validation and optimization:
- Control Probe Validation: Always run positive and negative control probes on your specific tissue samples. Successful staining should demonstrate a PPIB/POLR2A score ≥2 or UBC score ≥3 with a dapB score <1 before interpreting experimental target results [45] [22].
- Expression Level Considerations: When designing multiplex panels, consider the relative expression levels of your targets. Assign higher expression genes to channels with wavelengths that may have higher inherent autofluorescence in your specific tissue type [64].
- Signal Interpretation: RNAscope signals appear as punctate dots, with each dot representing a single RNA molecule. When scoring, focus on dot count per cell rather than signal intensity, as intensity reflects the number of probe pairs bound to each molecule rather than transcript abundance [45] [22].
Common Pitfalls and Solutions
- No Signal: Ensure all amplification steps are applied in the correct order and that slides never dry during the procedure [64] [21].
- High Background: Verify protease digestion time and temperature (typically 40°C). Under-digestion can result in ubiquitous background [21].
- Tissue Detachment: Use only SuperFrost Plus slides and ensure the hydrophobic barrier remains intact throughout the procedure [45] [64].
- Probe Precipitation: Always warm probes and wash buffer to 40°C before use, as precipitation during storage can affect assay results [45].
Proper probe mixing ratios and channel selection are fundamental to successful RNAscope multiplex assays. The requirement for a C1 channel probe (either specific or blank) with a 1:50 dilution ratio for C2-C4 probes provides a consistent framework for experimental design. By following the detailed protocols and troubleshooting guidance outlined in this application note, researchers can reliably implement RNAscope multiplex assays to advance their investigations into spatial gene expression, ultimately contributing to more comprehensive understanding of disease mechanisms and therapeutic development.
Validating RNAscope Results: Scoring, Analysis, and Correlation with Gold Standard Methods
The reliability of any RNA in situ hybridization (ISH) assay is fundamentally dependent on rigorous quality control practices. Within the RNAscope manual assay workflow, the implementation of control probes provides researchers and drug development professionals with an essential toolkit for verifying technical performance and sample quality [65]. These controls are integral to a broader thesis on RNAscope methodology, serving as the foundation for validating the entire experimental process from sample preparation to final interpretation. The strategic use of positive control probes targeting housekeeping genes (PPIB, POLR2A, UBC) and a negative control probe targeting the bacterial dapB gene enables systematic qualification of the assay itself, independent of the specific target under investigation [65] [28]. This approach addresses critical variables in the experimental workflow, including tissue fixation quality, RNA integrity, and protocol execution, thereby ensuring that subsequent data for target genes can be interpreted with confidence.
The unique double Z-probe design of the RNAscope technology provides single-molecule sensitivity and high specificity through a proprietary signal amplification and background suppression system [20]. However, even this robust technology requires careful validation for each sample type and experimental condition. The control probes function as internal standards that troubleshoot potential pitfalls in the multi-step manual assay, allowing researchers to distinguish true biological findings from technical artifacts [28]. By incorporating these controls into every experiment, scientists can establish a standardized framework for qualifying their RNAscope results across different projects, tissue types, and time points, enhancing both reproducibility and scientific rigor in preclinical research and drug development pipelines.
Control Probe Selection and Specifications
Rationale for Control Probe Selection
The selection of appropriate control probes is a critical decision point in designing a robust RNAscope experiment. Advanced Cell Diagnostics (ACD) recommends a tiered approach to control probe selection based on the expression level of the target gene of interest [65]. This strategic pairing ensures that the positive control provides a meaningful benchmark for assessing whether the assay conditions are sufficient to detect the target. Using a high-expression control probe like UBC for a low-expression target gene may provide false confidence in the assay's sensitivity, as substantial RNA degradation or suboptimal protocol execution could still yield detectable signal for UBC while compromising detection of the lower-abundance target [65].
For most applications, PPIB serves as the recommended positive control as it represents a medium-abundance transcript that provides a rigorous test of both sample quality and technical performance [65] [20]. The rationale for this recommendation is grounded in practical experience across diverse tissue types – if PPIB is detectable under the established assay conditions, then the majority of target genes with moderate expression levels should also be detectable [65]. This makes PPIB the most flexible option for initial assay qualification. For specialized applications involving very low-abundance targets or specific tissue types (such as tumors, retinal tissue, or lymphoid tissues), POLR2A provides an even more stringent control [65] [66].
Control Probe Specifications and Characteristics
Table 1: Control Probe Specifications for RNAscope Assay Qualification
| Control Probe | Target Gene | Expression Level (copies/cell) | Primary Application | Expected Score in Qualified Samples |
|---|---|---|---|---|
| PPIB | Peptidylprolyl isomerase B (Cyclophilin B) | Medium (10-30) [65] | Most flexible option for moderate expression targets [65] | Score ≥2 with relatively uniform signal [28] |
| POLR2A | DNA-directed RNA polymerase II subunit RPB1 | Low (3-15) [65] | Low expression targets; proliferating tissues, tumors [65] | Score ≥1 [28] |
| UBC | Ubiquitin C | High (>20) [65] | High expression targets [65] | Score ≥3 with relatively uniform signal [28] |
| dapB | Dihydrodipicolinate reductase (Bacillus subtilis) | N/A (bacterial gene) [65] | Universal negative control for all samples [65] | Score <1 (no staining or <1 dot/10 cells) [28] |
The negative control probe targeting dapB requires particular attention in its implementation. This probe targets a gene from the soil bacterium Bacillus subtilis strain SMY and should not generate any specific staining in properly prepared animal tissue samples [65] [20]. The presence of dapB signal indicates non-specific background staining, which may result from inadequate protease digestion, over-fixation, or other technical issues that require protocol optimization [65]. Alternative negative control approaches include using sense-direction probes or probes from unrelated species (e.g., zebrafish probes on human tissue), though ACD notes that sense probes can occasionally produce ambiguous results if transcription occurs from the opposite strand [65].
Quantitative Data and Experimental Evidence
Control Probe Performance Across Tissue Types
Empirical data from multiple studies demonstrates the consistent performance of RNAscope control probes across diverse tissue types and sample collection methods. A comprehensive study evaluating mRNA integrity in formalin-fixed, paraffin-embedded (FFPE) cancer tissue samples found that all three positive control probes (POLR2A, PPIB, and UBC) showed robust expression across colorectal, breast, prostate, and ovarian carcinomas [67]. Quantitative analysis using image analysis software confirmed that expression levels followed the expected pattern based on their designated expression categories, with UBC showing the highest signal intensity and POLR2A the lowest [67].
Notably, this study revealed important compartmental differences in control probe expression. In all tumor types examined, signal intensity was consistently stronger in tumor epithelial cells compared to surrounding stromal regions, highlighting the importance of evaluating control probe performance in the specific cellular context relevant to the research question [67]. This compartment-specific expression pattern was observed consistently despite variations in sample collection methods, with both prospective whole-face sections and retrospective tissue microarray (TMA) formats producing reliable results [67].
Tissue-Specific Control Probe Performance
Table 2: Control Probe Performance in Lymphoid Tissues Under Mild Pretreatment Conditions
| Tissue Type | Control Probe | Expression Score | Staining Pattern Notes |
|---|---|---|---|
| Lymph Node | PPIB | 2+, 4+* | Strong positive staining [66] |
| POLR2A | 1+ | Lower but detectable expression [66] | |
| UBC | 3+ | High expression level [66] | |
| dapB | 0 | No background staining [66] | |
| Tonsil | PPIB | 2+, 4+* | Strong positive staining [66] |
| POLR2A | 1+ | Lower but detectable expression [66] | |
| UBC | 3+ | High expression level [66] | |
| dapB | 0 | No background staining [66] |
Note: POLR2A staining shows more even distribution pattern in these tissues [66]
The selection of optimal positive control probes can be tissue-dependent, as demonstrated by data from cynomolgus monkey tissues [66]. In lymphoid tissues such as lymph node and tonsil, PPIB shows robust staining with scores of 2+ to 4+ under mild pretreatment conditions, making it an excellent control for these tissue types [66]. Interestingly, POLR2A demonstrates a more evenly distributed staining pattern in these tissues despite its lower overall expression score, which may be advantageous for assessing heterogeneity in certain experimental contexts [66].
A systematic review of RNAscope in clinical diagnostics found high concordance rates between RNAscope and other molecular techniques such as qPCR and RT-PCR (81.8-100%), supporting the technical validity of the approach when properly controlled [20]. This review, which analyzed 27 studies primarily in cancer samples, confirmed that RNAscope is a highly sensitive and specific method that can reliably detect RNA molecules in FFPE tissues when appropriate quality control measures, including control probes, are implemented [20].
Experimental Workflow and Protocol Integration
RNAscope Manual Assay Workflow with Control Integration
The RNAscope manual assay follows a structured workflow that can be completed within a single day [4] [28]. The integration of control probes into this workflow is essential for validating each experimental run and ensuring consistent, reliable results. The following diagram illustrates the key decision points in the experimental workflow where control probes provide critical quality assessment checkpoints:
This workflow emphasizes the critical role of control probes in determining whether an experiment has met technical quality standards before proceeding to interpretation of target-specific results. The decision points based on control probe performance guide researchers toward appropriate next steps, either continuing with data analysis or troubleshooting technical issues.
Detailed Manual Protocol with Quality Control Checkpoints
The RNAscope manual assay requires strict adherence to protocol specifications with integrated quality control assessments at critical steps [28]. What follows is a detailed methodology for implementing control probes within the standard RNAscope manual workflow:
Slide Preparation and Pretreatment
- Use Superfrost Plus slides to prevent tissue detachment [28].
- Perform deparaffinization with fresh xylene and ethanol series [16].
- Block endogenous peroxidase activity with H₂O₂ (Pretreatment 1) for 10 minutes at room temperature [16].
- Perform target retrieval (Pretreatment 2) using either steamer or boiling/hot plate method with RNAscope Target Retrieval reagent [16]. The optimal conditions must be determined empirically for each tissue type.
- Digest with Protease Plus (Pretreatment 3) for 30 minutes at 40°C [16]. This permeabilization step is critical for probe access and often requires optimization.
Control and Target Probe Hybridization
- Select appropriate positive control probes based on target gene expression level (see Table 1) [65].
- Include dapB negative control on a consecutive section from the same sample [65] [28].
- Pre-warm probes and wash buffer to 40°C to prevent precipitation [28].
- Hybridize probes for 2 hours at 40°C in the HybEZ Hybridization System to maintain optimum humidity and temperature [28].
Signal Amplification and Detection
- Apply amplification reagents (AMP1-AMP6) sequentially with appropriate wash steps between each amplification [16]. Missing any amplification step will result in no signal [28].
- Develop colorimetric signal using DAB reaction with careful timing to optimize signal-to-noise ratio [16].
- Counterstain with Gill's Hematoxylin diluted 1:2 for optimal nuclear contrast [28].
- Dehydrate tissue through ethanol and xylene series [16].
- Mount with xylene-based mounting media for Brown assays or EcoMount/PERTEX for Red assays [28].
Throughout the procedure, avoid letting slides dry completely and ensure the hydrophobic barrier remains intact [28]. Use only ImmEdge Hydrophobic Barrier Pen as other pens may not maintain their barrier throughout the procedure [28].
The Scientist's Toolkit: Essential Research Reagent Solutions
Successful implementation of the RNAscope control probe system requires specific reagents and equipment designed to maintain the integrity of the assay conditions. The following table details the essential components of the control probe qualification toolkit:
Table 3: Essential Research Reagent Solutions for Control Probe Implementation
| Item | Function/Application | Technical Notes |
|---|---|---|
| HybEZ Oven | Maintains optimum humidity and temperature during hybridization and amplification steps [28] | Critical for consistent results; standard hybridization ovens may not provide sufficient humidity control |
| Positive Control Probes (PPIB, POLR2A, UBC) | Assess technique and sample RNA quality [65] | Select based on target gene expression level; PPIB recommended for most applications |
| dapB Negative Control Probe | Verifies absence of background staining [65] | Universal negative control for all animal tissues; essential for every experiment |
| Superfrost Plus Slides | Prevents tissue detachment during stringent assay conditions [28] | Other slide types may result in tissue loss |
| ImmEdge Hydrophobic Barrier Pen | Creates barrier to maintain reagent coverage and prevent drying [28] | Only recommended barrier pen; others may fail during the procedure |
| Protease Plus | Permeabilizes tissue to allow probe access to target RNA [16] | Digestion time often requires optimization for different fixation conditions |
| RNAscope Target Retrieval Reagents | Reverse cross-links from formalin fixation to expose target RNA [16] | Pretreatment time and temperature require optimization for different tissues |
Additional specialized equipment includes the Leica Biosystems' BOND RX or Roche Ventana DISCOVERY systems for automated processing [4] [61], though the manual protocol remains widely accessible for most research laboratories. For quantification, image analysis software such as HALO (Indica Labs) or Aperio RNA ISH Algorithm (Leica Biosystems) enable precise dot counting and semi-automated scoring [4] [20].
Scoring, Interpretation, and Troubleshooting
Control Probe Scoring Guidelines
The interpretation of RNAscope control probes follows a standardized scoring system based on the number of punctate dots per cell, where each dot represents an individual RNA molecule [28] [20]. The scoring criteria established by ACD provide a semi-quantitative framework for assessing both positive and negative controls:
Table 4: RNAscope Scoring Guidelines for Control Probe Assessment
| Score | Criteria | Interpretation for Assay Qualification |
|---|---|---|
| 0 | No staining or <1 dot/10 cells | Expected for dapB negative control [28] |
| 1 | 1-3 dots/cell | Minimum acceptable for POLR2A; indicates suboptimal conditions for PPIB [28] |
| 2 | 4-9 dots/cell; very few dot clusters | Minimum acceptable for PPIB in qualified assay [28] |
| 3 | 10-15 dots/cell; <10% dots in clusters | Expected for UBC in qualified assay [28] |
| 4 | >15 dots/cell; >10% dots in clusters | Typical for UBC in high-quality samples [28] |
For a successful assay qualification, the positive control should demonstrate a score of ≥2 for PPIB or ≥3 for UBC with relatively uniform signal throughout the sample, while the dapB negative control should show a score of <1 (no staining or less than 1 dot per 10 cells) [28]. It is important to note that dot intensity reflects the number of probe pairs bound to each RNA molecule rather than the expression level, so quantification should focus on dot count rather than intensity [28].
Troubleshooting Based on Control Probe Performance
Control probes provide critical diagnostic information when assay performance is suboptimal. The pattern of control probe results guides specific troubleshooting approaches:
Low or Absent Positive Control Signal with Clean Negative Control: This pattern indicates insufficient signal amplification, often due to inadequate protease digestion or target retrieval [65] [28]. Gradually increase Protease Plus time in 5-minute increments or adjust target retrieval conditions. Over-fixed tissues typically require extended retrieval times [28].
High Background on Negative Control Probe: Excessive non-specific staining suggests over-digestion with protease or non-optimal fixation [65]. Reduce protease digestion time and verify fixation conditions (ACD recommends 10% NBF for 16-32 hours) [28].
Inconsistent Staining Across Tissue Sections: This may result from uneven reagent coverage, drying of sections, or variable tissue thickness. Ensure consistent application of reagents using an ImmEdge barrier pen and never allow slides to dry completely between steps [28].
Weak Staining in Specific Tissue Compartments: Different cell types may require optimized pretreatment conditions. Stromal regions often show lower signal than epithelial compartments, which may require independent assessment for compartment-specific analyses [67].
When troubleshooting, implement changes systematically rather than simultaneously, and always include both positive and negative controls in optimization experiments. Document all parameter adjustments to establish standardized conditions for specific tissue types in your laboratory.
The implementation of control probes PPIB, POLR2A, UBC, and dapB provides an essential framework for qualifying the RNAscope manual assay within a comprehensive research workflow. These controls enable researchers to verify technical performance, assess sample quality, and establish confidence in experimental results, forming a critical component of rigorous scientific practice in molecular morphology. By strategically selecting appropriate positive controls based on target gene expression levels and consistently including negative controls to monitor background, researchers can standardize the RNAscope technique across experiments, operators, and time points. The integration of these quality control measures aligns with the broader thesis of robust, reproducible science, making the RNAscope assay not merely a technical procedure but a scientifically-validated approach for spatial gene expression analysis in basic research and drug development applications.
The RNAscope in situ hybridization (ISH) assay represents a significant advancement in molecular detection technology, enabling the visualization of target RNA within intact cells and tissues with single-molecule sensitivity. This proprietary technology utilizes a novel signal amplification and background suppression system based on a "double Z" probe design, which differentiates it from traditional ISH methods by providing exceptional specificity and sensitivity [2]. A fundamental concept underlying the entire RNAscope methodology is that each punctate dot visualized under microscopy corresponds to an individual RNA molecule [68] [55]. This direct correlation forms the foundation for all scoring approaches, as the number of dots present per cell directly reflects the copy number of the target RNA transcript within that cell.
The semi-quantitative scoring system developed for RNAscope provides researchers with a standardized framework for evaluating gene expression patterns while maintaining the crucial spatial and morphological context of the tissue [55]. Unlike quantitative PCR or other solution-based methods that homogenize tissues, RNAscope preserves the architectural relationships between cells, allowing investigators to determine not only how much of a transcript is present but also exactly where it is located—whether in specific cell types, subcellular compartments, or pathological regions [55]. This spatial dimension of gene expression data is particularly valuable for understanding heterogeneous tissues like tumors, developing organs, and complex neurological structures.
Proper interpretation of RNAscope staining requires understanding several key principles that distinguish it from protein-based detection methods like immunohistochemistry (IHC). First, RNAscope signals are evaluated based on dot counting rather than signal intensity or subjective assessment of staining strength [22] [28]. Second, the technology incorporates specific control probes that must be run alongside target probes to validate assay performance and RNA quality [22]. Third, the semi-quantitative scoring system can be adapted to various expression scenarios, from homogeneous expression in uniform cell populations to heterogeneous expression in complex tissues [55]. This application note provides comprehensive guidelines for implementing the standardized RNAscope scoring system to ensure accurate, reproducible interpretation of results across different experimental contexts and tissue types.
Fundamental Scoring System and Criteria
The RNAscope assay employs a standardized semi-quantitative scoring system that categorizes staining results based on the average number of punctate dots observed per cell within the region of interest [28]. This systematic approach transforms qualitative visual patterns into discrete numerical scores that reflect underlying transcript abundance. The scoring criteria were developed based on the expression patterns of housekeeping genes with known expression ranges, providing a framework that can be adapted to targets with varying expression levels [22].
Table 1: RNAscope Semi-Quantitative Scoring Guidelines
| Score | Criteria | Interpretation |
|---|---|---|
| 0 | No staining or <1 dot/10 cells | Negative/Negligible expression |
| 1 | 1-3 dots/cell | Low expression |
| 2 | 4-9 dots/cell; none or very few dot clusters | Moderate expression |
| 3 | 10-15 dots/cell; <10% dots in clusters | High expression |
| 4 | >15 dots/cell; >10% dots in clusters | Very high expression |
When applying this scoring system, researchers should focus exclusively on counting discrete dots within cellular boundaries rather than assessing signal intensity [22] [28]. The intensity or size of individual dots reflects the number of probe pairs bound to each target RNA molecule rather than the abundance of the transcript itself [68]. In cases of very high transcript density, dots may appear as clusters due to multiple RNA molecules in close proximity; the scoring system accounts for this phenomenon by including cluster percentage in the criteria for scores 3 and 4 [68] [28].
The semi-quantitative scoring approach requires examination of multiple representative fields of view within a tissue section to account for potential regional variations in expression. For each sample, at least three slides should be run in parallel: the target probe, a positive control probe (typically targeting a housekeeping gene like PPIB, POLR2A, or UBC), and a negative control probe (targeting the bacterial dapB gene) [22] [68]. Successful staining is characterized by a positive control score of ≥2 for PPIB/POLR2A or ≥3 for UBC, with relatively uniform signal distribution, and a negative control score of <1, indicating minimal background staining [22] [28]. These control values establish the baseline for interpreting target probe results and validating tissue RNA quality and assay performance.
Essential Controls for Score Interpretation
The accurate interpretation of RNAscope scoring data depends critically on the proper implementation and assessment of control probes, which serve as essential benchmarks for evaluating assay performance and sample quality. Control slides test whether the assay conditions are optimal, while control probes assess the quality and accessibility of RNA within the experimental samples [22]. Running these controls in parallel with target probes is not optional but rather a fundamental requirement for generating reliable, interpretable data.
The recommended positive control probes target constitutive housekeeping genes with known expression characteristics that vary in their copy number per cell, allowing researchers to select the most appropriate control for their specific experimental context. PPIB (Cyclophilin B) and POLR2A represent low-copy number genes (approximately 10-30 and 5-15 copies per cell, respectively), while UBC (Ubiquitin C) represents a high-copy number gene [28]. These differential expression levels provide distinct reference points for evaluating whether the assay is performing within expected parameters. Successful staining with positive control probes should yield a PPIB or POLR2A score of ≥2, or a UBC score of ≥3, with relatively uniform signal distribution throughout the sample [22] [28]. The availability of multiple positive control options is particularly valuable when working with specialized tissues where certain housekeeping genes might exhibit unexpected variation.
The negative control probe targeting the bacterial dapB gene, which should not be present in properly fixed and processed mammalian tissues, provides a critical measure of background staining and non-specific signal [22] [28]. A valid assay performance is characterized by a dapB score of <1, indicating minimal non-specific probe binding or background amplification [22]. Elevated dapB signals suggest issues with tissue fixation, excessive protease digestion, or other technical factors that need addressing before meaningful interpretation of target probe results can proceed. ACD also provides prepared control slides (Human Hela Cell Pellet Cat. No. 310045; Mouse 3T3 Cell Pellet Cat. No. 310023) that can be used to verify the performance of the entire assay system independently of the experimental samples [22].
Table 2: Essential Controls for RNAscope Scoring Interpretation
| Control Type | Specific Examples | Purpose | Interpretation Criteria |
|---|---|---|---|
| Positive Control Probes | PPIB (Cyclophilin B), POLR2A, UBC | Verify RNA quality and assay performance | PPIB/POLR2A score ≥2; UBC score ≥3 |
| Negative Control Probe | Bacterial dapB gene | Assess background/non-specific signal | Score <1 indicates acceptable background |
| Control Slides | Hela Cell Pellet (Human), 3T3 Cell Pellet (Mouse) | Test assay conditions independently | Compare to established scoring patterns |
The integration of control data with target probe results follows a logical decision tree. If control stains perform within expected parameters, then target probe scores can be interpreted with confidence. If controls fall outside expected ranges, the experimental results cannot be reliably interpreted, and troubleshooting of sample preparation or assay conditions is required before proceeding [28]. This systematic approach to control implementation and assessment forms the foundation for rigorous, reproducible interpretation of RNAscope data across different experiments, operators, and laboratories.
Experimental Scenarios and Scoring Applications
The semi-quantitative scoring system for RNAscope assays adapts to diverse experimental scenarios commonly encountered in research and diagnostic applications. Understanding how to apply and interpret scoring guidelines across these different contexts is essential for extracting meaningful biological insights from the data. The versatility of the scoring approach allows researchers to address a wide spectrum of biological questions while maintaining standardized evaluation criteria.
Homogeneous Target Expression
In this scenario, a particular cell type displays relatively uniform staining for the target RNA, indicating consistent gene expression across the cell population [55]. This pattern is frequently observed with housekeeping genes in structurally uniform tissues but can also occur with specialized genes in homogeneous cell populations. The scoring approach involves assessing the overall expression level by determining the average number of dots per cell across multiple representative fields of view [55]. The semi-quantitative score (0-4) then provides a straightforward measure of expression level that can be compared across experimental conditions or tissue samples. This approach works well when the cell population of interest dominates the tissue section or can be easily identified based on morphological criteria.
Heterogeneous Target Expression
Many biologically and clinically important targets exhibit heterogeneous expression patterns, where cells of the same type display different levels of staining for the target RNA [55]. This scenario is particularly common in cancer research, where tumor cells within the same specimen may show dramatic variations in gene expression due to clonal heterogeneity or regional microenvironmental differences. In such cases, both the expression level and the percentage of cells expressing the target at different levels provide valuable information [55]. The dynamic range of expression can be quantified by binning cells with different expression levels into separate categories corresponding to the standard scores (0-4) and presenting the data as a histogram representing the expression level distribution [55]. Alternatively, the data can be consolidated into a Histo score (H score) calculated as follows: H-score = Σ (ACD score × percentage of cells per bin), producing a numerical value ranging from 0 to 400 that captures both the intensity and prevalence of expression [55].
Subpopulation or Region-Specific Expression
When a target is specifically expressed in a defined subpopulation of cells or a particular anatomical region, the scoring should focus specifically on these relevant areas rather than the entire tissue section [55]. Examples include specific neuronal populations in brain tissue, tumor cells adjacent to stromal components, or specialized zones in developing tissues. In this scenario, researchers should first identify the relevant cell subpopulation or region based on morphological features or complementary markers, then apply standard scoring methodologies (0-4) specifically to these areas [55]. Additionally, the percentage of positive cells (defined as cells with ≥1 dot/cell) within the subpopulation can provide complementary quantitative information, particularly when comparing across experimental conditions or patient samples [55].
Target Co-expression Analysis
The multiplexing capabilities of RNAscope technology enable simultaneous detection of two or more RNA targets within the same tissue section, allowing investigation of co-expression patterns [55]. This scenario is particularly valuable for identifying cells that simultaneously express a target of interest with a specific cell type marker, or for detecting coordinated expression of multiple genes within the same cells. To determine target co-expression, the degree of simultaneous co-expression can be assessed qualitatively or through image-based quantitative software analysis [55]. For semi-quantitative assessment, cells can be scored visually at 40× magnification based on the number of cells with >1 dot/cell for each target across the entire tissue section [55]. The percent dual positive is then defined as the number of cells positive for both Target 1 and Target 2 divided by the total number of cells assessed [55]. This approach provides a straightforward measure of co-expression prevalence that can be compared across experimental conditions.
Research Reagent Solutions
The successful implementation of RNAscope scoring guidelines depends on the use of appropriate reagents and materials throughout the experimental workflow. The following essential components represent the core requirements for generating reliable, interpretable data that adheres to the standardized scoring system.
Table 3: Essential Research Reagent Solutions for RNAscope Assay
| Reagent/Material | Function | Usage Notes |
|---|---|---|
| Control Probes (PPIB, POLR2A, UBC) | Positive controls for RNA quality and assay performance | PPIB/POLR2A for low-copy genes; UBC for high-copy genes [22] [28] |
| Negative Control Probe (dapB) | Assessment of background/non-specific signal | Should yield score <1 in properly fixed tissue [22] [28] |
| SuperFrost Plus Slides (Fisher Scientific) | Tissue adhesion during multi-step procedure | Critical to prevent tissue loss; other slide types not recommended [22] [28] |
| ImmEdge Hydrophobic Barrier Pen (Vector Laboratories) | Creates hydrophobic barrier around tissue sections | Maintains reagent coverage; prevents drying [28] |
| HybEZ Hybridization System | Maintains optimum humidity and temperature | Required for proper hybridization conditions [28] |
| Target Retrieval Reagents | Antigen retrieval for FFPE tissues | Often requires optimization based on tissue type and fixation [22] [28] |
| Protease Digestion Reagents | Tissue permeabilization for probe access | Temperature must be maintained at 40°C [28] |
| Appropriate Mounting Media | Slide preservation and visualization | Varies by assay: xylene-based for Brown; EcoMount/PERTEX for Red [28] |
In addition to these core reagents, proper tissue preparation materials are fundamental to achieving reliable results that can be accurately scored. For FFPE tissues, 10% neutral-buffered formalin (NBF) is the recommended fixative, with fixation for 16-32 hours at room temperature representing the ideal condition [22]. Tissue sections should be cut at 5±1μm for FFPE samples, 7-15μm for fixed frozen tissue, and 10-20μm for fresh frozen tissue [22]. Sectioning thickness outside these ranges may compromise either morphological preservation or probe penetration, potentially affecting scoring accuracy. For all tissue types, Fisher Scientific SuperFrost Plus Slides are specifically recommended to prevent tissue loss during the multi-step procedure [22] [28].
The RNAscope assay can be performed manually or on automated staining systems, including the Roche DISCOVERY ULTRA and XT systems or Leica Biosystems' BOND RX Research Advanced Staining System [4] [7]. Recent advancements include protease-free workflows that enable simultaneous detection of RNA and protein biomarkers, particularly beneficial for protease-sensitive protein epitopes [7]. For specialized applications such as oligonucleotide therapy distribution studies or small RNA detection, additional specialized reagents like the miRNAscope and RNAscope Plus assays are available [8]. Regardless of the specific assay format, consistent use of the recommended reagents and materials ensures that scoring results are comparable within and between studies, facilitating rigorous scientific evaluation and interpretation.
Workflow Integration and Quality Assessment
The integration of scoring guidelines into the overall RNAscope workflow is essential for generating reliable, interpretable data. A systematic approach to quality assessment at each stage of the process helps identify potential issues early and ensures that final scoring interpretations reflect true biological signals rather than technical artifacts. The recommended workflow begins with sample qualification using control slides and probes before proceeding to target gene evaluation [28].
The initial quality assessment step involves running experimental samples alongside appropriate control slides (e.g., Human Hela Cell Pellet Cat. No. 310045 or Mouse 3T3 Cell Pellet Cat. No. 310023) using positive and negative control probes [28]. This preliminary testing serves to verify that the entire assay system—from tissue preparation through detection—is performing within expected parameters. The control slides provide a reference standard for optimal staining patterns, allowing researchers to distinguish technical issues from true sample characteristics [22]. Successful control staining should demonstrate a PPIB/POLR2A score ≥2 or UBC score ≥3 with relatively uniform signal distribution, while the negative control dapB should show a score of <1, indicating acceptable background levels [28].
Following this qualification step, the standardized scoring guidelines are applied to evaluate target gene expression in the experimental samples. When interpreting RNAscope staining, researchers should focus on the number of dots per cell rather than signal intensity, as the dot count correlates directly with RNA copy number, while intensity reflects the number of probe pairs bound to each molecule [22] [28]. This distinction is crucial for accurate semi-quantitative assessment. Additionally, researchers should be aware that dot clusters may form when multiple mRNA molecules are in close proximity, particularly in cases of very high expression levels [68]. The scoring system accounts for this phenomenon by including cluster percentage in the criteria for scores 3 and 4 [28].
For tissues that do not yield optimal control results, pretreatment conditions often require optimization. Antigen retrieval conditions may need adjustment depending on the tissue type and fixation method [22] [28]. Similarly, protease digestion times might require modification to achieve optimal balance between signal strength and tissue morphology [28]. The recommended workflow includes iterative optimization of these parameters for samples that do not meet control standards initially [28]. This systematic approach to quality assessment and optimization ensures that subsequent scoring data generated from target probes reflects true biological variation rather than technical inconsistencies, supporting valid scientific conclusions and experimental reproducibility.
Within the broader context of RNAscope manual assay workflow research, the selection of an appropriate image analysis platform is a critical determinant for obtaining accurate, reproducible, and biologically meaningful quantitative data. The RNAscope in situ hybridization assay enables the precise visualization of individual RNA molecules within intact tissue architectures, with each molecule appearing as a distinct, punctate dot [20]. Manual dot counting is both labor-intensive and susceptible to subjective bias, underscoring the necessity for robust, automated quantitative image analysis. This application note details the methodologies for employing two widely cited software platforms—HALO (Indica Labs) and the Aperio RNA ISH Algorithm (Leica Biosystems)—for the quantitative assessment of RNAscope results [4] [20]. We provide a structured comparison of their capabilities, detailed experimental protocols for integration into the RNAscope workflow, and key analytical outputs relevant to researchers and drug development professionals.
Experimental Protocols
RNAscope Manual Assay Workflow
The following protocol must be meticulously followed to ensure optimal assay performance for subsequent image analysis. Deviations can significantly impact signal quality and quantification accuracy.
- Slide Preparation: The protocol begins with preparation of formalin-fixed, paraffin-embedded (FFPE) tissue sections, tissue microarrays (TMAs), or fresh frozen tissues mounted on slides [20].
- Permeabilization: Slides are treated with a proprietary protease solution. This step is critical; under-digestion results in lower signal and ubiquitous background, while over-digestion compromises tissue morphology and leads to RNA loss [21].
- Hybridization: Target-specific "Z" probes, designed to hybridize to the RNA of interest, are applied. These probes consist of a target-binding region, a linker, and a tail for subsequent signal amplification [20].
- Signal Amplification: A multi-step amplification process is performed. Pre-amplifiers bind to the "Z" probe tails, followed by amplifiers that bind to the pre-amplifiers. Finally, enzyme-conjugated label probes are hybridized to the amplifiers, achieving up to 8,000-fold signal amplification [20]. It is imperative to apply all amplification steps in the correct order; omitting any step may result in no signal [21].
- Signal Detection: A chromogenic or fluorescent substrate is added to develop the signal. Each RNA molecule is visualized as a distinct dot under a microscope [20].
- Controls: Each run must include positive and negative control probes. The bacterial dapB gene is used as a negative control to confirm absence of background noise. Positive controls, such as the housekeeping gene PPIB, validate assay success and tissue RNA integrity [20].
Critical Factors for Success: Temperature and humidity are rigorously controlled using a validated HybEZ Oven [21]. Slides must not be allowed to dry at any point after hybridization begins, as this causes irreversible damage. When manually washing slides by flicking or tapping, care must be taken to maintain the hydrophobic barrier and prevent drying [21].
Image Acquisition and Analysis Setup
- Image Acquisition: After assay completion, whole-slide images are digitally scanned using a bright-field microscope for chromogenic detection or a fluorescent microscope for fluorescent probes. A minimum of three representative regions per slide should be captured for analysis to ensure comprehensive sampling [20].
- Software Setup: For HALO, researchers can select the appropriate analysis module, such as the FISH-IF module for fluorescent RNAscope or the ISH Module for bright-field applications [69]. In Aperio, the RNA ISH Algorithm is selected for analysis.
- Parameter Configuration: The user defines the cellular compartment for analysis (e.g., cytoplasm) and sets parameters for dot detection, including minimum and maximum dot size and signal intensity thresholds. HALO's real-time tuning feature provides live feedback on these parameters, allowing for rapid optimization [69].
- Phenotype and Scoring Definition: For multiplex assays, cell phenotypes can be defined based on the co-expression of different RNA targets. Scoring criteria are established, which can be a simple dot count per cell, a semi-quantitative score based on dots per cell within a pre-defined range, or an H-score that incorporates both intensity and distribution [20] [69].
Results and Data Presentation
Platform Comparison and Quantitative Metrics
The choice between HALO and Aperio depends on the specific experimental needs, throughput requirements, and desired depth of analysis. The table below summarizes the core features and quantitative outputs of both platforms in the context of RNAscope analysis.
Table 1: Comparative Analysis of HALO and Aperio for RNAscope Quantification
| Feature | HALO Platform | Aperio RNA ISH Algorithm |
|---|---|---|
| Primary Analysis Type | Cell-based, single-cell segmentation | Dot detection and quantification |
| Supported Assays | RNAscope (chromogenic/fluorescent), multiplex IHC, ISH, CODEX, IMC [69] | RNA ISH, including RNAscope [4] |
| Key Quantitative Outputs | - Dot count per cell & per compartment- Cell-by-cell expression data- H-score- Cell phenotype counts & densities [69] | - Dot count per cell or tissue area- Dot area and intensity |
| Spatial Analysis | Yes (via add-on modules): proximity analysis, tumor infiltration, heat maps [69] | Limited information available |
| Throughput & Scalability | High-throughput batch analysis, TMA analysis, multi-core processing [69] | Standard |
| AI & Segmentation | Integrated pre-trained AI for nuclear/membrane segmentation; compatible with HALO AI for custom training [69] | Not specified |
| Data Export | Customizable exports: FCS files for flow cytometry analysis, spreadsheets, summary reports [69] | Standard data reports |
The quantitative data generated by these platforms enables robust statistical analysis. The following table outlines key metrics and their biological significance for a hypothetical RNAscope study investigating a target gene (e.g., a biomarker) in tumor tissues.
Table 2: Key Quantitative Outputs and Their Interpretation from RNAscope Analysis
| Quantitative Metric | Description | Biological Interpretation |
|---|---|---|
| Total Dot Count | The absolute number of RNAscope signal dots within a defined tissue region or across all analyzed cells. | A direct measure of the total transcript abundance of the target gene in the analyzed tissue section. |
| Dots per Cell | The average number of RNA molecules (dots) per cell, calculated from single-cell data. | Represents the average gene expression level per cell, allowing for comparison of expression across different tissue samples or treatment groups. |
| % Positive Cells | The proportion of cells that contain a number of dots above a pre-defined threshold for positivity. | Indicates the prevalence of cells expressing the target gene within a heterogeneous tissue sample. |
| H-Score | A composite score (0-300) that incorporates both the intensity of staining and the percentage of positive cells. | Provides a semi-quantitative assessment of gene expression that is commonly used in biomarker validation and diagnostic contexts. |
| Spatial Distribution | Metrics such as immune cell density in the tumor margin or proximity of expressing cells to a landmark. | Reveals the tissue architecture of gene expression and cell-cell interactions within the tumor microenvironment. |
Research Reagent Solutions and Materials
The following table details the essential materials and reagents required to perform the RNAscope assay and subsequent image analysis.
Table 3: Essential Research Reagent Solutions and Materials for RNAscope Workflow and Analysis
| Item | Function/Description | Example/Note |
|---|---|---|
| Target Probes | Probes designed to hybridize to the specific RNA target of interest. | Available as Ready-To-Use (C1 channel) or 50X concentrates (C2-C4 channels) for multiplexing [21]. |
| Control Probes | Essential for validating assay performance. | Negative control: dapB; Positive controls: PPIB, Polr2A, UBC (selected based on expected expression level) [20]. |
| Reagent Kit | Contains all necessary solutions for the hybridization, amplification, and detection steps. | Specific kits are available for manual or automated assays (e.g., RNAscope 2.5 HD Reagent Kit) [21]. |
| HybEZ Oven | A dedicated hybridization oven that provides precise temperature and humidity control. | Critical for routine assay success and consistent results [21]. |
| Analysis Software | Platform for quantifying RNAscope signals from digitized slides. | HALO [69] or Aperio RNA ISH Algorithm [4]. |
Workflow and Signaling Pathway Diagrams
The following diagrams illustrate the integrated experimental workflow and the underlying signaling principle of the RNAscope assay.
RNAscope Analysis Workflow
RNAscope 'Z' Probe Principle
In the evolving landscape of molecular diagnostics, the RNAscope in situ hybridization (ISH) technology represents a significant advancement for visualizing RNA expression within the morphological context of intact cells and tissues. As a novel RNA ISH method, it provides single-molecule sensitivity and single-cell resolution, enabling researchers to precisely localize gene expression without requiring RNA extraction [20] [70]. This application note details a systematic comparative analysis evaluating the concordance of RNAscope with established quantitative methods including immunohistochemistry (IHC), quantitative PCR (qPCR), and droplet digital PCR (ddPCR). We provide comprehensive experimental protocols and quantitative data to guide researchers in integrating RNAscope with orthogonal techniques for robust gene expression validation.
RNAscope is a novel RNA in situ hybridization technology launched in 2012 that enables specific detection of target RNAs within intact cells and tissues [20] [70]. The core innovation lies in its proprietary double Z probe design, which simultaneously amplifies target-specific signals while suppressing background noise from non-specific hybridization [20] [71]. This unique design requires pairs of "Z" probes to bind adjacent to each other on the target RNA before signal amplification can proceed, ensuring exceptional specificity [20].
The RNAscope assay provides visualization of RNA expression while preserving valuable morphological and spatial information that is lost in extraction-based methods like PCR [20] [72]. Each detected RNA molecule appears as a distinct dot under microscopy, allowing for both qualitative assessment of expression patterns and quantitative analysis through dot counting [20]. The technology can be applied to various sample types including formalin-fixed paraffin-embedded (FFPE) tissues, fresh frozen tissues, and fixed cells [20].
Table 1: Key Features of RNAscope Technology
| Feature | Description | Research Application |
|---|---|---|
| Single-Molecule Sensitivity | Visualize individual RNA molecules | Detection of low-abundance transcripts |
| Spatial Context Preservation | Maintains tissue architecture and cellular relationships | Study tumor heterogeneity, cell-type specific expression |
| Multiplexing Capability | Simultaneously detect multiple RNA targets | Analysis of gene co-expression and pathways |
| Compatibility with IHC | Combine RNA and protein detection on same section | Correlate transcript and protein expression |
Figure 1: RNAscope Signal Amplification Workflow. The proprietary ZZ probe design enables specific target recognition and cascading signal amplification for single-molecule detection.
Comparative Analysis with Gold Standard Methods
RNAscope vs. Immunohistochemistry (IHC)
IHC represents the most widely used method for protein detection in clinical and research settings, providing complementary but distinct information compared to RNAscope. While IHC detects translated proteins, RNAscope directly visualizes RNA transcripts, capturing earlier stages of gene expression.
A systematic review analyzing 27 studies reported that RNAscope demonstrated high sensitivity and specificity, though its concordance rate with IHC varied between 58.7% and 95.3% [20]. This variation stems from the fundamental difference in what each technique measures - RNA versus protein - and reflects post-transcriptional regulation mechanisms [20].
A multimodal study investigating podoplanin (PDPN) expression in human placenta demonstrated the complementary value of combining both techniques. The research found that while PDPN protein and PDPN mRNA showed correlated expression patterns in most tissue compartments (IHC and RNAscope H-Score correlation p=0.033), RNAscope specifically detected PDPN mRNA upregulation in syncytial placental knots trophoblastic cells that was not observed at the protein level with IHC [72]. This discordance highlights scenarios where transcript and protein expression diverge, potentially due to post-transcriptional regulation.
Table 2: Comparative Analysis: RNAscope vs. IHC
| Parameter | RNAscope | Immunohistochemistry (IHC) |
|---|---|---|
| Target Molecule | RNA transcripts | Proteins |
| Quantification Approach | Dot counting per cell | Staining intensity assessment |
| Spatial Resolution | Single-molecule, cellular | Cellular, subcellular |
| Sample Requirements | FFPE, fresh frozen, fixed cells | FFPE, fresh frozen |
| Concordance Range | 58.7-95.3% with IHC [20] | N/A |
| Key Advantage | Direct gene expression visualization | Direct protein localization |
RNAscope vs. PCR-Based Methods (qPCR and ddPCR)
PCR-based methods offer high sensitivity for nucleic acid detection but require sample homogenization, eliminating spatial context. Quantitative PCR (qPCR) provides relative quantification using standard curves, while digital PCR (dPCR) and its variant droplet digital PCR (ddPCR) enable absolute nucleic acid quantification without standard curves by partitioning samples into thousands of individual reactions [73] [74].
A systematic review reported high concordance between RNAscope and qPCR/qRT-PCR, with concordance rates ranging from 81.8% to 100% [20]. This high agreement validates RNAscope as a spatially-preserving method with sensitivity comparable to established quantitative techniques.
Recent advances in dPCR have further enhanced quantification capabilities. Studies demonstrate dPCR's superior accuracy for absolute quantification, particularly for respiratory virus detection, where it showed greater consistency and precision than real-time RT-PCR, especially at medium viral loads [75]. Similarly, ddPCR has proven valuable in oncology applications, such as precise ERBB2 copy number quantification in breast cancer, where it achieved 93.7-94.1% accuracy compared to clinical ISH results [76].
Table 3: Comparative Analysis: RNAscope vs. PCR Methods
| Parameter | RNAscope | qPCR/qRT-PCR | ddPCR/dPCR |
|---|---|---|---|
| Spatial Information | Preserved | Lost | Lost |
| Sensitivity | Single-molecule | High | Single-molecule |
| Quantification Type | Semi-quantitative (dots/cell) | Relative (Ct values) | Absolute (copies/μL) |
| Sample Requirement | Intact tissue/cells | Extracted RNA | Extracted RNA/DNA |
| Multiplexing Capacity | Up to 12 targets with different channels [20] | Limited by fluorescence channels | 4-12 targets depending on system [74] |
| Concordance with Method | 81.8-100% with qPCR [20] | N/A | Complementary absolute quantification |
Figure 2: Experimental Design Strategy. Flowchart guiding selection of appropriate methodology based on research objectives and required output parameters.
Experimental Protocols
Protocol 1: Multimodal Analysis Combining RNAscope and IHC
This protocol describes a procedure for sequential RNAscope and IHC analysis on the same tissue section, enabling direct correlation of RNA and protein expression within identical cellular contexts [72].
Materials and Reagents
- FFPE tissue sections (5 μm thickness) mounted on positively charged slides
- RNAscope target probes and detection reagents (ACD Bio)
- IHC primary antibodies and detection system
- RNAscope Hydrogen Peroxide and Protease reagents
- Antigen retrieval solution (citrate or EDTA-based)
- RNAscope Wash Buffer
- Phosphate-buffered saline (PBS)
- Hematoxylin counterstain
- Mounting medium
Procedure
- Slide Preparation: Bake FFPE slides at 60°C for 1 hour. Deparaffinize and rehydrate through xylene and ethanol series.
- RNAscope Pretreatment: Treat with Hydrogen Peroxide for 10 minutes at room temperature, followed by antigen retrieval and protease treatment.
- RNAscope Hybridization: Hybridize with target-specific probes for 2 hours at 40°C.
- Signal Amplification: Perform sequential amplification steps per manufacturer instructions.
- RNAscope Detection: Develop signal using chromogenic or fluorescent detection.
- IHC Staining: Immediately proceed with standard IHC protocol including antigen retrieval, primary antibody incubation, and detection.
- Counterstaining and Mounting: Counterstain with hematoxylin, dehydrate, and mount with permanent mounting medium.
Analysis and Interpretation
- Acquire images of the same tissue regions after both staining procedures
- For manual analysis: Score RNAscope signals as dots per cell and IHC staining intensity (0-3+)
- For digital analysis: Use platforms like HALO or QuPath to quantify both signals [20] [72]
- Correlate spatial patterns of RNA and protein expression
Protocol 2: Validation of RNAscope Results with ddPCR
This protocol describes a parallel analysis approach using RNAscope for spatial localization and ddPCR for absolute quantification of the same targets.
Materials and Reagents
- Matched tissue samples: FFPE for RNAscope, frozen for ddPCR
- RNAscope reagents and probes (ACD Bio)
- RNA extraction kit (compatible with FFPE tissues)
- ddPCR supermix, droplet generator oil, and droplet reader (Bio-Rad)
- Primers and probes for target genes
- Reverse transcription reagents
Procedure
RNAscope Workflow:
- Process FFPE sections per standard RNAscope protocol [20]
- Include appropriate controls: positive control probe (PPIB), negative control probe (dapB), and no-probe control
- Develop signal using preferred detection method
- Image entire sections using a slide scanner
- Quantify signals manually or using digital image analysis software
ddPCR Workflow:
- Extract total RNA from matched frozen tissue samples
- Quantify RNA quality and integrity
- Convert to cDNA using reverse transcription
- Prepare ddPCR reaction mix with target assays and supermix
- Generate droplets using droplet generator
- Perform PCR amplification
- Read plates using droplet reader
- Analyze data using companion software
Analysis and Interpretation
- Compare expression patterns: spatial distribution from RNAscope versus absolute quantification from ddPCR
- Calculate correlation between RNAscope dots per cell and ddPCR copies/μL
- Identify potential regional heterogeneity that might explain discrepancies
Research Reagent Solutions
Table 4: Essential Research Reagents for RNAscope and Comparative Methods
| Reagent/Category | Function | Example Products/Specifics |
|---|---|---|
| RNAscope Probes | Target-specific detection | ACD Bio catalog probes (>50,000 targets) |
| Signal Amplification Kits | Signal development | RNAscope Multiplex Fluorescent Kit |
| Positive Control Probes | Assay validation | PPIB, Polr2A, UBC for varying expression levels [20] |
| Negative Control Probes | Background assessment | Bacterial dapB gene [20] |
| IHC Detection Systems | Protein visualization | Chromogenic or fluorescent detection kits |
| ddPCR Supermixes | Partitioned PCR amplification | Bio-Rad ddPCR Supermix for Probes |
| Digital PCR Systems | Absolute quantification | QIAcuity (Qiagen), Absolute Q (Thermo Fisher) [74] |
| Image Analysis Software | Quantitative data extraction | HALO, QuPath, Aperio [20] |
The comprehensive comparative analysis presented herein demonstrates that RNAscope exhibits strong concordance with established molecular techniques while providing unique spatial information unavailable through extraction-based methods. The high concordance rates with qPCR (81.8-100%) validate its quantitative reliability, while the more variable agreement with IHC (58.7-95.3%) reflects biological realities of post-transcriptional regulation [20].
The multimodal approach combining RNAscope with IHC and ddPCR creates a powerful framework for gene expression validation. As demonstrated in the placenta study, this integrated strategy can reveal important biological insights such as discordant mRNA and protein expression in specific cellular compartments [72]. Similarly, combining RNAscope with ddPCR enables researchers to leverage the absolute quantification capabilities of dPCR while maintaining crucial spatial context.
For researchers and drug development professionals, these findings support using RNAscope as either a primary spatial tool or complementary technique alongside established methods. The decision should be guided by specific research questions: RNAscope excels when spatial context, cellular heterogeneity, or direct transcriptional activity are paramount, while PCR-based methods remain preferable for pure quantification studies. As the field moves toward more spatially-resolved molecular profiling, RNAscope technology offers a validated, highly sensitive platform for bridging the gap between traditional molecular techniques and morphological preservation.
Establishing RNAscope as a Reliable Tool in Clinical and Research Diagnostics
The accurate spatial detection of RNA expression is crucial for both basic research and clinical diagnostics. The RNAscope in situ hybridization (ISH) technology represents a significant advancement over traditional methods, offering a robust and straightforward assay to evaluate target gene expression directly in tissue contexts [53]. This technology addresses critical limitations of conventional ISH, such as high background, lack of sensitivity for low-abundance transcripts, and long turnaround times, while also providing a solution for situations where appropriate antibodies for immunohistochemistry (IHC) are unavailable or difficult to develop [77] [53]. Its proprietary double Z (ZZ) probe design enables single-molecule sensitivity and high specificity, allowing researchers to visualize virtually any RNA biomarker in any species or tissue type with single-cell resolution [77] [53]. This application note details the establishment of the manual RNAscope assay as a reliable method, providing detailed protocols, validation data, and practical resources for its implementation.
The extreme sensitivity and specificity of the RNAscope assay are achieved through a unique signal amplification and background suppression mechanism. Unlike traditional single-probe ISH methods, RNAscope probes for each target are comprised of 6–20 oligonucleotide pairs, known as "ZZ pairs" [77]. Each ZZ pair is designed to bind adjacent sequences on the target RNA (approximately 50 contiguous bases). Critically, the subsequent binding of the preamplifier molecule requires both Z probes of a pair to be correctly hybridized to their adjacent targets; off-target binding to non-specific RNA sequences does not result in signal amplification, thereby virtually eliminating non-specific background [77].
The bound preamplifiers then initiate a sequential amplification tree: each preamplifier binds multiple amplifiers, and each amplifier, in turn, has numerous binding sites for enzyme-linked fluorescent or chromogenic labels. This branched DNA amplification system can theoretically yield an 8000-fold signal increase per target RNA molecule, transforming a single RNA molecule into a detectable punctate dot [77]. For multiplexing, the system uses channel-specific reagents that are ultimately labeled with distinct fluorophores, allowing for the simultaneous detection of multiple RNA species within a single cell [77].
Diagram: RNAscope ZZ Probe Mechanism and Signal Amplification
Materials and Reagents: The Scientist's Toolkit
Successful implementation of the RNAscope assay requires specific reagent kits and laboratory equipment. The following table catalogs the essential components for establishing the manual workflow.
Table 1: Essential Research Reagent Solutions for the RNAscope Manual Assay
| Item Name | Function/Description | Example Catalog Numbers |
|---|---|---|
| RNAscope Fluorescent Multiplex Kit | Core reagent kit containing amplifiers, labels, and detection reagents for fluorescent assays [77]. | Cat No. 320851 (v1), 320850 (v1, fresh frozen) [77] [78] |
| RNAscope Pretreatment Kit | Contains reagents for target retrieval and protease digestion, crucial for FFPE tissue sections [77]. | Cat No. 322380 [77] [78] |
| Target Probes | Species-specific, target-specific ZZ probes. C1 probes are Ready-To-Use (RTU); C2, C3, C4 are 50x stocks [21]. | Varies by target and species (e.g., Rn-Hcrtr1-C1) [78] |
| Control Probes | Essential for assay validation. Include positive controls (e.g., Polr2a, Ppib, Ubc) and negative controls (e.g., bacterial DapB) [77]. | 3-plex Positive: 320881; 3-plex Negative (DapB): 320871 [77] |
| Protease IV / Protease Plus | A broad-spectrum protease for sample permeabilization, allowing probe access to target mRNA. Critical for signal and morphology [21] [16]. | Cat No. 322340 (Protease IV) [78] |
| HybEZ Oven System | A critical benchtop hybridization oven validated to provide consistent temperature and humidity, both vital for assay performance [4] [21]. | PN 321710/321720 [77] [78] |
| Hydrophobic Barrier Pen | Used to draw a barrier around the tissue section, creating a well to contain hybridization reagents during incubation [77] [78]. | ImmEdge Pen (H-4000) [77] |
| Wash Buffer | Buffered solution for stringency washes between assay steps to remove unbound reagents [77]. | Cat No. 310091 (50x concentrate) [77] |
| Mounting Medium | Aqueous medium with antifade agent (e.g., Mowiol DABCO) for preserving fluorescence after staining [77]. | Fluoro-Gel II with DAPI [78] |
Experimental Protocols: Detailed Methodologies
Basic Protocol: Multiplex Fluorescent RNAscope on Fresh-Frozen Sections
This protocol is adapted for fresh-frozen (FF) tissue sections, which are preferred for optimal RNA preservation [77] [78]. The entire procedure up to probe hybridization must be performed under RNase-free conditions.
Materials and Reagents: Beyond the core toolkit, require 10–20 µm thick fresh-frozen sections on Superfrost slides, RNase AWAY, paraformaldehyde (PFA), ethanol gradients (50%, 70%, 100%), RNase-free water, 1x PBS, cover glasses, and a humidifying chamber [77].
Procedure:
- Fixation and Dehydration: Fix thawed FF sections in 4% PFA for 15-60 minutes at 4°C. Dehydrate sequentially in 50%, 70%, and 100% ethanol for 5 minutes each [77] [78].
- Pretreatment - Protease Digestion: Apply the provided protease (e.g., Protease IV) for 30 minutes at 40°C in the HybEZ oven. This step is critical; under-digestion causes high background, while over-digestion compromises morphology and RNA integrity [21] [78].
- Probe Hybridization: Prepare the probe mix. For a multiplex assay, dilute 50x C2 and C3 probe stocks into the ready-to-use C1 probe. If a specific C1 target is not used, dilute the other channel probes into a Blank Probe Diluent [21]. Apply the probe mix to the tissue, cover with a coverslip, and incubate for 2 hours at 40°C in the HybEZ oven [77].
- Signal Amplification (AMP 1-6): Perform a series of amplifier hybridizations (Amp 1-6) with intermittent wash steps, strictly following the kit's sequence and timing. Do not omit or alter the order of these steps, as this will result in no signal [21] [16].
- Detection and Mounting: For fluorescent detection, apply the final fluorophore-labeled probes. Counterstain with DAPI and mount slides with an aqueous mounting medium [77] [78].
Critical Steps and Tips:
- Temperature and Humidity Control: The HybEZ oven is strongly recommended, as other incubators may not provide the consistent conditions required for optimal performance [21].
- Prevent Tissue Drying: Never let the tissue sections dry out at any point after fixation, as this will cause irreversible damage and high nonspecific background. Ensure the hydrophobic barrier remains intact [21].
- Use Fresh Reagents: Always use fresh aliquots of ethanol, xylene, and other reagents to prevent RNase contamination or reduced efficacy [21].
Protocol for Formalin-Fixed Paraffin-Embedded (FFPE) Sections
The workflow for FFPE tissues requires additional pretreatment steps to reverse cross-links and expose target RNA.
- Deparaffinization and Rehydration: Bake slides, then immerse in xylene (or substitute) followed by 100% ethanol to remove paraffin. Rehydrate through descending ethanol gradients (100%, 70%, 50%) to water [16].
- Target Retrieval: Perform heat-induced epitope retrieval by incubating slides in Target Retrieval reagent either in a steamer or using a boiling/hot plate method. This step reverses formalin-induced cross-links [16].
- Endogenous Enzyme Blocking (for Chromogenic Assays): For assays using enzyme-based detection (e.g., HRP), block endogenous peroxidase activity with H₂O₂ reagent [16].
- Protease Digestion: Digest with Protease Plus to permeabilize the tissue. The duration of this step is highly tissue-dependent and critical for success [21] [16].
- Probe Hybridization and Amplification: Continue the procedure as described for FF sections from Step 3 onward [16].
Diagram: RNAscope Manual Assay Workflow
Performance Validation and Quantitative Data
The reliability of the RNAscope assay for diagnostics and research is demonstrated by its superior performance against established methods and its capacity for rigorous quantification.
Sensitivity and Specificity Validation
A pivotal study comparing RNAscope to traditional ISH methods for detecting SIV RNA in lymphoid tissues demonstrated its exceptional performance. RNAscope provided equivalent sensitivity to the gold-standard radiolabeled ISH (R-ISH) for detecting productively infected cells, with a trend towards higher sensitivity, while offering vastly superior speed and resolution [79].
Table 2: Comparative Performance of RNAscope vs. Traditional ISH Methods
| Assay Parameter | Radiolabeled ISH (R-ISH) | Chromogenic ISH (C-ISH) | RNAscope ISH |
|---|---|---|---|
| Assay Time | 6 - 21 days [79] | ~3 days [79] | ~1 day (8-9 hours) [77] [79] |
| Sensitivity for vRNA+ Cells | Gold Standard | Equivalent to R-ISH [79] | As sensitive as R-ISH, trend toward greater sensitivity [79] |
| Detection of Viral Particles | Good, but with diffuse signal [79] | ~3 orders of magnitude less sensitive [79] | Excellent, with superior visual discrimination and single punctate signals [79] |
| Correlation with qRT-PCR | Information missing | Information missing | Highly correlated (with tissue vRNA copies) [79] |
| False Positive Rate | Information missing | Information missing | Extremely low (e.g., 2 false positive cells in ~70 mm² of tissue) [79] |
Furthermore, the assay's specificity is robust. Pretreatment of tissues with RNase completely ablated detection signals, and the use of negative control probes (e.g., bacterial DapB) resulted in minimal to no background staining, confirming the specificity of the ZZ probe design [77] [79].
Quantitative Image Analysis
A key advantage of RNAscope is the generation of quantifiable, punctate dots, where each dot represents a single RNA molecule. This enables digital quantification of gene expression.
Recommended Analysis Workflow:
- Image Acquisition: Use a high-resolution slide scanner or fluorescence microscope with a 20x-63x objective to capture images [77] [78].
- Automated Analysis with QuPath: The open-source software QuPath is highly recommended for automated cell detection and dot counting, especially for large datasets [78].
- Cell Detection: Use the built-in algorithms to identify cell boundaries based on the counterstain (e.g., DAPI).
- Dot Counting: Set fluorescence intensity thresholds to identify and count punctate dots within each cell.
- Threshold Validation: Establish signal thresholds for defining "positive" cells using negative control slides (e.g., DapB) to account for background and autofluorescence [78].
- Data Export and Statistical Analysis: Export raw counts (dots per cell) for statistical analysis in software like GraphPad Prism [78].
This automated, standardized approach increases reproducibility, reduces analyst bias, and is suitable for high-throughput studies in both clinical and research settings [78].
Applications and Implementation Guidelines
The RNAscope assay has proven to be a versatile tool with broad applicability across multiple fields.
Key Research and Diagnostic Applications:
- Neuroscience: Characterization of neuronal subtypes and mapping of neurotransmitter receptors (e.g., GPCRs like Drd1, Drd2, Cnr1) and immediate-early genes (e.g., Fos, Arc) with single-cell resolution in complex brain regions like the hippocampus and striatum [77] [80].
- Infectious Disease: Highly sensitive detection and spatial localization of viral RNA (e.g., SIV, HIV) in tissue reservoirs, playing a critical role in understanding viral persistence and latency, particularly in lymphoid tissues [79].
- Oncology: Profiling of mRNA biomarkers (e.g., EGFR, PDL1, HPV) in tumor tissues for patient stratification and biomarker discovery in cancers of the lung, breast, and head and neck [80].
- Multiplexing and Co-Detection: Simultaneous detection of up to several RNA targets in the same cell (multiplexing) and combination with protein detection via immunohistochemistry (co-detection) to gain comprehensive molecular insights [77] [80].
Troubleshooting Common Issues:
- High Background or No Signal: Review protease digestion time; optimize for your specific tissue type [21].
- Poor Morphology: This indicates over-digestion by the protease; reduce digestion time [21].
- Weak Signal from a Channel 2 Probe: Channel 2 is inherently less sensitive. Assign low-abundance targets to the more sensitive Channel 1 or Channel 3 [77].
- Inconsistent Results Between Runs: Ensure strict control of temperature and humidity using the validated HybEZ oven and always use fresh reagents [21].
The RNAscope ISH technology, with its proprietary ZZ probe design, provides a reliable and robust solution for in situ RNA visualization that meets the stringent demands of both clinical diagnostics and advanced research. Its single-molecule sensitivity, high specificity, and multiplexing capability, combined with a rapid one-day workflow, position it as a superior alternative to traditional ISH and a powerful complement to IHC. By adhering to the detailed protocols, validation methods, and implementation guidelines outlined in this document, researchers and diagnosticians can confidently establish RNAscope as a cornerstone technology for spatial transcriptomics, enabling new discoveries and enhancing diagnostic precision.
Conclusion
The RNAscope manual assay represents a powerful and robust methodology for spatially resolving gene expression at the single-cell level in FFPE tissues. Mastery of its workflow—from meticulous sample preparation and strict protocol adherence to rigorous validation with control probes—is paramount for generating reliable, high-quality data. Effective troubleshooting and optimization are essential skills for adapting the assay to diverse tissue types and fixation conditions. As the technique continues to demonstrate strong concordance with other molecular methods, its integration into both basic research and clinical diagnostic pipelines is poised to expand. Future directions will likely see increased automation, refined multiplexing capabilities, and the development of more sophisticated computational tools for image analysis, further solidifying RNAscope's role as an indispensable tool in the era of spatial biology and personalized medicine.
References
- 1. 2017 Jan 24 - Introduction to the RNAscope™ Assay [https://acdbio.com/2017-jan-24-introduction-rnascope%E2%84%A2-assay]
- 2. RNAscope Protocol: Step-by-Step Guide, Applications & ... [https://machinecircuit.com/rnascope-protocol-step-by-step-guide-applications-best-practices/]
- 3. Are You In(to) Situ? – Putting Together Your First ... [https://bitesizebio.com/42865/are-you-into-situ-putting-together-your-first-rnascope-assay/]
- 4. RNAscope Workflow, In Situ Hybridization Steps | ACD [https://acdbio.com/ebook/introduction/rnascope-workflow]
- 5. Fresh Frozen RNAScope Protocol [https://www.protocols.io/view/fresh-frozen-rnascope-protocol-hfnab3maf.html]
- 6. Expanded RNAscope™ In Situ Hybridization Assay [https://www.protocols.io/view/expanded-rnascope-in-situ-hybridization-assay-dp8p5rvn.html]
- 7. 2025 Mar 18 - Accelerate RNA and Protein Biomarker ... [https://acdbio.com/2025-mar-18-accelerate-rna-and-protein-biomarker-development-new-rnascope%E2%84%A2-ish-protease-free-assays]
- 8. 2025 Mar 25 - Visualize and Quantify Oligonucleotide ... [https://acdbio.com/2025-mar-25-visualize-and-quantify-oligonucleotide-therapy-delivery-spatial-biodistribution-and]
- 9. Dual ISH and IHC [https://acdbio.com/science/applications/research-solutions/sequential-rna-protein-detection]
- 10. Dual ISH-IHC Application Protocol Using RNAScope [https://www.novusbio.com/support/support-by-application/dual-ish-ihc/protocol.html?srsltid=AfmBOoqRpcNoMcv5LIuDHj57F-Cy1_fBMm3GCTM4uUqb9cq4ryu34yR9]
- 11. RNAscope: A Novel in Situ RNA Analysis Platform for ... [https://pmc.ncbi.nlm.nih.gov/articles/PMC3338343/]
- 12. 2025 Jan 14 - Unlock the role of spatial profiling in ... [https://acdbio.com/2025-jan-14-unlock-role-spatial-profiling-detecting-diverse-mrna-markers-and-short-targets]
- 13. RNAscope ISH Troubleshooting [https://www.bio-techne.com/resources/protocols-troubleshooting/rnascope-ish-troubleshooting]
- 14. RNAscope 2.5 HD Duplex Assay [https://acdbio.com/rnascope-25-hd-duplex-assay]
- 15. RNAscope 2.5 HD Assay—BROWN | In Situ Hybridization, ... [https://acdbio.com/rnascope-25-hd-assay%E2%80%94brown]
- 16. RNAscope Manual Assay Training Videos [https://www.bio-techne.com/resources/protocols/rnascope-manual-assay-training-videos]
- 17. Intronic RNAscope probes enable precise identification of ... [https://www.nature.com/articles/s42003-025-08012-z]
- 18. New-ISH on the Block: Introduction to RNAscope® [https://bitesizebio.com/40621/new-ish-on-the-block-introduction-to-rnascope/]
- 19. Comparison of RNAscope and immunohistochemistry for ... [https://diagnosticpathology.biomedcentral.com/articles/10.1186/s13000-022-01191-x]
- 20. Evaluation of the Suitability of RNAscope as a Technique ... [https://pmc.ncbi.nlm.nih.gov/articles/PMC8710359/]
- 21. RNAscope Assay Workflow | In Situ Hybridization, RNA-ISH [https://acdbio.com/support-solution-category/rnascope-assay-workflow]
- 22. RNAscope Assay Technical Support and FAQ [https://acdbio.com/technical-support/getting-started]
- 23. Learn How RNAscope Technology Works [https://www.bio-techne.com/reagents/rnascope-ish-technology/get-started]
- 24. Optical super-resolution histology of formalin-fixed paraffin- ... [https://www.nature.com/articles/s41467-025-64626-1]
- 25. Quantitative proteomics of formalin-fixed, paraffin ... [https://www.nature.com/articles/s44161-025-00721-2]
- 26. What are FFPE samples and how are they prepared? [https://www.lexogen.com/blog/what-are-ffpe-samples-and-how-are-they-prepared/]
- 27. Systematic comparison of quantity and quality of RNA ... [https://translational-medicine.biomedcentral.com/articles/10.1186/s12967-024-05890-5]
- 28. RNAscope Troubleshooting Guide and FAQ [https://acdbio.com/technical-support/solutions]
- 29. Protocols | Immunohistochemistry [https://www.stressmarq.com/support/technical-support/protocols/immunohistochemistry-protocol/?srsltid=AfmBOopJM5oXGawYYDXghvRRTT5yAhKgTeSti1yFnV4ip-cOj-v8Ydin]
- 30. Methods to Block Endogenous Detection [https://www.thermofisher.com/us/en/home/life-science/protein-biology/protein-biology-learning-center/protein-biology-resource-library/pierce-protein-methods/methods-block-endogenous-detection.html]
- 31. BLOXALL Endogenous Blocking Solution, Peroxidase And ... [https://vectorlabs.com/products/bloxall-endogenous-peroxidase-and-ap/?srsltid=AfmBOoo44xpc8XvoqT3Rt14tUkxQ1YJ1TzkJ87YPzkV0UdGf7ALks0V7]
- 32. IHC antigen retrieval protocol [https://www.abcam.com/en-us/technical-resources/protocols/ihc-antigen-retrieval]
- 33. eBioscience™ IHC Antigen Retrieval Solution - High pH ... [https://www.thermofisher.com/order/catalog/product/00-4956-58]
- 34. Antigen retrieval and permeabilization for IHC [https://www.abcam.com/en-us/technical-resources/guides/ihc-guide/antigen-retrieval-and-permeabilization]
- 35. Identification of Optimal Decalcification Method and Tissue ... [https://www.mdpi.com/2304-6767/13/11/538]
- 36. In Situ Hybridization (ISH), CISH, and FISH Reagents [https://www.thermofisher.com/us/en/home/life-science/cell-analysis/cellular-imaging/in-situ-hybridization-ish.html]
- 37. Hybridisation - Bioinformatics [https://www.bioinformatics.nl/molbi/SimpleCloningLab/Hybridisation.htm]
- 38. Hybridization Probes - an overview [https://www.sciencedirect.com/topics/agricultural-and-biological-sciences/hybridization-probes]
- 39. Hybridization properties of long nucleic acid probes for ... [https://pmc.ncbi.nlm.nih.gov/articles/PMC2995084/]
- 40. Hybridization-Based Target Enrichment for NGS [https://sequencing.roche.com/global/en/article-listing/hybridization-based-target-enrichment.html]
- 41. Target Enrichment Approaches for Next-Generation ... [https://pmc.ncbi.nlm.nih.gov/articles/PMC9318977/]
- 42. ProbeTools: designing hybridization probes for targeted ... [https://bmcgenomics.biomedcentral.com/articles/10.1186/s12864-022-08790-4]
- 43. Probe-target hybridization depends on spatial uniformity of ... [https://www.nature.com/articles/s41598-020-65563-3]
- 44. RNAscope® technology | In Situ Hybridization, RNA-ISH [https://acdbio.com/dataanalysisguide]
- 45. RNAscope Troubleshooting Guide and FAQ [https://acdbio.com/technical-support/solutions/faq]
- 46. RNAscope Webinars, Videos, Presentations | Learn More [https://acdbio.com/technical-support/learn-more]
- 47. in situ Hybridization Kits, Hybridization Assays [https://acdbio.com/manual-assays-rnascope]
- 48. Chromogenic IHC and ISH Resources [https://diagnostics.roche.com/us/en/products/product-category/immunohistochemistry--ihc-/chromogenic-resources.html]
- 49. Chromogenic Immunohistochemistry (IHC) Paraffin Protocol [https://www.novusbio.com/support/support-by-application/immunohistochemistry-paraffin/protocol.html?srsltid=AfmBOoqu0dYo4kA7FSq_MyU80WOZQ6cQuEmcWSZBapbAahfRnw5VCWt9]
- 50. Tissue Section Imaging Protocol [https://www.licorbio.com/support/contents/applications/microscope-slides/tissue-section-imaging-protocol.html]
- 51. A method for manual and automated multiplex RNAscope in ... [https://journals.plos.org/plosone/article?id=10.1371/journal.pone.0207619]
- 52. Quantitative Analysis of Gene Expression in RNAscope ... [https://en.bio-protocol.org/en/bpdetail?id=4580&type=0]
- 53. RNAscope, In Situ Hybridization Technique | ACD [https://acdbio.com/referenceguide]
- 54. Quantitative analysis of RNAscope staining for c-fos ... [https://pmc.ncbi.nlm.nih.gov/articles/PMC8374392/]
- 55. A Guide for RNAscope™ Data Analysis [https://www.bio-techne.com/reagents/rnascope-ish-technology/rnascope/guide-rnascope-data-analysis]
- 56. RNA In situ hybridization (ISH) using RNAscope® [https://www.protocols.io/view/rna-in-situ-hybridization-ish-using-rnascope-dydu7s6w.html]
- 57. Pretreatment Conditions, In Situ Hybridization Temperature [https://acdbio.com/ebook/introduction/materialsmethod/optimal-pretreatment-conditions]
- 58. bio-techne.com/cn/resources/protocols- troubleshooting / rnascope -ish... [https://www.bio-techne.com/cn/resources/protocols-troubleshooting/rnascope-ish-troubleshooting]
- 59. common questions, RNAscope , and... - Indica Labs troubleshooting [https://indicalab.com/news/rnascope-common-questions-troubleshooting-and-tips-and-tricks-2/]
- 60. Image Analysis | In Situ Hybridization, RNA-ISH [https://acdbio.com/image-analysis]
- 61. RNAscope ISH Reference Guide [https://www.bio-techne.com/reagents/rnascope-ish-technology/rnascope/rnascope-ish-reference-guide]
- 62. NGS Validation with RNAscope ISH [https://acdbio.com/science/applications/research-solutions/ngsht-transcriptomic-validation-rna-seq]
- 63. Fresh frozen tissue | In Situ Hybridization, RNA-ISH [https://acdbio.com/sample-compatibility/fresh-frozen-tissue]
- 64. RNAscope in situ hybridization (ISH) FAQs [https://www.bio-techne.com/reagents/rnascope-ish-technology/getting-started/faqs]
- 65. Control Slides and Control Probes for RNAscope [https://acdbio.com/control-slides-and-control-probes-rnascope]
- 66. Cynomolgus: Control Probe Data, mRNA Probe | ACD [https://acdbio.com/ebook/cynomolgus-monkey/positive-and-negative-control-probe-data-using-optimal-conditions-tissue-type]
- 67. RNAscope in situ hybridization confirms mRNA integrity in... | Oncotarget [https://www.oncotarget.com/article/21851/text/]
- 68. RNAscope Assay Visualization and Interpretation [https://acdbio.com/support-solution-category/rnascope-assay-visualization-and-interpretation]
- 69. HALO | Quantitative Image Analysis for Pathology [https://indicalab.com/halo/]
- 70. RNAscope ISH Technology [https://www.creative-bioarray.com/support/rnascope-ish-technology.htm]
- 71. Chromogenic in situ Hybridization, CISH, ISH Technology [https://acdbio.com/science/technology-overview]
- 72. Combining RNAscope, Immunohistochemistry (IHC) and ... [https://www.mdpi.com/1467-3045/46/6/310]
- 73. Digital PCR: from early developments to its future application ... [https://pubs.rsc.org/en/content/articlehtml/2025/lc/d5lc00055f]
- 74. dPCR vs. ddPCR: Why Precision Matters in Cell and Gene ... [https://www.roslinct.com/insights/dpcr-vs-ddpcr/]
- 75. Comparative Performance of Digital PCR and Real-Time RT ... [https://pmc.ncbi.nlm.nih.gov/articles/PMC12474457/]
- 76. Digital PCR quantification of ultrahigh ERBB2 copy number ... [https://www.nature.com/articles/s41523-024-00621-x]
- 77. Detection and Quantification of Multiple RNA Sequences ... [https://pmc.ncbi.nlm.nih.gov/articles/PMC7476812/]
- 78. Quantitative Analysis of Gene Expression in RNAscope ... [https://pmc.ncbi.nlm.nih.gov/articles/PMC9901451/]
- 79. Defining HIV and SIV Reservoirs in Lymphoid Tissues - PMC [https://pmc.ncbi.nlm.nih.gov/articles/PMC4943335/]
- 80. The 2024 Art of RNAscope™ Image Contest [https://acdbio.com/data-image-gallery]