Optogenetic Control of Receptor Tyrosine Kinases: A CRY2/CIB1N Fusion Toolkit for High-Precision Cell Signaling Research
This article provides a comprehensive resource for researchers and scientists aiming to implement the CRY2/CIB1N optogenetic system for spatiotemporal control of Receptor Tyrosine Kinase (RTK) signaling pathways.
Optogenetic Control of Receptor Tyrosine Kinases: A CRY2/CIB1N Fusion Toolkit for High-Precision Cell Signaling Research
Abstract
This article provides a comprehensive resource for researchers and scientists aiming to implement the CRY2/CIB1N optogenetic system for spatiotemporal control of Receptor Tyrosine Kinase (RTK) signaling pathways. We cover the foundational principles of blue light-induced CRY2-CIB1 heterodimerization, detailing its biophysical properties and interaction kinetics. The guide presents strategic methodologies for constructing functional RTK-CRY2/CIB1N fusion proteins and their application in diverse cellular models. Critical troubleshooting sections address common challenges including dark-state activity, oligomerization control, and kinetic tuning. Finally, we outline rigorous validation protocols and comparative analyses with alternative dimerization systems, empowering the development of robust, light-controllable RTK platforms for basic research and therapeutic discovery.
The Blue Light Switch: Understanding CRY2-CIB1N Biology for RTK Control
The Arabidopsis thaliana-derived photoreceptor Cryptochrome 2 (CRY2) and its binding partner CIB1 (CRY2-interacting basic-helix-loop-helix 1) constitute a powerful optogenetic tool for controlling intracellular processes with high spatiotemporal precision [1]. This system enables researchers to manipulate diverse signaling pathways and cellular functions in mammalian cells through blue light illumination (430-490 nm), requiring only the ubiquitously expressed flavin chromophore with no need for exogenous cofactors [2]. The core mechanism involves blue light-induced heterodimerization between CRY2 and CIB1, which occurs within subseconds of illumination and dissociates with a half-life of approximately 5.5 minutes after light withdrawal [2]. This reversible interaction has been successfully harnessed to control processes including gene transcription, plasma membrane phosphoinositide metabolism, and Raf/MEK/ERK signaling [2]. However, the system exhibits complexity as photoexcited CRY2 simultaneously undergoes both heterodimerization with CIB1 and homo-oligomerization (self-clustering), characteristics that must be carefully managed for effective experimental design [1] [3].
Molecular Mechanism of CRY2-CIB1 Interaction
Structural Basis for Heterodimerization
The CRY2-CIB1 interaction is governed by distinct molecular interfaces at opposite termini of the CRY2 protein. The N-terminal photolyase homology region (PHR) of CRY2 (amino acids 1-498) contains the flavin-binding pocket and is both necessary and sufficient for light-induced interactions [3]. Critical positively charged residues at the N-terminus (particularly Lys-2, Lys-5, and Lys-6) mediate CRY2-CIB1 heterodimerization [3]. Replacement or deletion of these lysine residues significantly reduces CIB1-binding affinity while preserving homo-oligomerization capability [3].
Simultaneously, CRY2 possesses a separate C-terminal interface that governs its propensity for light-induced homo-oligomerization. Specifically, electrostatic charges at residues 489 and 490 critically influence oligomerization behavior, with positive charges facilitating and negative charges inhibiting cluster formation [3]. This separation of functional interfaces enables engineering of CRY2 variants with tailored interaction properties for specific experimental needs.
CRY2 Oligomerization: Enhancement and Interference
A defining characteristic of the CRY2-CIB1 system is the parallel occurrence of two light-induced phenomena:
- CRY2-CIB1 heterodimerization: The intended specific interaction between CRY2 and CIB1
- CRY2-CRY2 homo-oligomerization: Self-association of CRY2 molecules into clusters [1]
These competing processes significantly impact experimental outcomes. Membrane localization dramatically enhances CRY2 oligomerization compared to its cytoplasmic form [2]. While cytoplasmic CRY2 forms relatively few clusters under blue light illumination, membrane-tethered CRY2 (targeted to plasma membrane, ER membrane, or mitochondrial outer membrane) rapidly forms numerous prominent clusters upon illumination [2].
Table 1: Characteristics of CRY2 Interaction Types
| Interaction Type | Molecular Interface | Key Regulatory Elements | Cellular Localization Effects |
|---|---|---|---|
| CRY2-CIB1 Heterodimerization | N-terminal | Lys-2, Lys-5, Lys-6 residues | Membrane recruitment via CIB1 enhances subsequent oligomerization |
| CRY2-CRY2 Homo-oligomerization | C-terminal | Residues 489-490 electrostatic charges | Membrane-tethered CRY2 oligomerizes more readily than cytoplasmic form |
Figure 1: Molecular Mechanism of Blue Light-Induced CRY2 Activation and Interactions. Upon blue light exposure, CRY2 undergoes conformational changes enabling both heterodimerization with CIB1 via its N-terminal interface and homo-oligomerization via its C-terminal interface.
Engineered CRY2 Variants for Enhanced Control
To address the challenge of concurrent heterodimerization and homo-oligomerization, researchers have developed engineered CRY2 variants with modified oligomerization properties:
- CRY2high: Engineered with enhanced positive charges at the C-terminal to promote robust homo-oligomerization, ideal for applications utilizing CRY2 clustering [3]
- CRY2low: Designed with reduced C-terminal positive charges to suppress oligomerization, improving specificity for CRY2-CIB1 heterodimerization [3]
- CRY2low-tdTom: CRY2low fused with tandem dimeric Tomato, using steric hindrance to further suppress cluster formation [3]
Table 2: Engineered CRY2 Variants and Their Applications
| CRY2 Variant | Oligomerization Property | Key Modification | Recommended Applications |
|---|---|---|---|
| CRY2wt | Moderate (wild-type) | None | General use where both heterodimerization and some oligomerization are acceptable |
| CRY2high | Enhanced | Increased positive charge at C-terminus | Applications requiring robust clustering (e.g., opto-Raf activation) |
| CRY2low | Suppressed | Reduced positive charge at C-terminus | CRY2-CIB1 heterodimerization with minimal interference from oligomerization |
| CRY2low-tdTom | Severely suppressed | CRY2low + tdTomato fusion | High-specificity CRY2-CIB1 applications where oligomerization must be minimized |
Experimental Protocols for CRY2-CIB1 Implementation
Protocol: Light-Induced CRY2 Recruitment to Membrane-Bound CIB1
This protocol demonstrates a fundamental assay for validating and quantifying CRY2-CIB1 interaction by recruiting cytoplasmic CRY2 to the endoplasmic reticulum (ER) membrane [3] [2].
Reagents and Equipment:
- COS-7, HEK293T, or other appropriate mammalian cell lines
- Plasmid constructs: mCherry-CRY2 (or variant) and CIB1-GFP-Sec61 (ER-targeted)
- Transfection reagent (e.g., lipofectamine, polyethylenimine)
- Standard cell culture materials and media
- Blue light illumination system (460-480 nm, 9.7 W/cm²)
- Confocal or epifluorescence microscope with temperature and CO₂ control
- Image analysis software (e.g., ImageJ, Fiji)
Procedure:
- Cell Preparation and Transfection:
- Plate COS-7 cells on glass-bottom dishes at 50-70% confluence
- Co-transfect with mCherry-CRY2 (0.5-1.0 µg) and CIB1-GFP-Sec61 (0.5-1.0 µg) using appropriate transfection reagent
- Culture transfected cells for 24-48 hours to allow protein expression
Microscopy and Light Stimulation:
- Place cells on microscope stage with environmental control (37°C, 5% CO₂)
- Capture baseline images of mCherry-CRY2 and GFP-CIB1-Sec61 localization
- Apply blue light pulses (200 ms duration, 9.7 W/cm² intensity) at 2-second intervals
- Capture time-lapse images after each pulse for 100 seconds total
Data Analysis:
- Quantify CRY2 translocation by measuring fluorescence intensity in cytoplasmic and membrane compartments over time
- Calculate translocation efficiency as the percentage of CRY2 recruited to membrane after first light pulse
- Compare oligomerization dynamics by counting and measuring cluster formation over time
Expected Results:
- CRY2wt should show rapid, near-complete recruitment to ER membrane after first light pulse
- CRY2(Δ2-6) or CRY2(neutral2-6) mutants will exhibit significantly reduced membrane recruitment
- Membrane-recruited CRY2 will form prominent clusters within 100 seconds of illumination
Protocol: Tuning Raf/MEK/ERK Signaling with CRY2 Variants
This application note describes using CRY2 variants to optically control the Raf/MEK/ERK signaling pathway with tunable efficacy [3].
Reagents and Equipment:
- PC12 or other Raf/MEK/ERK-responsive cell lines
- Opto-Raf constructs: CRY2high-, CRY2wt-, or CRY2low-fused to Raf kinase domain
- Phospho-ERK antibodies for immunoblotting or immunofluorescence
- Standard molecular biology and cell culture equipment
- Blue light illumination system
Procedure:
- Cell Preparation and Transfection:
- Plate cells appropriate for differentiation assays (e.g., PC12 cells for neurite outgrowth)
- Transfect with opto-Raf constructs using CRY2high, CRY2wt, or CRY2low variants
- Include negative control (kinase-dead Raf) and positive control (constitutively active Raf)
Light Stimulation and Response Monitoring:
- Apply controlled blue light illumination regimes (varying pulse frequency, duration, or intensity)
- For differentiation assays, maintain illumination over 24-72 hours with appropriate dark controls
- For acute signaling studies, apply brief light pulses and fix cells at various time points
Signal Quantification:
- Process cells for phospho-ERK immunoblotting at multiple time points
- Quantify band intensities and normalize to total ERK
- For morphological studies, quantify neurite outgrowth parameters (length, number per cell, branching)
Expected Results:
- CRY2high-optoRaf should induce strongest ERK phosphorylation and phenotypic responses
- CRY2low-optoRaf should show reduced but more specific signaling activation
- Light intensity and duration should correlate with signaling amplitude across all variants
Figure 2: Experimental Workflow for Optogenetic Raf/MEK/ERK Signaling Control. Different CRY2 variants modulate the strength of pathway activation, enabling tunable control of downstream cellular responses.
The Scientist's Toolkit: Essential Research Reagents
Table 3: Key Research Reagent Solutions for CRY2-CIB1 Experiments
| Reagent / Tool | Function / Application | Key Features / Considerations |
|---|---|---|
| CRY2wt (1-498) | Standard optogenetic actuator | Wild-type photolyase homology region; balanced oligomerization and heterodimerization |
| CIB1 (1-170) | CRY2 binding partner | Truncated version sufficient for interaction; reduced potential non-specific effects |
| CRY2high mutant | Enhanced clustering applications | Elevated homo-oligomerization; ideal for robust activation or sequestration |
| CRY2low / CRY2low-tdTom | High-specificity heterodimerization | Suppressed oligomerization; minimal interference in translocation experiments |
| CIB1-GFP-Sec61 | ER membrane recruitment assay | Sec61 transmembrane domain targets CIB1 to ER; validated recruitment readout |
| CIB1-fusion variants | Custom localization applications | CIB1 fused to various targeting domains (plasma membrane, mitochondrial, etc.) |
| Blue Light Illumination System | Photoactivation | 460-480 nm, controllable pulse duration and intensity; microscope-compatible |
Troubleshooting and Technical Considerations
Optimizing Specificity in CRY2-CIB1 Applications: For applications requiring specific heterodimerization without oligomerization interference:
- Utilize CRY2low or CRY2low-tdTom variants to suppress cluster formation [3]
- Consider using bulky CIB1 fusion partners, which can sterically inhibit CRY2 oligomerization [2]
- For membrane recruitment studies, account for enhanced oligomerization at membrane surfaces [2]
Managing Competing Interactions:
- The presence of certain CIB1 fusion proteins can suppress CRY2 homo-oligomerization [2]
- Cytoplasmic CRY2 recruitment to membranes via CIB1 binding significantly enhances subsequent oligomerization [2]
- Co-existing oligomerization and heterodimerization can be leveraged for multi-level control in complex signaling manipulations [1]
Experimental Design Recommendations:
- Always include appropriate controls: dark controls, light-only controls, and CRY2 mutants with impaired photoactivation (e.g., CRY2(D387A)) [2]
- For quantitative studies, standardize light intensity, duration, and pulse frequency across experiments
- Consider temporal dynamics: CRY2-CIB1 interaction occurs within seconds, while dissociation has a half-life of ~5.5 minutes [2]
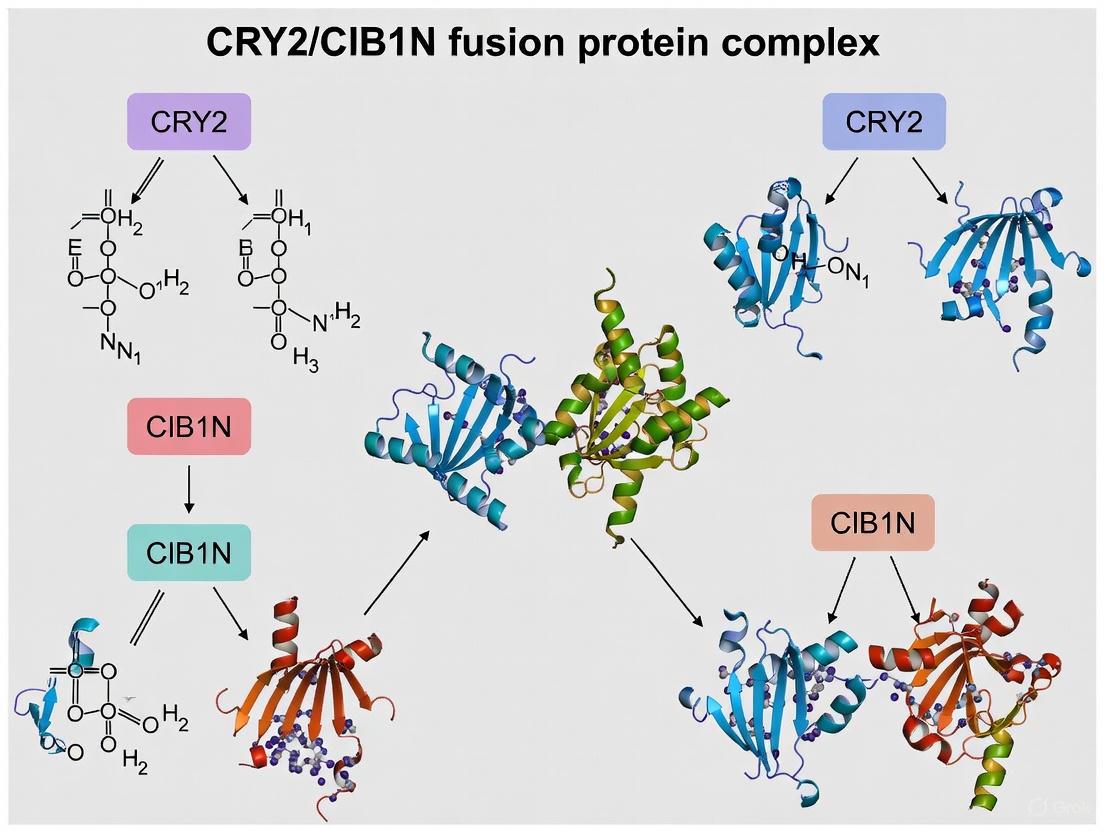
The Arabidopsis thaliana blue light photoreceptor cryptochrome 2 (CRY2) and its interacting partner CIB1 (cryptochrome-interacting basic-helix-loop-helix 1) form a cornerstone of modern optogenetics. Their light-induced hetero-dimerization provides a powerful tool for controlling intracellular processes with high spatiotemporal precision. For the broader research objective of achieving refined control over receptor tyrosine kinase (RTK) signaling, a deep mechanistic understanding of the CRY2-CIB1 complex is essential. The recent determination of its cryo-electron microscopy (cryo-EM) structure marks a transformative advance, moving the field from phenomenological observation toward rational design of optogenetic tools. This Application Note integrates these structural insights with practical protocols, providing a resource for scientists aiming to harness the CRY2-CIB1 system for manipulating cell signaling, developmental biology, and drug discovery pathways.
Cryo-EM Structure of the CRY2-CIB1 Complex
The cryo-EM structure of the Arabidopsis CRY2 tetramer in complex with a CIB1 fragment (PDB ID: 7X0Y) was solved at a resolution of 3.89 Å [4]. This structure provides the first atomic-level view of the photoactive complex, revealing several critical features.
- Overall Architecture and Stoichiometry: The structure reveals a hetero-tetrameric assembly, where four CRY2 molecules interact with two CIB1 fragments [4]. This clarifies the oligomeric state of the light-activated complex and provides a structural basis for understanding how CRY2 can simultaneously engage in both homo- and hetero-interactions.
- Flavin Adenine Dinucleotide (FAD) Cofactor: The structure confirms the presence of the FAD chromophore within the photolyase homology region (PHR) of each CRY2 molecule, which is essential for blue light absorption and photoactivation [4].
- Key Structural Data: The table below summarizes the core parameters of the cryo-EM structure for easy reference.
Table 1: Key Experimental Data for the CRY2-CIB1 Cryo-EM Structure (PDB 7X0Y)
| Parameter | Description |
|---|---|
| PDB ID | 7X0Y [4] |
| EMDB ID | EMD-32929 [4] |
| Resolution | 3.89 Å [4] |
| Experimental Method | Single Particle Cryo-EM [4] |
| Complex Composition | CRY2 tetramer with two CIB1 fragments [4] |
| CRY2 Construct | Full-length (amino acids 1-612) with one mutation [4] |
| CIB1 Construct | Fragment (8 amino acids) [4] |
| Organism | Arabidopsis thaliana [4] |
Delineation of CRY2 Interaction Interfaces
The functional utility of CRY2 in optogenetics stems from its dual capability for CRY2-CIB1 hetero-dimerization and CRY2-CRY2 homo-oligomerization. Prior to the structural data, mechanistic studies identified that these interactions are governed by distinct electrostatic interfaces at opposite ends of the CRY2 protein [3].
The N-terminal Interface for CRY2-CIB1 Hetero-dimerization
The N-terminal region of CRY2 is critically important for its interaction with CIB1. Mutagenesis studies demonstrated that neutralizing or deleting positively charged lysine residues at the solvent-exposed N-terminus (e.g., Lys-2, Lys-5, Lys-6) significantly impairs light-induced binding to CIB1 without affecting CRY2's homo-oligomerization capability [3]. This identifies the positively charged N-terminus as a primary interface for hetero-dimerization.
The C-terminal Interface for CRY2-CRY2 Homo-oligomerization
In contrast, the propensity for light-induced homo-oligomerization is controlled by electrostatic charges at the C-terminus of CRY2, specifically around residues 489 and 490 [3]. The introduction of positive charges at these positions enhances oligomerization, while negative charges suppress it. This principle enabled the rational engineering of CRY2 variants with tailored oligomerization properties, such as the high-oligomerizing CRY2high and the low-oligomerizing CRY2low [3].
The following diagram illustrates how these distinct interfaces mediate signaling in an optogenetic system.
Diagram 1: CRY2-CIB1 optogenetic signaling mechanism. Blue light triggers CRY2 activation, enabling it to bind CIB1 via its N-terminus and self-associate via its C-terminus, leading to downstream pathway activation.
Engineered CRY2 Variants for Enhanced Optogenetic Control
Building on the understanding of separate interaction interfaces, researchers have engineered optimized CRY2 variants for specific applications. These variants are crucial for minimizing unintended cross-talk in sophisticated experiments, such as controlling RTK signaling.
- CRY2high: A mutant with enhanced homo-oligomerization capacity, ideal for applications requiring robust clustering, such as protein sequestration or strong pathway activation [3].
- CRY2low: A mutant with significantly suppressed homo-oligomerization, achieved by engineering negative charges at the C-terminal interface. This variant is fused to a large fluorescent protein (e.g., tdTomato) to provide steric hindrance against unintended oligomer formation, thereby improving the specificity of pure hetero-dimerization with CIB1 [3].
- Constitutively Active Mutants: Deep mutational scanning has identified point mutations (e.g., D393S, D393A, M378R) that lead to constitutive CIB1 interaction and homomer formation in the dark. These map near the FAD chromophore and ATP binding site, providing insight into the photoactivation mechanism [5].
Table 2: Key Research Reagent Solutions for CRY2-CIB1 Optogenetics
| Reagent / Tool | Function / Description | Key Application |
|---|---|---|
| CRY2wt (PHR domain) | Standard photolyase-homology domain of CRY2 (aa 1-498) used as light-actuator. | Baseline hetero-dimerization and homo-oligomerization [3]. |
| CRY2high | Engineered CRY2 variant with enhanced light-induced homo-oligomerization. | Applications requiring robust clustering (e.g., opto-Raf activation) [3]. |
| CRY2low-tdTom | CRY2 variant with suppressed oligomerization, fused to tdTomato for steric hindrance. | Specific CRY2-CIB1 hetero-dimerization with minimal background clustering [3]. |
| CIB1N | N-terminal fragment of CIB1 commonly used in optogenetic constructs. | Partner for CRY2 in light-induced hetero-dimerization systems [6]. |
| OptoNodal2 Receptors | Nodal receptors fused to CRY2/CIB1N, with cytosolic Type II receptor. | High-dynamic-range, low-dark-activity control of Nodal signaling in zebrafish [6]. |
| Constitutive Mutants (e.g., D393S) | CRY2 variants that interact with CIB1 and form homomers in the dark. | Studying photoactivation mechanisms and for applications requiring tonic signaling [5]. |
Application Protocol: Controlling RTK Signaling with an Improved CRY2/CIB1 System
The following protocol details how to implement a cytoplasm-to-membrane recruitment strategy using CRY2-CIB1 to control receptor tyrosine kinase (RTK) signaling with high sensitivity and low background activity, based on successful designs [6] [7].
Experimental Workflow
The overall process, from molecular cloning to functional validation, is summarized in the diagram below.
Diagram 2: Experimental workflow for optogenetic RTK control. Key steps include construct design, delivery to host cells, blue light stimulation, and multi-layered validation.
Detailed Methodologies
Step 1: Molecular Cloning and Construct Design
- CRY2-Fused Kinase Component: Clone the intracellular domain (ICD) of the target RTK (e.g., FGFR, TrkA, TrkB, TrkC) to the N- or C-terminus of the CRY2 PHR domain (or the CRY2low variant for reduced clustering) in a mammalian expression vector [7].
- CIB1N-Fused Membrane Anchor Component: Clone the CIB1N fragment to a plasma membrane-targeting sequence, such as a CAAX box (for prenylation) or the transmembrane domain of a surface protein (e.g., Sec61β) [3] [6]. Using a cytosolic (non-anchored) CIB1N construct can further reduce dark activity by lowering the effective concentration at the membrane before light stimulation [6].
Step 2: Cell Culture and Transfection
- Culture appropriate cell lines (e.g., HEK293T, COS-7, or primary cells) under standard conditions.
- Co-transfect the two constructs (CRY2-RTK-ICD and CIB1N-Membrane-Anchor) using a preferred method (e.g., lipofection, electroporation). A typical DNA mass ratio of 1:1 is a good starting point. For in vivo studies, generate mRNA and microinject into model organisms like zebrafish or Xenopus embryos [6] [7].
Step 3: Blue Light Illumination and Patterned Stimulation
- Light Source: Use a blue LED light source (peak wavelength ~450-490 nm).
- Illumination Parameters: For general activation, use pulses of 200 ms to 1 second at intensities ranging from 5 to 50 μW/mm², delivered at intervals of 2 to 10 seconds [3] [6]. These parameters can be adjusted based on the specific CRY2 variant and desired signaling strength.
- Spatial Patterning: For creating synthetic morphogen gradients, employ a digital micromirror device (DMD) or laser scanning system coupled to an epifluorescence microscope. This allows for the projection of arbitrary light patterns onto the sample with cellular or subcellular resolution [6].
Step 4: Functional Validation and Readout
- Direct Interaction Confirmation: Validate light-induced complex formation using co-immunoprecipitation (Co-IP) with antibodies against the tags of CRY2 and CIB1N constructs.
- Downstream Signaling Analysis:
- Immunofluorescence: Fix cells/embryos and stain for phosphorylated signaling components (e.g., pSmad2 for Nodal/TGF-β pathways, pERK for Raf/MEK/ERK pathway) [3] [6].
- Gene Expression Analysis: Perform quantitative PCR (qPCR) to measure the induction of immediate early genes or specific pathway targets (e.g., gsc, sox32 for Nodal signaling) [6].
- Phenotypic Tracking: In developing embryos, monitor cell internalization movements, germ layer specification, and overall morphology in response to patterned light illumination [6].
The elucidation of the CRY2-CIB1 complex structure by cryo-EM, combined with a detailed understanding of its distinct N- and C-terminal interaction interfaces, has ushered in a new era of precision in optogenetics. This structural knowledge empowers researchers to move beyond simple tool application and into the realm of rational engineering, as evidenced by the creation of specialized CRY2high and CRY2low variants. The provided protocols and reagent toolkit offer a clear roadmap for implementing this system to achieve high-fidelity, spatiotemporal control over RTK signaling and other critical intracellular pathways. By leveraging these insights and methodologies, scientists in drug development and basic research can design more sophisticated experiments to deconvolve complex signaling networks and probe the dynamics of embryonic development with unprecedented accuracy.
The CRY2-CIB1 optogenetic pair, derived from Arabidopsis thaliana, enables precise blue light-controlled heterodimerization for manipulating intracellular processes [8] [3]. This system's core feature is rapid, reversible interaction—CRY2 binds CIB1 upon 450 nm blue light exposure, dissociating in darkness [9]. Quantitative characterization of association/dissociation kinetics and reversibility is essential for applications like controlling receptor tyrosine kinase (RTK) signaling [10]. This Application Note details protocols for quantifying CRY2-CIB1 interaction kinetics using single-molecule tools and engineered variants, providing a framework for optimizing optogenetic RTK control.
Quantitative Kinetic Profiling of CRY2-CIB1 Interactions
Single-Molecule Analysis in Cell-Free Extracts
Fluorescence Correlation Spectroscopy (FCS) quantifies real-time interaction kinetics by measuring diffusion coefficient changes. When CRY2 binds CIB1, the complex's hydrodynamic radius increases, slowing diffusion [8].
Key Kinetic Parameters from FCS [8] [11]:
- Detection Window: 300 seconds of continuous 467 nm laser exposure
- Association Efficiency: CIB1 exhibits superior coupling efficiency with CRY2 versus truncated CIBN
- Structural Impact: CIB1's intact protein structure and lower diffusion rate enhance CRY2 binding
Table 1: Summary of Quantitative Kinetic Parameters for CRY2-CIB1/N Interactions
| Protein Pair | Method | Excitation Wavelength | Key Kinetic Finding | Reference |
|---|---|---|---|---|
| CRY2-CIB1 | FCS | 467 nm | Better coupling efficiency vs. CIBN; lower diffusion rate | [8] |
| CRY2-CIBN | FCS | 467 nm | Reduced coupling efficiency vs. CIB1 within 300s detection | [8] |
| CRY2-CIB1 | FRET (Live Cell) | 467 nm | Validated blue-light induced co-localization | [8] |
Structural and Mutational Analysis of Interaction Kinetics
CRY2-CIB1 interaction involves distinct protein interfaces at CRY2 termini [3] [12]. N-terminal positive charges (Lys-2, Lys-5, Lys-6) are critical for CRY2-CIB1 heterodimerization, while C-terminal residues 489-490 govern CRY2-CRY2 homo-oligomerization [3].
Table 2: Engineered CRY2 Variants with Modified Oligomerization Kinetics
| CRY2 Variant | Key Mutation/Feature | Effect on Homo-oligomerization | Primary Application |
|---|---|---|---|
| CRY2high | Engineered C-terminal positive charges | Enhanced/robust oligomerization | Opto-Raf activation [3] |
| CRY2low | Engineered C-terminal negative charges | Suppressed oligomerization | Specific CRY2-CIB1 heterodimerization [3] |
| CRY2low-tdTom | Fused to tandem dimeric Tomato | Steric hindrance further suppresses oligomerization | Specific CRY2-CIB1 heterodimerization [3] |
Experimental Protocols for Kinetic Characterization
Protocol: FCS for In Vitro Association Kinetics
Objective: Quantify real-time association rates of CRY2 and CIB1/N in cell-free extracts [8].
Materials:
- Purified CRY2-mCherry, CIB1-GFP, and CIBN-GFP proteins
- M-PER Mammalian Protein Extraction Reagent
- Coomassie Plus (Bradford) Assay Kit
- FCS setup with 467 nm picosecond pulsed laser
Procedure:
- Protein Extraction and Purification:
- Transfert HeLa cells with plasmids encoding CRY2-mCherry, CIB1-GFP, or CIBN-GFP.
- Incubate for 24 hours, then digest with M-PER reagent.
- Precipitate membrane-bound CIB1/N using acetone.
- Determine protein concentration via Bradford assay.
FCS Measurement:
- Place purified protein samples on microscope stage.
- Focus 467 nm laser using high NA water immersion objective.
- Record continuous fluorescence fluctuation traces of GFP for 300 seconds.
- Fit autocorrelation curves using two-component 3D diffusion model (Equation 1).
Data Analysis:
- Calculate diffusion coefficients: ( D = \frac{w0^2}{4\tauD} )
- Determine fraction of bound molecules from fitted parameters.
Protocol: Live-Cell FRET Validation
Objective: Validate spatial interaction and energy transfer between CRY2 and CIB1 in live cells [8].
Materials:
- Plasmids: CRY2-mCherry, CIB1-GFP, CIBN-GFP
- Lipofectamine LTX transfection reagent
- Low serum DMEM/F-12 medium
- Confocal microscope with time-resolved fluorescence detection
Procedure:
- Cell Preparation and Transfection:
- Culture HeLa cells to 70% confluence.
- Transfect with Lipofectamine LTX per manufacturer instructions.
- Incubate for 24 hours in 5% CO₂ at 37°C.
FRET Imaging:
- Excite GFP with 467 nm pulsed laser.
- Collect emission between 500-540 nm.
- Record fluorescence lifetime images using time-tagged time-resolved module.
- Calculate fluorescence lifetime (τ) by fitting decay curve: ( F(t) = F_0 e^{-t/\tau} )
FRET Efficiency Calculation:
- Determine FRET efficiency: ( E{FRET} = 1 - \frac{\tau{DA}}{\tau_D} )
- Where ( \tau{DA} ) is donor lifetime with acceptor, ( \tauD ) is donor lifetime alone.
The Scientist's Toolkit: Research Reagent Solutions
Table 3: Essential Reagents for CRY2-CIB1 Kinetic Studies
| Reagent / Material | Function / Application | Example / Source |
|---|---|---|
| CRY2-mCherry Plasmid | Expresses CRY2 fused to mCherry fluorescent tag | Addgene #26866 [8] |
| CIB1-GFP Plasmid | Expresses full-length CIB1 fused to GFP | Addgene #28240 [8] |
| CIBN-GFP Plasmid | Expresses N-terminal fragment of CIB1 (1-170 aa) fused to GFP | Addgene #26867 [8] |
| Lipofectamine LTX | Transfection of mammalian cells | Life Technologies [8] |
| M-PER Reagent | Mammalian protein extraction from cultured cells | Pierce [8] |
| FCS Setup | Single-molecule detection and diffusion coefficient measurement | Custom or commercial systems [8] |
Signaling Pathway and Experimental Workflow
Quantitative assessment of CRY2-CIB1 kinetics reveals this system is highly suitable for controlling RTK signaling. FCS provides precise association rates, while FRET confirms intracellular interactions [8]. Engineered CRY2 variants (CRY2high, CRY2low) enable customized oligomerization properties for specific applications [3]. These protocols and quantitative profiles establish a foundation for implementing CRY2-CIB1 in receptor tyrosine kinase control research with defined kinetic parameters.
The Arabidopsis thaliana photoreceptor Cryptochrome 2 (CRY2) exhibits a complex dual nature upon blue light activation, simultaneously undergoing heterodimerization with its binding partner CIB1 (CRY-interacting basic-helix-loop-helix 1) and homo-oligomerization with other CRY2 molecules. This dual functionality has made the CRY2-CIB1 system an extraordinarily powerful optogenetic tool for controlling intracellular processes with high spatiotemporal precision, including receptor tyrosine kinase signaling pathways. However, this very duality presents a significant challenge for researchers: applications designed to exploit CRY2-CIB1 heterodimerization can be complicated by unintended CRY2 homo-oligomerization, which may lead to experimental artifacts or reduced specificity [2] [3].
Understanding and managing the balance between these two interaction modes is particularly crucial for research focusing on receptor tyrosine kinase (RTK) control. Optogenetic manipulation of RTK signaling requires precise, controlled dimerization to faithfully mimic natural activation mechanisms without inducing aberrant cluster formation that could alter signaling outcomes. This Application Note provides detailed protocols and analytical frameworks to help researchers distinguish, quantify, and control these competing interaction paradigms, enabling more precise optogenetic interventions in signaling research [3].
Molecular Mechanisms and Structural Insights
Distinct Interaction Interfaces
The CRY2 photolyase homology region (PHR) domain contains separate structural determinants for its dual interaction capabilities. Heterodimerization with CIB1 primarily involves the N-terminal region of CRY2, where positively charged residues (Lys-2, Lys-5, and Lys-6) are critical for binding efficiency. Mutation or deletion of these residues (CRY2(neutral2-6) or CRY2(Δ2-6)) significantly reduces CIB1-binding affinity while preserving homo-oligomerization capability [3].
In contrast, CRY2 homo-oligomerization is governed by C-terminal residues, particularly the electrostatic properties of positions 489 and 490. Positive charges at these positions facilitate robust oligomerization, while negative charges inhibit it [3]. This understanding has enabled the engineering of specialized CRY2 variants:
Table: Engineered CRY2 Variants with Modified Oligomerization Properties
| Variant | Modification | Oligomerization Phenotype | Primary Application |
|---|---|---|---|
| CRY2wt | Wild-type | Balanced oligomerization and heterodimerization | General purpose |
| CRY2high | E490G | Enhanced oligomerization | Applications requiring robust clustering |
| CRY2low | Modified C-terminal charges | Suppressed oligomerization | CRY2-CIB1 heterodimerization with minimal interference |
| CRY2low-tdTom | CRY2low fused to tdTomato | Sterically hindered oligomerization | High-specificity heterodimerization applications |
Structural studies of constitutively active AtCRY2W374A complexed with CIB1 fragments (CIB1NT275) reveal that CIB1 binds at the INT2 (interface 2) regions in a side-by-side manner to the CRY2 tetramer. Key CRY2 structural elements involved in CIB1 binding include the α4 helix, β5-α5 loop, and L11 loop, with residues His113, Trp138, Tyr141, and Phe302 playing particularly important roles [13]. The CIB1 interaction region has been mapped to residues 18-27, which form an α-helical structure essential for CRY2 binding [13].
Spatial Regulation of CRY2 Behaviors
The cellular compartment in which CRY2 is localized significantly impacts its oligomerization behavior. Membrane-bound CRY2 exhibits dramatically enhanced oligomerization compared to its cytoplasmic counterpart. When targeted to various cellular membranes (plasma membrane, endoplasmic reticulum, or mitochondrial outer membrane), CRY2 forms prominent clusters within seconds of blue light exposure, while cytoplasmic CRY2 shows relatively weak and inconsistent oligomerization under similar conditions [2].
This spatial regulation creates important experimental considerations:
- Membrane recruitment of cytoplasmic CRY2 via interaction with membrane-tethered CIB1 can significantly intensify its oligomerization
- The presence of certain bulky CIB1 fusion proteins can suppress CRY2 cluster formation
- The dynamic equilibrium between homo-oligomerization and heterodimerization can be influenced by subcellular localization [2]
Figure 1: CRY2 Dual Signaling Pathways. Blue light activation triggers both homo-oligomerization and heterodimerization through distinct molecular interfaces.
Quantitative Analysis of CRY2 Interactions
Binding Kinetics and Affinity Measurements
Quantitative characterization of CRY2 interactions is essential for experimental design and interpretation. Bio-layer interferometry studies determined the dissociation constant (Kd) between constitutively active AtCRY2W374A and CIB1NT275 to be approximately 3.90 × 10⁻⁷ M, whereas no significant binding was detected between wild-type AtCRY2 and CIB1NT275 under the same conditions [13].
The temporal kinetics of these interactions show distinct patterns:
- CRY2-CIB1 heterodimerization occurs rapidly within subseconds after blue light illumination
- Dissociation after light withdrawal occurs with a half-life of approximately 5.5 minutes
- CRY2 homo-oligomerization exhibits varied kinetics depending on cellular context, with membrane-bound CRY2 forming clusters within seconds of illumination [2] [14]
Table: Quantitative Parameters of CRY2 Interactions
| Interaction Type | Association Kinetics | Dissociation Kinetics | Dissociation Constant (Kd) | Key Regulatory Factors |
|---|---|---|---|---|
| CRY2-CIB1 Heterodimerization | <1 second (after illumination) | t₁/₂ ≈ 5.5 minutes | 3.90 × 10⁻⁷ M (for CRY2W374A) | N-terminal charges, blue light intensity |
| CRY2-CRY2 Homo-oligomerization | Seconds to minutes (context-dependent) | Minutes to hours | Not quantitatively determined | C-terminal charges, subcellular localization, oligomerization-enhancing mutations |
| CRY2high-CIB1 Heterodimerization | Similar to wild-type | Similar to wild-type | Not determined | Preserved N-terminal interface |
| CRY2low-CIB1 Heterodimerization | Similar to wild-type | Similar to wild-type | Not determined | Preserved N-terminal interface |
Modulation by Protein Engineering
Strategic engineering of CRY2 has yielded variants with optimized interaction properties for specific applications. The development of CRY2high (enhanced oligomerization) and CRY2low (suppressed oligomerization) variants through manipulation of C-terminal charges provides researchers with tools to bias the system toward desired interactions [3].
Further suppression of unwanted oligomerization can be achieved by fusing CRY2 to large fluorescent proteins such as tandem dimeric Tomato (tdTomato), which sterically hinders cluster formation without significantly impacting heterodimerization capability. These engineered variants enable:
- Enhanced specificity for CRY2-CIB1 applications by reducing competing homo-oligomerization
- Robust clustering for applications requiring phase separation or high-local concentration effects
- Tunable signaling output in pathway control applications [3]
Experimental Protocols
Protocol 1: Differentiating Homo-oligomerization vs. Heterodimerization in Live Cells
Purpose: To quantitatively distinguish between CRY2 homo-oligomerization and CRY2-CIB1 heterodimerization in mammalian cells.
Reagents and Equipment:
- Plasmids: CRY2-GFP/CRY2-mCherry, CIB1-GFP/CIB1-mCherry
- Appropriate cell line (COS-7, HEK293T, or HeLa)
- Confocal microscope with 458/488 nm laser capability
- Temperature-controlled stage with CO₂ incubation system
Procedure:
- Cell Culture and Transfection:
- Plate cells on 35 mm glass-bottom dishes 24 hours before transfection
- Transfect with appropriate plasmid combinations:
- Condition A: CRY2-GFP alone (homo-oligomerization control)
- Condition B: CRY2-mCherry + CIB1-GFP (heterodimerization test)
- Condition C: CRY2(neutral2-6)-mCherry + CIB1-GFP (N-terminal mutant control)
- Condition D: CRY2high-mCherry + CIB1-GFP (enhanced oligomerization control)
Microscopy and Light Activation:
- 24-48 hours post-transfection, image cells using low-intensity 488 nm excitation to establish baseline distribution
- Apply blue light stimulation (460-480 nm, 9.7 × 10³ mW/cm²) using 200 ms pulses every 5 seconds for 5-10 minutes
- Capture time-lapse images every 30 seconds during stimulation
Quantitative Analysis:
- For heterodimerization assays: Quantify co-localization coefficients between CRY2 and CIB1 channels
- For homo-oligomerization: Count and measure cluster size formation over time
- Calculate recruitment half-times and cluster growth rates
Troubleshooting:
- High background oligomerization: Reduce expression levels or use CRY2low variants
- Poor heterodimerization: Verify N-terminal integrity of CRY2 and use full-length CIB1 if necessary
- Rapid photobleaching: Reduce light intensity and increase camera binning [2] [3]
Protocol 2: Membrane Recruitment Assay for Interaction Specificity
Purpose: To assess the specificity of CRY2-CIB1 heterodimerization while minimizing interference from homo-oligomerization.
Reagents and Equipment:
- Plasmids: CRY2-GFP, CIBN-GFP-Sec61 (ER membrane anchor), CIBN-GFP-CaaX (plasma membrane anchor)
- Total internal reflection fluorescence (TIRF) microscope or confocal microscope
- Serum-free imaging medium
Procedure:
- Cell Preparation:
- Co-transfect COS-7 cells with CRY2-mCherry and either CIBN-GFP-Sec61 (ER target) or CIBN-GFP-CaaX (plasma membrane target)
- Include controls with oligomerization-deficient CRY2low-mCherry
Light Activation and Imaging:
- Use TIRF microscopy for plasma membrane assays or confocal microscopy for ER assays
- Apply single 100 ms pulse of blue light and capture images at 1-second intervals for 60 seconds
- Monitor redistribution of CRY2 from cytosol to target membranes
Quantification:
- Measure fluorescence intensity at membrane versus cytosol over time
- Calculate translocation half-time and maximum membrane recruitment
- Compare recruitment kinetics between CRY2wt and CRY2low
Expected Results:
- CRY2wt should show rapid recruitment to membranes but may form clusters over time
- CRY2low should show similarly rapid recruitment but minimal cluster formation
- Mutants with impaired N-terminal charges show reduced recruitment efficiency [3] [14]
Figure 2: Experimental Workflow. Step-by-step protocol for analyzing CRY2 interactions.
Application to Receptor Tyrosine Kinase Control Research
Optogenetic Control of RTK Signaling Pathways
The CRY2-CIB1 system has been successfully adapted for optical control of receptor tyrosine kinase signaling, particularly through the development of optogenetic Raf (optoRaf) systems that allow precise spatial and temporal activation of the Raf/MEK/ERK cascade [3]. By fusing CRY2 to Raf signaling domains and CIB1 to membrane localization sequences, researchers can achieve light-inducible recruitment of Raf to the membrane, initiating downstream signaling without ligand stimulation.
The dual nature of CRY2 interactions must be carefully managed in these applications:
- Designed heterodimerization: CRY2-fused signaling domains recruited to membrane-tethered CIB1
- Potential interference: Unintended CRY2 homo-oligomerization may cause aberrant clustering of signaling components
- Optimization strategies: Use of CRY2low variants improves signaling specificity by reducing cluster formation [3]
Experimental Optimization for RTK Studies
For RTK control applications, the following parameters should be optimized:
Expression Levels:
- Maintain low to moderate expression of CRY2-fused constructs to minimize background oligomerization
- Balance relative expression of CRY2 and CIB1 fusion partners
Variant Selection:
- Use CRY2low variants when precise dimerization without clustering is desired
- Consider CRY2high for applications requiring signal amplification through clustering
Illumination Parameters:
Research Reagent Solutions
Table: Essential Reagents for CRY2-CIB1 Research
| Reagent | Type/Function | Key Features | Application Examples |
|---|---|---|---|
| CRY2(PHR)-GFP/mCherry | Photoreceptor core domain | Amino acids 1-498, binds FAD chromophore | General optogenetic recruitment |
| CIBN (CIB1N)-GFP | N-terminal fragment of CIB1 | Amino acids 1-170, minimized dark activity | Membrane recruitment assays |
| CRY2high (E490G) | Oligomerization-enhanced mutant | Increased cluster formation | Applications requiring robust clustering |
| CRY2low | Oligomerization-suppressed mutant | Reduced background oligomerization | High-specificity heterodimerization |
| CRY2low-tdTom | Sterically hindered variant | tdTomato fusion prevents clustering | Critical heterodimerization applications |
| CIB1-GFP-Sec61 | ER membrane anchor | Targets CIB1 to endoplasmic reticulum | Subcellular recruitment studies |
| CIB1-GFP-CaaX | Plasma membrane anchor | Farnesylation motif for membrane targeting | RTK signaling studies |
The dual nature of CRY2—capable of both heterodimerization with CIB1 and homo-oligomerization—presents both opportunities and challenges for optogenetic control of intracellular signaling. Through understanding of the distinct structural determinants governing these interactions, careful experimental design, and strategic use of engineered CRY2 variants, researchers can effectively manage this duality to achieve precise control over receptor tyrosine kinase signaling and other cellular processes. The protocols and analytical frameworks provided here enable systematic characterization and optimization of CRY2-based optogenetic systems for enhanced experimental specificity and reliability.
The field of optogenetics has revolutionized biological control by enabling precise, light-mediated manipulation of cellular processes. This paradigm finds its roots in nature's own solutions, particularly in plant photoreception systems that have evolved to sense and respond to light with high specificity. Among these, the Arabidopsis thaliana cryptochrome 2 (CRY2) photolyase homology region and its interaction partner CIB1 (Cryptochrome-Interacting bHLH1) represent a foundational biological precedent for engineered control systems [3] [15]. This photoreceptor complex responds to blue light (peak activation ~450 nm) through its flavin adenine dinucleotide (FAD) chromophore, initiating heterodimerization within seconds and reverting to ground state in minutes in darkness [9]. The intrinsic properties of this system—genetic encodability, reversibility, and subcellular precision—have established CRY2/CIB1 as a cornerstone technology for controlling intracellular signaling [15].
This application note contextualizes the CRY2/CIB1 system within the broader framework of receptor tyrosine kinase (RTK) control research. We detail how natural plant photoreception mechanisms have been systematically engineered to create versatile optogenetic tools, with specific focus on experimental protocols for implementing these systems in mammalian cell research and drug discovery applications.
Natural Precedent and Engineering Optimization
CRY2/CIB1 Mechanism and Optimization Strategies
The natural CRY2-CIB1 interaction represents a sophisticated light-sensing mechanism that has been optimized through protein engineering for enhanced research utility. In its native context, Arabidopsis CRY2 mediates various blue-light-regulated processes including floral initiation and photoperiod control [16]. The molecular mechanism involves light-induced conformational changes in the CRY2 photolyase homology region (amino acids 1-498), enabling interaction with the N-terminal domain of CIB1 (CIB1N, amino acids 1-170) [17].
Key engineering challenges for research applications include minimizing dark activity and optimizing kinetic parameters. Research has revealed that CRY2 interactions are governed by distinct protein interfaces at N- and C-termini, enabling targeted optimization [3]:
- N-terminal charges (particularly lysine residues at positions 2, 5, and 6) are critical for CRY2-CIB1 heterodimerization
- C-terminal charges at residues 489 and 490 dramatically affect CRY2 homo-oligomerization, with positive charges facilitating and negative charges inhibiting oligomerization
Table 1: Engineered CRY2 Variants for Specific Application Needs
| Variant | Key Mutations/Features | Oligomerization Propensity | Primary Research Applications |
|---|---|---|---|
| CRY2(wild-type) | Native Arabidopsis sequence | Moderate | General purpose applications |
| CRY2high | Engineered C-terminal charges | Elevated | Applications requiring robust clustering |
| CRY2low | Engineered C-terminal charges + tdTomato fusion | Suppressed | CRY2-CIB1 applications requiring minimal homo-oligomerization interference |
Quantitative Performance Parameters
Systematic characterization of the CRY2/CIB1 system has established key performance parameters essential for experimental design. The heterodimerization exhibits rapid association kinetics following blue light activation, with recruitment reaching 90% completion within approximately 85 seconds in bacterial systems [17]. The system demonstrates reversible binding with relaxation time constants of approximately 10 minutes when returned to darkness [17].
Table 2: CRY2/CIB1 System Performance Characteristics
| Parameter | Performance Value | Experimental Context | Citation |
|---|---|---|---|
| Activation Wavelength | 450 nm (blue light) | Multiple expression systems | [9] |
| Reversion Mechanism | Dark reversion | No inverse wavelength required | [9] |
| Association Time | Seconds | Pulses of 200 ms, 9.7 W/cm² | [3] |
| 90% Recruitment | ~85 seconds | E. coli expression system | [17] |
| Dissociation Time | Minutes | Varies by system and expression level | [9] |
| Relaxation Time Constant | ~10 minutes | After blue light removal in E. coli | [17] |
Application to Receptor Tyrosine Kinase Control: The optoNodal2 System
The CRY2/CIB1 paradigm has been successfully extended to control receptor tyrosine kinase signaling, as exemplified by the optoNodal2 system for precise manipulation of developmental morphogen patterns [18]. This system represents a sophisticated engineering application where Nodal receptors (type I and type II) were fused to the light-sensitive heterodimerizing pair Cry2/CIB1N, achieving optical control over mesendodermal patterning in zebrafish embryos [18].
The optoNodal2 system demonstrates several critical advances in RTK control:
- Elimination of dark activity while maintaining dynamic range
- Improved response kinetics without sacrificing signaling amplitude
- Precise spatial control over signaling activity and downstream gene expression
- Rescue of developmental defects in Nodal signaling mutants through patterned illumination
This implementation establishes a generalizable framework for applying CRY2/CIB1 to RTK systems, demonstrating how light-sensitive dimerization can be harnessed to control receptor proximity and activation with spatiotemporal precision unavailable through pharmacological approaches.
Diagram 1: CRY2/CIB1 Optogenetic Control of RTK Signaling
Experimental Protocols and Workflows
Implementation Workflow for CRY2/CIB1-Mediated RTK Control
The following workflow outlines a generalized protocol for implementing CRY2/CIB1-mediated control of receptor tyrosine kinase signaling in mammalian cells, based on established methodologies from multiple research applications [18] [3] [17].
Diagram 2: Experimental Workflow for RTK Optogenetic Control
Detailed Protocol: CRY2/CIB1 RTK Control in Mammalian Cells
Materials Required:
- CRY2 and CIB1N plasmid constructs (available from Addgene [19])
- Customized RTK components for fusion
- Mammalian cell line appropriate for RTK signaling studies
- Blue light delivery system (LED array or laser with 450 nm filter)
- Live-cell imaging setup for real-time monitoring
Step-by-Step Procedure:
Molecular Engineering (Days 1-3):
- Fuse CRY2 (amino acids 1-498) to the intracellular domain of your target RTK using flexible linkers (e.g., GSAGSAAGSGEF)
- Fuse CIB1N (amino acids 1-170) to complementary signaling domains or membrane targeting sequences
- Clone constructs into mammalian expression vectors with appropriate selection markers
Cell Culture and Transfection (Days 4-6):
- Culture HEK293T or other appropriate mammalian cells in complete DMEM with 10% FBS
- Transfect cells using polyethylenimine (PEI) or similar transfection reagent at 60-70% confluence
- For initial optimization, use a range of DNA ratios (CRY2:CIB1N from 1:1 to 1:3) to minimize dark activity while maintaining light response
Expression Validation (Day 7):
- Confirm protein expression via Western blotting 24-48 hours post-transfection
- Validate subcellular localization using fluorescence microscopy if constructs include fluorescent tags
- Assess baseline (dark) signaling activity compared to untransfected controls
Light Stimulation and Data Collection (Day 8):
- Deliver blue light stimulation (450 nm) using calibrated LED array
- For precise temporal control, use pulse protocols (e.g., 200 ms pulses at 2-second intervals) [3]
- For spatial patterning, employ digital micromirror devices or laser scanning systems
- Monitor immediate downstream signaling (e.g., phosphorylation events) via Western blot or FRET biosensors
- Track longer-term cellular responses (gene expression, morphological changes) over subsequent hours
Controls and Validation:
- Include dark controls (identical samples protected from light)
- Utilize CRY2 mutants with reduced CIB1 binding affinity as negative controls [3]
- Validate RTK-specific downstream signaling through pharmacological inhibition
The Scientist's Toolkit: Essential Research Reagents
Table 3: Essential Research Reagents for CRY2/CIB1 Optogenetic Applications
| Reagent/Category | Example Specifications | Function/Application | Source/Reference |
|---|---|---|---|
| CRY2 Plasmids | CRY2(1-498), CRY2high, CRY2low | Light-sensitive component for fusion constructs | Addgene [19] |
| CIB1N Plasmids | CIB1(1-170) | Binding partner for CRY2 heterodimerization | Addgene [19] |
| Blue Light Source | 450 nm LED array, laser systems | Precise activation of CRY2/CIB1 interaction | Custom/commercial systems |
| Live-Cell Imaging | Environmental control, time-lapse capability | Real-time monitoring of optogenetic responses | Major microscope manufacturers |
| Expression Vectors | Inducible promoters, selection markers | Controlled expression of optogenetic components | Commercial suppliers |
| Validation Antibodies | Anti-GFP, anti-FLAG, phospho-specific | Detection of fusion proteins and downstream signaling | Multiple commercial sources |
The CRY2/CIB1 system exemplifies how natural plant photoreception mechanisms provide the fundamental blueprint for sophisticated research tools. The quantitative parameters, experimental protocols, and reagent specifications outlined in this application note provide a roadmap for implementing this technology in receptor tyrosine kinase control research. As optogenetic applications expand in drug discovery and basic research, the principles established by CRY2/CIB1—including precise spatiotemporal control, reversibility, and genetic encodability—will continue to enable new approaches for interrogating and manipulating cellular signaling with unprecedented precision. Future developments will likely focus on further reducing dark activity, expanding the color palette for multiplexed control, and enhancing tissue penetration through red-shifted variants.
Building Your Opto-RTK: Fusion Strategies and Experimental Implementation
N-terminal vs. C-terminal Tagging Best Practices for CRY2 and CIB1N
The Arabidopsis thaliana cryptochrome 2 (CRY2) and its interacting partner CIB1 constitute a powerful optogenetic toolset that enables precise spatial and temporal control of intracellular signaling processes. When implemented in fusion protein designs, this system allows researchers to manipulate biological functions with light, particularly in the context of controlling receptor tyrosine kinase activity [20]. The CRY2-CIB1 system is uniquely versatile because CRY2 undergoes both light-induced hetero-dimerization with CIB1 and homo-oligomerization upon blue light exposure (450 nm) [3]. This dual functionality presents both opportunities and challenges for fusion protein engineering. The fundamental mechanism involves blue light-induced conformational changes in CRY2 that expose protein interaction interfaces, enabling rapid association with CIB1 within seconds of stimulation [3]. This rapid kinetics, combined with minimal background activity in dark conditions, makes the system particularly valuable for controlling receptor tyrosine kinase signaling pathways in live cells and developing organisms [18] [20].
Table: Core Properties of CRY2-CIB1 System Components
| Component | Size | Function | Light Response | Key Structural Features |
|---|---|---|---|---|
| CRY2 (PHR domain) | ~498 amino acids | Photosensory actuator; binds CIB1 and undergoes oligomerization | Blue light (450 nm) | N-terminal photolyase homology region (PHR) that binds flavin adenine dinucleotide |
| CIB1 | ~ | CRY2 interaction partner; recruits fused effectors | Blue light (450 nm) | Basic-helix-loop-helix domain; interacts with CRY2 N-terminus |
| CRY2high | ~ | Engineered variant with enhanced oligomerization | Blue light (450 nm) | Modified C-terminal charges (positive) to facilitate oligomerization |
| CRY2low | ~ | Engineered variant with suppressed oligomerization | Blue light (450 nm) | Modified C-terminal charges (negative) to inhibit oligomerization |
Molecular Mechanisms Governing CRY2 Interactions
Understanding the structural determinants of CRY2 interactions is essential for rational fusion protein design. Research has revealed that CRY2-CIB1 hetero-dimerization and CRY2-CRY2 homo-oligomerization are governed by distinct molecular interfaces [3]. The N-terminal region of CRY2, particularly residues 2-6 containing three lysine residues (Lys-2, Lys-5, and Lys-6), is critical for CIB1 binding. Neutralizing or deleting these residues significantly reduces CRY2's affinity for CIB1 without affecting its oligomerization capability [3]. Conversely, electrostatic charges at C-terminal residues 489 and 490 dramatically affect CRY2 homo-oligomerization propensity, with positive charges facilitating and negative charges inhibiting oligomer formation [3]. This mechanistic understanding enables strategic engineering of CRY2 fusion proteins to emphasize desired interaction modes while minimizing collateral oligomerization in applications primarily requiring hetero-dimerization.
The modular nature of these interaction interfaces means that fusion orientation significantly impacts system performance. N-terminal fusions to CRY2 may potentially interfere with CIB1 binding if they disrupt the critical lysine residues, while C-terminal fusions might modulate oligomerization tendencies depending on the electrostatic properties of the fused partner [3]. Similarly, CIB1N (the N-terminal fragment of CIB1 commonly used in optogenetic applications) presents its own structural constraints for fusion design. These molecular insights provide a foundation for developing optimized fusion configurations for specific experimental needs.
Terminal Orientation Strategies and Performance
N-terminal vs. C-terminal Fusion Considerations
The decision to place a protein of interest at the N- or C-terminus of CRY2 or CIB1 represents a critical design choice with significant functional implications. For CRY2 fusion constructs, C-terminal positioning of the protein of interest is generally preferred when the primary goal is light-induced recruitment via CRY2-CIB1 hetero-dimerization [3]. This orientation preserves the vital N-terminal lysine residues necessary for CIB1 interaction while allowing the fused protein to extend freely from the C-terminus. However, this configuration may still permit CRY2 oligomerization, which could be desirable or problematic depending on the application.
For applications requiring specific control over oligomerization, engineered CRY2 variants CRY2high (with enhanced oligomerization) and CRY2low (with suppressed oligomerization) provide refined tools [3]. The CRY2low variant is particularly valuable for CRY2-CIB1 applications where unintended homo-interaction complicates experimental outcomes. When using CRY2low, further suppression of oligomerization can be achieved by fusing a large fluorescent protein such as tandem dimeric Tomato (tdTom) to the C-terminus, which sterically hinders oligomer formation [3].
Table: Terminal Orientation Guidelines for CRY2/CIB1 Fusion Designs
| Fusion Configuration | Recommended Orientation | Advantages | Considerations | Ideal Applications |
|---|---|---|---|---|
| CRY2-Protein of Interest | C-terminal fusion | Preserves N-terminal CIB1 binding interface; maintains light sensitivity | Potential for oligomerization; may require CRY2low variant for pure hetero-dimerization | Membrane recruitment; pathway activation |
| CIB1-Protein of Interest | N-terminal fusion | Optimal presentation for recruiting CRY2-fused partners | May require linker optimization; structural constraints unknown | Scaffold assembly; target recruitment |
| CRY2-Fluorescent Protein | C-terminal fusion | Minimal interference with photocycle; enables localization tracking | Large tag may affect kinetic properties; consider tdTom for steric hindrance | Live-cell imaging; localization studies |
| CRY2-Signaling Domain | C-terminal fusion | Direct control of effector activity; rapid light activation | Basal activity must be monitored; may require membrane targeting | Kinase activation; signaling pathway control |
Quantitative Performance Metrics
Recent optimization of CRY2-CIB1 systems for controlling Nodal signaling in zebrafish embryos demonstrates the performance achievable with properly engineered fusions. The improved optoNodal2 reagents eliminated dark activity and improved response kinetics without sacrificing dynamic range [18]. This was achieved through CRY2/CIB1N fusions with Nodal receptors, where the type II receptor was sequestered to the cytosol to enhance light control [18]. The system enabled precise spatial patterning of Nodal signaling activity and downstream gene expression when deployed with an ultra-widefield microscopy platform for parallel light patterning in up to 36 embryos [18].
These optimizations highlight the importance of considering not just the terminal orientation but also strategic sequestration of components and appropriate experimental setups for achieving optimal results. The elimination of dark activity is particularly crucial for receptor tyrosine kinase control, as basal signaling can confound experimental outcomes and lead to erroneous conclusions about pathway dynamics.
Experimental Protocols for Fusion Protein Implementation
Protocol 1: CRY2-CIB1 Fusion Construct Assembly
This protocol outlines the molecular cloning strategy for generating functional CRY2 and CIB1 fusion constructs with proper terminal orientation.
Vector Selection: Choose mammalian expression vectors with appropriate promoters for your target cells (e.g., CMV for HEK293, EF1α for primary cells). Include selection markers (antibiotic resistance or fluorescent markers) for stable line generation.
CRY2 Fusion Cloning:
- Amplify CRY2 (residues 1-498) with C-terminal linker (e.g., GGGGS×3) and restriction sites
- Clone your protein of interest in-frame at the C-terminus of CRY2 using Gibson assembly or traditional restriction digestion/ligation
- Verify orientation by colony PCR and sequence the fusion junction
CIB1 Fusion Cloning:
- Amplify CIB1N (residues 1-170) with N-terminal linker and restriction sites
- Clone your protein of interest in-frame at the N-terminus of CIB1N
- Verify construct by diagnostic digest and sequencing
Validation:
- Express fusion constructs in HEK293 cells and verify protein expression by Western blotting
- Confirm proper subcellular localization by fluorescence microscopy
- Test light responsiveness using co-transfection with the complementary partner
Protocol 2: Light-Activation and Imaging
This protocol describes the experimental setup for activating and monitoring CRY2-CIB1 fusion proteins in live cells.
Cell Preparation:
- Plate cells expressing CRY2 and CIB1 fusion constructs on imaging-appropriate dishes
- Allow cells to adhere and express proteins for 24-48 hours
- For stable lines, maintain selection pressure; for transient transfections, image 24-48 hours post-transfection
Blue Light Stimulation:
- Use blue LEDs (450 nm) with appropriate intensity (0.1-10 W/cm²)
- Deliver light in pulses (200 ms to continuous) depending on application
- Control illumination patterns using digital micromirror devices for spatial patterning
Live-Cell Imaging:
- Maintain cells at 37°C and 5% CO₂ during imaging
- For time-lapse imaging, minimize blue light exposure to prevent phototoxicity
- Use appropriate filter sets for fluorescent protein tags (e.g., GFP/RFP)
Data Collection:
- Monitor recruitment kinetics by measuring fluorescence redistribution
- Quantify interaction strength by FRAP or BiFC where appropriate
- Assess functional outcomes by downstream signaling markers
The Scientist's Toolkit: Essential Research Reagents
Table: Key Reagent Solutions for CRY2-CIB1 Experiments
| Reagent/Category | Specific Examples | Function/Application | Considerations |
|---|---|---|---|
| CRY2 Plasmids | CRY2wt, CRY2high, CRY2low, CRY2-pDisplay (membrane-tagged) | Light-sensing component; can be fused to effectors of interest | CRY2low reduces unwanted oligomerization; CRY2high enhances clustering |
| CIB1 Plasmids | CIB1N, CIB1-full length, CIB1-mCherry | CRY2 binding partner; recruits fused cargo | N-terminal fragment (CIB1N) sufficient for CRY2 binding |
| Expression Systems | Mammalian: pcDNA3.1, pEGFP; Baculovirus: pFastBac | Delivery of optogenetic components to cells | Mammalian systems most common; viral systems for difficult-to-transfect cells |
| Light Hardware | Blue LEDs (450 nm), DMD projectors, laser systems | Precise light delivery for system activation | LED arrays cost-effective; DMD enables complex patterning |
| Fluorescent Tags | GFP, mCherry, tdTomato, HaloTag | Fusion partners for visualization and purification | tdTomato can sterically hinder CRY2 oligomerization |
| Control Plasmids | CRY2(Δ2-6), dark controls, light-only controls | Essential for validating specific CRY2-CIB1 interaction | Mutant controls distinguish specific from nonspecific effects |
Signaling Pathway and Workflow Diagrams
CRY2-CIB1 Optogenetic Activation Cycle
Experimental Workflow for Fusion Protein Implementation
Troubleshooting and Optimization Strategies
Even with proper terminal orientation, CRY2-CIB1 fusion experiments can encounter challenges that require systematic troubleshooting. High dark activity (signaling in the absence of light) often results from excessive expression levels or intrinsic affinity between fused domains. This can be mitigated by reducing expression levels, using the CRY2low variant, or introducing strategic point mutations to reduce basal interaction [3]. Insufficient light response may stem from poor light penetration, suboptimal expression of one component, or steric hindrance from the fused partners. Increasing light intensity, optimizing transfection conditions, or introducing flexible linkers between domains often resolves these issues.
Unexpected cellular localization frequently occurs when fused proteins contain strong localization signals that dominate over the intended optogenetic control. Carefully inspect the protein of interest for intrinsic trafficking signals and consider modifying these if they conflict with experimental goals. Phototoxicity from prolonged blue light exposure can be minimized by using pulsed illumination schemes rather than continuous light, and by ensuring that the lowest effective light intensity is used. The integration of control experiments with mutant CRY2(Δ2-6) that cannot bind CIB1 is essential for distinguishing specific CRY2-CIB1 interactions from light-induced artifacts or non-specific effects [3].
For quantitative applications, carefully characterize the kinetics and dose-response relationship of your specific fusion configuration, as these parameters can vary significantly depending on the fused partners and cellular context. The development of improved optoNodal2 reagents demonstrates that iterative optimization can eliminate dark activity while improving response kinetics and maintaining dynamic range [18]. This systematic approach to optimization enables increasingly precise control over receptor tyrosine kinase signaling and other key biological processes.
The Arabidopsis thaliana-derived CRY2/CIB1N optogenetic system has emerged as a powerful and versatile tool for achieving precise, light-dependent control over intracellular processes. This system leverages the natural property of the cryptochrome 2 (CRY2) protein to undergo a conformational change upon exposure to blue light, leading to its interaction with the cryptochrome-interacting basic-helix-loop-helix (CIB1) protein [21]. The core components consist of the N-terminal photolyase homology region (PHR) of CRY2 (amino acids 1-498), which binds the flavin adenine dinucleotide (FAD) chromophore, and a truncated N-terminal fragment of CIB1, typically CIBN (amino acids 1-170), which lacks the native DNA-binding domain [17] [21]. A key advantage of this system is that it requires no exogenous chemical cofactor, as the FAD chromophore is endogenously present in mammalian cells [3] [21]. The interaction is characterized by rapid induction (within seconds of blue light exposure) and spontaneous dissociation in the dark over minutes, allowing for reversible control with high spatiotemporal precision [9] [21]. This molecular toolbox has been successfully adapted to control a wide array of cellular activities, from protein localization and transcription to signaling pathway activation, making it particularly valuable for interrogating complex biological networks such as those governed by receptor tyrosine kinases (RTKs).
Key Research Reagent Solutions
The effective implementation of the CRY2/CIB1N system relies on a core set of well-validated reagents. The table below details the essential molecular constructs and their critical functions in experimental setups.
Table 1: Essential Research Reagents for CRY2/CIB1N Experiments
| Reagent Name/Type | Key Features & Composition | Primary Function in Experiments |
|---|---|---|
| CRY2PHR (aa 1-498) | N-terminal photolyase-homology region; binds FAD chromophore; core light-sensing module [21]. | Primary light-activated actuator; often fused to proteins of interest for light-dependent recruitment or oligomerization. |
| CIBN (aa 1-170) | Truncated N-terminal fragment of CIB1; lacks bHLH DNA-binding domain [21]. | Stationary anchor/target; fused to subcellular localization tags (e.g., membrane, DNA) to recruit CRY2-fused proteins. |
| CRY2high/CRY2low | Engineered CRY2 mutants with altered C-terminal charges to enhance or suppress homo-oligomerization [3]. | Tuning clustering propensity; CRY2high for robust activation, CRY2low for specific heterodimerization with minimal clustering. |
| OptoNodal2 Receptors | CRY2/CIB1N-fused Nodal receptors (Type I/II); cytosolic Type II receptor to reduce dark activity [6] [18]. | High-precision, light-controlled activation of specific signaling pathways (e.g., TGF-β/Nodal) with minimal background. |
| Fluorescent Reporters | CRY2/CIB1N fusions with fluorescent proteins (e.g., mCherry, GFP, tdTomato) [3] [17]. | Live-cell visualization of protein translocation, interaction kinetics, and cluster formation. |
| Plasmid Expression Systems | One-plasmid (co-transcriptional) or two-plasmid (independent promoters: lac, arabinose) systems [17]. | Flexible control over expression levels of CRY2 and CIBN fusions to minimize background and optimize recruitment. |
Quantitative System Properties and Kinetics
A thorough understanding of the quantitative biophysical and kinetic properties of the CRY2/CIB1N system is crucial for experimental design. The following table consolidates key performance metrics for the core components and their common variants.
Table 2: Quantitative Properties of CRY2/CIB1N System Components
| Parameter | CRY2PHR-CIBN (Wild-type) | CRY2high (E.g., CRY2olig) | CRY2low / CRY2low-tdTom | Measurement Context / Notes |
|---|---|---|---|---|
| Activation Wavelength | 450 nm (Blue light); Two-photon at ~860 nm [21] | 450 nm (Blue light) [3] | 450 nm (Blue light) [3] | Peak sensitivity; two-photon enables tissue penetration. |
| Association Kinetics (τ) | < 10 seconds (to >90% completion) [17] [21] | Rapid association [3] | Rapid association [3] | Time to membrane/DNA recruitment after light pulse. |
| Dissociation Kinetics (τ) | ~5.5 minutes; full reversal in ~10-12 min [9] [21] | -- | -- | Dark reversion time constant after light pulse ends. |
| Dissociation Constant (Kd) | ~3.90 × 10⁻⁷ M (for CRY2W374A-CIB1) [13] | -- | -- | Measured by bio-layer interferometry. |
| Homo-oligomerization | Moderate (native property) [3] | Elevated / Enhanced [3] | Suppressed / Inhibited [3] | Engineered via C-terminal charge mutations. |
| CIB1-binding Affinity | Strong (N-terminal charges critical) [3] | -- | -- | Disrupted by N-terminal neutral/delete mutations. |
Detailed Experimental Protocols
Protocol: Light-Dependent Recruitment to Subcellular Locations
This protocol details the process of using the CRY2/CIB1N system to recruit cytoplasmic proteins to specific subcellular compartments, such as the plasma membrane or chromosomal DNA, in live cells [17].
Workflow Diagram: Subcellular Recruitment Assay
Materials:
- Plasmids:
- Bait Plasmid: Expressing CIBN fused to a localization signal (e.g.,
CIBN-pmGFPfor plasma membrane targeting via prenylation, orTetR-CIBNfor chromosomal DNA targeting). - Prey Plasmid: Expressing the protein of interest (POI) fused to
CRY2PHR-mCherry(or another fluorescent tag).
- Bait Plasmid: Expressing CIBN fused to a localization signal (e.g.,
- Cells: Appropriate cell line (e.g., COS7, HEK293T, or E. coli engineered with target sites).
- Imaging Setup: Inverted fluorescence microscope equipped with a blue LED light source (450 nm) for activation and appropriate filter sets for fluorescent proteins.
Procedure:
- Construct Preparation: Clone your genes of interest into the appropriate CIBN-bait and CRY2-prey plasmid backbones. The use of a one-plasmid system with coupled expression is recommended for maintaining a 1:1 stoichiometry and minimizing background, whereas a two-plasmid system allows for independent titration of expression levels [17].
- Cell Transfection: Transfect the cells with the prepared plasmids according to standard protocols for your cell line. For mammalian cells, lipofectamine-based methods are commonly used.
- Dark Incubation: After transfection, incubate the cells for 12-24 hours in complete darkness or under very dim red light to prevent pre-activation of the system. This step is critical for minimizing basal activity.
- Microscopy and Light Stimulation:
- Mount the sample on the microscope stage. Acquire a baseline image of the fluorescent protein distributions in the dark.
- Initiate blue light stimulation. A typical protocol uses short pulses (e.g., 30 ms to 2 s) of 450 nm light delivered at intervals (e.g., every 5 seconds) at an intensity of ~85 W/cm² [17]. The specific pulse regimen can be optimized for the experimental needs.
- Image Acquisition: Continuously or intermittently acquire images of the fluorescent reporter (e.g., mCherry) throughout the light stimulation period to monitor the translocation of the CRY2-fused protein to the target compartment.
- Data Analysis: Quantify the recruitment efficiency by measuring the fluorescence intensity at the target compartment (e.g., plasma membrane, DNA foci) over time, normalized to the total cellular fluorescence or cytoplasmic fluorescence.
Protocol: Control of Receptor Tyrosine Kinase Signaling Pathways
This protocol outlines a strategy for optically controlling RTK signaling by using CRY2/CIB1N to induce dimerization and activation of RTK intracellular domains, inspired by applications controlling Raf/MEK/ERK and other pathways [3] [6].
Workflow Diagram: Optogenetic RTK Activation
Materials:
- Plasmids:
CIBN-[MyrTag or TransmembraneDomain]-[RTK_IntracellularDomain]: A construct where CIBN is fused to a membrane-targeting sequence (e.g., myristoylation/palmitoylation tag or transmembrane domain) and the intracellular kinase domain of the target RTK.CRY2PHR-[RTK_DimerizationDomain or AdaptorProtein]: A construct where CRY2PHR is fused to a protein module that, upon light-induced membrane recruitment, will trigger RTK activation. This could be the dimerization partner of the RTK, an adaptor protein (e.g., Grb2), or even a second copy of the RTK intracellular domain to enforce homo-dimerization.
- Cells: Relevant cell line for RTK signaling studies.
- Assay Reagents: Antibodies for detecting phosphorylated downstream targets (e.g., anti-pERK for MEK/ERK signaling) and total protein levels.
Procedure:
- Construct Design and Validation: Design the RTK-CIBN and CRY2-effector fusions as described above. Consider using CRY2high mutants if robust cluster formation is desired to amplify signaling, or CRY2low variants if more precise, graded activation is needed [3]. Validate expression and correct localization of the constructs in your cell line.
- Cell Transfection and Incubation: Co-transfect the cells with the two optogenetic receptor constructs. Incubate the transfected cells in the dark for the requisite expression time (e.g., 24-48 hours).
- Light Stimulation and Pathway Activation: Expose the cells to continuous or pulsed blue light to induce the CRY2-CIBN interaction, thereby recruiting the cytosolic CRY2-fusion to the membrane-bound RTK-CIBN complex. This forced proximity mimics ligand-induced dimerization and activates the RTK's kinase activity. The duration and pattern of illumination can be used to modulate the strength and dynamics of signaling.
- Signal Detection and Analysis:
- At designated time points post-stimulation, lyse the cells and analyze signaling pathway activation by Western blotting using phospho-specific antibodies.
- For spatiotemporal analysis, perform immunofluorescence or live-cell imaging using translocation or FRET-based biosensors to visualize pathway activity in real-time.
Application Notes and Troubleshooting
- Minimizing Dark Activity: A common challenge is unwanted signaling or clustering in the dark. To mitigate this:
- Use the CIBN truncation (1-170 aa) instead of full-length CIB1 [21].
- For receptor systems, consider removing localization motifs (e.g., myristoylation) from constitutive components to reduce their effective concentration at the membrane in the dark, as demonstrated in the optoNodal2 system [6] [18].
- Titrate the expression levels of CRY2 and CIBN fusions using inducible promoters to find the balance between high inducibility and low background [17].
- Managing CRY2 Oligomerization: Native CRY2 undergoes light-dependent homo-oligomerization, which can complicate experiments designed purely for heterodimerization [3].
- For applications requiring specific 1:1 heterodimerization (e.g., precise protein translocation), use the CRY2low variant or fuse CRY2 to a large fluorescent protein like tdTomato to sterically hinder oligomer formation [3].
- For applications that benefit from clustering to amplify signals (e.g., signaling pathway activation, biomolecular condensate formation), use the CRY2high (CRY2olig) variant [3].
- Optimizing Light Delivery: The kinetics and extent of CRY2/CIB1N interaction are directly influenced by light dosage [8].
- Pulsed illumination can be more effective and less phototoxic than continuous illumination, allowing the system to partially recover between pulses.
- For deep tissue or in vivo applications, two-photon excitation at ~860 nm can be used to activate the system with high spatial precision [21].
Visualizing Key Signaling Pathways and Workflows
The following diagram illustrates the core mechanism of the CRY2/CIB1N system and its application in controlling a generic signaling pathway, such as the Raf/MEK/ERK cascade downstream of RTKs.
Diagram Title: CRY2/CIB1N Optogenetic Control of Signaling Pathways
The Arabidopsis thaliana-derived CRY2/CIB1 optogenetic system has emerged as a powerful tool for controlling intracellular signaling pathways with high spatiotemporal precision. This system utilizes the blue light-sensitive cryptochrome 2 (CRY2) and its interacting partner CIB1 (CRY2-interacting bHLH 1). A truncated version comprising the N-terminal domain of CIB1 (CIB1N, residues 1-170) is frequently employed to minimize potential side interactions while retaining full binding capability [17]. The core mechanism involves blue light-induced heterodimerization (peak activation ~450 nm) between CRY2 and CIB1N, which occurs within seconds of illumination and reverses in darkness with relaxation time constants of approximately 10 minutes [17] [6]. This rapid, reversible interaction does not require exogenous cofactors, making it particularly suitable for diverse biological applications [3] [22].
Molecular studies have revealed that CRY2-CIB1 and CRY2-CRY2 interactions are governed by distinct protein interfaces. The CRY2-CIB1 interaction primarily involves the N-terminal region of CRY2, while CRY2 homo-oligomerization is mediated by C-terminal residues [3]. This understanding has enabled the engineering of specialized CRY2 variants with enhanced (CRY2high, CRY2olig) or suppressed (CRY2low) oligomerization tendencies to optimize specific applications [3] [22]. The system's versatility has been demonstrated across multiple biological contexts, including mammalian cells, bacteria, and zebrafish embryos [17] [6].
Table 1: Key Characteristics of the CRY2/CIB1N Optogenetic System
| Property | Specification | Experimental Context |
|---|---|---|
| Activation Wavelength | 450 nm (blue light) | Saturation near 20 μW/mm² in zebrafish embryos [6] |
| Association Kinetics | Rapid (seconds) | Complete recruitment within 85 seconds in E. coli [17] |
| Dissociation Kinetics | τ~10 minutes (in darkness) | Reversion in E. coli after ~40 minutes [17] |
| Binding Affinity (Kd) | 3.90 × 10⁻⁷ M | For constitutively active CRY2 mutant (CRY2W374A) [13] |
| Key CRY2 Variants | CRY2high, CRY2low, CRY2olig | Engineered for controlled oligomerization [3] [22] |
Optogenetic Control of Nodal Signaling: System Design and Validation
The Nodal signaling pathway, a subset of the TGF-β superfamily, plays a crucial role in organizing mesendodermal patterning during vertebrate embryogenesis [6]. Conventional methods for manipulating this pathway lack the spatiotemporal precision needed to dissect its dynamic functions. To address this limitation, researchers have developed an optogenetic approach termed optoNodal2, which rewires the pathway to be controlled by light [6].
Molecular Engineering of OptoNodal2 Receptors
The optoNodal2 system was designed by fusing the intracellular domains of Type I (Acvr1b) and Type II (Acvr2b) Nodal receptors to the photosensitive CRY2 and CIB1N domains, respectively [6]. A critical innovation in this second-generation system involved rendering the Type II receptor cytosolic in the dark by removing its myristoylation motif. This modification significantly reduced dark activity—the unintended, light-independent signaling that plagued first-generation optogenetic receptors [6]. The system demonstrates excellent dynamic range, with negligible background activity in darkness and robust, light-inducible signaling that approaches endogenous Nodal signaling levels [6].
Signaling Pathway and Mechanism
Upon blue light illumination, CRY2 and CIB1N heterodimerize, bringing the intracellular domains of the Type I and Type II Nodal receptors into proximity. This enables the constitutively active Type II receptor to phosphorylate and activate the Type I receptor, which subsequently phosphorylates the transcription factor Smad2. The activated pSmad2 then translocates to the nucleus to induce expression of Nodal target genes [6]. This entire process can be optically controlled with cellular precision.
Diagram 1: OptoNodal2 signaling pathway mechanism (Title: CRY2-CIB1N Controls Nodal Signaling)
Quantitative Performance of the OptoNodal2 System
The optoNodal2 system exhibits favorable kinetic properties and dose-response characteristics suitable for patterning developmental signals. Quantitative assessments in zebrafish embryos demonstrate its high sensitivity and temporal precision [6].
Signaling Kinetics and Dynamic Range
When exposed to a 20-minute impulse of saturating blue light (20 μW/mm²), the optoNodal2 system drives pSmad2 accumulation that reaches maximal levels approximately 35 minutes after stimulation begins [6]. Following light cessation, signaling returns to baseline approximately 50 minutes later, significantly faster than first-generation LOV-based optoNodal reagents [6]. This improved temporal resolution enables more precise control over signaling duration.
Table 2: Quantitative Performance Metrics of OptoNodal2
| Parameter | Value | Experimental Context |
|---|---|---|
| Activation Threshold | <1 μW/mm² | Minimum light intensity producing detectable pSmad2 [6] |
| Saturation Intensity | ~20 μW/mm² | Light intensity producing maximal pSmad2 response [6] |
| Rise Time (τ₀.₉) | ~35 minutes | Time to reach 90% of maximal pSmad2 after light onset [6] |
| Decay Time | ~50 minutes | Time to return to baseline after light cessation [6] |
| Dark Activity | Negligible | No phenotypic defects at 24 hpf in dark-raised embryos [6] |
Experimental Protocol: Implementing OptoNodal2 in Zebrafish Embryos
This protocol details the procedure for achieving light-dependent control of Nodal signaling in zebrafish embryos using the CRY2/CIB1N-based optoNodal2 system.
Reagent Preparation and Microinjection
- Plasmid Design: Clone the coding sequences for CRY2-fused Type I receptor (Acvr1b-CRY2) and CIB1N-fused Type II receptor (CIB1N-Acvr2b) into appropriate expression vectors. The two-plasmid system allows independent modulation of receptor expression levels [17].
- mRNA Synthesis: Linearize plasmid templates and transcribe capped mRNA using commercially available kits (e.g., mMessage mMachine). Purify mRNA using standard protocols.
- Microinjection Setup: Prepare injection needles and calibrate injection volumes. Prepare an injection solution containing both receptor mRNAs at a 1:1 molar ratio.
- Embryo Injection: Inject 1-cell stage zebrafish embryos with 1-30 pg of each receptor mRNA. The specific amount should be optimized for each experimental setup to minimize toxicity while ensuring robust expression [6].
Light Stimulation and Spatial Patterning
- Light Source Configuration: Use a digitally controlled blue LED array (470 nm) or laser source coupled to a spatial light modulator for patterning. Ensure uniform illumination or defined patterns with intensity control up to 20 μW/mm² [6].
- Stimulation Protocol: For global activation, expose embryos to continuous or pulsed blue light (e.g., 30 ms pulses every 5 seconds) [17]. For spatial patterning, define regions of interest using illumination masks.
- Multi-Embryo Parallel Processing: For high-throughput experiments, use widefield microscopy systems capable of simultaneous patterned illumination of up to 36 embryos [6].
Validation and Readout Methods
- Immunostaining: Fix embryos at desired timepoints and perform standard immunostaining for pSmad2 to visualize Nodal signaling activity [6].
- In Situ Hybridization: Analyze expression of endogenous Nodal target genes (e.g., gsc, sox32) using whole-mount in situ hybridization [6].
- Live Imaging: Monitor real-time signaling dynamics and morphological changes in transgenic reporter lines.
Diagram 2: Experimental workflow for optoNodal2 implementation (Title: OptoNodal2 Experimental Workflow)
Research Reagent Solutions
The following table provides essential materials and reagents required for implementing the CRY2/CIB1N optogenetic system to control Nodal signaling.
Table 3: Essential Research Reagents for CRY2/CIB1N Optogenetics
| Reagent Category | Specific Examples | Function and Application Notes |
|---|---|---|
| Core Optogenetic Components | Acvr1b-CRY2, CIB1N-Acvr2b fusion constructs | Engineered receptors for light-controlled Nodal signaling; available from Addgene [6] |
| CRY2 Variants | CRY2high, CRY2low, CRY2olig | Engineered CRY2 mutants with tuned oligomerization properties for specific applications [3] [22] |
| Expression Systems | Single plasmid (CRY2+CIB1N coupled) or two-plasmid system | Single plasmid maintains 1:1 expression ratio; two-plasmid enables independent expression tuning [17] |
| Light Delivery Systems | Blue LED arrays (470 nm), digitally patterned illumination | Enable spatial and temporal control with intensities up to 20 μW/mm² [6] |
| Validation Tools | pSmad2 antibodies, Nodal target gene probes | Confirm pathway activation and downstream effects [6] |
Applications and Future Perspectives
The CRY2/CIB1N-based optoNodal2 system enables precise spatial and temporal manipulation of Nodal signaling, facilitating investigations into pattern formation during embryonic development. This technology has been successfully used to control internalization of endodermal precursors during gastrulation and to rescue developmental defects in Nodal signaling mutants [6]. The system's modular design suggests potential applicability for controlling other receptor tyrosine kinase pathways, positioning it as a versatile platform for synthetic biology and therapeutic development [22]. Future refinements may include additional spectral variants and orthogonal optogenetic systems for simultaneous control of multiple signaling pathways.
The CRY2/CIB1 optogenetic system, derived from Arabidopsis thaliana, provides a powerful tool for precise spatiotemporal control of intracellular processes. This system enables researchers to manipulate receptor tyrosine kinase (RTK) signaling dynamics with exceptional precision. CRY2 undergoes both blue light-dependent homo-oligomerization and hetero-dimerization with its binding partner CIB1, making it particularly valuable for controlling protein-protein interactions and downstream signaling pathways [3]. When engineering CRY2/CIB1N fusions for RTK control, the distinct protein interfaces governing these interactions are crucial: N-terminal charges primarily mediate CRY2-CIB1 binding, while C-terminal residues control the propensity for CRY2-CRY2 homo-oligomerization [3]. Understanding these mechanisms allows for strategic selection of CRY2 variants (e.g., CRY2high for robust oligomerization or CRY2low for minimized clustering) to optimize experimental outcomes in RTK research.
Blue Light Illumination Equipment and Parameters
Selecting appropriate blue light sources and illumination parameters is fundamental for successful CRY2/CIB1 experiments. The following equipment specifications and parameters have been optimized for controlling RTK signaling pathways.
Table 1: Blue Light Source Specifications for CRY2/CIB1 Activation
| Parameter | In Vitro Cell Culture | In Vivo Applications | High-Throughput Screening |
|---|---|---|---|
| Wavelength | 450-480 nm [23] | 450-480 nm | 450-480 nm |
| Intensity | 0.5-10 mW/cm² | 1-5 mW/cm² | 1-5 mW/cm² |
| Pulse Duration | 200 ms - 5 s pulses [3] | 500 ms - 10 s pulses | 100 ms - 2 s pulses |
| Frequency | Single pulse to 0.5 Hz [3] | Single pulse to 0.1 Hz | 0.1-1.0 Hz |
| Light Source | LED arrays [23] | Fiber-coupled LEDs | Programmable LED plate readers [24] |
| Uniformity | >90% across sample area | Dependent on tissue depth | >95% across well plate |
For receptor tyrosine kinase control, illumination parameters must be optimized to balance CRY2/CIB1 binding efficiency with potential phototoxicity. The BLU-VIPR system exemplifies this approach, utilizing blue light to induce CRY2-CIB1 dimerization for precise genetic manipulation in immune cells [23]. In high-throughput settings, automated platforms like the UCLA Molecular Screening Shared Resource facility employ advanced robotic systems (e.g., G3 Explorer) integrated with programmable illumination capable of delivering precise light patterns across multi-well plates [24].
Experimental Protocol: CRY2/CIB1-Mediated RTK Control
Equipment Setup and Calibration
Materials:
- Blue LED illumination system (450-480 nm)
- Microscope integrated with LED source or standalone illumination chamber
- Power meter for intensity calibration
- Temperature control system (maintained at 37°C)
- CO₂ control for live cell imaging
Calibration Procedure:
- Measure light intensity at sample plane using a calibrated power meter.
- Map intensity distribution across the entire illumination field to ensure uniformity >90%.
- Program pulse sequences according to experimental requirements (refer to Table 1).
- Validate system performance using control cells expressing CRY2-fluorescent protein fusions, observing expected clustering dynamics within 30-60 seconds of illumination [3].
Cell Culture and Transfection
Reagents:
- HEK293T or appropriate cell line for RTK studies
- Plasmid DNA: CRY2 fused to RTK of interest, CIB1N fused to activator/repressor domain
- Transfection reagent (PEI, lipofectamine, or similar)
- Complete cell culture medium
Procedure:
- Seed cells at appropriate density (e.g., 50,000 cells/cm²) on imaging-compatible dishes.
- After 24 hours, transfert with CRY2-RTK and CIB1N-effector plasmids at 2:1 ratio.
- Incubate for 24-48 hours to allow expression before illumination experiments.
- For stable expression, use lentiviral transduction and antibiotic selection.
Illumination and Real-Time Monitoring
Protocol for RTK Pathway Activation:
- Replace culture medium with imaging-compatible buffer.
- Position samples in illumination system with precise environmental control.
- Apply optimized blue light pulse sequence (typically 200ms pulses at 2-second intervals initially [3]).
- Monitor CRY2 clustering and membrane recruitment in real-time via fluorescence microscopy.
- Fix cells at specific time points (5, 15, 30, 60 min) for downstream signaling analysis.
- Process samples for phospho-RTK staining and western blotting to quantify pathway activation.
Research Reagent Solutions
Table 2: Essential Reagents for CRY2/CIB1 RTK Control Experiments
| Reagent | Function | Example Application |
|---|---|---|
| pCRY2-Fusion Plasmid | Light-sensitive actuator fused to RTK of interest | Optogenetic control of RTK clustering and activation |
| pCIB1N-Effector Plasmid | Binding partner fused to signaling domain | Recruitment of downstream effectors to RTK complex |
| CRY2 Variants (CRY2high/CRY2low) | Engineered oligomerization properties | Tuning clustering propensity for optimal signaling output [3] |
| Blue Light-Sensitive Reporters | Real-time monitoring of pathway activity | Live-cell imaging of downstream signaling events |
| Immunostaining Antibodies | Fixed-cell analysis of pathway activation | pERK, pAKT staining to quantify signaling amplitude |
| Culture-Compatible LED Plates | Scalable illumination for HTS | High-throughput drug screening with optogenetic stimulation [24] |
Advanced Applications and High-Throughput Integration
The CRY2/CIB1 system integrates effectively with high-throughput screening platforms for drug discovery applications. Automated systems like the G3 Explorer robotics platform at UCLA's Molecular Screening Shared Resource enable large-scale optogenetic experiments, combining precise illumination with automated liquid handling and high-content imaging [24]. For RTK drug discovery, this allows parallel testing of compound libraries under controlled optogenetic stimulation conditions.
Advanced implementations combine optogenetic control with artificial intelligence for adaptive experimental design. Machine learning algorithms can analyze initial results to optimize subsequent illumination parameters, creating a closed-loop system for maximizing data quality [24]. This approach is particularly valuable for mapping RTK signaling dynamics across multiple cellular contexts and genetic backgrounds.
Troubleshooting and Optimization
Common Illumination Issues and Solutions:
- Insufficient Activation: Increase light intensity (up to 10 mW/cm²) or pulse duration while monitoring for phototoxicity.
- Excessive Clustering: Utilize CRY2low variants or reduce illumination intensity to minimize unintended homo-oligomerization [3].
- Spatial Non-uniformity: Recalibrate illumination system and verify sample plane alignment.
- Phototoxicity: Reduce intensity, increase interval between pulses, or implement two-photon excitation for deeper tissue penetration.
Validation Experiments:
- Always include non-illuminated controls to assess background activation.
- Validate system performance with known positive and negative controls.
- Confirm light-dependent effects by comparing illuminated vs. dark conditions for each experiment.
- Use multiple assays (e.g., imaging, western blot, functional assays) to corroborate findings.
For researchers implementing these protocols, ongoing optimization is essential. The dynamic nature of optogenetic systems requires careful balancing of expression levels, illumination parameters, and experimental endpoints to achieve robust RTK control while maintaining cellular health.
The CRY2/CIB1 optogenetic system, derived from the Arabidopsis thaliana plant, has become an indispensable tool for controlling intracellular processes with high spatiotemporal precision. This system leverages the blue light-dependent interaction between the cryptochrome 2 (CRY2) photoreceptor and its binding partner CIB1 (cryptochrome-interacting basic-helix-loop-helix 1) [25] [3]. Upon illumination with blue light (typically 390-480 nm), CRY2 undergoes a conformational change that enables its interaction with CIB1, leading to rapid hetero-dimerization [3]. This light-induced protein-protein interaction can be harnessed to control a wide array of cellular activities, from gene expression to signaling pathway activation, by fusing CRY2 and CIB1 to target proteins of interest.
A key advantage of the CRY2/CIB1 system is its self-contained nature – it requires no exogenous cofactors besides the inherent flavin adenine dinucleotide (FAD) chromophore already present in mammalian cells [3]. The system exhibits rapid induction kinetics, with interaction initiation occurring within seconds of blue light exposure, and relatively fast reversal in the absence of light (with a photocycle half-life of approximately 5.5 minutes for the wild-type CRY2-CIB1 interaction) [25]. These properties have made CRY2/CIB1 particularly valuable for controlling receptor tyrosine kinase (RTK) signaling, where precise temporal and spatial regulation is crucial for dissecting complex signaling networks [3].
Quantitative Characterization of CRY2/CIB1
A comprehensive understanding of CRY2/CIB1 system kinetics and variants is essential for experimental design. The table below summarizes key quantitative parameters for CRY2/CIB1 interactions:
Table 1: Kinetic and spectral properties of CRY2/CIB1 optogenetic systems
| Component/Variant | λEx Peak (nm) | Photocycle Half-Life | Dissociation Constant (Kd) | Key Properties/Applications |
|---|---|---|---|---|
| CRY2wt-CIB1 | 450 | 5.5 min [25] | 3.90 × 10⁻⁷ M [13] | Standard heterodimerization system |
| CRY2(E490G) | 450 | Not reported | Not reported | Enhanced oligomerization [3] |
| CRY2high | 450 | Not reported | Not reported | Engineered elevated oligomerization [3] |
| CRY2low-tdTom | 450 | Not reported | Not reported | Suppressed oligomerization [3] |
| CIBN | 450 | 5.5 min [25] | Not reported | N-terminal fragment of CIB1 [11] |
The molecular mechanisms governing CRY2 interactions have been elucidated through recent structural studies. The CRY2-CIB1 interaction is governed by well-separated protein interfaces at the two termini of CRY2 [3]. N-terminal charged residues (particularly lysines at positions 2, 5, and 6) are critical for CRY2-CIB1 interaction, while C-terminal residues 489 and 490 significantly impact CRY2 homo-oligomerization [3]. Positive charges at these C-terminal positions facilitate oligomerization, while negative charges inhibit it, enabling the engineering of CRY2 variants with tuned oligomerization properties [3].
Recent cryo-EM structures of constitutively active CRY2 mutant (CRY2W374A) in complex with CIB1 fragments have revealed that CIB1 binds at the CRY2 tetramer interface in a side-by-side manner, with a 1:1 molar ratio of CRY2 to CIB1 [13]. Key CRY2 residues involved in CIB1 binding include His113, Trp138, Tyr141, and Phe302, while residues 18-27 of CIB1 form an α-helix critical for the interaction [13].
Mammalian Cell Implementation
Mammalian Cell Culture Protocol
Table 2: Key reagents for mammalian cell CRY2/CIB1 experiments
| Reagent | Function/Purpose | Example/Target |
|---|---|---|
| CRY2PHR (1-498) | Light-sensitive actuator domain | Fused to signaling proteins |
| CIBN | Binding partner for photoactivated CRY2 | Membrane-anchored for recruitment |
| LED Illumination System | Blue light delivery (450 nm) | Programmable intensity/duration |
| pcDNA3.1 Vector | Mammalian expression | CRY2/CIB1 fusion constructs |
| Lipofectamine 3000 | Transfection reagent | Plasmid delivery |
Protocol: Light-Activated CRY2-CIB1 Recruitment in COS7 Cells
Cell Preparation: Plate COS7 cells on glass-bottom dishes at 50-70% confluence in complete DMEM medium 24 hours before transfection.
Plasmid Transfection: Transfect cells with constructs encoding:
- mCh-CRY2 (or CRY2 variant fused to your protein of interest)
- CIB1-GFP-Sec61β (for ER membrane recruitment) or other localized CIB1 fusions Use Lipofectamine 3000 according to manufacturer protocols.
Incubation: Incubate transfected cells for 24-48 hours at 37°C, 5% CO₂ in dark conditions to minimize premature CRY2 activation.
Light Stimulation:
- For widefield activation: Use 450 nm LED illumination at 9.7 W cm⁻² intensity
- For pulsed activation: Deliver 200-ms pulses at 2-s intervals [3]
- For spatial patterning: Use digital micromirror devices (DMDs) or laser scanning systems
Live Imaging & Analysis:
- Image cells using confocal or epifluorescence microscopy
- Quantify recruitment efficiency by measuring cytosolic fluorescence depletion
- Monitor downstream signaling events using appropriate biosensors
Diagram 1: CRY2/CIB1 optogenetic activation pathway. Blue light induces CRY2-CIB1 heterodimerization, leading to transcription factor (TF) recruitment and gene expression activation.
Raspberry Pi LED Illumination System
For customizable light delivery, construct a programmable LED device using:
- Raspberry Pi 4 Model B with microSD card (16GB minimum)
- High-power 450 nm LED (e.g., CREE XPEBBL-L1-0000-00E01)
- LED driver circuit with constant current source
- Heat sink and fan for thermal management
- 3D-printed enclosure for light shielding
- Python control scripts for illumination patterns
This system delivers pulsed light with customized control of illumination duration, frequency, and intensity, enabling complex stimulation paradigms for CRY2/CIB1 experiments [25].
Zebrafish Embryo Implementation
OptoNodal2 System for Zebrafish
The optoNodal2 system represents a sophisticated application of CRY2/CIB1 technology for controlling Nodal signaling patterns in developing zebrafish embryos [18]. This system addresses limitations of first-generation optogenetic tools by achieving improved dynamic range and reduced dark activity.
Table 3: optoNodal2 system components and functions
| Component | Function | Fusion Partner |
|---|---|---|
| CRY2 | Light-sensitive actuator | Type I Nodal receptor (Acvr1b) |
| CIB1N | CRY2-binding partner | Type II Nodal receptor (Acvr2b) |
| Sec61β | Membrane anchoring | CIB1N fusion |
| Cry2a | Zebrafish cryptochrome | Alternative to Arabidopsis CRY2 |
Protocol: optoNodal2-Mediated Nodal Signaling Patterning in Zebrafish
mRNA Synthesis:
- Linearize plasmid DNA containing CRY2-Acvr1b and CIB1N-Acvr2b fusions
- Perform in vitro transcription using mMessage mMachine kit
- Purify mRNA using lithium chloride precipitation
Embryo Microinjection:
- Inject 1-2 cell stage zebrafish embryos with:
- 100-200 pg of CRY2-Acvr1b mRNA
- 100-200 pg of CIB1N-Acvr2b mRNA
- 25-50 pg of membrane marker (e.g., Lyn-CFP) mRNA
- Include 0.1% phenol red as injection tracer
- Inject 1-2 cell stage zebrafish embryos with:
Embryo Handling and Mounting:
- Raise injected embryos at 28.5°C in E3 embryo medium until shield stage (6 hpf)
- Manually dechorionate embryos using fine forceps
- Mount embryos in 1% low-melting-point agarose in imaging chambers
Light Patterning and Imaging:
- Use ultra-widefield microscopy platform for parallel patterning in up to 36 embryos
- Apply spatial light patterns (5-50 μm spots, stripes, or gradients) using DMD
- Use 450 nm light at 0.1-1.0 mW mm⁻² intensity for 1-5 minutes
- Image pSmad2 nuclear translocation every 2-5 minutes using confocal microscopy
Phenotypic Analysis:
- Fix embryos at tailbud stage (10 hpf) for in situ hybridization
- Process for marker gene expression (sox32, gsc, ntl)
- Quantify endodermal precursor internalization
Diagram 2: optoNodal2 signaling pathway in zebrafish. Light-induced CRY2-CIB1N dimerization brings Nodal receptors together, activating Smad2 phosphorylation and target gene expression.
Ultra-Widefield Patterning Platform
For high-throughput zebrafish experiments, implement a custom ultra-widefield patterned illumination system:
- Scientific CMOS camera with large field of view
- Digital micromirror device (DMD) for spatial patterning
- 450 nm LED light source with collimation optics
- Multi-well sample chamber for parallel embryo imaging
- Custom MATLAB or Python software for pattern generation and synchronization
This platform enables creation of synthetic Nodal signaling patterns with cellular resolution in dozens of embryos simultaneously, facilitating systematic exploration of morphogen decoding mechanisms [18].
Research Reagent Solutions
Table 4: Essential research reagents for CRY2/CIB1 optogenetics
| Reagent Category | Specific Examples | Function/Application | Source/Reference |
|---|---|---|---|
| CRY2 Variants | CRY2wt, CRY2olig (E490G), CRY2high, CRY2low | Light-sensitive actuators with tuned oligomerization | [3] |
| CIB1 Variants | CIB1, CIBN (1-170), CIB1N | CRY2-binding partners with different properties | [25] [11] |
| Expression Vectors | pcDNA3.1, pCS2+, pTol2 | Mammalian, zebrafish, and bacterial expression | [25] [18] |
| Fluorescent Tags | mCherry, GFP, tdTomato, CFP | Fusion tags for visualization and steric effects | [3] |
| Localization Domains | Sec61β, Lyn, Histone2B | Targeting to cellular compartments | [3] [18] |
| LED Illumination Systems | Raspberry Pi LED, Commercial DMD systems | Precise light delivery with spatial-temporal control | [25] |
Troubleshooting and Optimization
Common Experimental Challenges
Dark Activity: Unwanted signaling in the absence of light can be mitigated by:
Limited Dynamic Range: Improve by:
- Engineering CRY2 and CIB1 variants with enhanced properties
- Incorporating tandem dimeric fluorescent proteins (tdTom) to sterically hinder oligomerization [3]
- Optimizing illumination parameters (intensity, pulse frequency)
Spatial Resolution: Enhance by:
- Using two-photon activation for precise spatial control
- Implementing optical sectioning techniques
- Optimizing expression levels to minimize signal diffusion
CRY2 Variant Selection Guide
- CRY2wt: Standard applications requiring balanced heterodimerization and oligomerization
- CRY2olig (E490G): Applications requiring enhanced clustering and robust oligomerization
- CRY2high: Engineered for elevated oligomerization in activation/sequestration strategies
- CRY2low-tdTom: Applications requiring specific heterodimerization with minimal oligomerization
The implementation of CRY2/CIB1 optogenetic systems across mammalian cells and zebrafish models provides powerful approaches for dissecting RTK signaling and developmental processes with unprecedented spatiotemporal precision. The continuous engineering of improved CRY2 variants and experimental protocols将进一步 enhance the utility of these tools for basic research and therapeutic development.
Solving Common Pitfalls: Enhancing Dynamic Range and Specificity in Opto-RTK Systems
The Arabidopsis thaliana cryptochrome 2 (CRY2) and its binding partner CIB1 form a powerful optogenetic system for controlling cellular processes with blue light. When engineered for receptor tyrosine kinase (RTK) control, CRY2/CIBN systems enable precise spatial and temporal activation of signaling pathways. However, a significant limitation of first-generation CRY2 systems is dark activity—unwanted interaction between CRY2 and CIB1 in the absence of light, which leads to constitutive signaling and experimental artifacts [26]. This Application Note details validated molecular strategies to minimize dark activity through CRY2 truncations and optimized constructs, with specific application to RTK signaling research.
Molecular Strategies for Reduced Dark Activity
Optimized CRY2 Truncations
The C-terminal extension (CCE) of full-length CRY2 plays a crucial role in regulating its activity. Systematic truncation of this domain has yielded variants with significantly improved performance characteristics for optogenetic applications.
Table 1: Performance Characteristics of CRY2 Truncation Variants
| Construct Name | Amino Acids | Dark Activity | Light-Induced Activity | Key Features and Applications |
|---|---|---|---|---|
| CRY2PHR | 1–498 | High | High | Original photolyase homology domain; high background limits utility [26]. |
| CRY2(515) | 1–515 | Moderate | High | Improved expression but retains noticeable dark interaction [26]. |
| CRY2(535) | 1–535 | Low | High | Recommended variant. 26-fold reduction in dark activity vs. CRY2PHR; ideal for RTK control [26]. |
| Full-Length CRY2 | 1–612 | Lowest | Moderate | Highest dynamic range but large size may be cumbersome for some fusions [26]. |
Minimized CIB1 Partners (CIBN)
The CIB1 partner can also be truncated to a minimal functional domain, reducing the overall steric burden of the optogenetic system. The N-terminal fragment of CIB1, comprising residues 1–170 (CIBN), is widely used and shows robust, light-dependent binding to CRY2 [26] [17]. A further truncation to residues 1–81 (CIB81) maintains light-dependent interaction with CRY2 with performance similar to CIBN, offering an even smaller tag for constrained molecular environments [26].
CRY2L348FPhotocycle Mutant
Beyond truncations, point mutations can alter the intrinsic photocycle kinetics of CRY2. The L348F mutation results in a long-cycling variant with a dissociation half-life of approximately 24 minutes following a light pulse, compared to ~5.5 minutes for wild-type CRY2 [26]. This prolonged active state can be beneficial for achieving sustained signaling activation with minimal light stimulation.
Experimental Protocols for Validation and Application
Protocol: Validating Dark Activity via Membrane Recruitment Assay
This live-cell imaging protocol is a direct method to quantify the dark and light-induced interaction between cytosolic CRY2 and membrane-tethered CIBN [3] [26].
Construct Design:
- Bait: Fuse your protein of interest (or a minimal membrane anchor like Lyn) to the C-terminus of CIBN (e.g.,
CIBN-GFP-CaaXfor plasma membrane targeting). - Prey: Fuse your protein of interest (e.g., the intracellular domain of an RTK,
iTrk) to the C-terminus of your CRY2 variant (e.g.,CRY2(535)-mCherry).
- Bait: Fuse your protein of interest (or a minimal membrane anchor like Lyn) to the C-terminus of CIBN (e.g.,
Cell Culture and Transfection:
- Plate appropriate cells (e.g., HEK293T, PC12, or neural stem cells) on imaging-grade dishes.
- Co-transfect with the bait and prey constructs. A total DNA amount of 500-1000 ng is typically sufficient for 24-well plate formats.
Image Acquisition:
- Dark State Imaging: Maintain cells in complete darkness. Using a live-cell microscope with a sensitive camera, capture baseline images of the mCherry (CRY2) and GFP (CIBN) channels.
- Light Activation: Illuminate cells with pulsed blue light (e.g., 200-ms pulses at 9.7 W/cm², delivered every 2 seconds) [3]. Monitor and record the translocation of CRY2(535)-mCherry to the membrane over 5-10 minutes.
Data Analysis:
- Quantify the cytosolic and membrane fluorescence intensity of the CRY2 reporter over time.
- Calculate the Recruitment Index as the ratio of membrane-associated fluorescence to total cellular fluorescence.
- A high Recruitment Index in the dark state indicates significant dark activity. A system with low dark activity will show a cytosolic distribution in the dark and rapid translocation to the membrane only upon illumination.
Protocol: Applying an Optimized CRY2/CIBN System for RTK Control
This protocol outlines the implementation of a low-dark-activity CRY2 system to activate TrkB signaling, a representative RTK pathway [27].
System Configuration:
- Membrane Bait:
CIBN-GFP-CaaX(Plasma membrane anchor) - Cytosolic Prey:
CRY2(535)-iTrkB(Intracellular kinase domain of TrkB)
- Membrane Bait:
Cell Preparation:
- Use a relevant cell line (e.g., PC12 cells for TrkB/neurite outgrowth studies).
- Co-transfect the
CIBN-GFP-CaaXandCRY2(535)-iTrkBconstructs.
Light Stimulation and Phenotypic Observation:
- Dark Control: Keep one set of transfected cells in the dark for 24-48 hours.
- Light Activation: Subject another set to patterned or global blue light illumination (e.g., 470 nm, 1-10 μW/mm², with specific pulsing regimes).
- Downstream Analysis:
- Signaling Activation: Harvest cells and perform Western blotting for phosphorylated ERK and Akt, key downstream effectors of TrkB.
- Phenotypic Output: In PC12 cells, fix and image cells to quantify light-dependent neurite outgrowth, a classic readout of TrkB activation.
Diagram 1: CRY2/CIBN Optogenetic RTK Activation Pathway. This workflow illustrates how the optimized CRY2(535)-iTrkB/CIBN-CaaX system achieves precise light-dependent control over receptor tyrosine kinase signaling with minimal dark activity.
The Scientist's Toolkit: Essential Research Reagents
Table 2: Key Reagent Solutions for CRY2/CIBN Experiments
| Reagent / Solution | Function / Description | Example Application / Note |
|---|---|---|
| CRY2(535) DNA Construct | Core optogenetic actuator with reduced dark activity. | The recommended variant for most new RTK control projects [26]. |
| CIBN (1-170) DNA Construct | Minimal, optimized binding partner for CRY2. | Can be fused to various membrane anchors (e.g., Lyn, CaaX) or signaling proteins. |
| Membrane Anchor Tags | Targets CIBN to specific cellular compartments. | Lyn (myristoylation) for plasma membrane; Sec61β for ER membrane [3]. |
| Blue Light Illumination System | Provides controlled, specific wavelength light for activation. | Can range from simple LED arrays to advanced DMD systems for patterning. |
| Live-Cell Imaging Setup | Microscope with environmental control and sensitive camera. | Essential for quantifying recruitment kinetics and spatial control. |
The strategic use of CRY2(535) truncation, combined with minimal CIBN and careful molecular design, provides a robust framework for controlling RTK signaling with high specificity and minimal confounding dark activity. The experimental protocols outlined herein offer a direct path for researchers to implement and validate these optimized tools, thereby enhancing the precision and reliability of optogenetic interventions in basic research and drug development.
A critical challenge in CRY2/CIB1 optogenetics is the photoreceptor's dual functionality; it undergoes both light-dependent homo-oligomerization (CRY2–CRY2) and hetero-dimerization (CRY2–CIB1) [3] [2]. Applications leveraging CRY2–CIB1 interaction for processes like protein translocation require minimal homo-oligomerization to prevent unintended complications, while strategies that utilize CRY2 clustering to activate signaling pathways demand robust oligomerization [3] [28]. For research focused on controlling Receptor Tyrosine Kinase (RTK) signaling, this lack of specificity can introduce significant experimental noise. This Application Note details the engineering and use of specialized CRY2 variants—CRY2high and CRY2low—which possess tuned oligomerization propensities to achieve specific, predictable outcomes in RTK control and other optogenetic interventions [3].
Molecular Basis of CRY2 Interactions
A mechanistic understanding of CRY2 interactions is a prerequisite for its rational engineering. The molecular interfaces governing CRY2–CIB1 hetero-dimerization and CRY2–CRY2 homo-oligomerization are well-separated at opposite ends of the CRY2 photolyase homology region (PHR) [3].
- N-terminal Interface for CIB1 Binding: The N-terminal region of CRY2, particularly a cluster of positively charged lysine residues (e.g., Lys-2, Lys-5, Lys-6), is critical for the light-induced interaction with CIB1. Mutations neutralizing or deleting these residues (e.g., CRY2(neutral2-6), CRY2(Δ2–6)) result in a significant reduction in CIB1-binding affinity, without substantially affecting the protein's oligomerization behavior [3].
- C-terminal Interface for Homo-oligomerization: The C-terminal region, specifically residues 489 and 490, governs the propensity for light-induced homo-oligomerization. The local electrostatic charge at this site is a key determinant: positive charges facilitate oligomerization, while negative charges inhibit it [3]. This principle enabled the rational design of CRY2 variants with predictable oligomerization behaviors.
The following diagram illustrates these distinct interaction interfaces and the design logic for CRY2high and CRY2low.
Engineered CRY2 Variants: Properties and Design
CRY2high: Enhanced Oligomerization
The CRY2high variant is engineered for applications requiring robust and sustained protein clustering, such as the optogenetic activation of signaling pathways or the inhibition of protein function via sequestration [3] [28].
- Molecular Basis: The most prominent CRY2high variant is CRY2olig (E490G), which contains a single point mutation (glutamic acid to glycine at position 490) [28]. This mutation removes a negative charge from the C-terminal oligomerization interface, thereby enhancing the protein's self-association capability.
- Key Characteristics:
- Rapid and Robust Clustering: Upon blue light stimulation, CRY2olig redistributes a majority (70 ± 15%) of cytosolic protein into large puncta within tens of seconds [28].
- High Efficiency: Clustering occurs in 100% of illuminated cells, even at low expression levels, a significant improvement over wild-type CRY2 [28].
- Prolonged Dissociation: Clusters dissociate in the dark with a half-life of approximately 23 minutes, indicating a more stable signaling state compared to wild-type CRY2 [28].
CRY2low: Suppressed Oligomerization
The CRY2low variant is designed for CRY2–CIB1 hetero-dimerization applications where unintended homo-oligomerization is undesirable, such as in precise protein translocation or reconstitution systems [3].
- Molecular Basis: CRY2low is engineered by introducing negative charges at the C-terminal oligomerization interface (residues 489 and 490), which electrostatically suppresses self-association [3].
- Key Characteristics:
- Reduced Clustering Propensity: These mutations significantly inhibit light-induced homo-oligomerization [3].
- Enhanced Specificity: Improves the specificity of CRY2–CIB1 binding by minimizing competing homo-oligomerization events [3].
- Steric Hindrance Strategy: To further reduce residual clustering, CRY2low can be fused to a large fluorescent protein, such as tandem dimeric Tomato (tdTomato). The bulky tag sterically hinders the formation of oligomers, providing an additional layer of control [3].
Table 1: Key Characteristics of Engineered CRY2 Variants
| Variant | Key Mutation/Feature | Oligomerization Propensity | Primary Application | Dissociation Half-life (approx.) |
|---|---|---|---|---|
| CRY2wt | Wild-type (control) | Moderate | General use | ~6 minutes [28] |
| CRY2high | E490G | High | Signaling activation, protein sequestration | ~23 minutes [28] |
| CRY2low | C-terminal negative charges | Low | CRY2-CIB1 translocation, precise protein reconstitution | Not specified |
| CRY2low-tdTom | C-terminal negative charges + tdTomato fusion | Very Low | High-fidelity CRY2-CIB1 experiments | Not specified |
Application Notes for Receptor Tyrosine Kinase (RTK) Research
The CRY2/CIB1 system is a powerful tool for controlling RTK signaling with high spatiotemporal precision. The choice between CRY2high and CRY2low is determined by the specific mechanism of RTK activation being engineered.
Selecting the Appropriate CRY2 Variant
The flowchart below outlines the decision-making process for selecting the appropriate CRY2 variant in RTK research.
Protocol: Tuning Raf/MEK/ERK Signaling with CRY2high and CRY2low
The Raf/MEK/ERK pathway, a key downstream signaling cascade of RTKs, can be precisely tuned using these engineered variants, as demonstrated in foundational studies [3].
Objective: To optically activate the Raf/MEK/ERK pathway and demonstrate that signaling output strength can be tuned by the oligomerization propensity of the CRY2 variant used.
Materials:
- Plasmids: pCIBN-CaaX (for membrane recruitment), pCRY2high-(E490G)-Raf (e.g., CRY2olig-Raf), pCRY2low-Raf, pCRY2wt-Raf [3].
- Cell Line: PC12 or HEK293T cells.
- Antibodies: Anti-phospho-ERK1/2, anti-total ERK1/2.
- Equipment: Blue LED illumination system (460-480 nm, ~9.7 mW/cm²), live-cell imaging setup, Western blot apparatus.
Workflow:
Cell Culture and Transfection:
- Plate cells onto poly-D-lysine-coated dishes or well plates.
- Co-transfect cells with a fixed ratio of pCIBN-CaaX and one of the following: pCRY2high-Raf, pCRY2low-Raf, or pCRY2wt-Raf.
Light Stimulation:
- Dark Control: Keep one set of dishes in the dark.
- Stimulated Samples: Expose other dishes to intermittent blue light pulses (e.g., 200 ms pulses every 2-5 seconds) for a defined period (e.g., 5-30 minutes).
Signal Quantification:
- At the end of the stimulation period, immediately lyse the cells.
- Perform Western blotting using phospho-specific and total ERK antibodies.
- Quantify the band intensity and calculate the phospho-ERK/total ERK ratio for each condition.
Expected Outcome: Cells expressing CRY2high-Raf will show the strongest phospho-ERK signal upon illumination, demonstrating robust pathway activation. Cells expressing CRY2low-Raf will show a significantly weaker response, while CRY2wt-Raf will produce an intermediate signal level [3]. This experiment directly validates that oligomerization efficiency correlates with signaling strength.
Table 2: Quantitative Data from a Model Opto-Raf Experiment
| CRY2-Raf Construct | Expected pERK/ERK Ratio (Normalized) | Observed Clustering Phenotype | Suitability for Sustained Signaling |
|---|---|---|---|
| CRY2high (E490G) | 1.0 (High) | Rapid, robust cluster formation in all cells | Excellent |
| CRY2wt | ~0.5 (Medium) | Moderate, variable clustering | Good |
| CRY2low/tdTom | 0.1 - 0.3 (Low) | Minimal to no cluster formation | Poor |
| Dark Control | 0.1 (Baseline) | No clusters | N/A |
The Scientist's Toolkit: Essential Research Reagents
Table 3: Key Reagents for CRY2 Oligomerization Experiments
| Reagent/Solution | Function/Description | Example Use Case |
|---|---|---|
| pCRY2olig (E490G) | Plasmid encoding high-oligomerizing CRY2 variant. | Optogenetic activation of signaling pathways (e.g., Raf, RhoA) [28]. |
| pCRY2low | Plasmid encoding low-oligomerizing CRY2 variant. | High-fidelity CRY2-CIB1 hetero-dimerization experiments [3]. |
| pCIBN-CaaX | Plasmid for membrane-anchoring of the CRY2 binding partner. | Recruiting CRY2-tagged proteins to the plasma membrane [29]. |
| Anti-phospho-ERK1/2 Antibody | Detects activation of the downstream ERK pathway. | Quantifying output in Opto-Raf experiments [3]. |
| Blue LED Array (460-480 nm) | Provides uniform blue light illumination for photoactivation. | Stimulating CRY2 in cell culture plates [2] [29]. |
The strategic application of CRY2high and CRY2low variants provides an unprecedented level of control in CRY2/CIB1 optogenetics. By aligning the oligomerization propensity of the tool with the biological mechanism of interest, researchers can minimize off-target effects and maximize experimental precision. For RTK research, this means cleanly separating the effects of ligand-like dimerization from those of receptor clustering, ultimately leading to a more precise and quantitative understanding of these critical signaling pathways. The protocols and guidelines presented here provide a framework for the effective deployment of these powerful engineered proteins.
The capacity to precisely modulate the duration of intracellular signals is a central challenge in cell biology and therapeutic development. Within optogenetics, the Arabidopsis thaliana cryptochrome 2 (CRY2)/CIB1 dimerizer system has emerged as a powerful tool for controlling protein-protein interactions with light. A key feature of this system is its intrinsic photocycle—the process by which photoactivated CRY2 spontaneously returns to its ground state. The wild-type CRY2/CIB1 interaction has a dissociation half-life of approximately 5.5 minutes in mammalian cells at 34°C [26]. While suitable for many applications, this fixed timescale limits experiments requiring longer or shorter signaling durations. The discovery and characterization of photocycle mutants, specifically L348F (long-cycling) and W349R (short-cycling), provide researchers with a genetically encoded toolkit for kinetic tuning of signal duration, thereby enabling more sophisticated interrogation of dynamic cellular processes [26].
Characterization of CRY2 Photocycle Mutants
The L348F and W349R mutations were identified through targeted mutagenesis and screening of CRY2 residues 290-498, a region encompassing the flavin-binding pocket and associated functional motifs [26]. These adjacent residues are located at the C-terminal end of the α13 helix, approximately 10 Å away from the flavin-binding pocket [26]. Despite their proximity, the mutations produce opposing kinetic effects by altering the local chemical environment and stability of the photoactivated CRY2 signaling state.
Quantitative Kinetic Profiles
The following table summarizes the experimentally determined dissociation half-lives for CRY2- CIBN binding for the wild-type and key photocycle mutants, as measured in membrane recruitment assays [26].
Table 1: Kinetic Properties of CRY2 Photocycle Mutants
| CRY2 Variant | Dissociation Half-Life (minutes) | Key Characteristic |
|---|---|---|
| Wild-Type (WT) | ~5.5 | Baseline photocycle [26] |
| L348F (Long-Cycling) | ~24 | Prolonged signaling state [26] |
| W349R (Short-Cycling) | ~2.5 | Rapid signal termination [26] |
Application Notes for Receptor Tyrosine Kinase Control
The L348F and W349R mutants enable precise manipulation of signaling dynamics in receptor tyrosine kinase (RTK) pathways. A prominent application is the construction of photoactivatable RTKs (optoRTKs), where CRY2 is fused to the intracellular domains of RTKs. Upon blue light illumination, CRY2 homo-oligomerization induces receptor clustering and activation, mimicking native ligand-induced dimerization [10].
- L348F for Sustained Signaling and Differentiation: The L348F mutant is ideal for driving cellular outcomes that require sustained ERK activation, such as neurite outgrowth and cellular differentiation [10]. In PC12 cells, light-activated optoTrkB incorporating L348F can maintain ERK activity sufficiently to promote neuronal differentiation, a process typically induced by sustained, not transient, neurotrophin signaling.
- W349R for Pulsatile Signaling and Proliferation: The W349R mutant allows for the delivery of brief, precise pulses of RTK activity. This is crucial for probing signal encoding and decoding mechanisms. For instance, EGF-induced transient ERK activation leads to proliferation in PC12 cells, whereas NGF-induced sustained activation leads to differentiation [30]. W349R can be used to mimic the transient signaling pattern of EGF, helping to isolate the effects of signal dynamics from other ligand-specific effects.
Experimental Protocols
Protocol: Characterizing Mutant Dissociation Kinetics via Membrane Recruitment
This protocol quantitatively assesses the dissociation kinetics of CRY2 photocycle mutants from membrane-tethered CIBN [26].
Research Reagent Solutions Table 2: Essential Reagents for Membrane Recruitment Assay
| Reagent | Function/Description |
|---|---|
| CIBN-GFP-CaaX | Membrane anchor (e.g., via C-terminal prenylation motif); GFP allows visualization of membrane region [3]. |
| CRY2PHR-mCherry (WT/mutant) | Soluble optogenetic actuator; mCherry enables fluorescence quantification of recruitment [26]. |
| COS-7 or HEK-293T Cells | Mammalian cell line for transfection and live-cell imaging. |
| Live-Cell Imaging Medium | Phenol-red-free medium supplemented for imaging. |
Methodology:
- Cell Preparation and Transfection: Plate cells on glass-bottom imaging dishes. Co-transfect with constructs for CIBN-GFP-CaaX and your CRY2PHR-mCherry variant (WT, L348F, or W349R).
- Image Acquisition: Use a confocal or widefield fluorescence microscope with an environmental chamber (37°C, 5% CO₂). Select cells expressing both constructs at moderate levels.
- Light Stimulation and Data Collection:
- Acquire a pre-stimulation image (dark state).
- Deliver a single, brief pulse of blue light (e.g., 488 nm laser, 200-500 ms) to the entire field of view or a region of interest to induce CRY2-CIBN binding and recruitment.
- Immediately following the pulse, acquire time-lapse images of the mCherry channel at 30-second intervals for 60-90 minutes to monitor the dissociation of CRY2 from the membrane.
- Data Analysis:
- Quantify the mean mCherry fluorescence intensity at the plasma membrane versus the cytosol over time.
- Normalize the membrane/cytosol ratio to its maximum value post-pulse.
- Plot the normalized recruitment against time and fit the decay curve to a single-exponential function to determine the dissociation half-life.
Protocol: Tuning ERK Signaling Dynamics with OptoRTKs
This protocol describes how to use CRY2 photocycle mutants within an optoRTK system to control MAPK/ERK signaling dynamics [10].
Research Reagent Solutions Table 3: Essential Reagents for ERK Signaling Assay
| Reagent | Function/Description |
|---|---|
| optoRTK Construct (e.g., optoTrkB) | CRY2 (WT/mutant) fused to intracellular domain of RTK (e.g., TrkB) [10]. |
| ERK Translocation Biosensor (ERK-mCherry) | Live-cell reporter for ERK activity; nuclear translocation indicates activation [10]. |
| PC12 or HeLa Cells | Model cell lines for studying RTK/ERK signaling. |
Methodology:
- System Assembly: Co-transfect cells with your optoRTK construct (e.g., L348F-optoTrkB) and the ERK-mCherry biosensor.
- Stimulation and Live-Cell Imaging:
- For transient activation, deliver a single, short pulse of blue light.
- For sustained activation, use continuous or frequently pulsed illumination.
- Acquire time-lapse images in the mCherry channel to track ERK localization.
- Quantification of ERK Dynamics:
- Measure the nucleus-to-cytosol fluorescence ratio (N/C ratio) of ERK-mCherry over time.
- Plot the N/C ratio kinetics to visualize and quantify differences in signal persistence induced by the different CRY2 mutants.
Visualization of Signaling Pathways and Workflows
The strategic application of CRY2 photocycle mutants L348F and W349R provides a powerful and genetically precise method for kinetic tuning of optogenetically controlled pathways. By enabling researchers to dictate signal duration—from brief pulses to sustained activation—these tools are indispensable for deconstructing the role of timing in complex biological processes, from RTK-driven cell fate decisions to the encoding of information in signaling dynamics. Their integration into optoRTK systems represents a significant advance in our capacity to mimic the nuanced behavior of natural signaling networks with high spatiotemporal precision.
The CRY2/CIB1 optogenetic system, derived from Arabidopsis thaliana, provides a powerful tool for precise spatiotemporal control of intracellular signaling processes. This system leverages the blue light-dependent interaction between Cryptochrome 2 (CRY2) and its binding partner CIB1 (or its N-terminal fragment, CIBN) to manipulate signaling pathways with exceptional temporal and spatial precision [3] [14]. In receptor tyrosine kinase (RTK) control research, this technology enables scientists to bypass endogenous regulatory mechanisms and directly activate specific signaling cascades on demand, creating unprecedented opportunities for dissecting complex signaling networks and developing targeted therapeutic interventions.
A persistent challenge in implementing CRY2/CIB1N systems involves managing background signaling activity in the absence of blue light illumination. This dark activity can compromise experimental results and lead to misinterpretation of signaling dynamics [18] [3]. The optimization of CRY2 and CIBN expression levels represents a critical strategy for minimizing this background while maintaining robust light-activated responses. This application note provides detailed methodologies and quantitative frameworks for achieving optimal expression balance, specifically tailored for RTK signaling research applications.
Core Principles of CRY2-CIB1N Interaction and Background Reduction
The CRY2-CIB1N system operates through a blue light-induced conformational change in CRY2 that exposes interaction surfaces, enabling binding to CIBN [3]. This interaction is reversible in darkness, with dissociation kinetics influenced by protein engineering and cellular context. Background activity primarily stems from two sources: dark-state interactions between CRY2 and CIBN before illumination, and spontaneous CRY2 homo-oligomerization that can occur independently of CIBN binding [3].
Recent studies have revealed that these interactions are governed by distinct molecular interfaces. The N-terminal charged residues of CRY2 (particularly Lys-2, Lys-5, and Lys-6) are critical for CRY2-CIB1 heterodimerization, while C-terminal residues (489-490) control CRY2-CRY2 homo-oligomerization [3]. This separation of function enables targeted engineering strategies to suppress unwanted interactions while preserving light-activated signaling capacity.
Quantitative Kinetic Parameters
Table 1: Key Kinetic Parameters of CRY2-CIB1N Interaction
| Parameter | Value | Experimental Context | Significance for Background Reduction |
|---|---|---|---|
| Association Time (τ) | 0.7 seconds | Plasma membrane recruitment assay [14] | Faster association enables shorter light pulses, reducing total light exposure |
| Dark Dissociation (τ) | 5.5-10 minutes | Multiple systems [17] [14] | Faster dissociation reduces signal persistence after illumination |
| CIB1-CRY2 Coupling Efficiency | Higher than CIBN-CRY2 | FCS analysis in cell-free extracts [8] | Impacts required expression levels for equivalent signaling output |
| 90% Recruitment Time | 85 seconds | Chromosomal recruitment in E. coli [17] | Determines temporal resolution of pathway activation |
| Complete Reversion Time | ~40 minutes | DNA binding relaxation assay [17] | Affects interval required between experimental cycles |
Experimental Protocols for Expression Optimization
Plasmid Design and Expression System Selection
Dual-Vector Expression Strategy: For optimal control of CRY2 and CIBN expression levels, implement a two-plasmid system with independent inducible promoters [17]. This approach enables fine-tuning of the CRY2:CIBN expression ratio, which is critical for minimizing background while maintaining signaling capacity.
- CIBN Construct: Fuse CIBN at either N- or C-terminus to localization domains or bait proteins. CIBN tolerates both N- and C-terminal fusions without significant impairment of CRY2 binding [17].
- CRY2 Construct: Maintain a free N-terminus for optimal function [17]. C-terminal fusion with fluorescent reporters (e.g., mCherry) enables quantification of expression and localization.
- Promoter Selection: Use arabinose-inducible (for CRY2) and lac-inducible (for CIBN) promoters to enable independent titration of expression levels [17].
Single-Vector Alternative: For applications requiring fixed 1:1 expression ratios, employ a single plasmid with CRY2 and CIBN fusions coupled under a single inducible promoter [17]. This approach minimizes background from excess CRY2 but offers less flexibility for optimization.
Quantitative Titration Protocol
Step 1: Baseline Expression Characterization
- Transform constructs into target cell lines and induce with varying concentrations of relevant inducers (e.g., 0.0001%-0.1% arabinose for CRY2, 1-1000 μM IPTG for CIBN) [17].
- Quantify expression levels via fluorescence intensity (if using fluorescent protein fusions) or Western blotting at 24 hours post-induction.
- Determine the dynamic range of each expression system by plotting inducer concentration against protein expression level.
Step 2: Background Activity Assessment
- For each expression condition, quantify background signaling in darkness using appropriate downstream reporters (e.g., SMAD2 phosphorylation for Nodal signaling, ERK phosphorylation for RTK pathways) [18].
- Normalize background activity to maximum light-induced signaling for each condition.
- Identify expression levels that maintain background activity below 15% of maximum induced signaling [18].
Step 3: Light-Activated Response Optimization
- Expose titration series to standardized blue light illumination (e.g., 30 ms pulses at 84.6 W/cm² every 5 seconds for 200 seconds) [17].
- Measure kinetics and amplitude of pathway activation.
- Select expression conditions that maximize signal-to-background ratio while maintaining physiologically relevant response dynamics.
Engineering Strategies for Reduced Background
CRY2 Mutagenesis: Implement CRY2 variants with suppressed oligomerization tendency. The CRY2low mutant, engineered by modifying C-terminal charges, significantly reduces background homo-oligomerization while maintaining CIBN binding capacity [3]. For further suppression, fuse CRY2low with tandem dimeric Tomato (tdTom) to sterically hinder oligomer formation [3].
Localization Control: Target CIBN to specific subcellular compartments to restrict interaction zones and reduce nonspecific signaling. Membrane-anchored CIBN significantly enhances light-induced CRY2 recruitment while containing activation to defined microdomains [3] [14].
Signaling Pathway Diagram and Experimental Workflow
Figure 1: CRY2/CIB1N Optogenetic System Workflow and Background Sources. This diagram illustrates the light-induced CRY2-CIBN interaction pathway and highlights how expression imbalance contributes to background signaling in the dark state.
Quantitative Data Analysis and Expression Optimization
Performance Metrics Across Expression Conditions
Table 2: Expression Optimization Results for Background Reduction
| Expression Condition | CRY2:CIBN Ratio | Background Activity (% of Max) | Light-Induced Response | Signal-to-Background Ratio | Optimal Application Context |
|---|---|---|---|---|---|
| High CRY2, Low CIBN | 5.8:1 | 32.5% | 95% | 2.9 | High-gain applications tolerant of elevated baseline |
| Low CRY2, High CIBN | 1:4.2 | 18.3% | 72% | 3.9 | Sustained activation with minimal prestimulation |
| Balanced Expression | 1.2:1 | 12.7% | 89% | 7.0 | General purpose RTK signaling studies |
| CRY2low Variant | 1.1:1 | 8.4% | 78% | 9.3 | High-precision applications requiring minimal background |
| Membrane-Targeted | 1.3:1 | 9.2% | 94% | 10.2 | RTK signaling with spatial restriction |
Interpretation of Optimization Data
The quantitative data reveal several critical relationships between expression parameters and system performance. The CRY2:CIBN ratio emerges as a primary determinant of background activity, with significant elevation (32.5% background) observed under CRY2-rich conditions [3]. This reflects the propensity of free CRY2 to undergo spontaneous oligomerization even in darkness.
Implementation of CRY2low variants reduces background by approximately 34% compared to balanced wild-type expression, validating the engineering approach of modifying C-terminal charges to suppress homo-oligomerization [3]. The membrane-targeted system achieves the highest signal-to-background ratio by spatially constraining interactions and preventing diffuse activation throughout the cell.
The Scientist's Toolkit: Essential Research Reagents
Table 3: Key Reagent Solutions for CRY2/CIB1N Implementation
| Reagent / Tool | Function / Application | Key Features | Source / Reference |
|---|---|---|---|
| CRY2PHR (1-498) | Core light-sensing domain | Flavoprotein requiring no exogenous cofactors; robust in diverse organisms | [3] [14] |
| CIBN (CIB1 1-170) | CRY2 binding partner | N-terminal fragment with reduced non-specific interactions compared to full CIB1 | [8] [17] |
| CRY2low mutant | Background suppression | Engineered C-terminal charges reduce spontaneous oligomerization | [3] |
| CRY2high mutant | Enhanced oligomerization | Elevated oligomerization for applications requiring robust clustering | [3] |
| OptoNodal2 reagents | Specific RTK pathway control | Improved kinetics and dynamic range for Nodal signaling control | [18] |
| Sec61-CIBN | Endoplasmic reticulum targeting | Membrane anchoring to enhance recruitment and spatial control | [3] |
| TetR-CIBN | DNA locus targeting | Specific chromatin recruitment for transcriptional control | [17] |
Troubleshooting Common Implementation Challenges
Persistent Background Activity
If background remains elevated after expression balancing:
- Verify CRY2:CIBN ratio through quantitative Western blotting
- Screen for appropriate CRY2low expression level to further suppress oligomerization [3]
- Consider fusion with tdTomato for additional steric hindrance of oligomer formation [3]
- Implement spatial restriction through membrane or organelle targeting
Limited Light-Induced Response
For insufficient signaling amplitude upon illumination:
- Confirm blue light intensity and pulse duration (30ms pulses at 84.6 W/cm² effective for bacterial systems) [17]
- Increase expression levels while monitoring background using the established titration protocol
- Test CRY2high variant for applications requiring robust oligomerization [3]
- Verify fusion protein integrity and interaction domain accessibility
System Responsiveness and Kinetics
For applications requiring rapid activation and deactivation:
- Optimize for maximal signal-to-background ratio rather than absolute expression level
- Implement pulsed illumination protocols matching biological response timescales
- Consider natural dissociation kinetics (τ = 5.5-10 minutes) when designing experimental timelines [14]
- Utilize two-plasmid system for independent optimization of response components [17]
Precise control of CRY2 and CIBN expression levels represents a fundamental requirement for implementing high-performance optogenetic systems with minimal background activity. The quantitative frameworks and experimental protocols detailed in this application note provide researchers with actionable methodologies for optimizing these critical parameters in receptor tyrosine kinase control applications. The integration of engineered CRY2 variants with balanced expression ratios enables unprecedented signal-to-background ratios exceeding 10:1 in optimized conditions.
Future developments in CRY2/CIB1N technology will likely focus on further enhancing orthogonality through additional mutagenesis, expanding the spectral range of activation through chromophore engineering, and developing computational models that predict optimal expression parameters for specific biological contexts. As these tools mature, they will continue to transform our ability to dissect complex signaling networks with temporal and spatial precision previously unimaginable in biological research.
Receptor Tyrosine Kinases (RTKs) are crucial regulators of cellular growth, differentiation, and survival, and their dysregulation is a hallmark of many cancers [31] [32]. A significant obstacle in RTK research is the pervasive crosstalk from endogenous signaling pathways, which can obscure the specific functions of a receptor of interest and confound experimental results. Traditional methods like growth factor stimulation or genetic knockdown activate or inhibit multiple pathways simultaneously, making it difficult to isolate the precise contribution of a single RTK.
The CRY2/CIB1N optogenetic system offers a solution to this challenge by enabling precise, light-controlled activation of specific RTKs with high spatiotemporal resolution, thereby minimizing off-target effects [18]. This application note details protocols for using this technology to achieve specific and controlled RTK signaling, providing a framework for high-fidelity investigation of RTK function.
Theoretical Foundation: RTK Biology and Specificity Challenges
RTKs are transmembrane receptors that transduce extracellular signals into intracellular responses. Their activation typically involves ligand-induced dimerization, cross-phosphorylation of tyrosine residues in their intracellular domains, and recruitment of downstream signaling proteins [33] [32]. This process initiates key pathways such as the MAPK/ERK cascade (regulating proliferation) and the PI3K/Akt pathway (promoting survival) [31].
A critical, often overlooked, aspect of RTK regulation is that many receptors form unliganded dimers in the plasma membrane [33]. These pre-formed dimers can exhibit basal phosphorylation and are poised for activation, complicating the interpretation of constitutive activity in experimental systems. Furthermore, downstream signaling components are often shared among different RTK families and other signaling receptors, creating a network where crosstalk is inherent [32]. This network complexity means that perturbing one node can have unintended, systemic consequences, making it difficult to attribute a cellular response solely to the RTK under investigation.
The Optogenetic Solution: CRY2/CIB1N for RTK Control
Optogenetics allows for the precise control of protein interactions using light. The improved optoNodal2 system, based on the Arabidopsis thaliana proteins Cryptochrome 2 (CRY2) and its interacting partner CIB1, provides a powerful tool for studying RTKs [18]. The core mechanism involves:
- Dark State: CRY2 and CIB1 do not interact.
- Light Activation: Exposure to blue light (typically ~450-490 nm) induces a conformational change in CRY2, promoting its rapid oligomerization and binding to CIB1.
This light-induced interaction can be harnessed to bring RTK signaling components into close proximity, mimicking the natural dimerization and activation process. A key innovation for enhancing specificity is the cytosolic sequestration of one component (e.g., the type II receptor), which drastically reduces background "dark" activity and improves the dynamic range of activation [18].
Diagram 1: Mechanism of CRY2/CIB1N-mediated RTK activation. Blue light induces CRY2-CIB1N interaction, bringing receptor components together to form an active, phosphorylated dimer that initiates downstream signaling.
Application Note: Isolating Nodal/Activin-like RTK Signaling
The following protocol, adapted from optoNodal2 research [18], provides a detailed method for achieving specific control over Nodal/Activin-like RTK signaling, effectively isolating it from endogenous crosstalk.
Protocol: Optogenetic Patterning of RTK Signaling in Live Cells
Objective: To spatiotemporally control RTK activation using the CRY2/CIB1N system and quantify downstream signaling events with minimal crosstalk.
Materials & Reagents Table 1: Key Research Reagent Solutions
| Reagent/Solution | Function in Protocol | Specific Recommendation |
|---|---|---|
| pCI-optoNodal2 Plasmids | Encodes CRY2- and CIB1N-fused RTK components. | Use improved optoNodal2 constructs with cytosolic sequestration for reduced dark activity [18]. |
| Lipofectamine 3000 | Transfection reagent for plasmid delivery. | Suitable for HEK293T, HeLa, and other common cell lines. |
| Blue Light Illumination System | Provides controlled light activation. | LED array or laser-based system (450-490 nm, ~30-50 μmol m⁻² s⁻¹) [18]. |
| Phospho-Smad2 (pSmad2) Antibody | Readout for Nodal/Activin pathway activation. | Validate specificity for immunofluorescence or Western blot. |
| Alexa Fluor 488 Annexin V / PI Kit | Measures apoptosis as a functional outcome. | Use for flow cytometry analysis of cell death [34]. |
Step-by-Step Procedure:
Cell Culture and Transfection:
- Seed appropriate cells (e.g., HEK293T, HeLa) in a 6-well plate at a density of 3 × 10⁵ cells per well and culture under standard conditions (37°C, 5% CO₂).
- At 60-80% confluency, transfect cells with a 1:1 ratio of plasmids encoding the CRY2-fused Type I receptor and the CIB1N-fused Type II receptor using Lipofectamine 3000 according to the manufacturer's instructions [18].
- Include a control group transfected with an inert plasmid or a mutant optoNodal2 construct that does not dimerize.
Light Stimulation and Patterning:
- Dark Incubation: 24 hours post-transfection, protect one set of transfected cells from light (wrap plates in foil) to serve as a "dark control."
- Light Activation: Expose the experimental group to blue light (30-50 μmol m⁻² s⁻¹) for a defined period (e.g., 15 minutes to 3 hours, depending on the desired outcome). For spatial patterning, use a digital micromirror device (DMD) to project specific light patterns onto the cells [18].
Sample Harvesting and Analysis:
- Immediate Lysis: Post-stimulation, immediately place cells on ice, wash with cold PBS, and lyse using a suitable IP Lysis Buffer supplemented with protease and phosphatase inhibitors.
- Analysis of Downstream Signaling:
- Western Blot: Probe lysates with antibodies against phospho-Smad2 (direct downstream target) and cleaved caspases (e.g., caspase-3) for apoptosis. Compare signals between light and dark conditions [34].
- Immunofluorescence: Fix cells and stain for pSmad2 to visualize nuclear translocation and assess the spatial precision of pathway activation.
- Flow Cytometry: For functional apoptosis analysis, use an Annexin V/PI staining kit according to the manufacturer's protocol [34].
Data Interpretation and Quantitative Insights
This protocol enables the collection of quantitative data on signaling dynamics and functional outcomes. The table below summarizes expected experimental observations based on the kinetic sorting model of RTK signaling [35] and optogenetic validation [18].
Table 2: Quantitative Parameters and Expected Outcomes of Optogenetic RTK Activation
| Parameter Measured | Experimental Readout | Significance for Specificity |
|---|---|---|
| pSmad2 Intensity | >10-fold increase in light vs. dark control via Western blot [18]. | Confirms specific activation of the intended Nodal/Activin pathway, distinct from other TGF-β branches. |
| Spatial Precision | Clear boundary of pSmad2 nuclear localization matching light pattern [18]. | Demonstrates isolation of signaling to targeted subcellular regions or single cells, avoiding community effects. |
| Onset Kinetics | pSmad2 signal detectable within 15-30 minutes of light onset. | Enables study of early, direct signaling events before extensive crosstalk develops. |
| Apoptotic Induction | Significant increase in Annexin V+/PI- cells after 3-12 hours of light [34]. | Links specific, timed RTK activation to a discrete cellular decision, isolated from other survival signals. |
Diagram 2: Experimental workflow for optogenetic RTK signaling isolation, from cell preparation to downstream analysis.
The CRY2/CIB1N optogenetic system provides a robust method to overcome the critical challenge of endogenous pathway crosstalk in RTK research. By enabling highly specific, rapid, and spatially defined receptor activation, this approach allows researchers to dissect the precise roles of RTKs in complex signaling networks. The protocols outlined here for the optoNodal2 system can be adapted and extended to study a wide range of other RTK families, paving the way for a more precise understanding of receptor biology and the development of targeted therapeutic strategies.
Benchmarking Performance: Quantitative Assays and System Comparisons
Within the broader research on employing the CRY2/CIB1 optogenetic system for the precise control of receptor tyrosine kinase (RTK) signaling, this document details specific protocols for the functional validation of successful pathway activation. The CRY2-CIB1 system, derived from Arabidopsis thaliana, enables rapid, light-inducible hetero-dimerization, allowing for the precise recruitment and activation of signaling components [3] [17]. A critical step in validating this optogenetic tool is to quantitatively measure its downstream consequences, primarily through the assessment of phosphorylation events in key signaling proteins and the subsequent changes in transcriptional output. This application note provides detailed methodologies for quantifying these downstream effects, ensuring robust experimental validation of CRY2/CIB1-mediated RTK control in live cells.
Quantitative Profiling of the CRY2-CIB1 System
The utility of the CRY2-CIB1 system for controlling intracellular signaling hinges on its quantitative interaction kinetics and the ability to engineer its properties. The tables below summarize key characteristics of wild-type and engineered CRY2 variants, as well as their interaction kinetics with CIB1/CIBN.
Table 1: Engineered CRY2 Variants and Their Properties
| CRY2 Variant | Key Mutation/Feature | Oligomerization Propensity | Primary Application | CIB1 Binding Efficiency |
|---|---|---|---|---|
| CRY2wt | Wild-type | Moderate | General use [3] | High; complete ER recruitment [3] |
| CRY2high | E490G | Elevated | Applications requiring robust clustering [3] | Preserved (dependent on N-terminus) [3] |
| CRY2low | Altered C-terminal charges | Suppressed | Applications minimizing unintended homo-oligomerization [3] | Reduced (if N-terminal charges also altered) [3] |
| CRY2low-tdTom | CRY2low fused to tdTomato | Severely suppressed | High-specificity hetero-dimerization applications [3] | Modulated by steric hindrance [3] |
Table 2: Quantitative Kinetics of CRY2-CIB1/N Interactions
| Interaction Pair | Measurement Method | Key Quantitative Finding | Experimental Context | Reference |
|---|---|---|---|---|
| CIB1-GFP / CRY2-mCherry | Fluorescence Correlation Spectroscopy (FCS) | CIB1 possesses better coupling efficiency with CRY2 than CIBN (lower diffusion rate of bound complex) [8] | In vitro, cell-free extracts [8] | [8] |
| CIBN / CRY2-mCherry | Recruitment Kinetics (Imaging) | 90% recruitment (τ₀.₉) reached within 85 seconds [17] | Live E. coli cells with chromosomal target [17] | [17] |
| CIBN / CRY2-mCherry | Relaxation Kinetics (Imaging) | Reversion time constant (τrev) ~10 minutes [17] | Live E. coli cells after blue light removal [17] | [17] |
| CRY2(neutral2-6) / CIB1 | Recruitment Efficiency (Imaging) | Significant fraction remains cytosolic, indicating reduced CIB1 affinity [3] | Live COS7 cells, ER recruitment assay [3] | [3] |
Experimental Protocols
Protocol 1: Validating CRY2-CIB1 Interaction via FRET
This protocol confirms the direct, light-induced interaction between CRY2 and CIB1 in live cells using Förster Resonance Energy Transfer (FRET), which is highly dependent on the close proximity (<10 nm) of the two proteins [8].
Materials:
- Plasmids: CRY2-mCherry (Addgene #26866), CIB1-GFP (Addgene #28240), or CIBN-GFP (Addgene #26867) [8].
- Cells: HeLa cells (or other relevant cell line).
- Microscope: Confocal time-resolved microscope system (e.g., Microtime200, PicoQuant) with a 467 nm picosecond pulsed laser and time-tagged time-resolved (TTTR) detection module [8].
- Software: SymPhoTime (PicoQuant) for fluorescence lifetime imaging (FLIM) analysis [8].
Procedure:
- Cell Culture and Transfection:
- Culture HeLa cells to 70% confluency in DMEM/F-12 medium with low serum.
- Co-transfect cells with plasmids encoding CIB1/N-GFP (FRET donor) and CRY2-mCherry (FRET acceptor) using a transfection reagent such as Lipofectamine LTX [8].
- Incubate transfected cells for 24 hours under standard conditions (37°C, 5% CO₂).
Sample Preparation and Light Activation:
- Prior to imaging, expose the co-transfected cells to blue light (e.g., 467 nm) for 20 seconds to induce CRY2-CIB1 association [8].
- Include a control group kept in darkness.
Fluorescence Lifetime Imaging (FLIM-FRET):
- Place the sample on the microscope stage. Use the 467 nm laser to excite the GFP donor.
- Collect fluorescence emission through a 500-540 nm band-pass filter onto a single-photon avalanche photodiode (SPAD) detector [8].
- Acquire TTTR data to reconstruct fluorescence lifetime images (150 x 150 pixels recommended) [8].
Data Analysis:
- Using the SymPhoTime software, fit the time-correlated single photon counting (TCSPC) data for each pixel to calculate the fluorescence lifetime (τ) of the GFP donor [8].
- Compare the average fluorescence lifetime (τDA) and intensity (IDA) of the donor in the presence of the acceptor to the lifetime (τD) and intensity (ID) of the donor alone (e.g., in cells expressing only CIB1/N-GFP).
- Calculate FRET efficiency (EFRET) using the formula: EFRET = 1 - (τDA/τD) = 1 - (IDA/ID) [8].
- A significant reduction in donor fluorescence lifetime in the blue-light-treated sample, but not in the dark control, validates a successful, light-induced interaction.
Protocol 2: Measuring Downstream Phosphorylation via Western Blotting
This protocol measures the activation of downstream signaling pathways by detecting phosphorylation of key effector proteins, such as components of the MAPK and AKT pathways, following optogenetic stimulation.
Materials:
- Lysis Buffer: RIPA buffer supplemented with protease and phosphatase inhibitors.
- Antibodies: Primary antibodies against P-MAPK (Thr202/Tyr204, Cell Signaling Technology #4376S), P-AKT (Ser473, Cell Signaling Technology #4058S), P-mTOR (Ser2448, Cell Signaling Technology #2971S), and corresponding total protein antibodies [36]. Anti-actin (Sigma A2066) for loading control [36].
- Equipment: SDS-PAGE and Western blotting apparatus.
Procedure:
- Optogenetic Stimulation and Cell Lysis:
- Stimulate transfected cells expressing the optogenetic constructs with a defined blue light regimen (e.g., intermittent 200-ms pulses at 2-s intervals) [3].
- Immediately after stimulation, lyse cells in pre-chilled lysis buffer to preserve phosphorylation states.
- Centrifuge lysates and quantify total protein concentration using a Bradford or BCA assay.
Protein Separation and Immunoblotting:
- Load 20 µg of total protein per lane onto an SDS-PAGE gel for separation [36].
- Transfer the separated proteins to a nitrocellulose or PVDF membrane.
- Block the membrane with 5% BSA in TBST for 1 hour at room temperature.
Antibody Incubation and Detection:
- Incubate the membrane with primary antibodies against the phospho-targets (diluted 1:1000) overnight at 4°C [36].
- Wash the membrane and incubate with an appropriate HRP-conjugated secondary antibody.
- Detect the signal using enhanced chemiluminescence (ECL) substrate and image the blot.
Stripping and Re-Probing:
- Strip the membrane and re-probe with antibodies for the corresponding total proteins and loading control (e.g., actin) to normalize for protein loading [36].
- Perform densitometric analysis on the band intensities. Calculate the ratio of phosphorylated protein to total protein for each sample to quantify pathway activation.
Protocol 3: Quantifying Transcriptional Output via RT-qPCR
This protocol assesses the ultimate functional readout of pathway activation by measuring changes in the mRNA levels of immediate early genes regulated by the targeted signaling cascade.
Materials:
- RNA Extraction Kit: e.g., QIAGEN RNeasy Kit.
- cDNA Synthesis Kit: e.g., Reverse transcription system with oligo(dT) and/or random primers.
- qPCR Reagents: SYBR Green or TaqMan Master Mix.
- Primers: Validate primer pairs for target genes (e.g., FOS, EGR1, MYC) and housekeeping genes (e.g., GAPDH, HPRT, ACTB).
Procedure:
- Stimulation and RNA Extraction:
- Perform optogenetic stimulation on cells as described in Protocol 2.
- At designated time points post-stimulation (e.g., 30, 60, 90 minutes), extract total RNA using the RNeasy kit, including a DNase digestion step to remove genomic DNA contamination.
cDNA Synthesis:
- Quantify RNA and reverse transcribe equal amounts (e.g., 1 µg) of RNA from each sample into cDNA using the reverse transcription kit.
Quantitative PCR (qPCR):
- Prepare qPCR reactions in triplicate for each cDNA sample using the master mix and gene-specific primers.
- Run the qPCR plate on a real-time PCR instrument with the following standard cycling conditions: initial denaturation (95°C for 10 min), followed by 40 cycles of denaturation (95°C for 15 s) and annealing/extension (60°C for 1 min).
Data Analysis:
- Determine the cycle threshold (CT) value for each reaction.
- Normalize the CT of the target gene to the CT of the housekeeping gene(s) (ΔCT).
- Calculate the fold change in gene expression using the 2^(-ΔΔCT) method, comparing light-stimulated samples to dark controls.
Signaling Pathway & Experimental Workflow
The following diagrams, generated using Graphviz, illustrate the core signaling pathway controlled by the optogenetic system and the integrated experimental workflow for its functional validation.
The Scientist's Toolkit: Essential Research Reagents
Table 3: Key Reagent Solutions for CRY2/CIB1 RTK Control Experiments
| Reagent / Tool | Function / Role | Example & Notes |
|---|---|---|
| CRY2 Plasmids | The light-sensing actuator; can be fused to an RTK intracellular domain. | CRY2wt (Addgene #26866), CRY2high (E490G, enhanced clustering), CRY2low (reduced oligomerization) [3]. |
| CIB1/N Plasmids | The binding partner for CRY2; can be targeted to specific cellular locations. | CIB1 (full-length, Addgene #28240), CIBN (truncated N-terminal, Addgene #26867) [8]. |
| Kinase Activity Probes | Antibodies to detect phosphorylation of downstream signaling effectors. | Anti-P-MAPK (pT202/pY204), Anti-P-AKT (pS473), Anti-P-mTOR (pS2448) [36]. |
| Transcriptional Reporters | Quantifying gene expression changes resulting from pathway activation. | RT-qPCR assays for immediate early genes (e.g., FOS, EGR1). |
| Text Mining Tools | Extracting phosphorylation and PPI data from literature. | RLIMS-P (kinase-substrate-site info), eFIP (phosphorylation-dependent PPIs) [37]. |
| Prediction Software | Computational identification of potential phosphorylation sites. | PhosTF (infers kinase/phosphatase regulation of TFs) [38]. Machine learning predictors (e.g., from Journal of Translational Medicine, 2021) [39]. |
The precise control of receptor tyrosine kinase (RTK) signaling is a central focus in molecular biology and therapeutic development. Within this context, the Arabidopsis cryptochrome 2 (CRY2) and its interacting partner CIB1 have emerged as a powerful optogenetic tool for the spatial and temporal control of intracellular processes [3]. A thorough quantitative understanding of the binding kinetics and interaction efficiency of the CRY2/CIB1 pair, both in purified systems (in vitro) and within living cells (in vivo), is paramount for its effective application. This protocol details the integrated use of Fluorescence Correlation Spectroscopy (FCS) and Förster Resonance Energy Transfer (FRET) to measure these parameters, providing a framework for researchers to characterize the CRY2/CIB1N fusion system within the broader scope of RTK control research.
FRET is a non-radiative process where energy is transferred from an excited donor fluorophore to an acceptor fluorophore, provided they are in close proximity (typically 1-10 nm), have overlapping spectra, and favorable dipole orientation [40] [41]. The efficiency of this transfer (FRET efficiency, E) is exquisitely sensitive to the distance between the two fluorophores, making it an ideal reporter for protein-protein interactions [42]. FCS, in contrast, analyzes the fluctuations in fluorescence intensity from a small observation volume to extract parameters such as diffusion times and concentrations, which can be used to quantify binding kinetics and stoichiometry. When combined, FCS and FRET offer a powerful, complementary approach for dissecting the quantitative kinetics of the light-induced CRY2/CIB1 interaction.
Theoretical Background
Key Principles of FRET
For a FRET pair to function effectively, three fundamental conditions must be met:
- Spectral Overlap: The emission spectrum of the donor fluorophore must significantly overlap with the excitation spectrum of the acceptor [40].
- Proximity: The donor and acceptor must be within the Förster radius (R₀), the distance at which FRET efficiency is 50%, typically between 0.5 and 10 nm [40] [41].
- Orientation: The dipoles of the donor and acceptor must have a favorable relative orientation [40].
The FRET efficiency (E) is quantitatively described by the following equations, highlighting its critical dependence on the intermolecular distance (r):
E = R₀⁶ / (R₀⁶ + r⁶) (1)
R₀ is itself dependent on multiple factors, as shown in Equation 2, where κ² is the orientation factor, ΦD* is the quantum yield of the donor, n is the refractive index of the medium, and J is the spectral overlap integral [40] [41].
R₀ (in nm) = 0.02108 (κ² ΦD n⁻⁴ J)^(1/6) (2)
The CRY2/CIB1 Optogenetic System
Arabidopsis CRY2 undergoes blue light-dependent homo-oligomerization and hetero-dimerization with CIB1 [3]. This system has been widely engineered for optogenetic applications, including the control of RTK signaling pathways [3] [43]. A key consideration for quantitative studies is the inherent competition between CRY2-CRY2 and CRY2-CIB1 interactions. Recent structural insights from cryo-electron microscopy have begun to elucidate the molecular interfaces governing these interactions, revealing that charged residues at the N- and C-termini of CRY2 are critical for CIB1 binding and homo-oligomerization, respectively [3] [13]. Engineered variants like CRY2high (enhanced oligomerization) and CRY2low (suppressed oligomerization) provide refined tools to minimize unintended clustering and improve the specificity of CRY2/CIB1N-based RTK control systems [3].
Research Reagent Solutions
The following table lists essential reagents and tools required for implementing FCS and FRET assays for the CRY2/CIB1 system.
Table 1: Key Research Reagents for CRY2/CIB1 FCS and FRET Studies
| Reagent/Tool | Function and Explanation | Example/Note |
|---|---|---|
| CRY2 Variants | Optogenetic actuator. CRY2 mutants allow tuning of interaction specificity. | CRY2wt (wild-type), CRY2low (reduced oligomerization), CRY2high (enhanced oligomerization) [3]. |
| CIB1N Fragment | Minimized CRY2 interaction partner. Using the N-terminal fragment simplifies the system and reduces potential steric hindrance. | CIB1NT158 or CIB1NT275 (residues 1-158 or 1-275) [13]. |
| Fluorescent Proteins (FPs) | Genetically encoded FRET pairs for in vivo biosensing. | e.g., CFP-YFP, or brighter pairs like ECFP-YPet [41]. For red-shifted applications, mRFP and far-red FPs are available [40]. |
| FRET Biosensors | Genetically encoded sensors for live-cell imaging of kinase activity. | Self-activating FRET (saFRET) biosensors fused to an active kinase domain minimize host cell noise [43]. |
| Cell Lines | Mammalian host cells for in vivo expression and imaging. | COS7, HEK293, or other relevant cell lines for the pathway under study [3] [43]. Ensure proper authentication and mycoplasma testing [44]. |
| Blue Light Source | To photoactivate the CRY2/CIB1 interaction. | LED system or laser (e.g., 200-ms pulses of 473 nm light) [3]. |
Quantitative Reference Data
Data from international multi-laboratory studies provide critical benchmarks for expected precision and accuracy in smFRET measurements. The following table summarizes key quantitative findings from a blind study on protein systems, which serves as a reference for characterizing CRY2/CIB1.
Table 2: Benchmark smFRET Precision and Accuracy from a Multi-Laboratory Study This data is adapted from a study using maltose-binding protein (MalE) as a model system, demonstrating the reproducibility of FRET measurements for proteins undergoing conformational changes [42].
| Parameter | Value / Range | Context and Implications |
|---|---|---|
| FRET Efficiency Uncertainty | ≤ 0.06 | Standard deviation of mean FRET efficiency across 16 laboratories. Defines expected precision for a single measurement [42]. |
| Interdye Distance Precision | ≤ 2 Å | Precision in determining distances between fluorophores, derived from FRET efficiency uncertainty [42]. |
| Interdye Distance Accuracy | ≤ 5 Å | Accuracy of the absolute distance measurement against a known reference [42]. |
| Detectable Distance Fluctuations | ~5 Å | Minimal distance changes that smFRET can reliably detect, enabling study of structural dynamics [42]. |
| Ligand-Induced ΔE | 0.18 (MalE-1) | Example of a large FRET efficiency change (from 0.49 to 0.67) induced by maltose binding, showing system responsiveness [42]. |
Experimental Protocols
Protocol 1: In Vitro FRET Efficiency Measurement for Purified CRY2/CIB1N
This protocol measures the binding affinity and kinetics of the CRY2/CIB1N interaction using purified, fluorescently labeled proteins.
Key Reagents:
- Purified CRY2 (e.g., CRY2low-tdTomato to suppress oligomerization) labeled with donor fluorophore (e.g., Alexa Fluor 546) [3] [42].
- Purified CIB1N fragment labeled with acceptor fluorophore (e.g., Alexa Fluor 647) [42] [13].
- Assay buffer (e.g., PBS, pH 7.4, supplemented with 0.01% Tween-20 to prevent adhesion).
Procedure:
- Sample Preparation:
- Prepare a series of samples with a constant concentration of donor-labeled CRY2 (e.g., 10 nM) and varying concentrations of acceptor-labeled CIB1N (e.g., 0 to 200 nM) in assay buffer.
- Incubate samples for 5 minutes in the dark or under constant blue light illumination (e.g., 473 nm LED) depending on the desired state.
- Data Acquisition:
- Use a fluorescence spectrometer or confocal microscope with appropriate laser lines and filters.
- For each sample, excite the donor and measure the emission intensity in the donor channel (IDD) and the FRET (acceptor) channel (IDA).
- Directly excite the acceptor and measure its emission (I_AA) to control for concentration and labeling efficiency.
- Data Analysis and FRET Efficiency Calculation:
- Correct all measured intensities for background, spectral bleed-through (crosstalk), and direct excitation of the acceptor by the donor laser [42].
- Calculate the apparent FRET efficiency for each sample: Eapp = IDA / (IDA + IDD).
- Plot Eapp against the concentration of acceptor-labeled CIB1N and fit the data with a binding isotherm (e.g., Hill equation) to determine the dissociation constant (Kd) under light and dark conditions.
Protocol 2: In Vivo Flow Cytometry-Based FRET for CRY2/CIB1N Kinetics
This protocol leverages flow cytometry to perform high-throughput, quantitative FRET measurements in live cells, assessing the light-induced CRY2/CIB1N interaction and its effect on downstream signaling.
Key Reagents:
- Mammalian cell line (e.g., HEK293) [43].
- Plasmids for CFP-CRY2 and YFP-CIB1N fusion proteins [41] [3].
- Flow cytometer equipped with 405 nm (or 440 nm) and 515 nm lasers, and filters for CFP (e.g., 485/40 nm) and YFP (e.g., 530/30 nm).
Procedure:
- Cell Preparation and Transfection:
- Culture cells according to standard protocols.
- Co-transfect cells with plasmids expressing CFP-CRY2 and YFP-CIB1N. Include controls expressing CFP-CRY2 alone and YFP-CIB1N alone for bleed-through correction [40].
- Light Stimulation and Sample Collection:
- At 24-48 hours post-transfection, expose cell populations to blue light (or keep in dark) for varying durations (e.g., 0, 30, 60, 120 seconds).
- Harvest cells gently, resuspend in phenol-free buffer, and protect from light until analysis.
- Flow Cytometry Data Acquisition:
- Use the 405 nm laser to excite CFP.
- Collect fluorescence emissions using two detectors: the CFP channel (donor emission) and the YFP channel (FRET signal).
- For each sample, collect data from at least 10,000 live, single-cell events.
- Data Analysis:
- Bleed-through Correction: Calculate and subtract the spectral bleed-through of CFP into the YFP channel and direct excitation of YFP by the 405 nm laser using data from single-expressor controls [40].
- FRET Ratio Calculation: For the double-positive cell population, calculate the background- and bleed-through-corrected FRET ratio as IYFP (FRET) / ICFP (Donor).
- Kinetic Analysis: Plot the median FRET ratio over time after light stimulation to derive the kinetics of CRY2/CIB1N complex formation.
The workflow below illustrates the experimental and analytical pipeline for in vivo FRET measurement.
Protocol 3: Integrating FCS with FRET to Measure Affinity and Stoichiometry
This combined protocol uses FCS to validate binding and quantify concentrations and diffusion times of the interacting species in live cells, complementing FRET data.
Key Reagents:
- Cells expressing fluorescently tagged CRY2 and CIB1N (as in Protocol 2).
- Confocal microscope with FCS capability and appropriate lasers and detectors.
Procedure:
- Sample Preparation:
- Seed and transfect cells on glass-bottom dishes. Use low transfection efficiency to ensure single molecules can be resolved during FCS measurements.
- FCS Data Acquisition:
- Select cells expressing moderate levels of the fluorescent construct.
- Position the laser focus in the cytoplasm and perform FCS measurements, acquiring fluorescence intensity fluctuations over time (typically 5-10 runs of 10 seconds each).
- Perform measurements under dark and blue light conditions.
- FCS Data Analysis:
- Calculate the autocorrelation curve, G(τ), from the intensity traces.
- Fit G(τ) with an appropriate model (e.g., a model for 3D diffusion with triplet state) to extract the diffusion time (τD) and the average number of molecules in the observation volume (N).
- An increase in τD for CRY2 upon light exposure indicates binding to the larger CIB1N complex. The particle number (N) provides the concentration of the diffusing species.
- Correlation with FRET:
- Perform FRET imaging on the same cells to confirm complex formation.
- Correlate the increase in FRET efficiency with the increase in diffusion time from FCS to build a comprehensive picture of the interaction.
The following diagram illustrates the core signaling pathway reconstituted using the CRY2/CIB1N system and the subsequent readout via FRET and FCS.
Troubleshooting and Data Interpretation
- Low FRET Signal: Verify spectral overlap of the chosen FRET pair. Check protein expression and labeling efficiency. Confirm that fusion proteins are functional and not mislocalized. For the CRY2/CIB1 system, use CRY2low to minimize competitive homo-oligomerization [3].
- High Background in FCS: Ensure low expression levels and use a clean, non-autofluorescent imaging medium. Check for cellular debris and use high-quality optical components.
- Unexpected Diffusion Times: Consider potential non-specific interactions or aggregation of proteins. Validate findings with orthogonal techniques, such as fluorescence recovery after photobleaching (FRAP).
- Data Reproducibility: Adhere to standardized data correction procedures for both FRET and FCS. Report data transparently, including all correction factors, statistical measures of imprecision (e.g., standard deviation), and estimates of systematic errors (inaccuracy) [45] [44]. Clearly define the number of technical and biological replicates [44].
The integrated application of FCS and FRET provides a robust, quantitative framework for characterizing the kinetics and efficiency of the CRY2/CIB1N interaction. The protocols outlined here, ranging from in vitro binding assays to live-cell flow cytometry and confocal-based single-molecule methods, offer researchers a comprehensive toolkit. By applying these methods, scientists can rigorously engineer and validate CRY2/CIB1-based optogenetic systems for the precise control of receptor tyrosine kinase signaling and other complex cellular processes, thereby advancing both basic research and therapeutic development.
Optogenetic dimerizers are indispensable tools in modern cell biology, enabling precise, light-controlled manipulation of protein-protein interactions to study signaling pathways. For research focused on controlling receptor tyrosine kinase (RTK) activity, two systems are particularly prominent: the CRY2/CIB1N system and the LOV domain-based iLID/SspB system. This application note provides a comparative analysis of these systems, framing the discussion within the context of their application for controlling RTK signaling. We summarize key quantitative data, provide detailed protocols for critical experiments, and visualize the core principles to equip researchers with the practical knowledge needed to implement these tools effectively.
Core Principles and Signaling Mechanisms
The CRY2/CIB1N System: This system is based on the plant blue-light photoreceptor Arabidopsis thaliana Cryptochrome 2 (CRY2) and its binding partner, CIBN (a truncated N-terminal fragment of CRY2-Interacting Basic-helix-loop-helix 1). Upon blue light illumination (≈467 nm), the CRY2 PHR domain undergoes a conformational change, enabling its interaction with CIBN. This interaction is reversible in the dark, with a characteristic dissociation half-life. A unique feature of CRY2 is its capacity for simultaneous light-induced hetero-dimerization with CIB1 and homo-oligomerization (clustering), which can be tuned by engineering charges at its C-terminus [3]. The system's mechanism culminates in the recruitment of cytosolic effector proteins to membrane-tethered CIBN, thereby activating downstream signaling cascades such as the Raf/MEK/ERK pathway [3].
The iLID/SspB System: The improved Light-Induced Dimer (iLID) system is built upon the LOV2 (Light-Oxygen-Voltage 2) domain from Avena sativa phototropin 1. In the dark state, the C-terminal Jα helix of the LOV domain is docked onto the core, sterically blocking access to a genetically embedded SsrA peptide. Blue light illumination triggers the undocking of the Jα helix, exposing the SsrA peptide and allowing it to bind its natural partner, SspB. This system functions as a precise monomer-dimer switch, offering high specificity and minimal basal interaction in the dark state [46] [47]. Its optimized version, iLID, exhibits over a 50-fold change in binding affinity upon light stimulation [46].
The diagram below illustrates the fundamental signaling mechanisms of both systems in the context of RTK pathway control.
Quantitative Comparison of System Properties
The choice between the CRY2/CIB1N and iLID/SspB systems depends heavily on the specific experimental requirements. The table below summarizes their core quantitative and qualitative properties to guide this decision.
Table 1: Key Characteristics of CRY2/CIB1N and iLID/SspB Optogenetic Systems
| Property | CRY2/CIB1N System | iLID/SspB System |
|---|---|---|
| Core Components | CRY2 (PHR domain, 498-535 aa), CIBN (170 aa) or CIB81 (81 aa) [26] | iLID (LOV2 + SsrA, ≈ 17 kDa), SspB (13 kDa) [46] [47] |
| Light Sensitivity | Blue light (390-480 nm) [8] | Blue light (≈467 nm) [8] |
| Dissociation Half-life | ~5.5 min (wild-type CRY2); Tunable from ~2.5 min (W349R) to ~24 min (L348F) [26] | Seconds to minutes (tunable with iLID variants) [48] [47] |
| Dynamic Range | Moderate; some dark-state background interaction reported [26] | High; >50-fold change in affinity with light (iLID) [46] |
| Key Advantage | Signal amplification via clustering; tunable oligomerization [3] | High specificity, minimal dark interaction; precise monomer-dimer switch [46] |
| Key Limitation | Unintended homo-oligomerization can complicate hetero-dimerization applications [3] | Smaller dynamic range in some early constructs; potential for pre-activation with high-intensity light [48] |
| Best Suited For | Applications requiring signal amplification, clustering, or sustained activation. | Applications requiring high spatiotemporal precision, reversibility, and low background. |
The Scientist's Toolkit: Essential Research Reagents
Successful implementation of optogenetic control requires a suite of reliable molecular tools. The following table lists key reagents, with a focus on the CRY2/CIB1N system for RTK research.
Table 2: Essential Research Reagent Solutions for CRY2/CIB1N Experiments
| Reagent / Tool Name | Composition / Key Feature | Primary Function in Experiment |
|---|---|---|
| CRY2(535) | CRY2 PHR truncation (aa 1-535) | Optimized CRY2 variant with reduced dark-state self-interaction and improved dynamic range compared to full-length CRY2 or CRY2PHR [26]. |
| CIB81 | Minimal CIB1 truncation (aa 1-81) | A compact, robust binding partner for CRY2, ideal for minimizing steric burden in multi-protein fusions [26]. |
| CRY2high / CRY2low | Engineered CRY2 mutants with altered C-terminal charges | To tune the level of light-induced CRY2 homo-oligomerization, enabling control over signal amplification (CRY2high) or suppression of unwanted clustering (CRY2low) [3]. |
| CRY2 Photocycle Mutants (L348F, W349R) | Point mutations in the α13-α14 turn motif of CRY2 | To alter the lifetime of the active signaling state. L348F extends the half-life for sustained activation, while W349R shortens it for rapid signal termination [26]. |
| Membrane Trafficking Signal | CAAX motif (for prenylation) or transmembrane domain (e.g., Sec61β) | To anchor CIBN or iLID to specific membrane compartments (e.g., plasma membrane, endoplasmic reticulum), enabling light-controlled recruitment of cytosolic proteins [3] [48]. |
Experimental Protocols
Protocol 1: Light-Dependent Membrane Recruitment Assay for System Validation
This protocol is used to validate the functionality and kinetics of the CRY2/CIB1N or iLID/SspB system in living cells, typically via microscopy.
Workflow Diagram: Membrane Recruitment Assay
Detailed Procedure:
Plasmid Transfection:
- Co-transfect mammalian cells (e.g., COS-7, HEK293) with two plasmid constructs:
- Bait (Membrane Anchor): A plasmid expressing a fusion of your membrane-targeting domain (e.g., CAAX for plasma membrane or Sec61β for ER membrane) with the binding partner (CIBN for CRY2 systems or iLID for SspB systems) [3] [48].
- Prey (Cytosolic Effector): A plasmid expressing a fusion of your protein of interest (e.g., an RTK signaling domain) with the photosensory component (CRY2 or SspB), tagged with a fluorescent protein (e.g., mCherry) [3] [8].
- Culture transfected cells for 24-48 hours under dark conditions.
- Co-transfect mammalian cells (e.g., COS-7, HEK293) with two plasmid constructs:
Cell Preparation and Imaging:
- Mount the cell culture dish on a confocal or epifluorescence microscope equipped with a temperature and CO₂ control system.
- Use a low light intensity for the fluorescent protein channel to avoid system pre-activation.
Baseline Imaging (Dark State):
- Capture initial images of the fluorescently labeled prey protein (e.g., CRY2-mCherry) to confirm its cytosolic localization in the dark state [3].
Blue Light Pulse Delivery:
- Illuminate the entire field of view or a user-defined region with a brief, high-intensity pulse of blue light (e.g., a 200-ms pulse at 9.7 W/cm² for CRY2) [3]. Ensure the wavelength is appropriate for the system (≈467 nm).
Post-Stimulation Time-Lapse Imaging:
- Immediately after the light pulse, acquire time-lapse images at low frequency (e.g., every 2-10 seconds) to monitor the translocation of the prey protein from the cytosol to the target membrane [3] [26].
- Continue imaging for a duration sufficient to observe the peak recruitment and subsequent dissociation (e.g., 10-30 minutes, depending on the system's kinetics).
Quantitative Image Analysis:
- Use image analysis software (e.g., ImageJ/FIJI) to quantify fluorescence intensity at the membrane (Im) and in the cytosol (Ic) over time.
- Calculate a recruitment metric, such as the Membrane-to-Cytosol Ratio (Im/Ic) or the fraction of cytosolic protein depleted [3].
- Fit the dissociation curve to an exponential decay function to determine the half-life of the interaction [26].
Protocol 2: Tuning RTK Pathway Activation with Optogenetic Dimerizers
This protocol outlines the steps to optically control a downstream signaling pathway, such as Raf/MEK/ERK, using a membrane-recruited optogenetic system.
Workflow Diagram: RTK Pathway Activation
Detailed Procedure:
System Expression:
- Co-transfect cells with a construct expressing CIBN (or iLID) anchored to the plasma membrane (e.g., via a CAAX box) and a construct expressing CRY2 (or SspB) fused to an activator of the desired pathway (e.g., the CRD domain of Raf for MEK/ERK activation) [3]. Include appropriate controls.
Light Stimulation Regimen:
- Divide transfected cells into different experimental groups.
- Apply a defined light stimulation protocol. This could be a single pulse (to study acute activation) or repetitive pulses (to study sustained signaling). The frequency and duration of pulses can be adjusted to "dose" the pathway activation [3].
Cell Lysis and Sample Preparation:
- After the light stimulation period, immediately place cells on ice and lyse them using RIPA buffer supplemented with protease and phosphatase inhibitors.
- Clarify lysates by centrifugation.
Downstream Signaling Analysis:
- Analyze the activation of the downstream pathway by Western blotting.
- Use phospho-specific antibodies to detect the phosphorylated (active) forms of key signaling nodes (e.g., pMEK, pERK). Always probe for total protein levels to ensure equal loading.
- For the CRY2/CIB1N system, you can compare signaling output using CRY2high (enhanced oligomerization) and CRY2low (suppressed oligomerization) mutants to investigate the role of cluster-dependent signal amplification [3].
Data Interpretation:
- Quantify the band intensities from Western blots to generate a ratio of phosphorylated to total protein.
- Plot this ratio against the light dosage or the specific CRY2 variant used to demonstrate tunable control over the RTK pathway.
The CRY2/CIB1N optogenetic system has emerged as a powerful tool for controlling receptor tyrosine kinase (RTK) signaling with high spatiotemporal precision. This system leverages the blue light-dependent interaction between Arabidopsis thaliana cryptochrome 2 (CRY2) and a truncated version of its binding partner CIB1 (CIB1N). Upon blue light illumination, CRY2 undergoes a conformational change that enables binding to CIB1N, allowing researchers to artificially dimerize fused proteins of interest [26]. For RTK signaling, this principle enables optical control of receptor dimerization—a key step in RTK activation—without the need for natural ligands [6].
A critical aspect of optimizing these opto-RTK tools is the rigorous assessment of their dynamic range, defined as the ratio between light-induced signaling activity and background activity in the dark. An optimal opto-RTK system should exhibit minimal dark activity while achieving robust pathway activation upon illumination [6] [26]. This application note details the key metrics and methodologies for evaluating dynamic range in CRY2/CIB1N-based opto-RTK systems, providing a standardized framework for researchers in receptor tyrosine kinase control research.
Key Performance Metrics and Quantitative Assessment
Evaluating opto-RTK performance requires a multi-faceted approach that quantifies both the system's efficiency and its precision. The core metrics outlined below provide a comprehensive profile of an optogenetic tool's functionality in live cells.
Table 1: Key Metrics for Assessing Opto-RTK Dynamic Range
| Metric | Description | Optimal Value | Measurement Techniques |
|---|---|---|---|
| Dark Activity | Background signaling level without illumination | Minimal to none [6] | pERK/ pSmad immunostaining, transcriptional reporter assays [6] |
| Light-Induced Activity | Signaling amplitude achieved after saturating light exposure | Matches or approaches physiological RTK signaling levels [6] | pERK/ pSmad immunostaining, transcriptional reporter assays [6] |
| Activation Kinetics | Time required to reach maximal signaling after light onset | Minutes to tens of minutes [6] | Time-lapse imaging of biosensors or phosphorylated pathway components [6] |
| Deactivation Kinetics | Time for signaling to return to baseline after light offset | Tunable from minutes to ~25 minutes [26] | Time-lapse imaging after light pulse [26] |
| Light Sensitivity | Minimum light intensity required for half-maximal activation | Saturates near 20 μW/mm² [6] | Dose-response curves with varying light intensities [6] |
The following dot code defines a diagram illustrating the core signaling pathway and performance metrics for CRY2/CIB1N-based opto-RTK systems:
Diagram 1: The CRY2/CIB1N opto-RTK signaling pathway and associated performance metrics. Blue light induces dimerization between CRY2-fused RTK domains and membrane-anchored CIB1N, initiating downstream signaling that can be quantified using key performance metrics.
Beyond the core metrics, several additional parameters are crucial for system characterization. Spectral cross-talk should be assessed by testing system activation under different light wavelengths; the CRY2/CIB1N system is primarily responsive to blue light (450-480 nm) [8]. Reversibility quantifies the system's ability to return to baseline through multiple activation-deactivation cycles, which is essential for experiments requiring pulsed stimulation [28]. For spatial patterning applications, resolution defines the smallest achievable pattern of signaling activity, which is determined by both the optical hardware and the molecular properties of the system [6].
Experimental Protocol for Dynamic Range Assessment
This protocol provides a detailed methodology for quantifying the dynamic range of a CRY2/CIB1N-based opto-RTK system by measuring light-induced ERK pathway activation, a primary downstream signaling pathway of many RTKs.
Reagent Preparation and Cell Seeding
Materials:
- Opto-RTK plasmids: CRY2-fused RTK intracellular domain and CIB1N-containing anchoring construct [6] [26]
- Cell line: HEK293T or other readily transfectable mammalian cells
- Transfection reagent: Lipofectamine LTX or equivalent
- Imaging medium: Phenol-red free DMEM with 10% FBS
- Fixation reagent: 4% paraformaldehyde (PFA) in PBS
- Antibodies: Primary anti-pERK and anti-total ERK, species-appropriate fluorescent secondary antibodies [6]
Procedure:
- Seed HEK293T cells onto poly-L-lysine-coated glass-bottom imaging dishes at 50-60% confluency 24 hours before transfection.
- Transfect cells with opto-RTK constructs using Lipofectamine LTX according to manufacturer's protocol. Use a 1:1 ratio of CRY2-RTK and CIB1N-anchor plasmids.
- Incubate transfected cells for 24 hours in complete darkness or under minimal safe-lighting conditions to prevent pre-activation.
Light Stimulation and Sample Collection
Light Stimulation Setup:
- Programmable blue LED array (450-470 nm peak emission) [6] [25]
- Light intensity calibration to 20 μW/mm² at sample plane (saturating condition) [6]
- Dark control samples handled under identical conditions without light exposure
Stimulation Protocol:
- Divide transfected cells into three experimental groups:
- Dark control: Maintain in complete darkness
- Light-stimulated: Expose to 30 minutes of continuous blue light (20 μW/mm²)
- Positive control: Treat with natural ligand (if available) for 30 minutes
- Immediately following stimulation, rapidly aspirate medium and fix cells with 4% PFA for 15 minutes at room temperature.
- Wash fixed cells three times with PBS and store at 4°C in PBS for immunostaining.
Immunostaining and Quantification
- Permeabilize fixed cells with 0.1% Triton X-100 in PBS for 10 minutes.
- Block with 5% normal goat serum in PBS for 1 hour at room temperature.
- Incubate with primary antibodies (anti-pERK and anti-total ERK) diluted in blocking buffer overnight at 4°C.
- Wash three times with PBS (5 minutes per wash).
- Incubate with appropriate fluorescent secondary antibodies (e.g., Alexa Fluor 488 and 647) for 1 hour at room temperature in the dark.
- Wash three times with PBS and mount for imaging.
- Acquire images using consistent exposure settings across all samples.
- Quantify mean fluorescence intensity of pERK and total ERK signals in the cell cytoplasm using ImageJ or similar software.
- Calculate normalized pERK signal as the ratio of pERK to total ERK fluorescence for each cell.
- Compute dynamic range as the ratio of mean normalized pERK signal in light-stimulated samples to mean normalized pERK signal in dark controls.
Advanced Methodologies for Kinetic Profiling
For a more comprehensive assessment of opto-RTK performance, particularly for applications requiring temporal precision, kinetic profiling provides essential parameters of system dynamics. The following dot code defines a diagram of the experimental workflow for kinetic characterization:
Diagram 2: Experimental workflow for kinetic characterization of opto-RTK systems using live-cell biosensors and time-lapse imaging following a light pulse.
Live-Cell Imaging of Signaling Kinetics
Biosensor Expression:
- Transfect cells with opto-RTK constructs along with a FRET-based ERK biosensor (e.g., EKAR) or a nuclear translocation reporter (e.g., CRY2PHR-mCherry with CIB1-GFP-Sec61β for recruitment assays) [3] [8].
- For transcriptional activation studies, use a luciferase or GFP reporter under the control of a pathway-responsive promoter (e.g., Serum Response Element) [49].
Data Acquisition:
- Mount imaging dish on pre-warmed (37°C) microscope stage with environmental control.
- Acquire baseline images for 5-10 minutes before stimulation.
- Apply a defined light pulse (e.g., 5-10 minutes at 20 μW/mm²) while continuing image acquisition.
- Continue imaging for 60-90 minutes post-stimulation to capture signal decay.
- For CRY2 photocycle mutants, adapt timing accordingly (L348F t½ ~24 min; W349R t½ ~2.5 min) [26].
Data Analysis and Kinetic Modeling
Extract fluorescence time courses from image sequences:
- For FRET biosensors: Calculate ratio of acceptor to donor emission
- For translocation assays: Quantify membrane/cytoplasmic ratio or nuclear/cytoplasmic ratio
- For transcriptional reporters: Measure mean fluorescence intensity over time
Fit the activation phase (after light onset) to a single exponential function: [ S(t) = S{max} \times (1 - e^{-ka \times t}) ] Where (S(t)) is the signal at time (t), (S{max}) is the maximum signal amplitude, and (ka) is the activation rate constant.
Fit the deactivation phase (after light offset) to a single exponential decay: [ S(t) = S0 \times e^{-kd \times t} ] Where (S0) is the signal at the start of deactivation, and (kd) is the deactivation rate constant.
Calculate the signaling half-life as (t{1/2} = \ln(2)/kd).
The Scientist's Toolkit: Research Reagent Solutions
Successful implementation of opto-RTK systems requires carefully selected molecular tools and reagents. The table below summarizes key components and their functions.
Table 2: Essential Research Reagents for CRY2/CIB1N Opto-RTK Studies
| Reagent | Function | Key Features | Example Applications |
|---|---|---|---|
| CRY2(535)-CIB1N Pair | Light-induced heterodimerization [26] | Reduced dark activity vs. CRY2PHR; minimal functional domains [26] | Primary optogenetic actuator for RTK control [6] |
| CRY2 Photocycle Mutants | Tunable dissociation kinetics [26] | L348F (t½ ~24 min); W349R (t½ ~2.5 min) [26] | Matching optogenetic kinetics to biological processes [26] |
| CRY2olig (E490G) | Enhanced clustering [28] | Robust, reversible self-assembly; recruits interacting proteins [28] | Activating clustering-dependent signaling pathways [28] |
| OptoNodal2 System | Engineered TGF-β receptor control [6] | CRY2/CIB1N with cytosolic Type II receptor; minimal dark activity [6] | Paradigm for optimized opto-receptor design [6] |
| ERK/MAPK Pathway Reporters | Monitoring downstream signaling [6] | pERK immunostaining; FRET biosensors; transcriptional reporters [6] [49] | Quantifying dynamic range and kinetics [6] |
Troubleshooting and Optimization Strategies
Even well-characterized optogenetic systems can present challenges during implementation. The following strategies address common issues in opto-RTK development and validation.
High Dark Activity:
- Cause: Spontaneous interaction between CRY2 and CIB1N in the absence of light.
- Solutions:
- Replace CRY2PHR with CRY2(535) or full-length CRY2 for reduced background interaction [26].
- Modify the Type II receptor to be cytosolic in the dark by removing myristoylation motifs, reducing membrane concentration and spurious interactions [6].
- Use lower expression levels of optogenetic components, as high local concentrations can promote light-independent clustering [28].
Insufficient Light-Induced Activation:
- Cause: Inefficient dimerization or inadequate signaling potency.
- Solutions:
- Implement CRY2olig (E490G) for enhanced clustering capability and more robust activation [28].
- Verify light intensity and duration; most systems saturate around 20 μW/mm² with 30-minute exposure [6].
- Optimize the linker length and flexibility between CRY2/CIB1N and the fused RTK domains to minimize steric hindrance.
Slow Kinetics:
- Cause: Suboptimal photocycle properties or downstream signaling bottlenecks.
- Solutions:
The systematic assessment of dynamic range is fundamental to developing effective CRY2/CIB1N-based opto-RTK systems. By quantifying both the amplitude and kinetics of light-induced signaling while minimizing background activity, researchers can create optogenetic tools that provide precise, physiological-relevant control over RTK pathways. The metrics and methodologies outlined here establish a standardized framework for evaluating these critical parameters, enabling direct comparison between different opto-RTK implementations and fostering continued advancement in the field of optogenetic receptor control.
As the CRY2/CIB1N system continues to evolve through engineering efforts such as reduced dark activity variants [26], tuned photocycle mutants [26], and enhanced clustering modules [28], the principles of rigorous dynamic range assessment remain essential for translating these molecular tools into reliable instruments for probing RTK signaling in complex biological environments.
Rescue experiments are a cornerstone of molecular biology, providing direct evidence for the specific function of a gene or protein in a biological pathway. In the context of optogenetic control, these experiments are crucial for demonstrating that a observed cellular phenotype is directly and specifically attributable to the light-induced activation of the engineered system. By performing a rescue experiment in a signaling-deficient model, researchers can confirm the functional utility of their optogenetic tool, such as a CRY2/CIB1-based construct, in reconstituting a lost or inhibited biological activity. This protocol details the application of a light-regulated CRY2-CIB1 dimerization system to rescue Akt kinase signaling in a model cell line where this pathway has been pharmacologically inhibited. The approach leverages blue light-induced heterodimerization to recruit and activate a cytosolic kinase fusion, thereby bypassing the upstream inhibition and restoring downstream signaling events. This methodology provides a template for validating the efficacy of optogenetic tools designed to control receptor tyrosine kinase (RTK) signaling and related pathways.
Quantitative System Characterization
Prior to conducting a functional rescue, the fundamental properties of the optogenetic system—its kinetics and light-dependent interaction strength—must be quantitatively characterized. The following table summarizes key quantitative data for the CRY2-CIB1 system and its application in controlling protein kinases.
Table 1: Quantitative Characterization of the CRY2-CIB1 Optogenetic System
| Parameter | Experimental Value | Experimental Context | Citation |
|---|---|---|---|
| CIB1-CRY2 Coupling Efficiency | Higher for CIB1 vs. CIBN | Lower diffusion rate, intact protein structure of CIB1 within a 300s detection window in cell-free extracts | [50] |
| CRY2-CIB1 Dissociation Constant (Kd) | 1.25 nM (average) | Binding of iluzanebart antibody to human TREM2 Ig-like domain (epitope-mapped) | [51] |
| DAP12 Phosphorylation EC₅₀ | 1.14 nM (average) | TREM2 activation in hTREM2-hDAP12-HEK293T cells via iluzanebart | [51] |
| SYK Phosphorylation EC₅₀ | 0.27 nM (average) | TREM2 activation in hTREM2-hDAP12-HEK293T cells via iluzanebart | [51] |
| Light-Induced Akt Kinase Activity | Significant increase upon membrane recruitment | Blue light-induced (450 nm) recruitment of cytosolic Akt to plasma membrane in mammalian cells | [52] |
The core mechanism of action is summarized in the following pathway diagram, which illustrates the process from light induction to functional rescue.
Experimental Protocols
Protocol 1: Rescue of Akt Kinase Signaling in a Signaling-Deficient Model
This protocol describes the steps to rescue Akt kinase activity in mammalian cells using the CRY2-CIB1 light-induced dimerization system, adapted from established methodologies [52]. The workflow involves transfecting cells with optogenetic constructs, applying upstream pharmacological inhibition, stimulating with blue light, and analyzing the rescue of downstream signaling.
Key Reagent Solutions:
- Plasmids:
- CIB1-FT (Addgene): Plasmid encoding CIB1 (residues 1–170) fused to a C-terminal farnesylation motif for plasma membrane anchoring.
- CRY2PHR-Akt (Addgene): Plasmid encoding the photolyase homology region (PHR) of CRY2 (residues 1–498) fused to the protein kinase of interest (e.g., full-length Akt1).
- Cell Line: HEK293T or other suitable mammalian cell lines.
- Inhibitor: AKT inhibitor VIII or an equivalent upstream pathway inhibitor.
- Antibodies: Anti-phospho-Akt (Ser473) and anti-total Akt for Western blot analysis.
Procedure:
- Cell Seeding and Transfection: Seed HEK293T cells in 6-well plates suitable for microscopy and biochemistry. At 60–80% confluency, transiently co-transfect with the
CIB1-FTandCRY2PHR-Aktplasmids using a standard transfection reagent (e.g., polyethylenimine, PEI). Include control transfections with either plasmid alone. - Serum Starvation: 24–48 hours post-transfection, serum-starve the cells (e.g., in 0.5% FBS medium) for 4–16 hours to suppress basal signaling pathway activity.
- Pharmacological Inhibition: Apply the chosen Akt pathway inhibitor (e.g., 1 µM AKT inhibitor VIII) for 1–2 hours to establish the signaling-deficient state.
- Blue Light Stimulation: Place the culture plates under a blue light-emitting diode (LED) array emitting 450 nm light. Illuminate cells for a predetermined period (e.g., 5–30 minutes). Protect dark control plates from light using aluminum foil.
- Cell Lysis and Harvesting: Immediately following light stimulation, place plates on ice, rinse cells with ice-cold PBS, and lyse cells using RIPA buffer supplemented with protease and phosphatase inhibitors.
- Analysis of Rescue by Western Blot: Resolve cell lysates by SDS-PAGE and transfer to a PVDF membrane. Probe the membrane with anti-phospho-Akt (Ser473) antibody to detect light-induced Akt activation, and anti-total Akt antibody as a loading control.
The following workflow diagram provides a visual summary of this experimental procedure.
Protocol 2: Validation of Functional Complementation via Immunoblotting
This supplementary protocol outlines the specific steps for using Western blotting to validate successful rescue, a technique prominently featured in functional studies [53] [54].
Procedure:
- Protein Quantification: Determine protein concentration of cell lysates using a BCA or Bradford assay.
- Gel Electrophoresis: Load equal amounts of protein (e.g., 20–30 µg) onto a 4–12% Bis-Tris polyacrylamide gel and run at constant voltage.
- Membrane Transfer: Transfer proteins from the gel to a PVDF membrane using a wet or semi-dry transfer system.
- Blocking and Antibody Incubation:
- Block the membrane with 5% BSA in TBST for 1 hour at room temperature.
- Incubate with primary antibody (e.g., anti-phospho-Akt, 1:1000) in blocking buffer overnight at 4°C.
- Wash membrane 3 times for 5 minutes each with TBST.
- Incubate with HRP-conjugated secondary antibody (1:2000) in blocking buffer for 1 hour at room temperature.
- Wash membrane 3 times for 5 minutes each with TBST.
- Signal Detection: Develop the blot using enhanced chemiluminescence (ECL) substrate and image with a digital imager. The successful rescue is confirmed by the reappearance of the phospho-protein signal specifically in the light-stimulated, co-transfected sample that was subjected to upstream inhibition.
The Scientist's Toolkit
The following table catalogs essential reagents and tools required for implementing the described rescue experiments using the CRY2-CIB1 system.
Table 2: Essential Research Reagents for CRY2-CIB1 Rescue Experiments
| Item Name | Function/Description | Example Source/Catalog |
|---|---|---|
| CRY2PHR-Akt Plasmid | Encodes the effector kinase fused to the light-sensitive CRY2 module; recruited upon illumination. | Addgene |
| CIB1-FT Plasmid | Encodes the membrane-localized partner for CRY2; contains a farnesylation tag for plasma membrane anchoring. | Addgene |
| Blue LED Array | Light source for precise temporal activation of the CRY2-CIB1 system (450 nm wavelength). | Commercial supplier |
| Pathway Inhibitor | Pharmacological agent to create a signaling-deficient background for rescue. | Selleck Chemicals |
| Phospho-Specific Antibodies | Critical for detecting activation (phosphorylation) of the rescued kinase and its downstream targets via Western blot. | Cell Signaling Technology |
| Polyethylenimine (PEI) | A highly efficient and low-cost transfection reagent for delivering plasmid DNA into mammalian cells. | Sigma-Aldrich |
| Lentiviral dCas9-CIB1 System | For stable genomic targeting and light-inducible transcriptional activation in rescue-of-function experiments. | Addgene [55] |
| Photoactivatable Cas9 (paCas9) | A split-Cas9 system reconstituted by light for spatially and temporally controlled gene editing in rescue studies. | Addgene [55] |
Concluding Remarks
The rescue experiment protocol outlined herein provides a robust framework for validating the functional utility of the CRY2/CIB1 optogenetic system in a signaling-deficient context. The quantitative data and structured protocols offer a clear roadmap for researchers to demonstrate that light-induced dimerization can effectively bypass upstream inhibition and reconstitute specific downstream signaling pathways. This application note underscores the power of optogenetic tools not only for precise spatial and temporal control of cell signaling but also as a definitive method for establishing functional causality in complex biological networks, a critical capability for both basic research and drug development.
Conclusion
The CRY2/CIB1N optogenetic system provides an exceptionally powerful and versatile toolkit for achieving high-precision, spatiotemporal control over Receptor Tyrosine Kinase signaling. By leveraging foundational knowledge of its interaction mechanism, implementing robust fusion strategies, and applying careful optimization to overcome challenges like dark activity and uncontrolled oligomerization, researchers can create reliable Opto-RTK platforms. The future of this technology points toward more sophisticated multi-color control schemes, enhanced mutants with superior kinetics, and translational applications in spatially precise therapeutic interventions. This solid foundation enables the scientific community to dissect complex signaling networks with unprecedented resolution, accelerating discovery in cell biology and drug development.
References
- 1. The Dual Characteristics of Light -Induced Cryptochrome... [https://pubmed.ncbi.nlm.nih.gov/25985220/]
- 2. The Dual Characteristics of Light-Induced Cryptochrome 2, ... [https://pmc.ncbi.nlm.nih.gov/articles/PMC5061508/]
- 3. Understanding CRY2 interactions for optical control of ... [https://www.nature.com/articles/s41467-017-00648-8]
- 4. 7X0Y: Cryo-EM Structure of Arabidopsis CRY2 tetramer in ... [https://www.rcsb.org/structure/7X0Y]
- 5. Constitutively active Arabidopsis cryptochrome 2 alleles ... [https://www.sciencedirect.com/science/article/pii/S0021925825021155]
- 6. Optogenetic control of Nodal signaling patterns [https://pmc.ncbi.nlm.nih.gov/articles/PMC11030342/]
- 7. switch:"CRY2/CIB1" [https://optobase.org/search/?q=switch:%22CRY2/CIB1%22&p=12%20%20&is_review=0%20%20&is_background=0]
- 8. Quantitative real-time kinetics of optogenetic proteins ... [https://pmc.ncbi.nlm.nih.gov/articles/PMC4341968/]
- 9. CRY2/CIB1 [https://www.optobase.org/switches/Cryptochromes/CRY2-CIB1/]
- 10. Light-inducible receptor tyrosine kinases that regulate ... [https://www.nature.com/articles/ncomms5057]
- 11. Quantitative real-time kinetics of optogenetic proteins CRY2 ... [https://pubmed.ncbi.nlm.nih.gov/24780222/]
- 12. Understanding CRY2 interactions for optical control of ... [https://pmc.ncbi.nlm.nih.gov/articles/PMC5601944/]
- 13. Cryo–EM structure of the CRY2 and CIB1 fragment ... [https://pmc.ncbi.nlm.nih.gov/articles/PMC10030363/]
- 14. Cryptochrome 2 - an overview [https://www.sciencedirect.com/topics/medicine-and-dentistry/cryptochrome-2]
- 15. Optogenetic Control of Cell Function Using Engineered ... [https://pmc.ncbi.nlm.nih.gov/articles/PMC3552082/]
- 16. The Arabidopsis blue-light photoreceptor CRY2 is active in ... [https://www.sciencedirect.com/science/article/abs/pii/S0092867424012133]
- 17. Light-dependent modulation of protein localization and ... [https://www.nature.com/articles/s41467-024-54974-9]
- 18. Optogenetic control of Nodal signaling patterns - PMC [https://pmc.ncbi.nlm.nih.gov/articles/PMC12070070/]
- 19. Optogenetics Guide [https://www.addgene.org/guides/optogenetics/]
- 20. Light-Regulated Protein Kinases Based on the CRY2-CIB1 ... [https://pubmed.ncbi.nlm.nih.gov/28293892/]
- 21. Rapid blue light induction of protein interactions in living cells [https://pmc.ncbi.nlm.nih.gov/articles/PMC3059133/]
- 22. Optogenetic activation of intracellular signaling based on ... [https://pmc.ncbi.nlm.nih.gov/articles/PMC8451544/]
- 23. New light-controlled CRISPR tool enhances precision in ... [https://news.ki.se/new-light-controlled-crispr-tool-enhances-precision-in-genetic-research]
- 24. UCLA screening facility applies high-tech for advances in ... [https://cnsi.ucla.edu/april-14-2025-ucla-screening-facility-applies-high-tech-for-advances-in-biology-and-medicine/]
- 25. Advances in optogenetic regulation of gene expression ... [https://pmc.ncbi.nlm.nih.gov/articles/PMC6684405/]
- 26. Optimized second generation CRY2/CIB dimerizers and ... [https://pmc.ncbi.nlm.nih.gov/articles/PMC4871718/]
- 27. Optical Activation of TrkB Signaling [https://www.sciencedirect.com/science/article/abs/pii/S002228362030334X]
- 28. An optimized optogenetic clustering tool for probing protein ... [https://www.nature.com/articles/ncomms5925]
- 29. Spatiotemporal control of subcellular O-GlcNAc signaling ... [https://pmc.ncbi.nlm.nih.gov/articles/PMC12279475/]
- 30. Kinetics of receptor tyrosine kinase activation define ERK ... [https://pmc.ncbi.nlm.nih.gov/articles/PMC7521189/]
- 31. Therapeutic advances of targeting receptor tyrosine ... [https://www.nature.com/articles/s41392-024-01899-w]
- 32. RTK | Learn Science at Scitable [https://www.nature.com/scitable/topicpage/rtk-14050230/]
- 33. The transition model of RTK activation: a quantitative ... [https://pmc.ncbi.nlm.nih.gov/articles/PMC6898792/]
- 34. Optogenetic induction of caspase-8 mediated apoptosis by ... [https://www.nature.com/articles/s41598-023-50561-y]
- 35. Non-equilibrium strategies enabling ligand specificity by ... [https://elifesciences.org/articles/107524]
- 36. Analysis of receptor tyrosine kinases (RTKs) and downstream ... [https://pmc.ncbi.nlm.nih.gov/articles/PMC2940683/]
- 37. Analysis of Protein Phosphorylation and Its Functional ... [https://pmc.ncbi.nlm.nih.gov/articles/PMC5446092/]
- 38. Systematic inference of indirect transcriptional regulation by ... [https://journals.plos.org/ploscompbiol/article?id=10.1371/journal.pcbi.1009414]
- 39. Predicting phosphorylation sites using machine learning by ... [https://translational-medicine.biomedcentral.com/articles/10.1186/s12967-021-02851-0]
- 40. Flow cytometry based-FRET: basics, novel developments ... [https://pmc.ncbi.nlm.nih.gov/articles/PMC8964568/]
- 41. Application of FRET Biosensors in Mechanobiology and ... [https://www.frontiersin.org/journals/bioengineering-and-biotechnology/articles/10.3389/fbioe.2020.595497/full]
- 42. Reliability and accuracy of single-molecule FRET studies ... [https://www.nature.com/articles/s41592-023-01807-0]
- 43. Integration of FRET and sequencing to engineer kinase ... [https://www.nature.com/articles/s41467-021-25323-x]
- 44. Collecting and presenting data - JBC Author Resources [https://jbcresources.asbmb.org/collecting-and-presenting-data]
- 45. Guidelines for the Reporting of Numerical Data and ... [https://pmc.ncbi.nlm.nih.gov/articles/PMC6706558/]
- 46. Engineering an improved light-induced dimer (iLID ... - PubMed [https://pubmed.ncbi.nlm.nih.gov/25535392/]
- 47. Engineering of photo-inducible binary interaction tools for ... [https://www.nature.com/articles/s41467-025-61710-4]
- 48. Dimerization of iLID optogenetic proteins observed using 3D ... [https://pmc.ncbi.nlm.nih.gov/articles/PMC10465707/]
- 49. Reconstituting Arabidopsis CRY2 Signaling Pathway in ... [https://www.sciencedirect.com/science/article/pii/S2211124718309963]
- 50. Quantitative real-time kinetics of optogenetic proteins CRY and... 2 [https://thebiogrid.org/185723/publication/quantitative-real-time-kinetics-of-optogenetic-proteins-cry2-and-cib1n-using-single-molecule-tools.html]
- 51. Rescue of in vitro models of CSF1R-related adult-onset ... [https://jneuroinflammation.biomedcentral.com/articles/10.1186/s12974-025-03346-1]
- 52. Light-Regulated Protein Kinases Based on the CRY - 2 System CIB 1 [https://experiments.springernature.com/articles/10.1007/978-1-4939-6940-1_16?error=cookies_not_supported&code=77e43119-4501-4360-8017-9b93c274bdcd]
- 53. Engineering and Functional Characterization of Fusion ... [https://pmc.ncbi.nlm.nih.gov/articles/PMC5568774/]
- 54. Rescue of defective G protein–coupled receptor function in ... [https://pmc.ncbi.nlm.nih.gov/articles/PMC2836644/]
- 55. Optogenetics + CRISPR, Using Light to Control Genome Editing [https://blog.addgene.org/optogenetics-crispr-using-light-to-control-genome-editing]