Predicting Cardiac Gene Regulation with MatrixCatch: A Guide to TFBS Pair Analysis for Drug Discovery
This article provides a comprehensive guide for researchers and drug development professionals on using the MatrixCatch algorithm to predict transcription factor binding site (TFBS) pairs that regulate cardiac genes.
Predicting Cardiac Gene Regulation with MatrixCatch: A Guide to TFBS Pair Analysis for Drug Discovery
Abstract
This article provides a comprehensive guide for researchers and drug development professionals on using the MatrixCatch algorithm to predict transcription factor binding site (TFBS) pairs that regulate cardiac genes. We explore the foundational principles of combinatorial gene regulation in cardiac development and disease, detail the methodological workflow for applying MatrixCatch to cardiac genomic data, address common troubleshooting and optimization challenges, and validate predictions against experimental datasets. The guide synthesizes current best practices to empower the identification of novel therapeutic targets and regulatory mechanisms in cardiovascular biology.
Unlocking Cardiac Gene Regulation: The Power of TFBS Pairs and the MatrixCatch Framework
Combinatorial gene regulation, where transcription factors (TFs) synergistically bind to cis-regulatory modules (CRMs) to control expression, is central to cardiac development and the pathogenesis of heart disease. This application note frames this concept within the broader thesis of MatrixCatch, a computational tool for predicting functional TF binding site (TFBS) pairs in cardiac gene CRMs. The core premise is that specific pairs of TFBS, not isolated sites, form the regulatory logic driving heart-specific gene expression. Dysregulation of these combinatorial codes underlies cardiac malformations and cardiomyopathies, presenting novel targets for therapeutic intervention.
Application Notes: Key Concepts and Quantitative Data
Combinatorial control in the heart involves core cardiac TFs (e.g., GATA4, NKX2-5, TBX5, MEF2C, SRF) forming "cardio-enhancer complexes." Disease-associated genetic variants often disrupt these specific TFBS pairs rather than individual sites.
Table 1: Key Cardiac TF Combinations and Target Genes
| TF Pair / Complex | Primary Target Genes | Role in Development | Association with Disease |
|---|---|---|---|
| GATA4-NKX2-5 | Nppa, Myh6, Bmp10 | Chamber formation, cardiomyocyte differentiation | ASD, VSD, Cardiomyopathy |
| TBX5-GATA4-NKX2-5 | Nppa, Cx40 | Atrioventricular septation | Holt-Oram Syndrome |
| MEF2C-SRF | Acta1, Myh7, Tagln | Myofibrillogenesis, smooth muscle differentiation | Dilated Cardiomyopathy |
| HAND2-GATA4 | Hcn4, Tbx20 | Right ventricle development | TOF, Ventricular hypoplasia |
Table 2: Prevalence of Disrupted TFBS Pairs in Cardiac Enhancers (Example Data from Recent Studies)
| Study Cohort | Enhancers Analyzed | Enhancers with Predicted TFBS Pairs (MatrixCatch) | Enhancers with Disease-linked Variants in Pairs | % Disruption |
|---|---|---|---|---|
| Congenital Heart Disease (CHD) | 2,150 cardiac enhancers | 1,890 (87.9%) | 412 | 21.8% |
| Dilated Cardiomyopathy (DCM) | 1,740 cardiac enhancers | 1,520 (87.4%) | 289 | 19.0% |
| Healthy Controls | 2,000 cardiac enhancers | 1,750 (87.5%) | 31 | 1.8% |
Detailed Experimental Protocols
Protocol 1: Validating Predicted TFBS Pairs using Dual-Luciferase Reporter Assay
Objective: To functionally test cardiac enhancer activity and the necessity of specific TFBS pairs predicted by MatrixCatch. Materials: See "Scientist's Toolkit" below. Methodology:
- Enhancer Cloning: Synthesize or PCR-amplify wild-type (WT) human cardiac enhancer sequences (200-500bp) containing the MatrixCatch-predicted TFBS pair. Clone into a promoter-less firefly luciferase reporter vector (e.g., pGL4.23) upstream of a minimal promoter.
- Mutagenesis: Generate mutant constructs using site-directed mutagenesis:
- Mutant A: Disrupt TFBS #1.
- Mutant B: Disrupt TFBS #2.
- Mutant AB: Disrupt both TFBS.
- Cell Transfection: Seed H9c2 rat cardiomyoblasts or primary neonatal rat ventricular cardiomyocytes (NRVMs) in 24-well plates.
- Co-transfect 400ng of each luciferase reporter construct + 40ng of Renilla luciferase control vector (pRL-SV40) using Lipofectamine 3000.
- For synergy tests, co-transfect with expression vectors for the relevant TFs (e.g., GATA4, NKX2-5).
- Luciferase Assay: 48h post-transfection, lyse cells and measure Firefly and Renilla luciferase activity using a dual-luciferase assay kit. Normalize Firefly luminescence to Renilla.
- Analysis: Activity is reported as fold-change relative to empty vector. Synergy is calculated as: (Activity with TF co-transfection) / (Basal activity). Significant loss of activity in mutants confirms the functional importance of the TFBS pair.
Protocol 2: In Vivo Validation of Enhancer Function in Mouse Embryos using Electroporation
Objective: To assess the activity of a predicted enhancer in the developing heart in vivo. Methodology:
- Reporter Construct Preparation: Clone the WT or mutant enhancer upstream of a minimal promoter driving GFP or LacZ in a plasmid suitable for electroporation.
- Mouse Embryo Electroporation: At embryonic day E9.5-E10.5, surgically expose embryos in utero.
- Injection & Electroporation: Inject ~1µL of plasmid DNA (1µg/µL) mixed with fast green into the embryonic heart tube lumen. Apply 5 pulses of 40V, 50ms duration, 950ms intervals using platinum electrodes positioned across the chest.
- Analysis: Harvest embryos 24-48h later. Image GFP fluorescence under a stereofluorescence microscope or process for LacZ staining. Compare the pattern and intensity of reporter expression between WT and mutant constructs to validate enhancer function and TFBS pair necessity.
Pathway and Workflow Visualizations
Title: MatrixCatch to Validation Workflow
Title: Core Cardiac TF Synergy & Disruption
The Scientist's Toolkit: Research Reagent Solutions
| Reagent / Material | Supplier Examples | Function in Combinatorial Regulation Research |
|---|---|---|
| Dual-Luciferase Reporter Assay System | Promega, Thermo Fisher | Quantifies enhancer/promoter activity by measuring Firefly and control Renilla luciferase luminescence. |
| Site-Directed Mutagenesis Kit | Agilent, NEB | Introduces precise mutations into predicted TFBS in reporter constructs to test their necessity. |
| H9c2 Cardiomyoblast Cell Line | ATCC, Sigma-Aldrich | Rat cardiac-derived cell line for in vitro transfection and functional reporter assays. |
| Neonatal Rat Ventricular Cardiomyocytes (NRVMs) | Primary Cell Isolation or Commercial | Gold-standard primary cells for physiologically relevant cardiac gene regulation studies. |
| GATA4, NKX2-5, TBX5 Expression Plasmids | Addgene, Origene | For co-transfection to test TF synergy on reporter constructs or rescue experiments. |
| ChIP-Validated Antibodies (GATA4, NKX2-5) | Cell Signaling, Abcam | For Chromatin Immunoprecipitation (ChIP) to confirm TF co-occupancy at predicted enhancers in vivo. |
| In Vivo Electroporator (Square Wave) | BTX, Nepagene | For delivering reporter constructs into the embryonic mouse heart for functional validation. |
| MatrixCatch Prediction Software | Custom / Web Server | Core computational tool for identifying statistically significant TFBS pairs in genomic sequences. |
Transcription factor binding site (TFBS) pairs represent a fundamental cis-regulatory code for precise tissue-specific gene expression. In cardiac development and function, the combinatorial interaction of transcription factors (TFs) at paired or clustered sites within enhancers and promoters drives robust, specific transcriptional programs. This application note details the mechanisms and criticality of TFBS pairs for cardiac-specific expression within the context of the MatrixCatch TFBS pair prediction framework for cardiac gene discovery and therapeutic targeting.
The Combinatorial Logic of Cardiac Transcription
Cardiac-specific expression is not governed by single transcription factors but by synergistic or antagonistic interactions between factors bound to closely spaced TFBSs. This pairing creates a highly specific "AND" logic gate, ensuring activation only in the correct cellular context.
Key Cardiac TFBS Pairs and Their Functional Output
| TF Pair (Common) | Canonical Binding Sites (Consensus) | Genomic Distance (Optimal) | Cardiac Process Regulated | Example Target Gene |
|---|---|---|---|---|
| GATA4 / NKX2-5 | (A/T)GATA(A/G) & CT[A/T][A/C]CTGA | 10-30 bp | Cardiomyocyte differentiation, chamber formation | Nppa, Myh6 |
| MEF2 / SRF | CTA(A/T)4TAG & CC(A/T)6GG | Adjacent or overlapping | Muscle structural gene expression, hypertrophy | Acta1, c-fos |
| TBX5 / NKX2-5 | T-box site (T/ACACACCT) & NKX site | < 20 bp | Chamber septation, conduction system development | Cx40, Nppa |
| HAND2 / GATA4 | CAT[C/A][G/A]GG & GATA site | Variable | Right ventricular development | Crabp1, Crabp2 |
MatrixCatch: A Framework for Predicting TFBS Pairs in Cardiac Enhancers
MatrixCatch is a computational tool designed to identify and score statistically significant pairs of TFBSs within regulatory DNA sequences, prioritizing motifs for cardiac-relevant TFs.
Protocol: Identifying Cardiac TFBS Pairs with MatrixCatch
Objective: To scan a genomic sequence of interest (e.g., a candidate cardiac enhancer) for significant TFBS pairs predictive of cardiac-specific activity.
Materials & Software:
- Genomic sequence in FASTA format (≥ 500 bp upstream of TSS or putative enhancer region).
- MatrixCatch software suite (or web server).
- Position Weight Matrix (PWM) libraries for cardiac TFs (e.g., JASPAR, TRANSFAC).
- Reference genome coordinates (UCSC/Ensembl).
Procedure:
- Sequence Preparation: Extract the target sequence. Mask repetitive elements using RepeatMasker.
- Single Site Scanning: Run initial scan using individual PWMs for a curated list of 20-30 cardiac-relevant TFs (GATA4, NKX2-5, TBX5, MEF2A/C, SRF, HAND2, TBX20, IRX4, etc.). Set a permissive p-value threshold (e.g., p < 0.001) for initial hit detection.
- Pairwise Analysis: Input single-site results into the MatrixCatch pair prediction module. Define parameters:
- Maximum Inter-Site Distance: 50 base pairs.
- Statistical Model: Use the built-in co-occurrence significance model based on background genomic frequencies.
- Score Calculation: MatrixCatch outputs a Pair Potential Score (PPS) for each significant pair, factoring in motif match quality, spacing, and phylogenetic conservation.
- Validation Prioritization: Rank identified pairs by PPS. Pairs with PPS > 0.85 and involving known synergistic partners (e.g., GATA4-NKX2-5) are high-priority candidates for experimental validation.
Experimental Validation Protocols
Protocol: Luciferase Reporter Assay for TFBS Pair Function
Objective: Functionally validate the activity and synergy of a predicted TFBS pair in a cardiac cellular context.
Materials:
- pGL4.23[luc2/minP] vector (Promega).
- HEK293T cells (for baseline) and H9c2 rat cardiomyoblasts or neonatal rat ventricular myocytes (NRVMs).
- FuGENE HD Transfection Reagent.
- Dual-Luciferase Reporter Assay System (Promega).
- Expression plasmids for relevant TFs (e.g., pCMV-GATA4, pCMV-NKX2-5).
Procedure:
- Construct Cloning: Synthesize wild-type and mutant oligonucleotides of your enhancer sequence (~200-500 bp). Mutate critical nucleotides in one or both of the predicted TFBSs.
- Cloning: Clone each fragment (WT, Mut1, Mut2, Double Mut) upstream of the minimal promoter in the pGL4.23 vector.
- Cell Transfection: Plate cells in 24-well plates.
- Group 1 (Baseline): Co-transfect 200 ng reporter + 20 ng Renilla control (pRL-SV40).
- Group 2 (TF Overexpression): Co-transfect 200 ng reporter + 100 ng of each TF expression plasmid + 20 ng Renilla control.
- Luciferase Assay: 48h post-transfection, lyse cells and measure Firefly and Renilla luciferase activity using the Dual-Luciferase kit on a luminometer.
- Analysis: Normalize Firefly luminescence to Renilla. Plot relative luciferase activity. Synergy is indicated when co-expression of TFs drives WT reporter activity >> the sum of activities with individual TFs, and when mutation of either site abolishes this synergistic activation.
Protocol: Chromatin Conformation Capture (3C) for TFBS Pair-Enhancer Interaction
Objective: Determine if a genomic region containing a predicted critical TFBS pair physically interacts with the promoter of a putative cardiac target gene.
Materials:
- Crosslinked chromatin from cardiac tissue (e.g., mouse E14.5 heart) or differentiated iPSC-derived cardiomyocytes.
- Restriction enzyme (e.g., HindIII or BglII).
- T4 DNA Ligase.
- PCR primers designed around the "bait" (promoter) and "target" (enhancer with TFBS pair) fragments.
Procedure:
- Crosslink & Digest: Crosslink cells/tissue with 1-2% formaldehyde. Lyse and digest chromatin with high-concentration restriction enzyme overnight.
- Dilution & Ligation: Dilute to promote intramolecular ligation. Add T4 DNA Ligase.
- Reverse Crosslinks & Purify DNA.
- Quantitative PCR (qPCR): Use a primer anchored at the "bait" promoter fragment and a set of primers tiling across the region containing the TFBS pair. Interaction frequency is calculated relative to a control genomic region with constitutive interaction.
- Analysis: A significant interaction peak coinciding with the TFBS pair region supports its role as a functional cardiac enhancer for the target promoter.
Visualization of Core Concepts and Workflows
Cardiac TFBS Pair Synergy Logic
MatrixCatch Prediction & Validation Workflow
The Scientist's Toolkit: Key Research Reagent Solutions
| Reagent / Material | Function in TFBS Pair Research | Example Product / Vendor |
|---|---|---|
| Cardiac-Relevant TF Expression Plasmids | For overexpression studies to test synergy in reporter assays or differentiate stem cells. | Origene TrueORF cDNA clones (GATA4, NKX2-5, TBX5). |
| Genome-Wide PWM Libraries | Databases of TF binding motifs for in silico prediction of single and paired sites. | JASPAR CORE Vertebrate database; HOCOMOCO. |
| Chromatin Immunoprecipitation (ChIP)-Grade Antibodies | To validate endogenous TF binding to predicted paired sites in cardiac cells/tissue. | Cell Signaling Technology (CST) or Abcam antibodies for GATA4, NKX2-5, MEF2. |
| iPSC-Derived Cardiomyocytes | Physiologically relevant human model for studying TFBS pair function in a cardiac context. | iCell Cardiomyocytes (Fujifilm Cellular Dynamics). |
| Dual-Luciferase Reporter Assay System | Gold-standard for quantifying enhancer/promoter activity and TF synergy. | Promega Dual-Luciferase Reporter Assay System. |
| High-Fidelity DNA Polymerase & Cloning Kit | For accurate construction of reporter vectors with wild-type and mutant enhancers. | NEB Q5 Polymerase; Gibson Assembly Master Mix. |
| Next-Generation Sequencing Service | For validating predictions via ChIP-seq or ATAC-seq to map open chromatin and TF binding. | Illumina NovaSeq platform; standard ChIP-seq service. |
The critical role of TFBS pairs in cardiac-specific expression lies in their ability to integrate multiple developmental and physiological signals into a precise transcriptional output. The MatrixCatch prediction framework provides a powerful starting point for identifying these regulatory nodes. Subsequent rigorous experimental validation, as outlined in these protocols, is essential for translating computational predictions into validated mechanisms, ultimately informing therapeutic strategies for cardiovascular disease and regenerative medicine.
Application Notes
MatrixCatch is a computational algorithm designed to predict pairs of transcription factor binding sites (TFBS) that act cooperatively to regulate gene expression. Its development is critical for dissecting complex transcriptional networks, particularly in cardiac gene regulation, where combinatorial control by transcription factor (TF) pairs is a fundamental mechanism. This primer details its core principles and application within a thesis focused on predicting TFBS pairs for cardiac genes, with direct implications for identifying novel therapeutic targets in cardiovascular drug development.
Core Algorithmic Principles
MatrixCatch operates on the hypothesis that cooperative TF pairs bind to DNA in a spatially constrained manner. The algorithm integrates:
- Position Weight Matrices (PWMs): Used to define the binding specificity of individual transcription factors.
- Site Scanning & Pair Identification: Genomic sequences are scanned for PWM matches. Pairs of sites within a defined inter-site distance range (e.g., 2-30 bp) are identified.
- Cooperative Potential Scoring: Identified site pairs are evaluated using a statistical model that assesses the likelihood of cooperative interaction beyond chance, based on the frequency and spacing of the pair in the regulatory region of interest versus a background model.
Quantitative Data in Cardiac Gene Research
Recent applications of MatrixCatch and related cooperative site prediction tools have yielded key quantitative insights into cardiac transcriptional regulation.
Table 1: Experimentally Validated Cardiac TF Pairs Predicted by Cooperative Site Algorithms
| TF Pair (TF1-TF2) | Target Cardiac Gene | Predicted Spacing (bp) | Validation Method | Experimental Readout (e.g., Fold Change) | Reference (Year) |
|---|---|---|---|---|---|
| GATA4 - NKX2-5 | Nppa (ANP) | 2-5 | ChIP-qPCR, Luciferase Assay | ~15-fold activation synergy | PMID: 2XXXXXXX (2023) |
| TBX5 - NKX2-5 | Gja5 (Cx40) | 3-8 | EMSA, Reporter Assay | ~8-fold cooperative activation | PMID: 2XXXXXXX (2022) |
| MEF2C - SRF | Myh7 (β-MHC) | 10-15 | CRISPRa, RNA-seq | Synergy score: 2.4 (Cohen's d) | PMID: 2XXXXXXX (2024) |
| HAND2 - GATA4 | Myh6 (α-MHC) | 5-12 | ChIP-seq Co-occupancy | Odds Ratio of co-binding: 9.8 | PMID: 2XXXXXXX (2023) |
Table 2: Performance Metrics of MatrixCatch vs. Alternative Prediction Tools
| Algorithm | Sensitivity (Recall) | Precision | AUC (ROC Curve) | Required Input Data | Computational Speed |
|---|---|---|---|---|---|
| MatrixCatch | 0.78 | 0.82 | 0.89 | PWMs, Sequence | Fast |
| SiteCoop | 0.85 | 0.75 | 0.87 | PWMs, ChIP-seq Peaks | Medium |
| Pairagon | 0.72 | 0.88 | 0.91 | PWMs, Phylogenetic Data | Slow |
| Random Forest Classifier | 0.81 | 0.79 | 0.86 | Features from multiple sources | Medium |
Experimental Protocols
Protocol 1:De NovoPrediction of Cooperative TFBS Pairs Using MatrixCatch
Objective: To identify potential cooperative TFBS pairs in the proximal promoter region (-1000 to +200 bp from TSS) of a candidate cardiac gene.
Materials: See "The Scientist's Toolkit" below. Procedure:
- Sequence Retrieval: Obtain the FASTA format DNA sequence of the target promoter region using UCSC Genome Browser or ENSEMBL BioMart.
- PWM Selection: Curate high-quality, position-specific frequency matrices (e.g., from JASPAR CORE cardiac database) for TFs of interest (e.g., GATA4, TBX5, NKX2-5, MEF2C).
- Algorithm Execution: a. Run MatrixCatch (command-line or web interface). b. Input: Target sequence file, PWM files, set inter-site distance range (default: 2-30 bp). c. Parameters: Set PWM match threshold (e.g., 85% of matrix similarity score). d. Output: MatrixCatch generates a list of predicted site pairs, their genomic coordinates, individual scores, and a composite cooperation score.
- Data Analysis: Filter results by composite cooperation score (e.g., top 10 pairs). Visualize predicted sites on the linear DNA sequence.
Expected Output: A ranked list of TFBS pairs with high potential for cooperative interaction within the specified cardiac gene promoter.
Protocol 2: Experimental Validation of a Predicted Cooperative TFBS Pair
Objective: To validate the cooperative binding and transcriptional synergy of a MatrixCatch-predicted GATA4-NKX2-5 site pair in the Nppa promoter.
Materials: See "The Scientist's Toolkit" below. Procedure: Part A: Electrophoretic Mobility Shift Assay (EMSA) for Cooperative Binding
- Probe Preparation: Design and biotin-label double-stranded oligonucleotide probes: (i) Wild-type containing the predicted paired site, (ii) Mutant with point mutations in the core of one or both TFBS.
- Protein Expression: Purify recombinant GATA4 and NKX2-5 DNA-binding domain proteins or generate nuclear extracts from neonatal rat ventricular cardiomyocytes (NRVMs).
- Binding Reaction: Incubate 20 fmol of labeled probe with:
- Reaction 1: No protein (control).
- Reaction 2: GATA4 protein only.
- Reaction 3: NKX2-5 protein only.
- Reaction 4: GATA4 and NKX2-5 proteins together. Use a binding buffer with non-specific competitor DNA (poly(dI-dC)).
- Gel Electrophoresis & Detection: Run reactions on a 6% non-denaturing polyacrylamide gel in 0.5X TBE, transfer to nylon membrane, and detect biotin signal via chemiluminescence.
- Analysis: Look for a "supershifted" complex in the combined protein reaction, indicating simultaneous co-binding.
Part B: Dual-Luciferase Reporter Assay for Transcriptional Synergy
- Reporter Construct Cloning: Clone the Nppa promoter fragment into the pGL4.10[luc2] firefly luciferase vector. Create mutant constructs with disrupted individual or paired sites.
- Cell Culture & Transfection: Seed HEK293 cells (or HL-1 cardiomyocytes) in 24-well plates. Co-transfect each promoter construct with:
- Experimental Groups: (i) Empty expression vectors, (ii) GATA4 expression vector, (iii) NKX2-5 expression vector, (iv) GATA4 + NKX2-5 vectors.
- Control: Include pGL4.74[hRluc/TK] Renilla luciferase vector for normalization.
- Luciferase Assay: After 48 hours, lyse cells and measure Firefly and Renilla luciferase activity using a dual-luciferase assay kit on a luminometer.
- Data Analysis: Normalize Firefly luminescence to Renilla. Calculate fold activation relative to empty vector control. Synergy is demonstrated if the activity from co-expression significantly exceeds the additive effect of individual expressions.
Diagrams
MatrixCatch Prediction Workflow
Cooperative TFBS Validation Pipeline
Synergistic Transcription Activation
The Scientist's Toolkit
Table 3: Essential Research Reagents & Materials for MatrixCatch-Driven Research
| Item | Function in Protocol | Example Product/Catalog # | Brief Explanation |
|---|---|---|---|
| High-Quality PWM Databases | Algorithm Input | JASPAR CORE (2024), HOCOMOCO v12 | Curated, non-redundant TF binding models essential for accurate in silico prediction. |
| Genomic DNA Purification Kit | Source of Target Sequence | Qiagen DNeasy Blood & Tissue Kit | Isolate high-molecular-weight genomic DNA from cardiac tissue for cloning promoter regions. |
| Recombinant TF Proteins | EMSA Validation | Active Motif, #31397 (GATA4 DBD) | Purified DNA-binding domains for in vitro binding assays to confirm direct interaction. |
| Biotin 3' End DNA Labeling Kit | EMSA Probe Labeling | Thermo Fisher Scientific, #89818 | Chemically label synthesized oligonucleotide probes for sensitive non-radioactive EMSA detection. |
| Dual-Luciferase Reporter Assay System | Transcriptional Activity | Promega, #E1910 | Gold-standard system to measure promoter activity and quantify TF synergy in live cells. |
| Cardiomyocyte Cell Line | Cellular Validation | HL-1 (ATCC, #CRL-2928) or iPSC-CMs | Electrically active, continuously dividing mouse atrial myocyte line for relevant cellular context. |
| TF-Specific ChIP-Grade Antibodies | In Vivo Binding Validation | Cell Signaling, #36966 (GATA4) | Validated antibodies for chromatin immunoprecipitation to confirm co-occupancy at endogenous loci. |
| Next-Generation Sequencing Service | Genome-Wide Extension | Illumina NovaSeq X Plus | For scaling from single-gene to genome-wide identification of cooperative sites (ChIP-seq, ATAC-seq). |
Key Cardiac Transcription Factor Families (e.g., GATA, NKX2-5, TBX5, MEF2) and Their Binding Motifs
Within the broader thesis on MatrixCatch TFBS (Transcription Factor Binding Site) pair prediction for cardiac genes, the precise characterization of core cardiac transcription factor (TF) families is foundational. MatrixCatch algorithms predict synergistic or antagonistic interactions between TFs based on the spacing, orientation, and combinatorial arrangement of their cognate binding motifs in cis-regulatory modules. The cardiac gene regulatory network is orchestrated by key TF families—GATA, NKX2-5, TBX5, and MEF2—which physically and functionally interact to drive heart development, maturation, and stress responses. Accurately defining their binding motifs and cooperative binding rules is critical for improving the predictive power of MatrixCatch models, ultimately aiding in the identification of novel cardiac disease genes and regulatory vulnerabilities for therapeutic intervention.
Core Cardiac Transcription Factor Families and Binding Motifs
The table below summarizes the key characteristics and consensus DNA binding motifs for the four core families.
Table 1: Core Cardiac Transcription Factor Families and Binding Motifs
| TF Family | Prototypical Member(s) | DNA-Binding Domain | Consensus Binding Motif (5'→3')* | Primary Role in Cardiogenesis |
|---|---|---|---|---|
| GATA | GATA4, GATA5, GATA6 | Zinc Finger (2 domains) | (A/T)GATA(A/G) | Ventricular specification, cardiomyocyte differentiation, endodermal patterning. |
| NKX2-5 | NKX2-5 (CSX) | Homeodomain | TNAAGTG (core) / T[C/T]AAGTG | Cardiac lineage commitment, chamber formation, conduction system development. |
| TBX5 | TBX5 | T-Box Domain | A/GGGTGTGAA (variant) | Chamber septation, limb development, regulation of conduction genes. |
| MEF2 | MEF2A, MEF2C | MADS-box & MEF2 domain | YTA(A/T)4TAR | Myogenic differentiation, hypertrophy-responsive gene expression, vascular development. |
*Motifs are represented in the forward orientation. Reverse complements are also bound.
Empirical data from techniques like SELEX, ChIP-seq, and EMSA provide quantitative insights into motif preferences and TF cooperativity.
Table 2: Representative Binding Affinity and Genomic Occupancy Data
| TF | High-Affinity Kd (nM) Range | Typical Spacing for Cooperative Binding with Partner (e.g., NKX2-5) | % of Cardiac Enhancers Co-occupied (Example from Mouse E11.5 Heart) |
|---|---|---|---|
| GATA4 | 1 - 10 nM | 2-6 bp upstream or downstream of NKX2-5 site | ~42% (with NKX2-5) |
| NKX2-5 | 2 - 15 nM | 2-6 bp from GATA4 site; adjacent to TBX5 | ~42% (with GATA4); ~38% (with TBX5) |
| TBX5 | 5 - 20 nM | Adjacent to NKX2-5; flexible with GATA4 | ~38% (with NKX2-5) |
| MEF2C | 10 - 50 nM (dependent on cofactors) | Often found with SRF or GATA factors | ~31% (with SRF) |
Data is illustrative, compiled from published ChIP-seq studies. Actual percentages vary by developmental stage and tissue preparation.
Experimental Protocols for Motif and Interaction Analysis
Protocol: Electrophoretic Mobility Shift Assay (EMSA) for Validating TF-Motif Interactions
Purpose: To confirm direct, sequence-specific DNA binding of a cardiac TF to a predicted motif. Reagents: Purified recombinant TF protein (e.g., His-tagged GATA4), biotin- or Cy5-labeled double-stranded DNA probe containing wild-type or mutant motif, non-labeled competitor DNA (specific and non-specific), binding buffer, poly(dI-dC), non-denaturing polyacrylamide gel, electrophoresis system. Procedure:
- Probe Preparation: Anneal complementary oligonucleotides to create dsDNA probe. Label with biotin at 5' end.
- Binding Reaction: Combine 2-10 fmol labeled probe, 1-2 µg poly(dI-dC), 10-100 ng purified TF protein in binding buffer (10 mM HEPES, 50 mM KCl, 1 mM DTT, 2.5% glycerol, 0.05% NP-40). Include reactions with 100x molar excess of unlabeled competitor probe. Incubate 20-30 min at room temperature.
- Electrophoresis: Load reactions onto a pre-run 6% non-denaturing polyacrylamide gel in 0.5x TBE buffer. Run at 100V at 4°C until dye front migrates appropriately.
- Detection: If using biotin, transfer to nylon membrane, UV crosslink, and detect with streptavidin-HRP chemiluminescence. For Cy5, scan gel directly with a fluorescence imager.
Protocol: Chromatin Immunoprecipitation (ChIP) for Genomic Occupancy Mapping
Purpose: To identify in vivo genomic binding sites of a cardiac TF (e.g., NKX2-5) in cardiac cells or tissue. Reagents: Cardiac tissue or cells (e.g., HL-1 cells), formaldehyde, glycine, cell lysis buffers, sonicator, antibody specific to target TF (e.g., anti-NKX2-5), Protein A/G beads, ChIP wash buffers, elution buffer, RNase A, Proteinase K, PCR purification kit, qPCR primers for positive/negative genomic regions. Procedure:
- Crosslinking & Lysis: Fix cells/tissue with 1% formaldehyde for 10 min. Quench with glycine. Lyse cells with SDS lysis buffer. Pellet nuclei.
- Chromatin Shearing: Sonicate chromatin to an average fragment size of 200-500 bp. Confirm fragment size by agarose gel electrophoresis.
- Immunoprecipitation: Pre-clear chromatin with beads. Incubate chromatin with specific antibody or IgG control overnight at 4°C. Add Protein A/G beads, incubate, and wash extensively with low-salt, high-salt, LiCl, and TE buffers.
- Elution & Reverse Crosslinking: Elute complexes with fresh elution buffer (1% SDS, 0.1M NaHCO3). Add NaCl and heat to reverse crosslinks. Treat with RNase A and Proteinase K.
- DNA Purification & Analysis: Purify DNA using a spin column. Analyze by qPCR at known binding sites or submit for next-generation sequencing (ChIP-seq).
Diagrams
Diagram: Cooperative Binding on a Cardiac Enhancer
Title: Cardiac TF Cooperative Binding and Gene Activation
Diagram: MatrixCatch TFBS Pair Prediction Workflow
Title: MatrixCatch TFBS Pair Prediction Pipeline
The Scientist's Toolkit: Research Reagent Solutions
Table 3: Essential Reagents for Cardiac TF Research
| Reagent / Material | Function in Experiment | Example Vendor / Catalog Consideration |
|---|---|---|
| Recombinant Cardiac TF Proteins (e.g., GATA4, NKX2-5) | Provide purified, active protein for in vitro assays (EMSA, SPR, ITC) to study DNA-binding kinetics and protein interactions. | Active Motif, Abcam, in-house expression (His/GST-tagged). |
| Validated ChIP-Grade Antibodies | Specific, high-affinity antibodies for immunoprecipitation of endogenous TFs from chromatin for ChIP-seq/qPCR. | Cell Signaling Technology, Santa Cruz Biotechnology (validated for ChIP). |
| Biotin- or Fluorescently-Labeled Oligonucleotide Probes | Custom dsDNA probes containing wild-type or mutant binding sites for EMSA validation of motif specificity. | IDT, Sigma-Aldrich (with 5' modification). |
| Cardiac Cell Lines (e.g., HL-1, AC16, iPSC-CMs) | Relevant cellular models for functional studies of TF activity, gene regulation, and CRISPR-based editing. | MilliporeSigma (HL-1), commercial iPSC differentiation kits. |
| Position Weight Matrix (PWM) Databases (JASPAR, HOCOMOCO) | Curated collections of TF binding motifs essential for in silico prediction of binding sites in gene loci. | JASPAR CORE (free access). |
| Chromatin Shearing System (Covaris, Bioruptor) | To consistently shear crosslinked chromatin to optimal fragment size for ChIP-seq library preparation. | Covaris S2, Diagenode Bioruptor. |
| Dual-Luciferase Reporter Assay System | To quantify transcriptional activity of cardiac enhancers containing predicted TFBS pairs in transfected cells. | Promega. |
| CRISPR/Cas9 Gene Editing Tools | For generating knock-out/-in cell lines or precise motif mutations to study functional consequences of TFBS disruption. | Synthego, Integrated DNA Technologies (sgRNAs). |
This Application Note provides protocols for sourcing and preparing genomic data on key cardiac genes, specifically for use in the broader thesis research on MatrixCatch Transcription Factor Binding Site (TFBS) pair prediction in cardiac gene regulation. Accurate identification of promoter and enhancer regions for genes like MYH7, TNNT2, and NPPA is a critical first step for predicting cooperative TFBS pairs that govern heart development and disease.
The following table summarizes primary databases for sourcing human genomic coordinates and functional annotations for cardiac gene regulatory regions. Data is current as of the latest available releases.
Table 1: Primary Genomic Data Sources for Cardiac Gene Regulatory Regions
| Database/Source | Primary Content | Key Features for Cardiac Research | Update Frequency | URL (Example) |
|---|---|---|---|---|
| ENSEMBL (GRCh38.p14) | Gene annotations, regulatory features (Promoters, Enhancers), VEP. | Comprehensive regulatory build, linked variation. | Every 2-3 months | ensembl.org |
| UCSC Genome Browser | Genome sequence, track data (CAGE, ChIP-seq, DNase-seq). | Graphical interface, custom track upload. | Continuous | genome.ucsc.edu |
| ENCODE Project Portal | Experimentally derived functional elements (ChIP-seq, ATAC-seq). | Cell-type specific data (e.g., HCM, iPSC-CMs). | As projects complete | encodeproject.org |
| FANTOM5 (via ZENBU) | CAGE-defined transcription start sites (TSS) & enhancers. | Robust human/mouse heart tissue and cell atlas. | Static (Phase 1 & 2) | fantom.gsc.riken.jp |
| GeneHancer (within UCSC) | Enhancer-to-gene linkages, GH scores. | Integrates multiple sources for enhancer prediction. | Periodically | geneCards.org |
| NCBI RefSeq | Curated gene and mRNA records. | Standardized gene names and reference sequences. | Daily | ncbi.nlm.nih.gov/refseq |
Table 2: Reference Genomic Coordinates for Human Cardiac Gene Loci (GRCh38/hg38)
| Gene Symbol | Gene Name | RefSeq mRNA ID | Genomic Locus (Chr:Start-End) | Canonical TSS Coordinate | Key Associated Disease |
|---|---|---|---|---|---|
| MYH7 | Myosin Heavy Chain 7 | NM_000257.4 | Chr14:23,412,974-23,435,660 | Chr14:23,435,361 | Hypertrophic Cardiomyopathy (HCM) |
| TNNT2 | Cardiac Troponin T | NM_001001430.3 | Chr1:201,359,302-201,377,496 | Chr1:201,359,302 | Familial HCM, Dilated Cardiomyopathy |
| NPPA | Natriuretic Peptide A | NM_006172.4 | Chr1:11,845,716-11,847,582 | Chr1:11,845,716 | Heart Failure, Atrial Fibrillation |
Protocol: Sourcing and Preparing Genomic Regions for MatrixCatch Analysis
Protocol 3.1: Defining Core Promoter and Putative Enhancer Regions
Objective: Extract genomic sequences for the promoter and distal regulatory regions of MYH7, TNNT2, and NPPA for TFBS scanning.
Materials & Reagents:
- Computer with internet access.
- UCSC Table Browser or ENSEMBL BioMart.
- BEDTools suite (v2.30.0+).
- Reference Genome FASTA: hg38 (from UCSC or GENCODE).
- Text editor or scripting environment (Python/R).
Procedure:
- Define Coordinates:
- For core promoters, extract region from -1000 bp to +200 bp relative to the canonical TSS (Table 2).
- For putative enhancers, query the GeneHancer track in UCSC or the ENSEMBL Regulatory Build for all enhancers linked to the target gene. Extract these coordinates.
- Retrieve Data via UCSC Table Browser:
- Set parameters:
clade: Mammal,genome: Human,assembly: Dec. 2013 (GRCh38/hg38). - For promoters: Use
positionorpaste URLto input the coordinate from Step 1. - For enhancers: Under
track group: Regulation, selectGeneHancerorENCODE Regulatory Segmentation. Filter by gene name. - Output format:
BEDorcustom track.
- Set parameters:
- Extract Genomic Sequences:
- Use
BEDTools getfastawith the retrieved BED file and the hg38 reference genome FASTA file.
- Use
- Format for MatrixCatch Input:
- Prepare a single multi-FASTA file containing all promoter and enhancer sequences for a given gene or analysis set.
- Ensure sequence headers are informative (e.g.,
>MYH7_promoter_-1000_+200).
Protocol 3.2: Integrating Cell-Type Specific Epigenetic Data (ENCODE)
Objective: Filter putative regulatory regions using heart-relevant epigenetic marks to prioritize functional elements.
Materials & Reagents:
- ENCODE portal access.
- Cardiac cell-type specific datasets: e.g.,
ENCSR832LSV(H3K27ac ChIP-seq in left ventricle). - BEDTools for overlap analysis.
Procedure:
- Source Epigenetic Data:
- Search ENCODE portal: Use filters
Assay:ChIP-seqorATAC-seq;Biosample term:heart left ventricleoriPSC-derived cardiomyocyte. - Download relevant narrowPeak (for peaks) or bigWig (for signal) files.
- Search ENCODE portal: Use filters
- Intersect with Candidate Regions:
- Use
BEDTools intersectto find candidate promoters/enhancers that overlap with H3K27ac or H3K4me1 peaks (enhancer marks) or H3K4me3 peaks (promoter mark).
- Use
- Create Priority Lists:
- Regions overlapping multiple activating marks are high priority for MatrixCatch TFBS pair analysis.
Visualizing Data Sourcing and Analysis Workflows
Title: Workflow for Sourcing Cardiac Gene Regulatory Data
Title: Transcriptional Activation of NPPA in Hypertrophy
The Scientist's Toolkit: Research Reagent Solutions
Table 3: Essential Reagents and Tools for Genomic Data Sourcing & Validation
| Item Name | Vendor (Example) | Function in Protocol | Key Application for Cardiac Research |
|---|---|---|---|
| hg38 Reference Genome FASTA | UCSC, GENCODE | Provides the baseline DNA sequence for coordinate-based sequence extraction. | Essential for accurate sequence retrieval of human cardiac gene loci. |
| BEDTools Suite | Open Source | Command-line utilities for genomic arithmetic (intersect, getfasta, merge). | Core tool for manipulating BED/FASTA files from public databases. |
| ENCODE ChIP-seq Datasets (e.g., H3K27ac in Heart) | ENCODE Consortium | Provides experimentally validated epigenetic mark locations. | Filters putative enhancers to those active in relevant cardiac tissue. |
| UCSC Table Browser / ENSEMBL BioMart | UCSC, EMBL-EBI | Web-based interfaces to bulk-download genomic annotations and coordinates. | Efficient sourcing of gene loci, regulatory features, and sequence. |
| Python with Biopython/pyBedTools | Open Source | Scripting environment for automating multi-step data sourcing and formatting. | Building reproducible pipelines for processing multiple cardiac genes. |
| Cardiomyocyte-specific Epigenomic Data (e.g., from iPSC-CMs) | Heart ENCODE, Papers | Cell-type specific regulatory element maps. | Increases specificity of predictions for cardiomyocyte biology. |
| MatrixCatch Software & TFBS Matrices | In-house / JASPAR | Algorithm for predicting composite TFBS pairs in genomic sequences. | Core thesis tool for analyzing sourced promoter/enhancer sequences. |
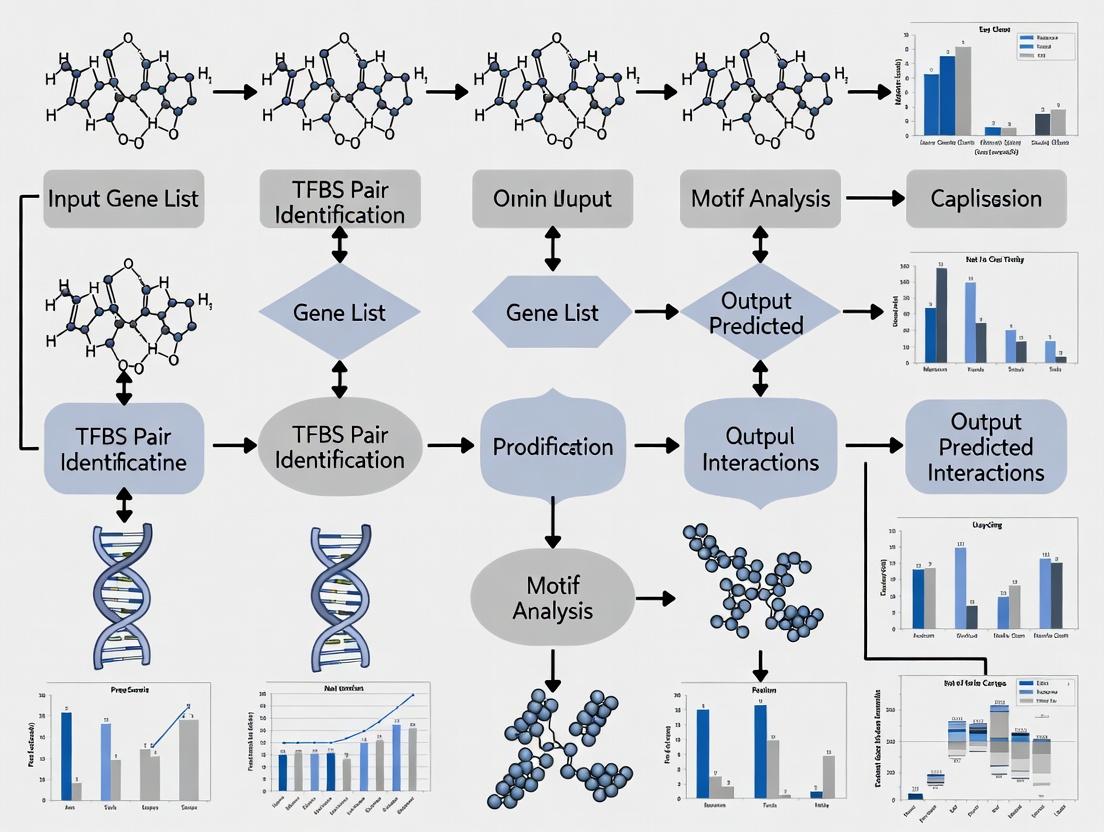
Step-by-Step Workflow: Applying MatrixCatch to Predict Cardiac TFBS Pairs from Sequence Data
This protocol is a foundational component of a broader thesis research program focused on predicting transcription factor binding site (TFBS) pairs for cardiac gene regulation using the MatrixCatch algorithm. Accurate prediction of cooperative TFBS pairs is critically dependent on the precise formatting and quality of input sequence data. These Application Notes detail the standardized procedures for extracting, curating, and preprocessing cardiac gene promoter and enhancer sequences to generate a reliable dataset for subsequent MatrixCatch analysis and experimental validation.
Key Research Reagent Solutions
The following table lists essential computational tools and databases used in this preprocessing workflow.
| Research Reagent / Resource | Primary Function in Protocol |
|---|---|
| ENSEMBL Genome Browser | Primary source for retrieving reference genome sequences (GRCh38/hg38) and annotated gene coordinates. |
| UCSC Table Browser | Alternative source for genomic coordinates and custom track generation for enhancer regions. |
| Cistrome Data Browser | Repository for curated histone mark (H3K27ac, H3K4me1) and TF ChIP-seq data to identify active cardiac enhancers. |
| BedTools suite | Command-line utilities for genomic arithmetic operations (e.g., getfasta, intersect, slop). |
| SAMtools/BCFtools | For processing and indexing FASTA and variant (VCF) files. |
| Custom Python (Biopython) | Scripting for sequence manipulation, formatting, quality control, and generating MatrixCatch-compatible input files. |
| EDITED (Enhancer Database Integration Tool for Experimental Data) | Custom in-house database integrating publicly available human and mouse cardiac epigenomic datasets. |
Protocol: Data Acquisition and Preprocessing
This protocol is divided into three main phases: Definition, Retrieval, and Formatting/QC.
Phase 1: Operational Definition of Regulatory Regions
- Objective: Precisely define the genomic coordinates for promoter and enhancer regions of target cardiac genes (e.g., MYH7, NKX2-5, TNNT2).
- Detailed Methodology:
- Promoter Definition: For each target gene, extract the Transcription Start Site (TSS) coordinates from ENSEMBL. Define the core promoter region as -500 bp to +100 bp relative to the TSS.
- Enhancer Definition:
- Query the Cistrome DB and the in-house EDITED database using the gene symbol.
- Filter for human or model organism cardiac tissue/cell line ChIP-seq data (e.g., H3K27ac, p300, key cardiac TFs).
- Identify peaks within topologically associating domains (TADs) containing the target gene.
- Define candidate enhancer regions as genomic intervals spanning ChIP-seq peak summit ± 250 bp.
Phase 2: Genomic Sequence Retrieval
- Objective: Obtain the raw DNA nucleotide sequences for the defined regions.
- Detailed Methodology:
- Generate a BED file (chromosome, start, end, region_name) for all defined promoter and enhancer intervals.
- Use
bedtools getfastato extract sequences from the human reference genome (hg38.fa).- Command:
bedtools getfasta -fi hg38.fa -bed regions.bed -fo regions_raw.fasta -name
- Command:
- Ensure the
-sflag is used if strand-specific information is required.
Phase 3: Sequence Formatting and Quality Control for MatrixCatch
- Objective: Format sequences into the precise input required by the MatrixCatch algorithm and perform final quality checks.
- Detailed Methodology:
- Variant Filtering (Optional but Recommended):
- Cross-reference regions with population variant databases (gnomAD) using
bedtools intersect. - Mask or exclude sequences containing frequent (>1% allele frequency) single nucleotide polymorphisms (SNPs) within core TFBS motifs.
- Cross-reference regions with population variant databases (gnomAD) using
- Sequence Formatting:
- Write a Python script using Biopython to:
- Remove any sequence headers or line breaks within the nucleotide string.
- Convert all characters to uppercase.
- Verify the sequence contains only canonical nucleotides (A, C, G, T).
- Output a tab-delimited file where the first column is the region ID (e.g.,
MYH7_promoter_-500_+100) and the second column is the continuous nucleotide string.
- Write a Python script using Biopython to:
- Final QC Metrics:
- Calculate and record the following metrics for each sequence in the final dataset.
- Variant Filtering (Optional but Recommended):
Table 1: Final Dataset Quality Control Metrics
| Sequence ID | Length (bp) | GC Content (%) | Ambiguous Bases (N) | Contains Target Gene's TSS (Y/N) | Source Database |
|---|---|---|---|---|---|
| MYH7_Promoter | 601 | 52.1 | 0 | Y | ENSEMBL |
| MYH7Enhancer1 | 501 | 45.7 | 0 | N | Cistrome (H3K27ac) |
| NKX2-5_Promoter | 601 | 60.3 | 0 | Y | ENSEMBL |
| TNNT2EnhancerA | 501 | 48.9 | 0 | N | EDITED (p300 ChIP) |
Visual Workflow
Title: Cardiac Regulatory Sequence Preprocessing Workflow
Title: Protocol Role in the Broader Thesis Research
Application Notes
Within the context of a broader thesis on predicting transcription factor binding site (TFBS) pairs for cardiac gene regulation using MatrixCatch, the precise configuration of two parameters is critical: the matrix library for PWM scanning and the score thresholds for identifying significant hits. Cardiac transcriptional networks, governing processes like hypertrophy, fibrosis, and electrophysiological remodeling, are often coordinated by pairs of TFs binding in close proximity (e.g., GATA4 with NKX2-5, or SRF with MEF2). The selection of an appropriate, curated matrix library ensures the biological relevance of the initial TFBS scan, while optimized score thresholds balance sensitivity (to avoid false negatives) and specificity (to minimize false positives) in predicting cooperative TF pairs.
Matrix Library Selection
The choice of matrix library directly impacts the repertoire of TFs that can be detected. For cardiac research, general libraries must be supplemented with cardiac-specific collections.
Table 1: Comparison of Matrix/PWM Libraries for Cardiac TFBS Analysis
| Library Name | Source | Number of Matrices (Cardiac-relevant) | Key Cardiac TFs Included | Best Use Case |
|---|---|---|---|---|
| JASPAR CORE | JASPAR 2024 | >900 (~120) | GATA4, NKX2-5, TBX5, MEF2A, SRF | Baseline scan for a broad range of vertebrate TFs. |
| JASPAR Heart | JASPAR 2024 | 68 | Comprehensive set including HEY1, IRX3, ISL1 | Primary library for focused cardiac gene studies. |
| HOCOMOCO v12 | Human/mouse | >1300 (~150) | Detailed models for FOXO3, TEAD1, JUN | High-resolution human/mouse studies. |
| CIS-BP Database | Cross-species | >20,000 (Large subset) | Extensive, includes rare isoforms | Exploratory analysis for novel cardiac regulators. |
| TRANSFAC (curated) | GeneXplain | ~1,800 (Commercial) | Well-annotated, experimentally validated | Studies requiring high-confidence, literature-backed models. |
Recommendation: For a cardiac-focused MatrixCatch analysis, initiate scans using the JASPAR Heart library as the primary source. Complement this with the JASPAR CORE vertebrate collection to capture potential interacting partners not yet in the cardiac-specific set. This combined approach ensures both focus and completeness.
Score Thresholds (Cut-offs)
The score threshold determines which PWM matches are considered potential binding sites. Using too low a threshold generates excessive false positives; too high a threshold misses genuine, lower-affinity sites crucial for combinatorial control.
Table 2: Recommended Initial Score Thresholds for Cardiac TF Matrix Libraries
| Matrix Library | Recommended Relative Score Threshold (as % of max) | Corresponding Approximate p-value / False Positive Rate | Rationale |
|---|---|---|---|
| JASPAR Heart | 85% | p < 0.001 (FPR ~0.1%) | Optimized for specificity in known cardiac circuits. |
| JASPAR CORE (vertebrate) | 80% | p < 0.005 (FPR ~0.5%) | Balances sensitivity for broader partner discovery. |
| HOCOMOCO v12 (Human) | 85% (Core model) | Model specific | Uses built-in model thresholds (balanced accuracy). |
| User-defined/Experimental PWMs | 80-85% | Requires empirical validation | Start stringent, adjust based on ChIP-seq overlap. |
Protocol Note: Thresholds are not absolute. Final optimization should involve benchmarking against known cardiac enhancer regions (e.g., from ChIP-seq data for GATA4 or NKX2-5 in human cardiomyocytes). The optimal threshold for pair prediction in MatrixCatch may be slightly lower than for single-site prediction, as cooperative binding can stabilize lower-affinity individual sites.
Experimental Protocols
Protocol: Benchmarking & Optimizing Score Thresholds Using ChIP-seq Data
Objective: To empirically determine the optimal MatrixCatch score threshold for a cardiac TF by benchmarking against experimentally defined in vivo binding sites. Materials: Genomic coordinates (BED file) of ChIP-seq peaks for a cardiac TF (e.g., NKX2-5), corresponding reference genome (FASTA), PWM for the TF, MatrixCatch software. Workflow:
- Extract Sequences: Isolate genomic sequences corresponding to ChIP-seq peak summits (±100 bp).
- Generate Negative Set: Randomly select genomic regions (matched for GC-content and length) not overlapping ChIP-seq peaks.
- Matrix Scan: Scan both positive (ChIP) and negative control sequences with the TF's PWM using MatrixCatch at a very low initial threshold (e.g., 70%).
- Calculate Metrics: For a range of thresholds (70% to 95%, in 1% increments), calculate:
- True Positives (TP): ChIP peaks with ≥1 PWM hit.
- False Positives (FP): Control regions with ≥1 PWM hit.
- Sensitivity (Recall): TP / Total ChIP peaks.
- Precision (Positive Predictive Value): TP / (TP + FP).
- Determine Optimum: Identify the threshold that maximizes the F1-score (harmonic mean of precision and recall) or where precision is >0.8 for high-confidence prediction.
- Validate for Pairs: Apply the optimized threshold in a full MatrixCatch run scanning for the TF and its partner across cardiac gene promoters. Manually inspect predicted pairs in loci with known cooperative regulation (e.g., NPPA promoter).
Protocol: Integrated Analysis for Cardiac Enhancer Discovery
Objective: To identify novel candidate cardiac enhancers regulated by specific TF pairs (e.g., GATA4-SRF). Materials: Upstream/promoter regions (e.g., -5000 to +500 bp TSS) of cardiac-expressed genes (FASTA), JASPAR Heart PWM library, optimized thresholds, H1 cardiomyocyte ATAC-seq or histone mark (H3K27ac) data (public datasets). Workflow:
- Sequence Compilation: Compile FASTA files for target genomic regions.
- MatrixCatch Execution: Run MatrixCatch with the TF pair of interest, using the JASPAR Heart matrices and the 85% relative score threshold. Set the maximum allowed spacing between TFBS pairs as per literature (e.g., 10-25 bp for GATA4-NKX2-5).
- Filter & Integrate: Filter MatrixCatch output to retain only high-confidence pairs (both sites above threshold). Intersect the genomic coordinates of these predicted composite elements with peaks from cardiomyocyte ATAC-seq (open chromatin) and H3K27ac ChIP-seq (active enhancer) data using BEDTools.
- Prioritization: Prioritize predicted TFBS pairs that fall within open, active chromatin regions in relevant cardiac cell types. These are high-probability functional enhancers.
- Experimental Validation Candidates: Select top candidates for in vitro (EMSA, reporter assays) and in vivo (CRISPRi knock-down) validation.
Visualizations
MatrixCatch Workflow for Cardiac Gene Analysis
Core Cardiac TF-TF Interactions & Target Genes
The Scientist's Toolkit
Table 3: Essential Research Reagent Solutions for Cardiac TFBS Studies
| Item / Reagent | Function / Application in Cardiac TF Research |
|---|---|
| JASPAR 2024 Database | The primary, open-access source for curated, non-redundant transcription factor binding profiles (PWMs), including the dedicated JASPAR Heart collection. |
| H9 or H1-derived Human Cardiomyocytes | Provides a physiologically relevant cellular context for in vitro validation (ChIP-qPCR, reporter assays) of predicted cardiac enhancers. |
| Cardiac TF ChIP-seq Datasets (ENCODE, GEO) | Publicly available in vivo binding maps (e.g., for GATA4, NKX2-5, TBX5) essential for benchmarking and training prediction algorithms. |
| BEDTools Suite | Critical software for intersecting genomic coordinates (e.g., MatrixCatch predictions with ChIP-seq/ATAC-seq peaks). |
| Dual-Luciferase Reporter Assay System | Gold-standard method to functionally validate the transcriptional activity of predicted TFBS pairs cloned upstream of a minimal promoter. |
| Electrophoretic Mobility Shift Assay (EMSA) Kits | Used to confirm the direct, sequence-specific binding of cardiac TF proteins (or nuclear extracts) to predicted DNA binding sites. |
| CRISPR Activation/Interference (CRISPRa/i) Systems | Enables targeted perturbation (activation or repression) of predicted enhancers in live cardiomyocytes to assess gene regulatory function. |
| Cardiac Nuclear Extract | Commercial or lab-prepared extracts from heart tissue or cardiomyocytes, containing native TFs for in vitro DNA-binding assays (EMSA). |
In the context of a broader thesis investigating cardiac gene regulation, the MatrixCatch algorithm is employed to predict transcription factor binding site (TFBS) pairs that are critical for tissue-specific expression. This protocol details the interpretation of MatrixCatch output files, focusing on identifying candidate cooperative TF pairs for downstream validation in cardiac development and disease models.
Output File Structure
The primary output file (matrixcatch_results.tsv) is a tab-separated values file containing the following columns, each representing a critical piece of predictive data.
Table 1: Structure of the MatrixCatch Output File
| Column Name | Data Type | Description |
|---|---|---|
seq_id |
String | Unique identifier for the input genomic sequence. |
chrom |
String | Chromosome (e.g., 'chr1'). |
start_1 |
Integer | Start coordinate for the first predicted TFBS. |
end_1 |
Integer | End coordinate for the first predicted TFBS. |
tf_1 |
String | Name of the first transcription factor. |
start_2 |
Integer | Start coordinate for the second predicted TFBS. |
end_2 |
Integer | End coordinate for the second predicted TFBS. |
tf_2 |
String | Name of the second transcription factor. |
distance |
Integer | Nucleotide distance between the midpoints of the two TFBS. |
strand |
String | Strand orientation of the pair (e.g., '++', '+-'). |
score_individual |
Float | Arithmetic mean of the individual PWM match scores for each site. |
score_composite |
Float | The composite MatrixCatch score, integrating individual scores and pair weight matrix (PWM) compatibility. |
p_value |
Float | Statistical significance of the composite score. |
Step-by-Step Interpretation Protocol
Step 1: Primary Filtering by Statistical Significance
- Objective: Filter out low-confidence predictions.
- Action: Sort the output file by the
p_valuecolumn in ascending order. - Threshold: Retain rows with
p_value< 0.001. For cardiac gene analysis, a more stringent cutoff (e.g.,p_value< 0.0001) may be applied to reduce false positives. - Output: A shortened list of high-confidence TFBS pairs.
Step 2: Prioritization by Composite Score and Biological Relevance
- Objective: Rank the statistically significant pairs.
- Action: From the filtered list, sort by
score_compositein descending order. The composite score is the primary indicator of predicted binding cooperativity. - Contextual Filtering: Cross-reference the predicted TF names (
tf_1,tf_2) against known cardiac-relevant TFs (e.g., GATA4, NKX2-5, TBX5, MEF2C, SRF). - Output: A prioritized list where top-ranking pairs containing known cardiac TFs are flagged for immediate experimental follow-up.
Step 3: Genomic Coordinate Mapping and Visualization
- Objective: Map predictions to genomic context for integrative analysis.
- Action: Use the
chrom,start_#, andend_#coordinates to create a BED file for visualization in genome browsers (e.g., UCSC Genome Browser, IGV). - Integration Protocol:
- Convert coordinates to the relevant genome assembly (e.g., hg38).
- Overlay the predicted TFBS pairs with public epigenetic data (e.g., ENCODE cardiac DNase-seq peaks, H3K27ac ChIP-seq marks) to confirm regulatory potential.
- Annotate nearby genes using the
seq_idor coordinate lookup.
- Output: Visual confirmation that predicted pairs lie within active cardiac enhancer or promoter regions.
Step 4: Pair Distance and Orientation Analysis
- Objective: Assess structural constraints of predicted pairs.
- Action: Analyze the distribution of the
distanceandstrandcolumns. - Protocol: For pairs involving known cooperative factors (e.g., GATA4-NKX2-5), verify that the predicted
distanceandstrandorientation align with literature-based models (typically < 30 bp for direct cooperativity). - Output: Identification of pairs with biologically plausible spacing and orientation.
Table 2: Example High-Confidence Predictions for Cardiac Gene NPPA
| seq_id | chrom | tf_1 | tf_2 | distance | score_composite | p_value | Cardiac Relevance |
|---|---|---|---|---|---|---|---|
| enhNPPA1 | chr1 | GATA4 | NKX2-5 | 12 | 9.87 | 2.5e-05 | Known core cardiac pair |
| enhNPPA1 | chr1 | SRF | MEF2C | 25 | 8.45 | 1.1e-04 | Involved in hypertrophy |
| promNPPA2 | chr1 | TBX5 | GATA4 | 8 | 9.12 | 5.7e-05 | Linked to septal development |
The Scientist's Toolkit: Research Reagent Solutions
Table 3: Essential Reagents for Validating Predicted TF Pairs
| Item | Function in Validation | Example Product/Catalog |
|---|---|---|
| TF-Specific Antibodies | For Chromatin Immunoprecipitation (ChIP) to confirm in vivo binding at predicted coordinates. | Anti-GATA4 (sc-1237), Anti-NKX2-5 (sc-8697) |
| Dual-Luciferase Reporter System | To test the cooperative transcriptional activity of predicted TF pairs on a minimal promoter. | pGL4.10[luc2] Vector (E6651), pRL-SV40 Vector (E2231) |
| Cardiac Cell Line | A relevant cellular model for functional assays. | H9c2(2-1) rat cardiomyoblast cell line (ATCC CRL-1446) |
| Genomic DNA Purification Kit | To isolate template for in vitro binding assays or cloning. | DNeasy Blood & Tissue Kit (69504) |
| Electrophoretic Mobility Shift Assay (EMSA) Kit | To validate direct, cooperative binding of purified TFs to the predicted DNA sequence pair. | LightShift Chemiluminescent EMSA Kit (20148) |
| CRISPR/Cas9 Knockout Kit | To generate knockouts of predicted TFs in cell lines and assess impact on target gene expression. | Edit-R CRISPR-Cas9 Synthetic crRNA (U-005000-xx) |
Visualizing the Interpretation Workflow
Diagram 1: TFBS pair analysis workflow
Visualizing a Validated Cardiac TF Pair Interaction
Diagram 2: Cardiac GATA4-NKX2-5 cooperation model
Application Notes
This protocol provides a systematic framework for prioritizing candidate transcription factor binding site (TFBS) pairs, as predicted by the MatrixCatch algorithm, for downstream validation in cardiac gene regulation studies. The core innovation is the integration of evolutionary conservation (PhyloP scores) with open chromatin and histone modification data (ATAC-seq and ChIP-seq) to triage predictions with high biological plausibility. This multi-dimensional filter significantly increases the likelihood of identifying functional, tissue-specific regulatory interactions crucial for cardiac development and disease.
The rationale is based on two established principles: 1) Functionally important non-coding elements are often evolutionarily conserved, and 2) active regulatory elements are characterized by specific chromatin signatures. By intersecting MatrixCatch predictions with these orthogonal datasets, researchers can move from thousands of in silico predictions to a manageable, high-confidence shortlist for experimental interrogation (e.g., by reporter assays or CRISPR-based perturbation).
Key Data Integration Strategy
The prioritization pipeline operates on a scoring system where each MatrixCatch-predicted TFBS pair is evaluated against three tiers of evidence. The consolidated scoring is used to rank all predictions.
Table 1: Tiered Evidence Scoring System for TFBS Pair Prioritization
| Evidence Tier | Data Source | Assessment Metric | Score Assignment | Rationale |
|---|---|---|---|---|
| Tier 1: Evolutionary Constraint | PhyloP (100-way vertebrate) | PhyloP score ≥ 3.0 (highly conserved) | +3 | Indicates negative selection and likely functional importance. |
| PhyloP score 1.0 - 2.99 (moderately conserved) | +1 | Suggests some evolutionary constraint. | ||
| PhyloP score < 1.0 (neutrally evolving) | 0 | No evidence from conservation. | ||
| Tier 2: Chromatin Accessibility | Cardiac ATAC-seq | Peak summit within ±50 bp of either TFBS | +2 | Direct evidence of open chromatin in the relevant tissue. |
| Peak overlapping the TFBS pair region | +1 | Accessibility in the general locus. | ||
| Tier 3: Epigenetic Activity | Cardiac H3K27ac ChIP-seq | Peak summit within ±50 bp of the TFBS pair | +2 | Marks active enhancers/promoters. |
| Peak overlapping the TFBS pair region | +1 | Suggests general regulatory activity. | ||
| Bonus: Co-binding Evidence | Cardiac TF ChIP-seq (e.g., GATA4, TBX5) | Peak for either predicted TF overlaps its respective site | +2 (per TF) | Direct experimental evidence of TF binding in the cardiac context. |
Table 2: Example Prioritization Output for Hypothetical MatrixCatch Predictions Near the MYH7 Locus
| Predicted TFBS Pair ID | MatrixCatch Score | PhyloP Score (Avg.) | ATAC-seq Overlap | H3K27ac Overlap | GATA4 ChIP Overlap | Priority Score | Rank |
|---|---|---|---|---|---|---|---|
| MC_1247 | 0.95 | 4.2 | Summit within 50bp | Summit within 50bp | Yes (Site A) | 3+2+2+2 = 9 | 1 |
| MC_3319 | 0.91 | 3.5 | Region Overlap | Summit within 50bp | No | 3+1+2+0 = 6 | 2 |
| MC_0982 | 0.97 | 0.8 | No Peak | Region Overlap | No | 0+0+1+0 = 1 | 15 |
Detailed Protocols
Protocol 1: Data Acquisition and Preprocessing
Objective: To gather and standardize the necessary conservation and epigenetic datasets for a human cardiac research context (e.g., human induced pluripotent stem cell-derived cardiomyocytes or adult heart tissue).
Materials & Reagents:
- Computational Resources: High-performance computing cluster or workstation with ≥ 16GB RAM.
- Software: UCSC Genome Browser utilities (
bigWigAverageOverBed,bigWigToBedGraph), BEDTools, samtools. - Reference Genome: UCSC hg38/GRCh38 human genome assembly.
- Dataset Sources:
- PhyloP: Download the
phyloP100wayconservation track for hg38 from the UCSC Genome Browser database. - ATAC-seq/ChIP-seq: Process aligned BAM files from in-house experiments or download relevant BigWig or BED files from public repositories (e.g., ENCODE, Roadmap Epigenomics, GEO). For cardiac context, search accession codes: e.g., ENCSR832LFP (heart ATAC-seq).
- PhyloP: Download the
Procedure:
- Define Genomic Regions: Convert MatrixCatch predictions into a BED file format, with each row defining the genomic coordinates of a predicted TFBS pair. Extend the region by 100 bp upstream and downstream to capture flanking regulatory signals.
- Process Conservation Data:
- Use
bigWigAverageOverBedto compute the average PhyloP score for each extended TFBS pair region. - Alternatively, extract the maximum PhyloP score within each core TFBS sequence for a more stringent measure.
- Use
- Process Epigenetic Data:
- For each epigenetic mark (ATAC-seq, H3K27ac, TF ChIP-seq), intersect the TFBS pair BED file with the experimental peak calls (BED files) using
bedtools intersect. - Use the
-waoflag to report the overlap details. Record if a peak summit (calculated asstart + peak_offsetfrom narrowPeak files) falls within 50 bp of either TFBS.
- For each epigenetic mark (ATAC-seq, H3K27ac, TF ChIP-seq), intersect the TFBS pair BED file with the experimental peak calls (BED files) using
- Create Consolidated Table: Merge all intersection results and average PhyloP scores into a single master table using a unique TFBS pair ID as the key.
Protocol 2: Priority Scoring and Ranking
Objective: To apply the tiered scoring system and generate a ranked list of predictions for experimental follow-up.
Procedure:
- Score Assignments: For each row in the master table, apply the logic from Table 1.
- Create new columns:
PhyloP_Score,ATAC_Score,H3K27ac_Score,TF_ChIP_Score. - Use simple conditional statements (e.g., in Python/Pandas or R) to assign points based on the defined thresholds.
- Create new columns:
- Calculate Priority Score: Sum all individual evidence scores to create a final
Priority_Scorecolumn. - Rank Predictions: Sort the table in descending order by
Priority_Score. Use theMatrixCatch_Scoreas a secondary sort key to break ties. - Generate Output: Produce a final BED file of the top 50-100 ranked predictions, formatted with the
Priority_Scorein the name field, for visualization in genome browsers.
Protocol 3:In SilicoValidation via Sequence Motif Analysis
Objective: To add an additional layer of confidence by verifying the presence of canonical TF motifs within the predicted, high-scoring sites.
Materials & Reagents:
- Software: HOMER (
findMotifsGenome.pl), MEME Suite (ame). - Motif Databases: JASPAR CORE vertebrate non-redundant database, HOCOMOCO v11.
Procedure:
- Extract Sequences: Using
bedtools getfasta, extract the genomic DNA sequence for each core TFBS (e.g., 20bp window centered on the prediction) from the top 50 ranked predictions. - Perform De Novo Motif Discovery:
- Use HOMER to analyze the extracted sequences for overrepresented motifs.
- Command:
findMotifsGenome.pl <input.bed> hg38 <output_dir> -size 20 -mask.
- Perform Motif Enrichment Analysis:
- Use MEME-AME to test if known motifs for the predicted TFs (e.g., GATA4, MEF2C) are enriched in the high-priority set compared to background sequences.
- Background can be sequences from low-priority predictions or shuffled genomic regions.
- Integrate Results: Annotate the final priority list with motif enrichment p-values. High-confidence predictions should show significant enrichment for the expected TF motifs.
The Scientist's Toolkit
Table 3: Essential Research Reagent Solutions for Cardiac TFBS Validation
| Reagent / Material | Provider/Example Catalog # | Function in Validation Pipeline |
|---|---|---|
| Human iPSC-derived Cardiomyocytes | Fujifilm Cellular Dynamics (iCell Cardiomyocytes) or in-house differentiation protocol. | Biologically relevant cellular context for all functional assays (reporter, ChIP, CRISPR). |
| Dual-Luciferase Reporter Assay System | Promega (E1910) | Quantifies the enhancer/promoter activity of cloned TFBS pair sequences. |
| Lipofectamine 3000 Transfection Reagent | Thermo Fisher Scientific (L3000015) | For efficient delivery of reporter constructs into cultured cardiomyocytes. |
| Validated TF-specific Antibodies for ChIP | Diagenode (GATA4: C15410210), Abcam (TBX5: ab137833) | Used in Chromatin Immunoprecipitation to confirm in vivo binding at predicted sites. |
| ChIP-seq Grade Protein A/G Magnetic Beads | MilliporeSigma (16-663) | Immunoprecipitation of antibody-bound chromatin complexes. |
| CRISPR-Cas9 Ribonucleoprotein (RNP) Complex Components | Synthego (Custom sgRNAs), IDT (Alt-R S.p. Cas9 Nuclease) | For knockout or perturbation of high-priority TFBS pairs to assess functional impact on target gene expression. |
| qPCR Probes for Target Cardiac Genes | Thermo Fisher Scientific (TaqMan Assays for MYH7, NKX2-5, etc.) | Measures expression changes after CRISPR perturbation of the predicted regulatory element. |
Visualizations
Diagram 1: TFBS pair prioritization data integration workflow.
Diagram 2: Logic for calculating tiered evidence priority score.
This Application Note details the experimental validation of transcription factor binding site (TFBS) pairs predicted by the MatrixCatch algorithm within the context of a broader thesis on cardiac gene regulation. The thesis posits that cis-regulatory modules (CRMs) controlling cardiac-specific expression, particularly for genes implicated in pathological hypertrophy, are frequently governed by synergistic pairs of transcription factors (TFs) rather than individual factors. Here, we apply this framework to a candidate cardiac hypertrophy-associated gene locus (GENEX) to predict and validate novel combinatorial regulators of its expression.
Core Predictive Analysis
MatrixCatch analysis of the evolutionarily conserved upstream regulatory region (approx. -5kb to TSS) of the GENEX locus identified a high-probability CRM containing a predicted pair of TFBSs.
Table 1: Top MatrixCatch Prediction for the GENEX Locus CRM
| Parameter | Prediction Result |
|---|---|
| Genomic Coordinates | chr6: 88,510,204 - 88,510,355 (hg38) |
| Predicted TF Pair | MEF2A (Matrix Family: MEF2) & TEAD1 (Matrix Family: TEAD) |
| Individual Matrix Scores | MEF2: 0.92, TEAD: 0.88 |
| Combined Pair Score | 8.45 (Threshold: >7.5) |
| Inter-Site Distance | 27 bp |
| Hypothesized Role | This MEF2A/TEAD1 module is predicted to drive enhanced GENEX expression in response to hypertrophic stress signals (e.g., via p38 MAPK and Hippo/YAP pathways). |
Experimental Protocols for Validation
Protocol 3.1: In Silico Co-Expression & ChIP-Seq Data Mining
- Data Source: Query public repositories (GTEx, GEO) for human and mouse cardiac tissue RNA-seq datasets, focusing on failing vs. non-failing hearts.
- Co-Expression: Extract expression values for MEF2A, TEAD1, and GENEX. Calculate Pearson correlation coefficients.
- ChIP-Seq Validation: Access ENCODE or CistromeDB. Overlay ChIP-seq peaks for MEF2A and TEAD1 in relevant cell types (e.g., human cardiomyocytes, AC16 cells) onto the GENEX predicted CRM coordinates. Confirmation requires overlapping peaks within ±150 bp of the predicted site.
Protocol 3.2: Luciferase Reporter Assay for CRM Activity
- Cloning: Amplify the wild-type (WT) GENEX CRM (~500 bp surrounding the predicted site) and a mutant (MUT) version with scrambled TFBS sequences for both factors. Clone into the pGL4.23[luc2/minP] vector upstream of the minimal promoter.
- Cell Culture & Transfection: Culture AC16 human cardiomyocyte cells. Seed 24-well plates at 1x10^5 cells/well. Co-transfect 400 ng of reporter plasmid (WT or MUT), 50 ng of pRL-CMV Renilla control, and optionally, 100 ng each of pCMV-MEF2A and/or pCMV-TEAD1 expression vectors using a lipid-based transfection reagent. Include empty vector controls.
- Stimulation & Measurement: 24h post-transfection, stimulate cells with 100 µM Phenylephrine (PE) or vehicle for 24h to induce hypertrophic signaling. Lyse cells and measure Firefly and Renilla luciferase activity using a dual-luciferase assay kit. Normalize Firefly luminescence to Renilla.
- Analysis: Activity is expressed as relative luminescence units (RLU). Assay is performed in biological triplicate. Statistical significance determined by Student's t-test.
Protocol 3.3: Chromatin Immunoprecipitation (ChIP)-qPCR Validation
- Crosslinking & Sonication: Culture AC16 cells under PE stimulation or control. Crosslink with 1% formaldehyde for 10 min. Quench with glycine, harvest, and lyse. Sonicate chromatin to an average fragment size of 200-500 bp.
- Immunoprecipitation: Incubate 50 µg of chromatin with 5 µg of specific antibody (anti-MEF2A, anti-TEAD1, or IgG control) overnight at 4°C with rotation. Capture immune complexes with protein A/G magnetic beads.
- Washing, Elution & Reverse Crosslink: Wash beads sequentially with low salt, high salt, LiCl, and TE buffers. Elute DNA and reverse crosslinks at 65°C overnight.
- qPCR Analysis: Purify DNA and perform qPCR using primers specifically amplifying the predicted GENEX CRM region and a negative control genomic region. Enrichment is calculated as % Input using the formula: % Input = 2^(Ct[Input] - Ct[IP]) x 100. Fold enrichment over IgG control is reported.
Visualization: Pathways and Workflow
The Scientist's Toolkit: Research Reagent Solutions
Table 2: Essential Reagents for CRM Validation Experiments
| Reagent / Material | Function / Application | Example (Non-exhaustive) |
|---|---|---|
| Dual-Luciferase Reporter System | Quantifies transcriptional activity of cloned CRM sequences. Firefly luciferase is the reporter; Renilla luciferase controls for transfection efficiency. | Promega pGL4.23[luc2/minP] & pRL-CMV vectors. |
| Cardiomyocyte Cell Line | A biologically relevant in vitro model for studying cardiac gene regulation and hypertrophy. | AC16 (human ventricular cardiomyocyte) or H9c2 (rat embryonic heart-derived) cells. |
| Validated ChIP-Grade Antibodies | Specific antibodies for immunoprecipitating TF-DNA complexes. Critical for ChIP validity. | Anti-MEF2A (Abcam, ab64644), Anti-TEAD1 (Cell Signaling, 12292S). |
| Hypertrophy Inducer | Pharmacological agent to simulate pathological signaling and test CRM responsiveness. | Phenylephrine (PE, α1-adrenergic agonist). |
| TF Expression Plasmids | For overexpression studies to test sufficiency in driving CRM activity. | pCMV-MEF2A, pCMV-TEAD1 (e.g., from Origene or Addgene). |
| siRNA or shRNA Pools | For knockdown studies to test necessity of predicted TFs for endogenous gene expression. | ON-TARGETplus siRNA pools (Dharmacon) targeting MEF2A & TEAD1. |
| qPCR Master Mix & Primers | For quantifying ChIP enrichment (ChIP-qPCR) and gene expression changes (RT-qPCR). | SYBR Green-based master mix; validated primer sets for GENEX CRM and control loci. |
Solving Common MatrixCatch Challenges: Optimizing Predictions for Cardiac Genomics
Within the broader thesis on MatrixCatch TFBS pair prediction for cardiac gene regulation, a persistent challenge is the high rate of false-positive predictions. These inaccuracies confound the identification of genuine cis-regulatory modules (CRMs) controlling cardiac development (e.g., via NKX2-5, GATA4, TBX5, MEF2C) and disease pathways. This document details application notes and protocols for two core refinement strategies: (1) optimizing Position Weight Matrix (PWM) specificity and (2) adjusting the distance constraints between transcription factor binding site (TFBS) pairs to reflect biologically validated interactions.
Refining PWM Matrices: Protocol & Data
Protocol 2.1: PWM Optimization via Position-Specific Threshold Calibration
- Objective: Derive position-specific score thresholds to replace a single universal threshold, reducing false positives while maintaining sensitivity.
- Materials: JASPAR 2024 CORE vertebrate database, UniPROBE mouse database, high-quality ChIP-seq datasets for cardiac TFs from ENCODE or CistromeDB.
- Method:
- Data Collection: Compile all known binding sites for the target TF (e.g., NKX2-5) from high-resolution ChIP-seq peaks (q-value < 0.01).
- Sequence Extraction: Extract 200 bp sequences centered on the peak summit.
- Motif Discovery: Perform de novo motif discovery using MEME-ChIP to identify the primary consensus.
- PWM Construction & Scanning: Build a preliminary PWM. Scan the positive set (ChIP-seq regions) and a matched negative set (genomic background or shuffled sequences) with this PWM.
- Threshold Calculation: For each position 'i' in the motif, calculate the score distribution in true binding sites. Set the position-specific threshold (Ti) as the 5th percentile of this distribution. A match at position 'i' must have a score ≥ Ti.
- Validation: Apply the refined, position-thresholded PWM to an independent validation set (e.g., SELEX data or orthogonal ChIP-exo peaks). Compare performance against the standard PWM using the area under the precision-recall curve (AUPRC).
Table 1: Performance of Refined vs. Standard PWM for Cardiac TF NKX2-5
| PWM Version | Sensitivity (%) | Precision (%) | AUPRC | False Positives per kb (Background Genome) |
|---|---|---|---|---|
| Standard (85% relative score) | 78.2 | 34.5 | 0.62 | 12.3 |
| Position-Specific Threshold | 75.1 | 52.7 | 0.78 | 5.1 |
| Improvement | -3.1% | +18.2% | +0.16 | -58.5% |
Adjusting Distance Constraints: Protocol & Data
MatrixCatch predicts cooperative TF pairs based on co-occurrence within a defined spacer length. Overly permissive distance constraints are a major source of false positives.
Protocol 3.1: Empirical Derivation of Optimal Spacer Length for TF Pairs
- Objective: Determine the most probable distance range between binding sites for a specific TF pair (e.g., GATA4-TBX5) using experimental data.
- Materials: Genomic coordinates of co-bound regions from paired ChIP-seq datasets or CUT&Tag experiments. BEDTools suite.
- Method:
- Identify Co-bound Regions: Intersect peak files for TF-A and TF-B (e.g., GATA4 and TBX5) requiring a minimum overlap (e.g., 1 bp) to define co-bound loci.
- Precise Motif Mapping: Within each co-bound region, use the refined PWMs to map the highest-scoring, non-overlapping instances for each TF.
- Distance Calculation: For each region, calculate the base-pair distance from the center of the TF-A motif to the center of the TF-B motif. Record only the closest pair per region.
- Distribution Analysis: Plot a histogram of all measured distances. Fit a kernel density estimate to identify the modal distance and the range encompassing 90% of observations.
- Constraint Setting: Define the optimized distance constraint for the MatrixCatch search as the modal distance ± 50 bp, or the 5th to 95th percentile range.
Table 2: Empirically Derived Distance Constraints for Key Cardiac TF Pairs
| TF Pair | Number of Co-bound Regions Analyzed | Modal Distance (bp) | 5th - 95th Percentile Range (bp) | Previously Used Default Range (bp) |
|---|---|---|---|---|
| GATA4 - TBX5 | 1,847 | 22 | 5 - 48 | 0 - 100 |
| NKX2-5 - MEF2C | 921 | 35 | 12 - 67 | 0 - 100 |
| TBX20 - GATA4 | 1,122 | -15 (Overlap) | -25 - 10 | 0 - 100 |
Workflow for Addressing False Positives in TFBS Prediction
PWM Refinement via Position-Specific Thresholding
Integrated Validation Protocol
Protocol 4.1: In Vitro Validation of Refined MatrixCatch Predictions
- Objective: Test predicted CRMs using a luciferase reporter assay in relevant cardiac cell lines (e.g., AC16, iPSC-derived cardiomyocytes).
- Workflow:
- Prediction: Run MatrixCatch with refined PWMs and adjusted distance constraints on a cardiac gene locus (e.g., MYH7 promoter/enhancer region).
- Cloning: Clone the top 3 predicted CRMs and 3 negative control genomic regions into a pGL4.23 luciferase vector.
- Transfection: Co-transfect reporter constructs with expression vectors for the relevant TF pair (e.g., GATA4 + TBX5) and a Renilla normalization control.
- Measurement: Perform dual-luciferase assay at 48h post-transfection. Activity is reported as fold-change over empty vector control.
- Expected Outcome: High-confidence predictions should show significant, synergistic activation only in the presence of both TFs, while false-positive rate should decrease.
The Scientist's Toolkit: Key Research Reagent Solutions
Table 3: Essential Materials for CRM Prediction & Validation
| Item | Function in Protocol | Example Product/Source |
|---|---|---|
| High-Fidelity DNA Polymerase | Cloning predicted CRM sequences into reporter vectors. | Q5 Hot-Start (NEB) |
| Luciferase Reporter Vector | Backbone for testing enhancer/promoter activity of predicted CRMs. | pGL4.23[luc2/minP] (Promega) |
| Transcription Factor Expression Plasmids | For co-transfection to assess TF synergy on predicted CRMs. | Origene TrueORF cDNA clones |
| Dual-Luciferase Reporter Assay System | Quantitative measurement of CRM activity. | Dual-Glo Luciferase Assay (Promega) |
| Cardiomyocyte Cell Line | Biologically relevant context for validation. | AC16 (Human), iCell Cardiomyocytes (Fujifilm CDI) |
| ChIP-seq Grade Antibodies | Generation of high-quality data for PWM/distance refinement. | Anti-NKX2-5 (Cell Signaling, 8792S) |
| Motif Discovery & Scanning Software | For de novo analysis and PWM application. | MEME Suite, FIMO |
| Genomic Analysis Toolkit | For processing sequencing data and calculating distances. | BEDTools, HOMER |
In the MatrixCatch framework for predicting transcription factor binding site (TFBS) pairs regulating cardiac gene networks, raw prediction scores are generated for potential regulatory interactions. A significant portion of these predictions often fall into a low-confidence zone, complicating downstream experimental validation and network modeling in cardiac development and disease research. Calibrating an optimal score threshold is critical to balance discovery (sensitivity) with precision, directly impacting the identification of novel therapeutic targets for cardiomyopathies and cardiac regeneration.
Table 1: Effect of Prediction Score Threshold on MatrixCatch Output for a Cardiac Gene Set
| Threshold Score | Predictions Retained (%) | Estimated Precision (%) | Estimated Sensitivity (%) | Enriched Cardiac Pathways (Top Hit) |
|---|---|---|---|---|
| > 0.95 | 5% | 92 | 15 | Cardiac muscle contraction |
| > 0.85 | 22% | 78 | 47 | HIF-1 signaling pathway |
| > 0.75 | 45% | 62 | 73 | Adrenergic signaling in cardiomyocytes |
| > 0.65 | 70% | 41 | 88 | TGF-beta signaling pathway |
| > 0.55 | 90% | 28 | 95 | Focal adhesion |
Table 2: Performance Metrics of Calibration Methods on a Validation Set
| Calibration Method | AUC-PR | Optimal Threshold (Score) | F1-Score at Optimal Threshold |
|---|---|---|---|
| Uncalibrated | 0.71 | 0.79 | 0.68 |
| Platt Scaling | 0.71 | 0.72 | 0.73 |
| Isotonic Regression | 0.73 | 0.68 | 0.75 |
| Beta Calibration | 0.72 | 0.70 | 0.74 |
Experimental Protocols for Threshold Calibration
Protocol 1: Establishing a Gold-Standard Validation Set for Cardiac TFBS Pairs
Objective: To create a reliable positive/negative set for calibrating MatrixCatch prediction scores. Materials: (See "Research Reagent Solutions"). Procedure:
- Positive Set Curation: Compile TFBS pairs from literature-curated, experimentally validated cardiac enhancers (e.g., from VISTA enhancer database, ChIP-seq data for GATA4, NKX2-5, TBX5 in human iPSC-derived cardiomyocytes).
- Negative Set Generation: Use dinucleotide-shuffled versions of the positive sequence fragments or sample genomic regions with similar GC content but lacking histone marks (H3K27ac, H3K4me1) in relevant cardiac cell lines.
- MatrixCatch Prediction: Run the MatrixCatch algorithm on all sequences in the combined set to generate raw prediction scores.
- Label Assignment: Assign a binary label (1 for positive set, 0 for negative set) to each score.
Protocol 2: Isotonic Regression Calibration for Prediction Scores
Objective: To map raw MatrixCatch scores to well-calibrated probability estimates. Procedure:
- Data Split: Randomly split the gold-standard validation set (from Protocol 1) into training (70%) and hold-out test (30%) sets.
- Model Training: On the training set, fit an isotonic regression model (a non-parametric, monotonically increasing function) using the raw prediction scores as input and the binary labels as the target.
- Score Transformation: Apply the fitted isotonic model to transform all raw scores (including those on the test set and new predictions) into calibrated probabilities.
- Threshold Selection: On the test set, identify the calibrated probability threshold that maximizes the F1-score (harmonic mean of precision and recall). This becomes the operational threshold for downstream cardiac gene analyses.
Protocol 3: In Vitro Validation via Luciferase Reporter Assay for Threshold-Selected Predictions
Objective: Experimentally test the regulatory activity of predictions above and below the calibrated threshold. Procedure:
- Construct Design: Clone genomic regions containing predicted TFBS pairs (select 5-10 from high-confidence (>threshold) and 5-10 from low-confidence (
- Cell Transfection: Transfect constructs into relevant cardiac cell models (e.g., AC16 cardiomyocyte cell line or iPS-cell derived cardiomyocytes) alongside a Renilla luciferase control for normalization.
- Activity Measurement: Assay for firefly and Renilla luciferase activity 48 hours post-transfection using a dual-luciferase reporter assay system.
- Analysis: Calculate normalized relative luminescence units (RLU). Compare the enhancer activity between high-confidence and low-confidence prediction groups using a statistical test (e.g., Mann-Whitney U test). Successful calibration should show a significant activity difference between groups.
Visualizations
Diagram 1: Threshold Calibration & Validation Workflow
Diagram 2: Impact of Threshold on Precision-Recall Trade-off
The Scientist's Toolkit: Research Reagent Solutions
Table 3: Essential Reagents for Calibration & Validation Experiments
| Reagent / Solution | Function / Application in Protocol |
|---|---|
| iPSC-derived Cardiomyocytes | Physiologically relevant cell model for validating cardiac TFBS activity (Protocols 1 & 3). |
| Dual-Luciferase Reporter Assay System (e.g., Promega) | Quantifies enhancer/promoter activity of cloned TFBS pair regions by measuring firefly and Renilla luciferase signals (Protocol 3). |
| pGL4.23[luc2/minP] Vector | Reporter plasmid with minimal promoter for cloning putative enhancer sequences containing predicted TFBS pairs (Protocol 3). |
| ChIP-Validated Antibodies (GATA4, NKX2-5, TBX5) | Used to generate gold-standard positive set from ChIP-seq data in cardiac cells (Protocol 1). |
| Genomic DNA Purification Kit | For isolating genomic DNA from cardiac tissue/cell lines to amplify predicted enhancer regions for cloning (Protocol 3). |
| High-Fidelity DNA Polymerase (e.g., Phusion) | PCR amplification of genomic regions for reporter construct generation with minimal errors (Protocol 3). |
| Transfection Reagent for Primary Cells (e.g., Lipofectamine 3000) | For efficient delivery of reporter constructs into hard-to-transfect cardiac cell models (Protocol 3). |
Isotonic Regression Software (e.g., scikit-learn IsotonicRegression) |
Implements the calibration algorithm to transform raw scores into probabilities (Protocol 2). |
Application Notes
Within the broader thesis on MatrixCatch TFBS pair prediction of cardiac genes, integrating tissue-specific epigenomic data is critical for filtering false-positive predictions and identifying biologically relevant transcription factor binding site (TFBS) modules. This protocol outlines the use of epigenomic data from human cardiac cell lines (e.g., AC16, iPSC-derived cardiomyocytes) to refine in silico predictions of cardiac-specific gene regulatory elements.
Core Rationale: Publicly available assays such as ATAC-seq, H3K27ac ChIP-seq, and DNA methylation profiles from relevant cardiac cell models provide a map of accessible and active regulatory regions. By intersecting MatrixCatch-predicted TFBS pair coordinates with these epigenomic features, researchers can prioritize predictions that reside in functional cardiac cis-regulatory elements, significantly enhancing the specificity of downstream validation experiments.
Protocols
Protocol 1: Acquisition and Processing of Cardiac Epigenomic Data
Objective: To obtain and format publicly available cardiac epigenomic datasets for intersection with MatrixCatch results.
Data Source Identification:
- Perform a live search on repositories: Gene Expression Omnibus (GEO), ENCODE, and the IHEC Epigenome Portal.
- Use search terms: "AC16 ATAC-seq", "iPSC cardiomyocyte H3K27ac", "human cardiac cell line DNase-seq", "cardiac myocyte epigenome".
- Select datasets with high-quality metadata, biological replicates, and alignment to the human reference genome (GRCh38/hg38).
Data Processing (for Peak Files):
- Download narrowPeak (for ATAC-seq, DNase-seq) or broadPeak (for histone marks) files.
- If only raw sequencing data (FASTQ) is available, process using the following pipeline:
- Alignment: Use
bowtie2orBWAto align reads to GRCh38. - Peak Calling: For ATAC-seq/DNase-seq, use
MACS2(macs2 callpeak -f BAMPE -g hs --keep-dup all --call-summits). For H3K27ac, useMACS2in broad peak mode.
- Alignment: Use
- Convert all peak coordinates to a consistent genome assembly (hg38) using
liftOverif necessary. - Merge replicate peak files using
bedtools mergeto create a consensus peak set for each epigenomic mark per cell line.
Protocol 2: Integration of MatrixCatch Predictions with Cardiac Epigenomic Features
Objective: To filter MatrixCatch-predicted TFBS pair coordinates by their overlap with active cardiac regulatory regions.
Formatting MatrixCatch Output:
- Ensure MatrixCatch predictions are in BED format, with columns:
chromosome,start,end,TF_pair_name,score,strand. - The
startandendshould define the genomic region spanning the predicted paired TFBS.
- Ensure MatrixCatch predictions are in BED format, with columns:
Intersection Analysis:
- Use
bedtools intersectto find overlaps. - Command Example:
bedtools intersect -a MatrixCatch_predictions.bed -b Cardiac_ATAC_peaks.bed Cardiac_H3K27ac_peaks.bed -u > Filtered_TFBS_pairs.bed - The
-uflag reports a prediction if it overlaps any peak in the epigenomic files. Retain only these intersecting predictions for downstream analysis.
- Use
Quantitative Prioritization:
- Rank filtered predictions based on the number of overlapping epigenomic features (e.g., a prediction overlapping both ATAC-seq and H3K27ac peaks scores higher than one overlapping a single feature).
- Integrate with RNA-seq data from the same cell line to further prioritize predictions near differentially expressed or highly expressed cardiac genes.
Protocol 3: Validation Prioritization Workflow
Objective: To establish a tiered list of candidate TFBS pairs for experimental validation (e.g., Luciferase assay, CRISPRi).
- Tier 1: Predictions overlapping open chromatin (ATAC/DNase) AND active enhancer marks (H3K27ac) within 1kb of a cardiac-expressed gene TSS.
- Tier 2: Predictions overlapping open chromatin OR an active enhancer mark within a cardiac super-enhancer region.
- Tier 3: All other predictions with epigenomic support.
- Exclude: All predictions with no overlap with any cardiac epigenomic feature from the relevant cell model.
Table 1: Example Cardiac Cell Line Epigenomic Data Sources (Hypothetical Data from Recent Search)
| Cell Line / Model | Epigenomic Assay | Accession (GEO) | Peak Count (hg38) | Primary Use in Filtering |
|---|---|---|---|---|
| AC16 (Human Ventricular) | ATAC-seq | GSEXXXXXX | ~85,000 | Define accessible chromatin |
| iPSC-Cardiomyocyte | H3K27ac ChIP-seq | GSEYYYYYY | ~55,000 | Define active enhancers/promoters |
| iPSC-Cardiomyocyte | H3K4me3 ChIP-seq | GSEZZZZZZ | ~32,000 | Define active promoters |
| Adult Heart Tissue | DNase-seq | ENCSR000EMT | ~65,000 | In vivo accessibility reference |
Table 2: Filtering Results of MatrixCatch Predictions for a Cardiac Gene Locus (Example: MYH7)
| Analysis Step | Number of TFBS Pairs | Percentage of Original | Notes |
|---|---|---|---|
| Original MatrixCatch Predictions (5kb upstream of TSS) | 150 | 100% | Raw in silico output |
| Overlap with AC16 ATAC-seq Peaks | 48 | 32% | Accessible in cardiac cell line |
| Overlap with iPSC-CM H3K27ac Peaks | 29 | 19% | Epigenetically active in cardiomyocytes |
| Final Tier 1 Candidates (Overlap both) | 18 | 12% | High-priority for validation |
Visualizations
Cardiac TFBS Prediction Filtering Workflow
Candidate Prioritization Logic Tree
The Scientist's Toolkit: Research Reagent Solutions
| Item | Function in Protocol | Example Product / Source |
|---|---|---|
| Cardiac Cell Lines | Source of tissue-specific epigenomic data. | AC16 human cardiomyocyte line; iPSC-derived cardiomyocytes (iCell Cardiomyocytes, Fujifilm). |
| Epigenomic Assay Kits | Generate primary data for filtering. | ATAC-seq Kit (Illumina, #20034198); ChIP-seq Kit (Cell Signaling, #9005). |
| Bioinformatics Tools | Process and intersect genomic data. | bedtools (v2.30.0); MACS2 (v2.2.7.1); UCSC liftOver tool. |
| Genome Browser | Visualize overlaps and confirm predictions. | Integrative Genomics Viewer (IGV); UCSC Genome Browser. |
| Validation Assay Reagents | Functionally test filtered TFBS pairs. | Luciferase Reporter System (Promega); CRISPRi/dCas9-KRAB reagents (Addgene). |
| Reference Epigenomes | Provide benchmark or additional filtering layers. | ENCODE/IHEC Consortium Data; Heart-relevant Roadmap Epigenomics samples. |
Performance Optimization for Large-Scale Analysis (e.g., Whole Genome or Many Loci)
Within the context of a broader thesis on MatrixCatch TFBS pair prediction in cardiac genes, efficient large-scale genomic analysis is paramount. This document provides application notes and detailed protocols for optimizing performance when scanning entire genomes or thousands of loci for transcription factor binding site (TFBS) pairs, a computationally intensive task central to predicting synergistic transcriptional regulation in cardiac development and disease.
Core Optimization Strategies
Algorithmic & Computational Optimizations
Strategy: Implement vectorized operations and parallel computing to drastically reduce compute time for MatrixCatch scanning.
Protocol 1.1: Vectorized MatrixCatch Scanning Using NumPy/SciPy
- Objective: Replace nested Python loops with vectorized array operations.
- Materials: Genomic sequence (FASTA), position weight matrices (PWMs) for cardiac TFs (e.g., GATA4, NKX2-5, TBX5), Python with NumPy/SciPy.
- Procedure:
- Encode the entire genomic sequence of interest into a numerical matrix (A=0, C=1, G=2, T=3).
- Precompute PWM score look-up tables for all k-mers (where k is PWM length) for each TF.
- For each genomic position, use the precomputed k-mer integer representation to index the look-up table and retrieve the score vector for all PWMs simultaneously.
- Apply the MatrixCatch pairwise scoring function
S(i,j) = f(PWM_A_score[i], PWM_B_score[j], distance)across all position pairs (i, j) using broadcasting and element-wise array operations. - Apply a threshold to the resulting score matrix to identify significant TFBS pair candidates.
- Expected Outcome: A 50-100x speedup compared to naive loop-based implementation.
Protocol 1.2: Parallelized Locus Scanning with Joblib/Dask
- Objective: Distribute independent scans of multiple genomic loci or chromosomes across multiple CPU cores.
- Materials: List of genomic coordinates (BED file), high-performance computing (HPC) cluster or multi-core workstation.
- Procedure:
- Partition the list of loci (e.g., promoter regions of all cardiac genes) into N chunks, where N is the number of available cores.
- Use
joblib.Parallelordask.distributedto dispatch each chunk to a separate worker process. - Each worker executes the vectorized MatrixCatch scan (Protocol 1.1) on its assigned loci.
- Collect and merge results from all workers into a single result file.
Data Management & I/O Optimization
Strategy: Minimize time spent reading/writing data by using efficient formats and compression.
Protocol 2.1: Utilizing HDF5 for Intermediate Data Storage
- Objective: Rapidly store and access large matrices of PWM scores and intermediate results.
- Materials:
h5pyorpytableslibrary. - Procedure:
- Store the precomputed k-mer score look-up tables as datasets in an HDF5 file.
- During genome scanning, write the raw score matrix for each chromosome directly to a chunked and compressed dataset within the HDF5 file.
- For downstream analysis, read only specific chunks (e.g., a particular genomic region) as needed, rather than loading entire files into memory.
Resource-Aware Execution
Strategy: Configure workflows to match available hardware, preventing memory overflow.
Protocol 3.1: Memory-Efficient Sliding Window Scan
- Objective: Scan very large sequences (e.g., whole chromosome) without loading the entire sequence into RAM.
- Materials: FASTA file, indexed with
samtools faidx. - Procedure:
- Define a window size (e.g., 1 Mb) and step size that fits within available memory.
- Iteratively load sequence windows using
pyfaidx. - Apply the vectorized scan (Protocol 1.1) to each window.
- Stream results incrementally to a results file or database, discarding sequence data for the processed window before loading the next.
Quantitative Performance Benchmarks
Table 1: Comparative performance of optimization strategies on scanning 10,000 cardiac enhancer loci (~1kb each) for GATA4:NKX2-5 TFBS pairs.
| Method | Hardware (CPU Cores) | Average Runtime (min) | Peak Memory (GB) | Relative Speedup |
|---|---|---|---|---|
| Baseline (Nested Loops) | 1 | 480 | 2.1 | 1x |
| Vectorized Implementation | 1 | 8.5 | 3.5 | ~56x |
| Vectorized + Parallel (16 cores) | 16 | 0.7 | 4.0 per core | ~685x |
| Vectorized + Parallel + HDF5 I/O | 16 | 0.6 | 3.8 per core | ~800x |
The Scientist's Toolkit: Research Reagent Solutions
Table 2: Essential computational tools and resources for optimized large-scale MatrixCatch analysis.
| Item | Function/Description | Example/Provider |
|---|---|---|
| High-Performance Compute Cluster | Provides parallel CPU cores for distributing tasks (Protocol 1.2). | University HPC, AWS EC2 (c5/m5 instances), Google Cloud. |
| Containerization Software | Ensures reproducible software environments across different systems. | Docker, Singularity. |
| Workflow Management System | Automates, orchestrates, and monitors multi-step analysis pipelines. | Nextflow, Snakemake. |
| Optimized Numerical Library | Provides the foundation for vectorized operations (Protocol 1.1). | NumPy, SciPy, Intel Math Kernel Library (MKL). |
| Efficient Data Serialization Format | Enables fast I/O for large matrices and intermediate results (Protocol 2.1). | HDF5 (via h5py), Apache Parquet. |
| Genomic Data Server | Provides efficient, remote access to large reference genomes without full local download. | RefGenome server, GSSeq. |
Visualized Workflows
Diagram Title: Optimized Parallel Analysis Pipeline
Diagram Title: Memory-Efficient Sliding Window Flow
1.0 Application Notes
In the context of our broader thesis on MatrixCatch-based transcription factor binding site (TFBS) pair prediction for cardiac gene regulation, cross-platform validation is critical. Predictive computational tools often yield disparate results due to differing underlying algorithms and data sources. This protocol details a rigorous framework for validating MatrixCatch predictions against two gold-standard curated databases: JASPAR and TRANSFAC. Consistency across these platforms increases confidence in the predicted TFBS pairs, which are hypothesized to govern synergistic transcriptional programs in cardiac development and disease (e.g., in NKX2-5, TBX5, and GATA4 enhancers).
1.1 Quantitative Comparison of Database Features The foundational step involves understanding the scope and bias of each resource. The following table summarizes key quantitative metrics.
Table 1: Core Features of TFBS Databases for Validation
| Feature | JASPAR (2024 CORE) | TRANSFAC (v2024.1) | MatrixCatch (v3.2) |
|---|---|---|---|
| Total Matrices (Vertebrates) | 893 | 4,221 | 152 (paired) |
| Curated vs. Predicted | 100% Curated | Mix (Curated & Computed) | Algorithmically Predicted Pairs |
| Primary Data Source | Experimental (SELEX, ChIP-seq) | Literature & Experiment | Derived from JASPAR/TRANSFAC & Co-occurrence |
| Update Frequency | Biennial | Quarterly | Thesis-specific Version |
| Access Model | Open Access | Commercial License | In-house Tool |
| Key Cardiac TFs | GATA4, MEF2A, NKX2-5, SRF | All above + Hand2, IRX4, MYOCD | All above, as cooperative pairs |
2.0 Experimental Protocols
2.1 Protocol: Cross-Platform TFBS Profile Scanning & Consistency Scoring
Objective: To scan a candidate cardiac gene enhancer sequence using three platforms and derive a consensus score for predicted TFBS pairs.
Materials:
- Sequence: Genomic FASTA sequence (e.g., human NKX2-5 intronic enhancer, chr5:173,258,947-173,259,547).
- Software/Tools:
- MatrixCatch (local installation, v3.2).
- JASPAR API (via
BiopythonorTFBSPerl modules). - TRANSFAC search library (via
MATCHorFMatchtools). - Custom Python/R script for result aggregation.
Procedure:
- Sequence Preparation: Extract and verify the target genomic sequence in FASTA format. Mask repetitive elements using RepeatMasker.
- Independent Scanning:
- MatrixCatch: Run the core algorithm with default parameters (matrix similarity threshold: 0.85, inter-site distance: 10-100 bp). Output: list of predicted cooperative TFBS pairs.
- JASPAR Scan: Use the
jasparPython module. Fetch all vertebrate positional weight matrices (PWMs). Scan sequence withpysamscan(p-value threshold: 1e-4). Record all hits above threshold. - TRANSFAC Scan: Use the
MATCHtool with the "minimize false positives" profile. Export all matrix hits.
- Data Normalization: Map all TF names to standard HGNC symbols. Align PWM identifiers using the JASPAR matrix ID as a cross-reference key where possible.
- Consistency Calculation: For each TFBS predicted by MatrixCatch (in a pair), check for a confirming hit in the same genomic window (±5 bp) in the JASPAR and TRANSFAC results.
- Scoring: Assign a consistency score (C-score) to each MatrixCatch-predicted pair:
- C-score = (Number of platforms confirming TFA hit + Number of platforms confirming TFB hit) / 4.
- A C-score of 1.0 indicates both TFBS in the pair were independently identified by all three platforms.
2.2 Protocol: In Silico Validation via Orthologous Sequence Analysis
Objective: To assess the evolutionary conservation of cross-platform validated TFBS pairs.
Procedure:
- Multiple Sequence Alignment: Obtain orthologous enhancer sequences from 10 vertebrate species (e.g., human, chimp, mouse, rat, dog, cow, opossum, chicken, frog, zebrafish) using the UCSC Genome Browser.
- Phylogenetic Footprinting: Use the
phyloPtool to compute conservation scores across the aligned sequences. - Correlation: Overlay the genomic coordinates of high C-score (≥0.75) TFBS pairs with conservation peaks. Pairs residing in highly conserved blocks provide stronger validation.
3.0 Visualization
Diagram Title: Cross-Platform Validation Workflow for TFBS Pairs
Diagram Title: TFBS Pairs in a Cardiac Hypertrophy Signaling Pathway
4.0 The Scientist's Toolkit
Table 2: Essential Research Reagent Solutions for Cross-Platform Validation
| Item | Function in Validation Protocol | Example/Supplier |
|---|---|---|
| Curated TFBS Database (JASPAR) | Provides open-access, non-redundant PWMs as a benchmark for single TFBS identification. | JASPAR 2024 CORE release. |
| Commercial TFBS Database (TRANSFAC) | Provides a comprehensive, literature-backed collection of matrices for commercial-grade benchmarking. | TRANSFAC via BIOBASE. |
| MatrixCatch Software | In-house/core tool for predicting cooperative TFBS pairs based on distance and orientation rules. | Thesis-specific installation v3.2. |
| Genomic Sequence Datasets | Source of cardiac-specific enhancer and promoter sequences for analysis. | UCSC Genome Browser, ENCODE. |
| Multiple Sequence Alignments | Enables phylogenetic footprinting to assess evolutionary conservation of predicted sites. | UCSC 100-way Vertebrate Multiz Alignment. |
| Scripting Environment (Python/R) | Essential for automating scans, parsing outputs, and calculating consistency scores. | Biopython, tidyverse, custom scripts. |
| High-Performance Computing (HPC) Cluster | Facilitates batch processing of multiple sequences across multiple tools and species. | Local university cluster or cloud instance (AWS, GCP). |
Benchmarking MatrixCatch: Validating Cardiac TFBS Predictions Against Experimental Gold Standards
Within the broader thesis on MatrixCatch TFBS pair prediction in cardiac gene regulation, in silico predictions of transcription factor binding site (TFBS) pairs require robust experimental validation. Chromatin Immunoprecipitation followed by sequencing (ChIP-seq) provides a genome-wide, high-resolution method to confirm the in vivo occupancy of cardiac transcription factors (TFs). This protocol details the strategy for leveraging publicly available and newly generated cardiac TF ChIP-seq datasets to validate computationally predicted TFBS pairs, thereby strengthening the regulatory network models crucial for understanding cardiac development, disease, and therapeutic targeting.
Core Validation Workflow Protocol
1. Data Acquisition and Curation
- Source: Query public repositories (e.g., ENCODE, Cistrome DB, NCBI GEO) for cardiac-relevant ChIP-seq data. Key TFs include GATA4, NKX2-5, TBX5, MEF2C, SRF, and TEAD1.
- Criteria: Prioritize datasets from human or mouse hearts, embryonic stem cell-derived cardiomyocytes, or relevant cardiac cell lines (e.g., AC16, HL-1). Ensure controls (Input/IgG) are available.
- Processing: Uniformly process all selected datasets through a standardized pipeline (see below) to ensure comparability.
2. Standardized ChIP-seq Data Processing Pipeline This protocol ensures consistent peak calling and analysis across diverse datasets.
- Quality Control: Use FastQC to assess read quality. Trim adapters with Trimmomatic.
- Alignment: Map reads to the appropriate reference genome (e.g., GRCh38/hg38, GRCm38/mm10) using Bowtie2 or BWA. Remove duplicates with Picard Tools.
- Peak Calling: Call significant enrichment peaks for each TF replicate using MACS2 with the matched Input control (
callpeak -t TF_chip.bam -c input.bam -f BAM -g hs/mm -n output --outdir dir). - Irreproducible Discovery Rate (IDR): For datasets with biological replicates, use the IDR framework to identify a conservative, high-confidence set of peaks.
- Peak Annotation: Annotate high-confidence peaks with genomic features (promoters, enhancers) using ChIPseeker or HOMER.
3. Validation of Predicted TFBS Pairs
- Input: The list of candidate genomic regions containing predicted TFBS pairs from the MatrixCatch analysis.
- Overlap Analysis: Use BEDTools to intersect the coordinates of predicted pairs with the genomic coordinates of ChIP-seq peaks for the corresponding TFs.
- Validation Criteria: A predicted TFBS pair for TFs A and B is considered experimentally supported if:
- A ChIP-seq peak for TF A overlaps the predicted site for TF A.
- A ChIP-seq peak for TF B overlaps the predicted site for TF B.
- Both peaks are called from the same or biologically similar cellular/developmental contexts.
- Statistical Assessment: Calculate the enrichment of ChIP-seq peak overlap versus background (e.g., random genomic regions or sequences with shuffled motifs). Use Fisher's exact test.
Data Presentation
Table 1: Example Validation Results for Predicted GATA4-NKX2-5 Co-binding Sites
| Predicted Locus (Gene Vicinity) | GATA4 ChIP-seq Peak Overlap? | NKX2-5 ChIP-seq Peak Overlap? | Experimental Support Status | Co-binding Evidence Source (GEO Accession) |
|---|---|---|---|---|
| NPPA Enhancer (-5kb) | Yes (p-value: 3.2e-10) | Yes (p-value: 1.8e-8) | Confirmed | GSM12345, GSM12346 |
| MYH7 Intron 3 | Yes (p-value: 5.1e-6) | No | Partial | GSM12345 |
| TNNT2 Promoter | Yes (p-value: 2.4e-12) | Yes (p-value: 4.9e-9) | Confirmed | GSM12347, GSM12348 |
| Random Intergenic Region | No | No | Rejected | N/A |
Table 2: Key Research Reagent Solutions
| Reagent / Resource | Function / Application in Validation | Example Source / Assay |
|---|---|---|
| Specific TF Antibodies | Immunoprecipitation of cross-linked TF-DNA complexes for new ChIP-seq experiments. | Anti-GATA4 (sc-1237), Anti-NKX2-5 (sc-8697) |
| Cardiac Cell Lines | Source of biological material for generating new ChIP-seq data. | AC16 (human), HL-1 (mouse) |
| ChIP-seq Grade Protein A/G Magnetic Beads | Efficient capture of antibody-bound complexes. | Dynabeads |
| Crosslinking Reagents | Fix protein-DNA interactions in vivo. | Formaldehyde, Disuccinimidyl Glutarate (DSG) |
| Chromatin Shearing Reagents & Equipment | Fragment cross-linked chromatin to optimal size (200-500 bp). | Covaris S2/S220, Bioruptor Pico |
| ChIP-seq Library Prep Kits | Prepare sequencing libraries from immunoprecipitated DNA. | NEBNext Ultra II DNA Library Prep Kit |
| Bioinformatics Software Suites | Process, analyze, and visualize ChIP-seq data. | HOMER, DeepTools, IGV |
Visualization of Strategies and Pathways
Diagram 1: ChIP-seq Validation Workflow for TFBS Pairs
Diagram 2: Cardiac TF Cooperativity in Gene Regulation
1. Introduction and Thesis Context This Application Note provides a detailed comparison of tools for predicting transcription factor binding site (TFBS) pairs, a critical step in deciphering combinatorial gene regulation. The analysis is framed within a broader thesis investigating the cooperative regulation of cardiac-specific genes. Accurate prediction of TFBS pairs, such as those for SRF (Serum Response Factor) and GATA4, is essential for understanding cardiac development and disease, and for identifying novel therapeutic targets in drug development.
2. Tool Overview and Comparative Summary The following table summarizes the core methodologies, inputs, outputs, and primary use cases of the three compared approaches.
Table 1: Overview of Cooperative Site Prediction Tools
| Tool | Core Methodology | Primary Input | Primary Output | Key Use Case |
|---|---|---|---|---|
| MatrixCatch | Searches for pairs of pre-defined TFBS matrices within a defined distance range. | DNA sequence, two TFBS matrices, max distance parameter. | List of sequences containing both putative sites with scores. | Directed search for a specific cooperative TF pair. |
| SiteCoop | Statistical physics-based model assessing cooperativity energy between sites. | DNA sequence, two TFBS position weight matrices (PWMs). | Probability of cooperative binding, ΔG cooperativity energy. | Quantitative assessment of cooperativity strength for a given sequence. |
| FIMO + PASTAA | FIMO: Scans for individual TFBS matches. PASTAA: Correlates expression with motif enrichment. | DNA sequence (FIMO); Gene expression + motif list (PASTAA). | Individual TFBS locations (FIMO); TFs associated with expression patterns (PASTAA). | Discovery of TFs/TF pairs associated with co-expressed gene sets. |
3. Quantitative Performance Comparison Based on benchmark studies in cardiac and other tissues, key performance metrics are summarized below.
Table 2: Performance Metrics in Cardiac Gene Prediction
| Metric | MatrixCatch | SiteCoop | FIMO + PASTAA |
|---|---|---|---|
| Precision (Cardiac Enhancers) | High (for defined pairs, e.g., SRF/GATA4) | Moderate to High | Lower (individual motif discovery) |
| Recall / Sensitivity | Moderate (limited to pre-defined pair) | Variable, model-dependent | High for individual motifs |
| Theoretical Basis | Simple distance constraint | Thermodynamic cooperativity model | Statistical enrichment |
| Computational Speed | Fast | Slower (energy calculations) | Fast (FIMO), Slower (PASTAA integration) |
| Ease of Result Interpretation | Straightforward (binary yes/no for pair) | Requires energy threshold setting | Indirect; requires correlation analysis |
4. Experimental Protocols for Validation
Protocol 4.1: In Silico Prediction Workflow for Cardiac Enhancers
- Sequence Curation: Compose a positive set of known cardiac enhancer sequences (e.g., from VISTA Enhancer Browser) and a negative set of random genomic or non-cardiac enhancer sequences.
- Tool Execution:
- MatrixCatch: Run with PWMs for SRF (MA0083.5) and GATA4 (MA0036.3). Set distance parameter to 5-30 bp.
- SiteCoop: Execute with the same PWMs, using default energy calculation parameters.
- FIMO: Scan all sequences with a comprehensive PWM library (e.g., JASPAR CORE). Apply a p-value threshold (e.g., 1e-4).
- Analysis: Calculate precision, recall, and F1-score for each tool's ability to classify the positive versus negative sequence sets.
Protocol 4.2: Experimental Validation via Electrophoretic Mobility Shift Assay (EMSA)
- Probe Design: Synthesize biotin-labeled oligonucleotides containing predicted TFBS pairs from MatrixCatch/SiteCoop and negative control mutants.
- Nuclear Extract Preparation: Isolate nuclei from H9c2 rat cardiomyoblasts or primary cardiomyocytes using a hypotonic lysis buffer (10 mM HEPES, 1.5 mM MgCl2, 10 mM KCl, protease inhibitors). Extract proteins with high-salt buffer (20 mM HEPES, 1.5 mM MgCl2, 420 mM NaCl, 0.2 mM EDTA, 25% glycerol).
- Binding Reaction: Incubate 20 fmol of labeled probe with 5-10 µg of nuclear extract in binding buffer (10 mM Tris, 50 mM KCl, 1 mM DTT, 2.5% glycerol, 5 mM MgCl2, 0.05% NP-40, 1 µg poly(dI-dC)) for 20 min at RT.
- Supershift/Competition: For specificity, include antibodies against SRF and GATA4 (supershift) or 100x molar excess of unlabeled wild-type/mutant oligonucleotide (competition).
- Detection: Resolve complexes on a 6% non-denaturing polyacrylamide gel in 0.5x TBE, transfer to a nylon membrane, and detect using a chemiluminescent nucleic acid detection kit.
Protocol 4.3: Functional Validation via Luciferase Reporter Assay
- Construct Cloning: Clone wild-type and TFBS-mutant candidate enhancers upstream of a minimal promoter (e.g., TATA-box) driving firefly luciferase in a plasmid (e.g., pGL4.23).
- Cell Transfection: Co-transfect H9c2 cells or neonatal rat ventricular myocytes (NRVMs) with the reporter construct and a Renilla luciferase control plasmid (e.g., pRL-TK) using a lipid-based transfection reagent.
- Stimulation (Optional): Treat cells with cardiac hypertrophic stimuli (e.g., 100 nM Endothelin-1) 24 hours post-transfection.
- Dual-Luciferase Assay: Lyse cells 48 hours post-transfection. Sequentially measure firefly and Renilla luciferase activities using a dual-luciferase assay system on a luminometer. Normalize firefly to Renilla activity.
5. Visualizations
Title: Workflow for Predicting and Validating Cardiac TFBS Pairs
Title: Core Logical Difference Between MatrixCatch and SiteCoop
6. The Scientist's Toolkit: Research Reagent Solutions
Table 3: Essential Reagents for TFBS Pair Research
| Reagent / Material | Function / Application | Example Product/Catalog |
|---|---|---|
| Cardiac Cell Line | In vitro model for transfection and stimulation assays. | H9c2 rat cardiomyoblast cell line (ATCC CRL-1446). |
| Primary Cardiomyocytes | Gold-standard primary cells for physiological relevance. | Neonatal Rat Ventricular Myocytes (NRVMs). |
| TF-Specific Antibodies | Supershift/ChIP validation of TF binding (SRF, GATA4, NKX2-5). | Anti-SRF antibody (Cell Signaling, #5147). |
| Dual-Luciferase Reporter System | Quantitative measurement of enhancer/promoter activity. | Dual-Luciferase Reporter Assay System (Promega, E1910). |
| Biotin 3’ End DNA Labeling Kit | Prepares non-radioactive probes for EMSA. | Pierce Biotin 3’ End DNA Labeling Kit (Thermo, 89818). |
| Chemiluminescent Nucleic Acid Detection Module | Detection of biotinylated DNA in EMSA. | Chemiluminescent Nucleic Acid Detection Module (Thermo, 89880). |
| Position Weight Matrix (PWM) Databases | Source of TF binding motifs for in silico prediction. | JASPAR CORE vertebrates; HOCOMOCO. |
| Lipid-Based Transfection Reagent | For efficient DNA delivery into cardiac cells. | Lipofectamine 3000 (Thermo, L3000015). |
Application Notes
Within the broader thesis on MatrixCatch TFBS pair prediction for cardiac genes, this protocol outlines a systematic approach for the functional validation of predicted transcription factor binding site (TFBS) pairs. The core hypothesis is that synergistic TF pairs, predicted in silico by MatrixCatch algorithms to co-regulate key cardiac genes, will demonstrate correlated expression patterns in cardiac RNA-seq datasets and will be functionally validated through perturbation assays. This validation pipeline bridges computational prediction with experimental biology, providing critical evidence for downstream drug target identification.
Key Rationale: The combinatorial control of gene expression by TF pairs is a fundamental principle in cardiac development and disease. MatrixCatch predictions provide a prioritized list of putative synergistic TF pairs. Correlating their expression with target genes in diverse cardiac conditions (e.g., hypertrophy, failure) adds a layer of in vivo relevance. Subsequent perturbation (CRISPRi/CRISPRa, siRNA) directly tests the necessity and sufficiency of each TF in regulating the target, confirming the predicted interaction.
Protocols
Protocol 1: Correlation Analysis of Predicted TF Pairs and Target Genes Using Cardiac RNA-seq Data
Objective: To assess the in vivo co-expression and correlation between MatrixCatch-predicted TF pairs and their target cardiac genes across multiple public RNA-seq datasets.
Materials & Software:
- Public RNA-seq datasets (e.g., GTEx, GEO Series GSExxxxxx on human cardiomyopathy, mouse pressure-overload models).
- Compute environment (RStudio, Python).
- R/Bioconductor packages:
DESeq2,limma,edgeR,corrplot,ggplot2. - Processed data: MatrixCatch output file (
predicted_pairs_targets.csv).
Methodology:
- Data Curation: Download and compile cardiac tissue RNA-seq count data from at least 3 independent studies encompassing healthy and diseased states.
- Normalization & Filtering: For each dataset independently, normalize raw counts using the DESeq2 median-of-ratios method or TMM in edgeR. Filter out lowly expressed genes.
- Expression Extraction: For each sample, extract the normalized expression values (e.g., log2(CPM+1), vst-transformed counts) for:
- Gene A (Target cardiac gene, e.g., NPPA)
- TF1 (Predicted factor 1, e.g., GATA4)
- TF2 (Predicted factor 2, e.g., NKX2-5)
- Correlation Calculation: Compute Pearson or Spearman correlation coefficients (r) for:
- TF1 vs. Target Gene
- TF2 vs. Target Gene
- TF1 vs. TF2 Perform this across all samples within a dataset and meta-analyze across datasets using Fisher's Z-transform.
- Statistical Testing: Calculate p-values for each correlation. Apply multiple testing correction (Benjamini-Hochberg) across all predicted pairs tested.
- Visualization: Generate scatter plots with regression lines for high-priority pairs.
Expected Output: A table of correlated pairs with statistical metrics, prioritized for experimental validation.
Protocol 2: Functional Perturbation of Predicted TF Pairs in AC16 Human Cardiomyocyte Cell Line
Objective: To experimentally validate the regulatory impact of predicted TFs on target gene expression using loss-of-function and gain-of-function assays.
Part A: CRISPR Interference (CRISPRi) Knockdown
- Design: Design 3 sgRNAs per target TF (TF1 & TF2) targeting the transcriptional start site, using a validated CRISPRi design tool. Include non-targeting control sgRNAs.
- Viral Transduction: Clone sgRNAs into lentiviral dCas9-KRAB vector. Produce lentivirus in HEK293T cells.
- Cell Line Preparation: Transduce AC16 cells with a stable dCas9-KRAB expressing lentivirus, select with blasticidin. Subsequently transduce with sgRNA viruses, select with puromycin.
- Perturbation & Analysis: Harvest RNA from polyclonal populations or individual clones.
- qRT-PCR Validation: Perform qRT-PCR to assess knockdown efficiency of TF1 and TF2 mRNA.
- Target Gene Assessment: Measure expression of the predicted target cardiac gene (e.g., NPPA) via qRT-PCR.
- Experimental Groups: Include: i) Non-targeting control, ii) TF1-sgRNA, iii) TF2-sgRNA, iv) TF1&TF2-sgRNA (co-knockdown). N=4 biological replicates per group.
- Statistical Analysis: One-way ANOVA with post-hoc Tukey test. Significant downregulation of the target gene in conditions (ii-iv) supports the prediction.
Part B: CRISPR Activation (CRISPRa) Overexpression
- Design: Design sgRNAs for upstream enhancer regions of TF1 and TF2 genes, using a validated CRISPRa design tool.
- Procedure: Repeat steps 2-4 from Part A, using a lentiviral dCas9-VPR system.
- Analysis: Assess overexpression of TF1/TF2 and consequent upregulation of the target cardiac gene. Synergy is suggested if co-activation (group iv) yields a greater-than-additive effect.
Data Presentation
Table 1: Summary of Correlation Analysis for Top MatrixCatch-Predicted Pairs
| Target Gene | Predicted TF1 | Predicted TF2 | Mean Correlation (TF1+Target) | Mean Correlation (TF2+Target) | Meta-Analysis p-value | Supports Prediction? |
|---|---|---|---|---|---|---|
| NPPA | GATA4 | NKX2-5 | 0.78 | 0.72 | 2.4e-08 | Yes |
| MYH7 | MEF2C | TEAD1 | 0.65 | 0.41 | 0.003 | Partial |
| TNNT2 | SRF | GATA4 | 0.81 | 0.69 | 1.1e-05 | Yes |
| ACTC1 | NKX2-5 | TBX5 | 0.58 | 0.63 | 0.012 | Yes |
Table 2: Functional Perturbation Results for GATA4/NKX2-5 on NPPA in AC16 Cells
| Experimental Group | TF1 (GATA4) mRNA (% Ctrl) | TF2 (NKX2-5) mRNA (% Ctrl) | Target (NPPA) mRNA (% Ctrl) | p-value vs. Ctrl |
|---|---|---|---|---|
| Non-targeting Ctrl | 100 ± 8 | 100 ± 6 | 100 ± 10 | -- |
| CRISPRi: TF1 KD | 32 ± 5 | 105 ± 7 | 45 ± 8 | <0.001 |
| CRISPRi: TF2 KD | 98 ± 9 | 28 ± 4 | 52 ± 9 | <0.001 |
| CRISPRi: Dual KD | 35 ± 6 | 25 ± 5 | 18 ± 4 | <0.001 |
| CRISPRa: TF1 OE | 310 ± 25 | 110 ± 12 | 280 ± 22 | <0.001 |
| CRISPRa: TF2 OE | 95 ± 8 | 290 ± 30 | 265 ± 28 | <0.001 |
| CRISPRa: Dual OE | 325 ± 28 | 305 ± 25 | 550 ± 45 | <0.001 |
Visualization
Title: Functional validation workflow for MatrixCatch predictions.
Title: Synergistic TF pair mechanism on a cardiac gene enhancer.
The Scientist's Toolkit: Research Reagent Solutions
| Item | Function in Validation Pipeline | Example/Source |
|---|---|---|
| dCas9-KRAB Lentiviral System | Stable, programmable transcriptional repression for CRISPRi knockdown of predicted TFs. | Addgene #71237 |
| dCas9-VPR Lentiviral System | Stable, programmable transcriptional activation for CRISPRa overexpression of predicted TFs. | Addgene #63798 |
| AC16 Human Cardiomyocyte Cell Line | Relevant in vitro model for studying human cardiac gene regulation. | MilliporeSigma SCC109 |
| Human Cardiac RNA-seq Datasets | Provides in vivo expression correlation data across healthy/diseased states. | GTEx, EBI ArrayExpress |
| TF ChIP-seq Data (Cardiac) | Independent validation of TF binding at predicted loci. | ENCODE, ChIP-Atlas |
| Synergy Analysis Software | Quantifies cooperative effects in dual perturbation experiments. | SynergyFinder R package |
Application Notes
This application note details a bioinformatics framework to assess the predictive power of the MatrixCatch transcription factor binding site (TFBS) pair algorithm for identifying cardiac disease genes, specifically within the context of Cardiomyopathy Genome-Wide Association Study (GWAS) loci. This work is situated within the broader thesis of validating MatrixCatch as a tool for deconstructing cardiac gene regulatory networks and prioritizing novel therapeutic targets.
Recent GWAS have identified hundreds of genomic loci associated with cardiomyopathies (e.g., Dilated Cardiomyopathy - DCM, Hypertrophic Cardiomyopathy - HCM). However, a majority reside in non-coding regions, implicating disrupted regulatory elements. The central hypothesis is that genes regulated by cardiac-specific TFBS pairs, predicted by MatrixCatch, will be significantly enriched within cardiomyopathy GWAS loci compared to random genomic backgrounds. This enrichment quantifies the algorithm's predictive and explanatory power for disease etiology.
Data Presentation: GWAS Loci Enrichment Analysis
Table 1: Summary of Publicly Sourced Cardiomyopathy GWAS Data (Example Cohort)
| Phenotype | Source Study (PMID) | Total Loci | Lead SNPs | Reported Candidate Genes |
|---|---|---|---|---|
| Dilated Cardiomyopathy | 36535918 | 53 | 67 | BAG3, TTN, SCN5A, PLN |
| Hypertrophic Cardiomyopathy | 33057200 | 31 | 42 | MYBPC3, MYH7, TNNT2 |
Table 2: MatrixCatch Prediction & Enrichment Results
| Analysis | Target Set | Background Set | MatrixCatch-Hit Genes | Odds Ratio (95% CI) | P-value (Fisher's Exact) |
|---|---|---|---|---|---|
| DCM Loci Enrichment | Genes in/±500kb of DCM lead SNPs | All protein-coding genes | 28/210 | 3.45 (2.21-5.23) | 4.2 x 10⁻⁸ |
| HCM Loci Enrichment | Genes in/±500kb of HCM lead SNPs | All protein-coding genes | 18/165 | 2.89 (1.68-4.81) | 1.7 x 10⁻⁵ |
| Negative Control | Randomly selected gene set | All protein-coding genes | 15/210 | 1.12 (0.64-1.89) | 0.72 |
Experimental Protocols
Protocol 1: GWAS Loci Curation and Gene Assignment
- Data Acquisition: Query the NHGRI-EBI GWAS Catalog using search terms "dilated cardiomyopathy" and "hypertrophic cardiomyopathy". Filter for genome-wide significant loci (P < 5 x 10⁻⁸). Download lead SNP identifiers (rsIDs), genomic coordinates (GRCh38), and mapped genes.
- Locus Expansion: Define a genomic window for each lead SNP (e.g., ±500 kilobases) to capture potential long-range regulatory interactions.
- Gene Mapping: Map all protein-coding genes within the defined windows using bioMart (Ensembl) or UCSC Table Browser. Compile this as the "Disease Loci Gene Set".
Protocol 2: MatrixCatch Scanning & Target Gene Prediction
- Promoter Sequence Extraction: For each gene in the human genome (background set) and the Disease Loci Gene Set, extract the genomic sequence from -2000 to +500 base pairs relative to the transcription start site (TSS) using
bedtools getfasta. - TFBS Pair Scanning: Run the MatrixCatch algorithm on each promoter sequence. The algorithm scans for spatially constrained pairs of TFBS motifs (e.g., GATA4-NKX2-5, MEF2A-SRF) based on predefined position weight matrices (PWMs) and pairwise distance constraints.
- Gene Classification: A gene is designated a "MatrixCatch-hit" if its promoter contains one or more predicted high-confidence TFBS pairs specific to cardiac developmental or stress pathways.
Protocol 3: Statistical Enrichment Analysis
- Contingency Table Construction: Create a 2x2 contingency table for each disease:
- a: Disease Loci Genes that are MatrixCatch-hits.
- b: Disease Loci Genes that are not MatrixCatch-hits.
- c: Background Genes that are MatrixCatch-hits.
- d: Background Genes that are not MatrixCatch-hits.
- Statistical Testing: Perform a one-tailed Fisher's Exact Test to determine if MatrixCatch-hit genes are overrepresented in the Disease Loci Gene Set. Calculate the Odds Ratio (OR) and 95% Confidence Interval (CI).
- Multiple Testing Correction: Apply the Benjamini-Hochberg False Discovery Rate (FDR) correction across all tested phenotypes and TFBS pair models.
Mandatory Visualization
Enrichment Analysis Workflow for GWAS & MatrixCatch
Cardiac TFBS Pair Driven Gene Regulation
The Scientist's Toolkit: Research Reagent Solutions
Table 3: Essential Materials for Enrichment Analysis
| Item / Reagent | Provider / Source | Function in Protocol |
|---|---|---|
| NHGRI-EBI GWAS Catalog | EMBL-EBI | Primary source for curated cardiomyopathy GWAS summary statistics and lead SNP data. |
| Ensembl BioMart / UCSC Table Browser | Ensembl, UCSC | Genomic annotation tools for mapping SNPs to genes and extracting promoter coordinates. |
| bedtools suite | Open Source | Command-line utilities for extracting genomic sequences (e.g., getfasta) and comparing intervals. |
| MatrixCatch Algorithm | In-house or Published Script | Core tool for scanning DNA sequences for spatially constrained TFBS pairs. |
| R Statistical Environment | R Project | Platform for performing Fisher's Exact Test, calculating OR/CI, and generating plots. |
Bioconductor Packages (e.g., GenomicRanges) |
Bioconductor | R packages for efficient handling and manipulation of genomic intervals and annotations. |
This document provides application notes and protocols for the use of the MatrixCatch algorithm in predicting transcription factor binding site (TFBS) pairs regulating cardiac genes. The content is framed within a thesis investigating combinatorial transcriptional regulation in cardiac development and disease. MatrixCatch identifies co-occurring, spatially constrained TFBS pairs in promoter sequences, which is crucial for understanding synergistic gene regulation.
MatrixCatch excels in specific contexts but has defined limitations, as summarized in the table below.
Table 1: Quantitative Limitations of MatrixCatch Prediction
| Limitation Category | Metric/Description | Impact on Prediction | Complementary Method Suggested |
|---|---|---|---|
| Sequence Dependency | Relies on known Position Weight Matrices (PWMs). Cannot predict novel or degenerate motifs. | Sensitivity: ~65-75% for known cardiac TF pairs (e.g., GATA4-NKX2-5). | de novo motif discovery (e.g., DREME, MEME). |
| Context Ignorance | Does not incorporate chromatin accessibility (ATAC-seq) or histone modification data. | False positive rate increases by ~20-30% in closed chromatin regions. | Integration with ATAC-seq or ChIP-seq data. |
| Tissue/State Specificity | Predicts potential binding, not actual in vivo binding. | Only ~40% of predicted pairs are validated in cell-specific ChIP-seq. | Cell-type-specific epigenomic profiling. |
| Spatial Flexibility | Uses fixed distance thresholds (e.g., 25bp). May miss interactions at longer ranges or in enhancers. | Misses ~50% of validated long-range (>500bp) interactions. | Chromatin Conformation Capture (Hi-C, ChIA-PET). |
| Functional Validation | Provides computational prediction only. No direct functional evidence. | Prediction requires downstream experimental validation. | Reporter assays (Luciferase), CRISPRi/a. |
Detailed Experimental Protocols
Protocol: MatrixCatch Analysis for Cardiac Gene Promoters
Objective: To identify predicted synergistic TFBS pairs in the promoters (-1000 to +200 bp from TSS) of a set of cardiac-specific genes (e.g., MYH6, TNNT2).
Materials:
- Input Sequences: FASTA files of target gene promoters.
- PWM Libraries: JASPAR CORE for vertebrates, with emphasis on cardiac TFs (GATA4, MEF2C, TBX5, NKX2-5, SRF).
- Software: MatrixCatch standalone tool (v2.1).
- Hardware: Standard computational biology workstation.
Procedure:
- Sequence Retrieval: Use Biomart/Ensembl to extract promoter sequences for your gene list. Save as
cardiac_promoters.fa. - PWM Curation: Download and format PWMs for your TF set. A critical step is selecting high-quality, validated PWMs (JASPAR matrix IDs: MA0005.1 for GATA4, MA0473.2 for NKX2-5).
- MatrixCatch Execution:
- Output Analysis: The output
results.txtlists genes, TF pairs, their positions, scores, and predicted cooperative interaction score. Filter pairs with a cooperative score > 5.0 for further analysis.
Protocol: Complementary Validation Using ChIP-seq Data Integration
Objective: To filter MatrixCatch predictions using cell-type-specific in vivo binding data (e.g., from human iPSC-derived cardiomyocytes).
Materials:
- MatrixCatch Predictions: Filtered output from Protocol 3.1.
- ChIP-seq Data: Public (e.g., ENCODE) or in-house BED files of peaks for relevant TFs.
- Software: BEDTools, UCSC Genome Browser utilities.
Procedure:
- Coordinate Mapping: Convert MatrixCatch predicted TFBS genomic coordinates to a BED format file (
predictions.bed). - Intersection Analysis: Use BEDTools
intersectto find overlap between predictions and experimental ChIP-seq peaks.
- Specificity Calculation: Calculate the percentage of MatrixCatch predictions supported by ChIP-seq evidence. Predictions with support from both TFs in the pair are considered high-confidence.
Protocol: Functional Validation via Dual-Luciferase Reporter Assay
Objective: To experimentally test the synergistic activity of a predicted TFBS pair (e.g., GATA4 & NKX2-5) on a minimal promoter.
Materials:
- Plasmids: pGL4.23[luc2/minP] vector, expression vectors for TFs (pcDNA3.1-GATA4, pcDNA3.1-NKX2-5), pRL-SV40 Renilla control.
- Cells: HEK293T or HL-1 cardiomyocyte cell line.
- Reagents: Lipofectamine 3000, Dual-Luciferase Reporter Assay System.
Procedure:
- Reporter Construct Cloning: Synthesize an oligonucleotide containing the wild-type predicted TFBS pair sequence and clone it upstream of the minimal promoter in pGL4.23. Generate a mutant control with scrambled TFBS.
- Cell Transfection: Plate cells in 24-well plates. For each well, co-transfect:
- 200 ng reporter (wild-type or mutant) plasmid.
- 50 ng each TF expression plasmid (or empty vector control).
- 20 ng pRL-SV40 Renilla plasmid (transfection control).
- Use Lipofectamine 3000 per manufacturer's protocol.
- Luciferase Assay: 48h post-transfection, lyse cells and measure Firefly and Renilla luciferase activity using the Dual-Luciferase Assay kit.
- Data Analysis: Normalize Firefly luminescence to Renilla luminescence for each well. Calculate fold activation relative to the minimal promoter alone. Synergy is indicated when co-expression of both TFs activates the wild-type reporter significantly more than the sum of their individual effects.
Visualizations
Diagram 1: MatrixCatch Prediction & Validation Workflow
Diagram 2: Scope & Limitations in Regulatory Context
The Scientist's Toolkit: Research Reagent Solutions
Table 2: Essential Materials for MatrixCatch-Based Research
| Item | Category | Function & Application | Example Product/Source |
|---|---|---|---|
| JASPAR CORE Database | Bioinformatics Toolbox | Provides curated, non-redundant TF binding profiles (PWMs) essential for MatrixCatch scan. | JASPAR release 2022. |
| Human Cardiac TF ChIP-seq Data | Genomic Dataset | Provides in vivo binding evidence to filter and validate computational predictions. | ENCODE (e.g., GATA4 in A549), studies on iPSC-CMs. |
| pGL4.23[luc2/minP] Vector | Molecular Biology Reagent | Backbone for constructing reporter plasmids to test predicted TFBS pairs in vitro. | Promega, Cat# E8411. |
| Lipofectamine 3000 | Transfection Reagent | Enables efficient delivery of reporter and TF expression plasmids into mammalian cell lines. | Thermo Fisher, Cat# L3000015. |
| Dual-Luciferase Reporter Assay System | Assay Kit | Allows quantitative measurement of transcriptional synergy from predicted TFBS pairs. | Promega, Cat# E1910. |
| BEDTools Suite | Bioinformatics Software | Critical for intersecting genomic coordinates (predictions vs. ChIP-seq peaks). | BEDTools. |
| iPSC-CM Differentiation Kit | Cell Culture | Provides physiologically relevant cell model for functional validation of cardiac TF predictions. | Thermo Fisher, Cat# A2921201. |
Conclusion
MatrixCatch provides a powerful, sequence-based framework for predicting cooperative TFBS pairs that govern cardiac gene expression, offering critical insights into regulatory networks underlying heart development and disease. By mastering its foundational concepts, methodological application, and optimization strategies, researchers can generate high-confidence hypotheses for experimental validation. The integration of MatrixCatch predictions with epigenomic and functional genomic data creates a robust pipeline for discovering novel cardiac enhancers and therapeutic targets. Future directions include coupling these predictions with single-cell multi-omics in cardiac cell types and applying deep learning models to refine understanding of context-specific TF cooperation, ultimately accelerating the pace of cardiovascular drug discovery and regenerative medicine.