RNAscope Technology: Principles, Applications, and Troubleshooting for Spatial Genomics
This article provides a comprehensive overview of the RNAscope in situ hybridization technology, a revolutionary spatial genomics platform.
RNAscope Technology: Principles, Applications, and Troubleshooting for Spatial Genomics
Abstract
This article provides a comprehensive overview of the RNAscope in situ hybridization technology, a revolutionary spatial genomics platform. Tailored for researchers, scientists, and drug development professionals, it details the core principle of the proprietary 'double Z' probe design that enables single-molecule RNA visualization with exceptional signal-to-noise ratio. The scope covers the foundational mechanism, step-by-step methodological workflow, practical troubleshooting and optimization strategies, and a comparative validation against other spatial transcriptomics methods. The content synthesizes current information to serve as a essential guide for effectively implementing and leveraging RNAscope in preclinical and clinical research.
The Core Principle of RNAscope: Unlocking Single-Molecule RNA Visualization
Spatial genomics represents a transformative approach in molecular biology, enabling the examination of biomarker status within the precise histopathological context of clinical specimens. While DNA in situ hybridization (ISH) and immunohistochemistry (IHC) are well-established for DNA and protein biomarker analysis, traditional RNA ISH techniques have faced significant challenges in clinical adoption due to technical complexity, insufficient sensitivity, and specificity issues [1]. This whitepaper introduces the RNAscope platform as a novel RNA ISH technology that overcomes these limitations through unique probe design, allowing simultaneous signal amplification and background suppression to achieve single-molecule visualization while preserving tissue morphology [2] [1]. The technology's compatibility with routine formalin-fixed, paraffin-embedded (FFPE) tissue specimens and its ability to provide both bright-field and fluorescent multiplex analysis positions it as a pivotal tool for advancing spatial genomics research and enabling the translation of RNA biomarkers into clinical diagnostics.
The Spatial Genomics Landscape
The Limitations of Traditional RNA Analysis Methods
Conventional grind-and-bind RNA analysis methods, particularly real-time RT-PCR, present significant limitations for spatial context preservation. The RNA extraction process fundamentally destroys tissue architecture, making it impossible to map gene expression signals to individual cells [1]. These assays are consequently prone to interference from unintended cell types and unwanted tissue elements, potentially obscuring critical biological insights. While microdissection techniques offer partial solutions, they often prove too cumbersome for routine application [1].
The disparity between RNA analysis and other biomarker assessment methods is particularly notable considering the abundance of RNA biomarkers discovered through whole-genome expression profiling [1]. The inability to examine these biomarkers within their native tissue context has significantly hampered their clinical translation and biological interpretation.
The Critical Need for Spatial Context in Genomic Analysis
Spatial context preservation is paramount for accurate biomarker interpretation, especially in complex tissues like tumors where heterogeneity dramatically influences disease progression and treatment response. RNAscope technology addresses this fundamental need by providing single-cell resolution within intact tissue architecture, enabling researchers to characterize tissue distribution of drug targets and biomarkers with unprecedented specificity and sensitivity [3] [4]. This spatial preservation allows for the identification of distinct expression patterns, including homogeneous expression within cell populations, heterogeneous expression indicating clonal diversity, subpopulation-specific expression, and rare cell detection [3].
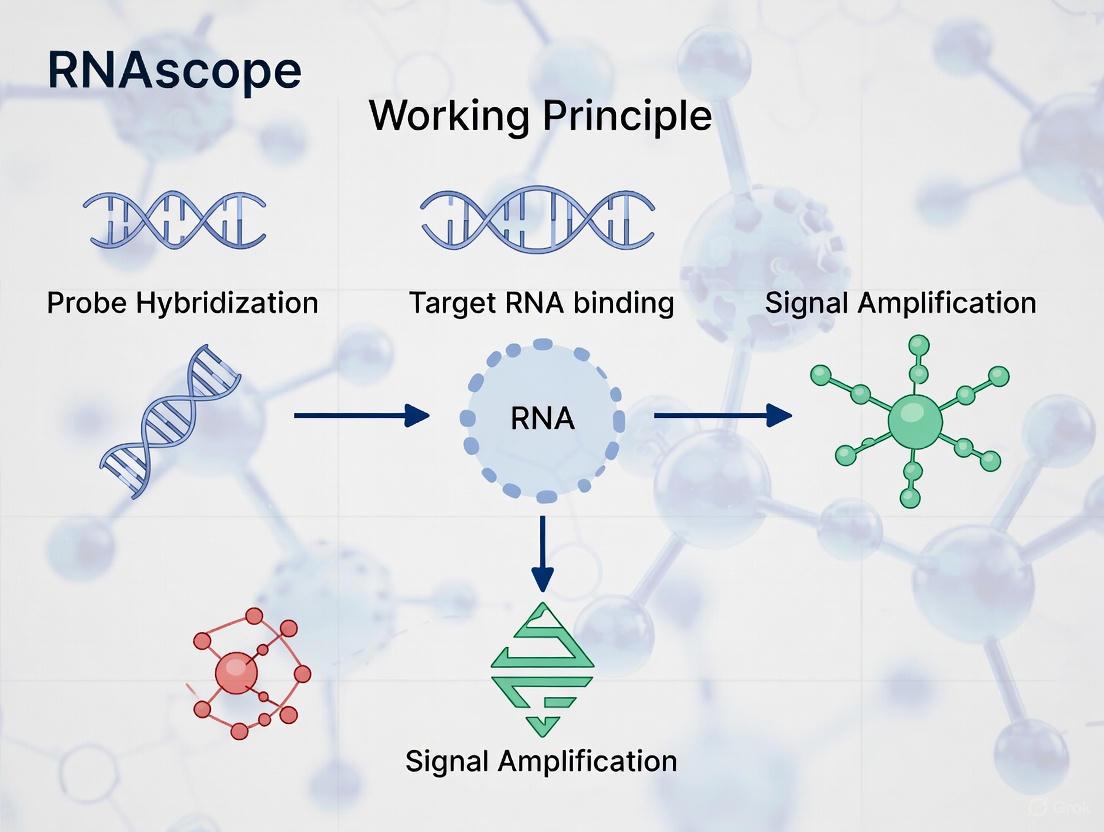
RNAscope Technology: Core Principles and Mechanism
Proprietary Double Z Probe Design
The foundational innovation of RNAscope technology lies in its unique double Z probe design strategy, which substantially improves the signal-to-noise ratio of RNA ISH [2]. This design employs approximately 20 target-specific double Z probe pairs that must hybridize in tandem to the target RNA molecule for signal amplification to occur [2]. Each target Z probe contains three critical elements:
- Lower Region: An 18- to 25-base region complementary to the target RNA, selected for specific hybridization and uniform properties
- Spacer Sequence: A connector linking the two components of the probe
- Upper Region: A 14-base tail sequence that forms part of the amplification binding site [2]
This design ensures exceptional specificity because it is statistically improbable that two independent probes will hybridize adjacently to a non-specific target, thus preventing amplification of off-target signals [2].
Signal Amplification and Background Suppression
RNAscope achieves single-molecule detection sensitivity through a cascade of hybridization events that amplify specific signals while suppressing background noise:
- Double Z Target Probe Hybridization: Probe pairs hybridize to the RNA target within a ~1kb region [2]
- Preamplifier Binding: Preamplifiers hybridize to the 28-base binding site formed by each double Z probe pair [2]
- Amplifier Assembly: Multiple amplifiers bind to each preamplifier [2]
- Label Probe Attachment: Numerous labeled probes containing fluorescent molecules or chromogenic enzymes bind to each amplifier [2]
This multi-stage amplification theoretically yields up to 8000 labels for each target RNA molecule when 20 probe pairs are employed [1]. The requirement for contiguous binding of two independent probes ensures that non-specific hybridization events do not generate false-positive signals, resulting in exceptional signal-to-noise ratios [2] [1].
Technology Workflow and Implementation
The RNAscope procedure can be completed within a single day and is compatible with both manual and fully automated staining systems, including platforms from Roche Tissue Diagnostics and Leica Biosystems [5] [4]. The standardized workflow consists of four critical stages:
Table 1: RNAscope Automated Assay Workflow Steps on Leica and Roche Platforms
| Step | Stage | Leica Automated System | Roche Automated System |
|---|---|---|---|
| 1 | Pretreatment | Deparaffinization, Epitope Retrieval, Protease, H₂O₂ Block | Deparaffinization, Epitope Retrieval, Protease, H₂O₂ Block |
| 2 | Hybridize | Target Probe Hybridization | Target Probe Hybridization |
| 3 | Amplify | AMP1-AMP6 | AMP1-AMP7 |
| 4 | Stain & Detect | DAB Reaction, Hematoxylin, Imaging | DAB Reaction, Hematoxylin, Imaging |
Molecular Visualization Mechanism
The RNAscope detection system generates punctate dot signals, with each dot representing a single RNA transcript molecule [6]. This direct visual correlation enables precise quantification at the single-cell level, either through manual counting or automated image analysis using software such as HALO or open-source alternatives like ImageJ, CellProfiler, and QuPath [3] [6] [7]. The technology's robustness is further enhanced by its compatibility with partially degraded samples, as the relatively short target regions (40-50 bases) allow successful hybridization even when RNA integrity is compromised [2].
Experimental Protocols and Methodologies
Sample Preparation Guidelines
Proper sample preparation is critical for successful RNAscope analysis. The technology supports multiple sample types, each requiring specific preparation protocols:
- FFPE Tissues: Sections should be cut at 5μm thickness, mounted on SuperFrost Plus slides, baked, and deparaffinized following standard histopathological procedures [4]
- Cultured Cells: Require fixation in 4% formaldehyde for 60 minutes, followed by protease digestion (2.5 μg/mL) at 23-25°C [1]
- Fresh-Frozen Tissues: Need appropriate cryopreservation and sectioning techniques with optimized fixation protocols [8]
For FFPE tissues, specific pretreatment conditions must be optimized based on tissue type and fixation method. Standard pretreatment includes incubation in citrate buffer (10 nmol/L, pH 6) at boiling temperature (100-103°C) for 15 minutes, followed by protease treatment (10 μg/mL) at 40°C for 30 minutes [1].
Control Probes and Quality Assessment
Robust experimental design requires appropriate control probes to ensure accurate data interpretation. RNAscope protocols mandate three levels of quality control:
Table 2: Essential Control Probes for RNAscope Experiments
| Control Type | Target | Purpose | Interpretation Guidelines |
|---|---|---|---|
| Positive Control | Housekeeping genes (PPIB, UBC, POLR2A) | Verify RNA quality and assay procedure | Adequate signal: PPIB/POLR2A score ≥2 or UBC score ≥3 [8] |
| Negative Control | Bacterial dapB gene | Assess non-specific background | Optimal result: Score <1, indicates appropriate sample preparation [8] |
| Technical Control | Species-specific targets | Confirm workflow integrity | Validates entire assay procedure from sample prep to detection |
Positive control probes should be selected based on the expression level of the target gene, with PPIB (cyclophilin B) serving as a frequently used reference [8]. The bacterial dapB gene provides a universal negative control suitable for all sample types [4].
Pretreatment Optimization Across Tissue Types
Extensive studies across 24 tissue types from rat, dog, and cynomolgus monkey models have demonstrated that optimal pretreatment conditions vary significantly by tissue type [4]. Key findings include:
- Standard Protocol: Epitope retrieval using appropriate buffers (e.g., Leica Epitope Retrieval Buffer 2) at 95°C or 88°C for 15 minutes, followed by protease treatment for 15 minutes at 40°C [4]
- Tissue-Specific Adjustments: Certain tissues require modified protease concentrations, incubation times, or epitope retrieval conditions to balance optimal signal with tissue morphology preservation
- Automated System Consistency: Both Leica and Roche platforms deliver reproducible results when standardized protocols are followed [4]
Data Analysis and Interpretation Frameworks
Quantitative Scoring Methodologies
RNAscope data analysis employs multiple approaches depending on experimental goals and available resources:
Table 3: RNAscope Data Analysis Methods and Applications
| Method Type | Approach | Tools | Best For |
|---|---|---|---|
| Semi-quantitative Histological Scoring | Manual dot counting per cell | Microscope visualization | Rapid assessment, quality control |
| Image-based Quantitative Analysis | Automated dot and cell counting | HALO, Aperio, CellProfiler [3] [7] | High-throughput studies, large datasets |
| H-scoring | Bin cells by expression levels | Calculation: Σ(ACD score × % cells per bin) | Heterogeneous expression patterns [3] |
The semi-quantitative scoring system categorizes results into five distinct grades:
- 0: No staining or <1 dot per 10 cells (40X magnification)
- 1+: 1-3 dots/cell (visible at 20-40X magnification)
- 2+: 4-10 dots/cell, very few dot clusters (visible at 20-40X magnification)
- 3+: >10 dots/cell, <10% positive cells have dot clusters (visible at 20X magnification)
- 4+: >10 dots/cell, >10% positive cells have dot clusters (visible at 20X magnification) [4]
Analysis of Complex Expression Patterns
RNAscope technology enables sophisticated analysis of diverse gene expression scenarios frequently encountered in research and clinical contexts:
- Homogeneous Target Expression: Characterized by uniform staining within a cell population, analyzed by measuring average dots per cell across the entire population [3]
- Heterogeneous Target Expression: Displays varying staining levels among the same cell type, requiring both expression level assessment and percentage of positive cell calculation [3]
- Subpopulation-Specific Expression: Restricted to specific cell subtypes or regions, necessitating focused analysis of relevant populations [3]
- Target Co-expression: Simultaneous detection of two genes in the same cells, enabling identification of cell types expressing specific targets or pathway components [3]
- Rare Cell Detection: Identification of infrequent cells expressing targets, where counting positive cells becomes more relevant than average expression levels [3]
Multiplex Assay Applications
The multiplexing capabilities of RNAscope represent a significant advancement for spatial genomics, allowing simultaneous detection of multiple RNA targets within the same tissue section. Both chromogenic and fluorescent assays support multiplexing, with fluorescent versions enabling detection of up to four targets using spectrally distinct fluorophores [3] [1]. This capability facilitates sophisticated experimental approaches including:
- Cell Typing and Phenotyping: Simultaneous identification of cell markers and target gene expression
- Pathway Analysis: Co-detection of ligands, receptors, and downstream effectors
- Host-Pathogen Interactions: Simultaneous visualization of pathogen RNA and host response factors
- Tumor Microenvironment Characterization: Parallel assessment of tumor cells, immune infiltrates, and stromal components
Essential Research Reagent Solutions
Table 4: Critical Research Reagents for RNAscope Experiments
| Reagent Category | Specific Products | Function | Application Notes |
|---|---|---|---|
| Pretreatment Reagents | RNAscope Target Retrieval, Hydrogen Peroxide, Protease Plus/III/IV | Unmask target RNA, block peroxidase, permeabilize cells | Optimization required for different tissue types [8] |
| Control Probes | PPIB, UBC, POLR2A (positive); dapB (negative) | Assay validation and sample qualification | Species-specific probes available [8] [4] |
| Detection Systems | Chromogenic (DAB, Fast Red), Fluorescent (Alexa Fluor dyes) | Signal generation and visualization | Fluorophore choice depends on microscope capabilities [6] [1] |
| Analysis Software | HALO, Aperio, CellProfiler, QuPath, ImageJ | Image analysis and quantification | Open-source options available for basic analysis [3] [7] |
RNAscope technology represents a paradigm shift in spatial genomics, effectively addressing the long-standing limitations of conventional RNA ISH techniques through its innovative double Z probe design and signal amplification system. By enabling highly specific and sensitive detection of RNA biomarkers within intact tissue architecture, this platform provides researchers with unprecedented capability to correlate gene expression patterns with histological context. The technology's compatibility with automated staining systems, robust performance across diverse tissue types, and flexible multiplexing options position it as an indispensable tool for drug development professionals seeking to characterize tissue distribution of drug targets and biomarkers. As spatial genomics continues to evolve, RNAscope's unique ability to deliver single-molecule sensitivity while preserving morphological context establishes it as a cornerstone technology for advancing our understanding of gene expression in health and disease.
RNA in situ hybridization (ISH) has long been a valuable technique for visualizing RNA expression within its morphological context; however, traditional approaches often suffer from limited sensitivity and specificity, restricting their utility for detecting low-abundance transcripts. The RNAscope platform addresses these limitations through its proprietary 'Double Z' probe design, which enables simultaneous signal amplification and background suppression to achieve single-molecule detection sensitivity. This technical guide explores the fundamental principles of this innovative probe architecture, detailing how its unique mechanism underlies the precise spatial analysis of gene expression that is revolutionizing RNA biomarker validation and therapeutic development research.
RNAscope represents a significant advancement in the field of spatial genomics, providing researchers with an unprecedented ability to detect and quantify RNA molecules within intact cells and tissues. As a novel in situ hybridization (ISH) assay, its primary innovation lies in a proprietary probe design strategy that amplifies target-specific signals while effectively suppressing background noise from nonspecific hybridization [2]. This technology fulfills a critical need in molecular pathology and research by enabling in situ analysis of RNA biomarkers with sensitivity and specificity approaching that of grind-and-bind methods like RT-PCR, while preserving the crucial histopathological context that those methods destroy [1]. The ability to examine biomarker status within the native tissue architecture allows researchers and drug development professionals to better understand cellular heterogeneity, identify rare cell populations, and validate potential therapeutic targets within complex biological systems.
The Double Z Probe Design: Core Principles and Mechanism
Fundamental Architecture
The RNAscope Double Z probe design employs a sophisticated dual-probe system that functions like a molecular security checkpoint, ensuring that only specifically bound probes generate detectable signals. This system utilizes pairs of target probes designed to hybridize contiguously to the target RNA molecule, with each individual probe containing three distinct elements [2]. The lower region of each Z consists of an 18-25 base sequence complementary to the target RNA, selected for specific hybridization properties. A spacer sequence links the two components of the probe, while the upper region features a 14-base tail sequence [2]. Critically, the two tail sequences from a properly paired Double Z probe combine to form a 28-base binding site for the pre-amplifier molecule [1]. This requirement for two adjacent binding events provides the foundation for the technology's exceptional specificity, as it is statistically improbable that nonspecific hybridization would position two independent probes precisely next to each other on an off-target sequence [9].
Signal Amplification Cascade
The Double Z probe system employs a multi-stage, hybridization-mediated amplification process that dramatically enhances detection sensitivity:
- Step 1: Target Binding - Approximately 20 Double Z target probe pairs hybridize to a ~1 kb region of the target RNA molecule [2]
- Step 2: Pre-amplifier Recruitment - The combined 28-base binding site formed by each ZZ probe pair recruits a single pre-amplifier molecule [1]
- Step 3: Amplifier Binding - Each pre-amplifier contains multiple binding sites (typically 20) for amplifier molecules [1]
- Step 4: Label Probe Attachment - Each amplifier provides numerous binding sites (typically 20) for label probes conjugated with fluorescent dyes or chromogenic enzymes [1]
This cascading amplification system theoretically generates up to 8000 labels for each target RNA molecule when using 20 probe pairs, enabling visual detection of individual transcripts as punctate dots under standard microscopy [1]. The 20-probe design provides robustness against variable target accessibility or partial RNA degradation, as only three binding pairs are theoretically required to detect a single RNA molecule [2].
Table 1: Key Design Specifications for RNAscope Probe Systems
| Probe System | Target Length | Number of ZZ Pairs | Primary Applications |
|---|---|---|---|
| RNAscope | >300 bases | ~20 pairs | Standard mRNAs, long non-coding RNAs |
| BaseScope | 50-300 bases | 1-3 pairs | Short targets, degraded RNA, splice variants, highly homologous sequences |
| miRNAscope | 17-50 bases | Not specified | microRNA detection |
Specificity Mechanisms
The Double Z design incorporates multiple layers of specificity control. The initial in silico probe design utilizes custom algorithms to select oligo sequences with compatible melting temperatures and minimal cross-hybridization to off-target sequences [1]. This bioinformatic screening is complemented by the fundamental requirement for dual probe binding, which prevents amplification from single probes that might bind nonspecifically to similar sequences [9]. Each major step in the probe design process includes verification procedures to guarantee accuracy before manufacturing [10]. This multi-layered approach to specificity enables researchers to distinguish between highly homologous sequences and accurately quantify expression levels in complex tissue environments with high autofluorescence or diverse cell populations.
Experimental Applications and Methodologies
Tissue Preparation and Pretreatment Protocols
The successful application of RNAscope technology depends on proper tissue collection, preservation, and pretreatment to maintain RNA integrity while allowing probe accessibility:
- Fresh Frozen Tissues: For rodent brain studies, deeply anesthetize the animal and perform rapid dissection. Immediately snap-freeze the tissue in chilled 2-methylbutane (-30°C) for 25 seconds to prevent cracking during cryostat sectioning and protect mRNA from degradation [11]. Store brains at -80°C for up to 12 months, as extended storage can lead to progressive mRNA degradation [11]. Cut sections at 10-16μm thickness using a cryostat and mount on Superfrost Plus microscope slides.
- Formalin-Fixed Paraffin-Embedded (FFPE) Tissues: Cut 5μm sections and deparaffinize in xylene followed by ethanol series dehydration [1]. Perform antigen retrieval by incubating sections in citrate buffer (10 mmol/L, pH 6) at 100-103°C for 15 minutes, then treat with protease (10 μg/mL) at 40°C for 30 minutes in a specialized HybEZ hybridization oven [1].
- Cell Culture Systems: Grow cells directly on slides and fix in 4% formaldehyde for 60 minutes, followed by protease digestion (2.5 μg/mL) at 23-25°C [1].
Hybridization and Detection Workflow
The RNAscope procedure follows a standardized workflow that can be adapted for either chromogenic or fluorescent detection:
- Permeabilization: Treat prepared samples with RNAscope Pretreatment Kit to unmask target RNA and permeabilize cells [2]
- Hybridization: Apply target-specific Double Z probes in hybridization buffer and incubate at 40°C for 3 hours [1]
- Signal Amplification: Perform sequential hybridizations with pre-amplifier (30 minutes), amplifier (15 minutes), and label probes (15 minutes) at 40°C [1]
- Visualization: Detect punctate dot signals using either fluorescent microscopy or chromogenic development with Fast Red or DAB substrates [1]
- Quantification: Analyze single-molecule signals on a cell-by-cell basis through manual counting or automated image analysis platforms like HALO software or QuPath [2] [11]
Table 2: RNAscope Detection Channels and Multiplexing Capabilities
| Probe Designation | Compatible Assays | Amplification Channel | Multiplexing Capacity |
|---|---|---|---|
| C1, C2, C3, C4 | RNAscope, BaseScope | Channels 1-4 | Up to 4-plex in standard assays |
| T1, T2, T3, etc. | HiPlex Assay | Independent channels | Up to 48-plex in HiPlex |
| S1 | miRNAscope | Specific to miRNAscope | miRNA detection |
Diagram 1: Double Z probe mechanism and signal amplification cascade. Each hybridization step builds upon the previous to create a powerful amplified signal specifically bound to the target RNA.
Advanced Applications: Intronic Probes for Nuclear Localization
Recent innovations have expanded RNAscope applications to include specialized intronic probes that enable precise identification of cell types based on nuclear RNA localization. This approach is particularly valuable in cardiac regeneration studies, where traditional antibody-based methods struggle to accurately identify cardiomyocyte nuclei [12]. Intronic probes target pre-mRNA sequences before splicing occurs, effectively labeling the nuclear compartment of specific cell types:
- Design Principle: Intronic RNAscope probes utilize the same Double Z design but target intronic regions of pre-mRNA that remain in the nucleus before splicing and export to the cytoplasm [12]
- Experimental Validation: A Tnnt2 intronic RNAscope probe demonstrated high colocalization with Obscurin-H2B-GFP in adult mouse hearts, confirming cardiomyocyte specificity [12]
- Mitotic Tracking: During embryonic development, Tnnt2 intronic probes remain associated with cardiomyocyte chromatin throughout all mitotic stages, including nuclear envelope breakdown, enabling reliable cell cycle analysis [12]
- Cell Subtype Identification: Myl2 and Myl4 intronic probes successfully label ventricular and atrial cardiomyocyte nuclei respectively, facilitating identification of cardiomyocyte subtypes generated in vitro from stem cells [12]
This application demonstrates the versatility of the Double Z platform beyond conventional mRNA detection, providing researchers with powerful tools for nuclear localization and cell type identification in complex tissues.
Quantification and Data Analysis Frameworks
Standardized Quantification Methods
RNAscope data analysis leverages the technology's single-molecule sensitivity to provide precise quantitative and semi-quantitative assessments of gene expression. The punctate nature of the signal, where each dot represents an individual RNA molecule, enables multiple analytical approaches:
Methodology #1 (Semi-Quantitative Histological Scoring): Implement a standardized scoring system based on dot counts per cell:
- Score 0: 0 dots/cell
- Score 1: 1-3 dots/cell
- Score 2: 4-9 dots/cell
- Score 3: 10-15 dots/cell
- Score 4: >15 dots/cell [3]
Methodology #2 (Image-Based Quantitative Analysis): Utilize automated image analysis software such as QuPath or HALO to detect and quantify dots per cell across entire tissue sections [11] [3]. The open-source software QuPath provides custom scripts for automated cell detection and mRNA signal thresholding using negative controls to establish background levels [11]
Methodology #3 (H-Score Calculation): Generate a Histo score (range 0-400) that incorporates both expression intensity and the percentage of positive cells: H-score = Σ (ACD score × percentage of cells per bin) [3]
Analysis Scenarios for Different Expression Patterns
RNAscope data analysis must be tailored to specific biological contexts and expression patterns:
- Homogeneous Expression: When target expression is relatively uniform within a cell type (e.g., housekeeping genes), calculate the average dots per cell across the entire cell population [3]
- Heterogeneous Expression: For variable expression within a cell population, implement binning strategies to categorize cells by expression level and present data as histograms showing expression distribution [3]
- Subpopulation-Specific Expression: When targets are restricted to specific cell subsets or anatomical regions, focus analysis on relevant subpopulations and report percentage of positive cells [3]
- Co-expression Analysis: For multiplex experiments detecting multiple RNA species, calculate dual-positive percentages by dividing cells positive for both targets by total cell count [3]
Table 3: Quantitative Analysis Approaches for Different Experimental Scenarios
| Expression Scenario | Primary Analysis Method | Key Output Metrics | Software Recommendations |
|---|---|---|---|
| Homogeneous Target Expression | Average dots per cell | Mean dots/cell, score 0-4 | HALO, QuPath |
| Heterogeneous Target Expression | Cell binning + H-score | Expression distribution, H-score (0-400) | HALO with custom algorithms |
| Target Co-expression | Dual-positive percentage | % cells positive for both targets | HALO Multiplex IHC modules |
| Rare Cell Population | Positive cell counting | Number of positive cells, % positive | QuPath with cell detection |
| Subcellular Localization | Compartment-specific quantification | Nuclear vs. cytoplasmic distribution | QuPath with subcellular detection |
Essential Research Reagent Solutions
Successful implementation of RNAscope technology requires specific reagents and equipment designed to maintain the integrity of the hybridization process and ensure reproducible results:
- RNAscope Kits: The platform offers specialized reagent kits tailored to different sample types, including the RNAscope Fluorescent Multiplex Reagent Kit for fresh frozen tissues (catalog #320850) and the RNAscope Universal Pretreatment Kit for FFPE samples [11]
- Probe Design Resources: ACD provides custom probe design services for novel targets, with compatibility analysis for cross-species detection requiring >95% sequence homology [10]
- Specialized Equipment: The HybEZ II System hybridization oven provides precise temperature control (40°C) critical for proper hybridization, including the oven unit, humidity control tray, humidifying paper, EZ-Batch wash tray, and slide holders [11]
- Control Probes: Essential validation reagents include positive control probes for housekeeping genes like ubiquitin C (UBC) and negative control probes targeting bacterial genes like dapB to establish background levels [1]
- Signal Detection Systems: Choose between chromogenic detection (Fast Red, DAB) for bright-field microscopy or fluorescent label probes (Alexa Fluor conjugates) for multiplex analysis [1]
Diagram 2: RNAscope experimental workflow. The standardized procedure guides samples from preparation through quantification, with specific requirements at each stage to ensure optimal results.
The Double Z probe design represents a fundamental innovation in spatial genomics, providing the technical foundation for RNAscope's exceptional sensitivity and specificity. By requiring dual probe binding for signal amplification, this architecture achieves the single-molecule detection capability that has made the technology indispensable for modern biomarker validation, drug development, and basic research. The platform's compatibility with routine FFPE specimens, combined with its flexible multiplexing capabilities and quantitative output, positions it as a powerful tool for translating RNA biomarkers into clinical applications. As research continues to advance, with developments like intronic probes expanding its utility, the Double Z design principle continues to enable new discoveries in cellular heterogeneity and gene expression analysis within morphological context.
The analysis of RNA biomarkers within their native cellular and tissue context is critically important for molecular pathology, as it allows researchers to examine biomarker status while preserving valuable morphological information. While immunohistochemistry (IHC) and DNA in situ hybridization (ISH) have become standard clinical tools for assessing protein and DNA biomarkers respectively, clinical use of in situ RNA analysis has remained limited despite the abundance of RNA biomarkers discovered through whole-genome expression profiling. This disparity primarily stems from the technical complexity, insufficient sensitivity, and inadequate specificity of conventional RNA ISH techniques, which often suffer from high background noise and cannot reliably detect low-abundance RNA targets [1].
The introduction of RNAscope technology in 2012 represented a paradigm shift in RNA detection methodologies, overcoming these limitations through a novel probe design strategy that enables simultaneous signal amplification and background suppression. This technical advancement finally brought the benefits of in situ analysis—preservation of tissue architecture and cellular heterogeneity—to RNA biomarker detection, creating new opportunities for research and diagnostic applications [1] [13]. Unlike "grind-and-bind" approaches like RT-PCR that require RNA extraction and lose spatial context, RNAscope allows visualization of individual RNA molecules within intact cells and tissues, providing both quantitative and spatial information that is invaluable for understanding gene expression patterns in complex biological systems [1].
The Core Technology: RNAscope's Proprietary Probe Design
The Double-Z Probe Architecture
The foundational innovation enabling RNAscope's exceptional performance is its unique double-Z probe design, which forms the basis for both high specificity and significant signal amplification. This proprietary design employs pairs of target probes that are engineered to hybridize contiguously to the same RNA molecule [1] [13]. Each individual target probe consists of three distinct regions:
- An 18-25 base region complementary to the target RNA sequence
- A spacer sequence that serves as a linker
- A 14-base tail sequence (conceptualized as "Z") [1]
When these probe pairs bind adjacently to their target RNA, their tail sequences align to form a 28-base hybridization site for the next component in the amplification cascade. This requirement for contiguous binding of two independent probes provides the foundation for RNAscope's exceptional specificity, as it is statistically improbable that nonspecific hybridization events would precisely juxtapose two different probes along an off-target sequence to create the required binding site [1] [8].
Table 1: Components of the RNAscope Double-Z Probe System
| Component | Structure | Function |
|---|---|---|
| Target Probes | 18-25 bases complementary to target RNA + 14-base tail | Specifically bind target RNA and create preamplifier binding site |
| Spacer Sequence | Connector between target-complementary region and tail | Positions tail sequences for proper alignment |
| Double-Z Pair | Two probes binding contiguously to target RNA | Creates 28-base site for preamplifier binding |
Specialized Controls for Assay Validation
To ensure reliable results, RNAscope incorporates specific control probes that validate both assay procedure and sample quality. The negative control utilizes the bacterial gene dapB (dihydrodipicolinate reductase), which should not be present in animal tissues, to confirm the absence of background noise and nonspecific amplification [1] [13] [8]. For positive controls, several housekeeping genes are employed depending on expected expression levels: PPIB (peptidylprolyl isomerase B) for moderately expressed genes (10-30 copies/cell), POLR2A (RNA polymerase II subunit A) for low expression genes (3-15 copies/cell), and UBC (ubiquitin C) for highly expressed targets (>20 copies/cell) [13] [14]. These controls not only verify assay performance but also provide a measure of RNA integrity in test samples [8] [14].
The Hybridization Cascade: Step-by-Step Amplification
The RNAscope signal amplification process employs a multi-step hybridization cascade that builds upon the foundation established by the double-Z probe pairs. This process unfolds sequentially with each step contributing to the exponential amplification while maintaining stringent specificity.
Diagram 1: RNAscope Signal Amplification Cascade
Preamplifier Binding and Amplifier Assembly
Following successful hybridization of the double-Z probe pairs to the target RNA, the preamplifier molecule binds to the aligned 28-base site formed by the tail sequences of the probe pair [1] [8]. This binding event is highly specific—the preamplifier requires the complete 28-base sequence presented contiguously for stable association, providing an additional layer of specificity beyond the initial probe hybridization [8]. Each bound preamplifier then serves as a scaffolding structure that contains 20 binding sites for amplifier molecules [1] [13]. The sequential nature of this process—with each step requiring successful completion of the previous step—ensures that background signals from nonspecific binding are effectively suppressed, as isolated non-specifically bound probes cannot initiate the amplification cascade.
Label Probe Recruitment and Signal Generation
The final stage of the amplification cascade involves the binding of label probes to the amplifier molecules. Each amplifier contains 20 binding sites for these label probes, which can be conjugated with either chromogenic enzymes (horseradish peroxidase or alkaline phosphatase) for bright-field microscopy or fluorescent dyes for fluorescence detection [1] [15]. The mathematical amplification potential of this system is substantial—with 20 probe pairs typically targeting each RNA molecule, and each subsequent step providing 20-fold amplification, the system can theoretically generate up to 8,000 labels for each target RNA molecule (20 × 20 × 20 = 8,000) [1]. This massive amplification factor enables single-molecule detection while maintaining exceptional signal-to-noise ratio, as the requirement for specific probe pairing effectively suppresses background signal.
Experimental Protocol and Methodological Details
Sample Preparation and Pretreatment
The RNAscope assay is compatible with various sample types, including formalin-fixed paraffin-embedded (FFPE) tissues (most common), fresh frozen tissues, tissue microarrays (TMA), and cultured cells [13] [8]. For FFPE tissues, which represent the most clinically relevant sample type, sections of 5μm thickness are standard. The pretreatment process involves three critical steps:
- Deparaffinization and dehydration using xylene followed by an ethanol series [1]
- Target retrieval using citrate buffer (10 mmol/L, pH 6) at boiling temperature (100-103°C) for 15 minutes to partially reverse formalin-induced cross-links [1]
- Protease treatment (typically 10 μg/mL for 30 minutes at 40°C) to permeabilize cell membranes and unmask RNA targets by degrading bound proteins [1]
This pretreatment protocol has been optimized for samples fixed according to American Society of Clinical Oncology/College of American Pathologists (ASCO/CAP) guidelines (10% neutral buffered formalin for 6-72 hours at room temperature) [1]. The proprietary pretreatment reagents, including RNAscope Target Retrieval, RNAscope Hydrogen Peroxide (for blocking endogenous peroxidase activity), and RNAscope Proteases (Plus, III, or IV with varying proteolytic activities), have been specifically formulated to provide enhanced access of in situ hybridization probes to nucleic acid targets across diverse sample types [8].
Hybridization and Amplification Steps
Following pretreatment, samples undergo a series of sequential hybridization steps performed at 40°C in a specialized hybridization oven [1]:
Table 2: RNAscope Hybridization Protocol Steps and Conditions
| Step | Reagent | Concentration | Duration | Buffer Composition |
|---|---|---|---|---|
| Target Probe Hybridization | Target Probes | Specific to assay | 3 hours | 6× SSC, 25% formamide, 0.2% lithium dodecyl sulfate, blocking reagents |
| Preamplifier Binding | Preamplifier | 2 nmol/L | 30 minutes | 20% formamide, 5× SSC, 0.3% lithium dodecyl sulfate, 10% dextran sulfate, blocking reagents |
| Amplifier Binding | Amplifier | 2 nmol/L | 15 minutes | 20% formamide, 5× SSC, 0.3% lithium dodecyl sulfate, 10% dextran sulfate, blocking reagents |
| Label Probe Binding | Label Probe | 2 nmol/L | 15 minutes | 5× SSC, 0.3% lithium dodecyl sulfate, blocking reagents |
Between each hybridization step, slides are washed with wash buffer (0.1× SSC, 0.03% lithium dodecyl sulfate) three times at room temperature to remove unbound reagents [1]. For multiplex detection enabling simultaneous visualization of multiple RNA targets, equimolar amounts of target probes, preamplifiers, amplifiers, and label probes from different amplification systems are pooled and applied simultaneously [1]. The entire procedure can be completed within a single day and is amenable to automation on platforms such as Leica Biosystems' BOND RX and Roche Tissue Diagnostics' Discovery Ultra systems [13] [5].
Detection Methods and Visualization
Chromogenic vs. Fluorescent Detection
RNAscope offers flexibility in detection methods to suit different experimental needs and equipment availability. For chromogenic detection, the label probe is conjugated to either horseradish peroxidase (HRP) for detection with 3,3'-diaminobenzidine (DAB) that produces a brown precipitate, or alkaline phosphatase for detection with Fast Red that yields a red precipitate [1] [3]. Chromogenic-stained slides can be viewed under a standard bright-field microscope, similar to routine immunohistochemistry procedures, making them familiar to pathologists and easy to archive in clinical settings [1].
For fluorescent detection, label probes are conjugated to fluorophores such as Alexa Fluor 488, 546, 647, or 750 [1]. Recent enhancements to the multiplex fluorescent assay include TSA Vivid Dyes, which provide brighter signals and improved color vividness for better visualization [15]. Fluorescent detection enables multiplex analysis, allowing simultaneous detection of up to four different RNA targets in the same sample by using spectrally distinguishable fluorophores [1] [15]. This capability is particularly valuable for studying gene co-expression patterns, cell-type specific markers, and cellular interactions within complex tissues.
Data Interpretation and Quantitative Analysis
A fundamental principle of RNAscope data interpretation is that each punctate dot represents a single RNA molecule [16] [3]. Unlike protein IHC where signal intensity is often evaluated, RNAscope analysis focuses on counting the number of dots per cell, which directly correlates with RNA copy number [3] [8]. The intensity and size of individual dots reflect the number of double-Z probes bound to each target molecule rather than transcript abundance [13].
The recommended semi-quantitative scoring system evaluates the average number of dots per cell according to these criteria [3] [8]:
- Score 0: No staining or <1 dot per 10 cells
- Score 1: 1-3 dots per cell (visible at 20-40x magnification)
- Score 2: 4-10 dots per cell (very few dot clusters)
- Score 3: >10 dots per cell (less than 10% of dots form clusters)
- Score 4: >10 dots per cell with significant clustering (more than 10% of dots form clusters)
For more precise quantification, automated image analysis software such as HALO (Indica Labs), QuPath, or Aperio RNA ISH Algorithm (Leica Biosystems) can be employed to count dots on a cell-by-cell basis across entire tissue sections [13] [3] [5]. In cases of heterogeneous expression, the H-score (ranging from 0-400) can be calculated as follows: H-score = Σ (ACD score × percentage of cells per score) [3].
Technical Performance and Validation Data
Sensitivity and Specificity Assessments
Independent validation studies have confirmed RNAscope's exceptional performance characteristics. A systematic review published in 2021 evaluating RNAscope in clinical diagnostics found it to be a highly sensitive and specific method with high concordance rates with established techniques [13]. The review, which analyzed 27 retrospective studies, reported concordance rates of 81.8-100% with qPCR, qRT-PCR, and DNA ISH methods [13].
The unique double-Z probe design enables RNAscope to achieve both sensitivity and specificity approaching 100% under optimal conditions [13]. The technology can detect as few as 3-15 copies per cell for low-abundance targets using the POLR2A positive control and has demonstrated robust detection of even single RNA molecules [13] [14]. The high degree of redundancy in the system—with 20 separate probe pairs targeting each RNA—ensures reliable detection even when dealing with partially degraded RNA targets, as is common in archival FFPE samples [8].
Table 3: Quantitative Performance Metrics of RNAscope Technology
| Performance Metric | Result | Experimental Validation |
|---|---|---|
| Detection Sensitivity | Single RNA molecules | Visualization of individual punctate dots, each representing one transcript [16] [3] |
| Detection Specificity | Near 100% | Double-Z design requires two independent probes to bind contiguously [13] |
| Concordance with qPCR/qRT-PCR | 81.8-100% | Systematic review of 27 studies [13] |
| Concordance with IHC | 58.7-95.3% | Varies due to different targets (RNA vs. protein) [13] |
| Signal Amplification Factor | Up to 8,000x | Theoretical maximum labels per RNA molecule [1] |
| Compatibility with Archival FFPE | >10 years | No significant drop in PPIB expression in blocks from 2004-2008 [14] |
Applications in Research and Diagnostic Settings
RNAscope has proven particularly valuable in cancer research, where it enables precise localization of biomarker expression within tumor heterogeneity. Studies have successfully applied the technology to detect important therapeutic targets such as PD-L1 in immune oncology and c-MET in various cancer types [14]. The ability to correlate expression patterns with tissue morphology provides insights that are lost in bulk analysis methods like RT-PCR.
In diagnostic settings, RNAscope has shown promise for detecting viral infections, including Epstein-Barr virus (EBV) and high-risk human papillomavirus (HPV) subtypes [1] [3]. The technology's robustness has been demonstrated across prospectively collected biobank samples and retrospectively collected archival tissues, with consistent performance reported in colorectal, breast, prostate, and ovarian cancer specimens [14]. Analysis of control probe expression at different depths within FFPE blocks (up to 200μm) showed minimal variation, indicating uniform fixation and reliable detection throughout the tissue [14].
Essential Research Reagent Solutions
Successful implementation of RNAscope technology requires several key reagent systems that have been specifically optimized for the assay:
Table 4: Essential Research Reagents for RNAscope Experiments
| Reagent Category | Specific Examples | Function in Assay |
|---|---|---|
| Pretreatment Reagents | RNAscope Target Retrieval, Hydrogen Peroxide Reagent | Reverse cross-linking, block endogenous peroxidase |
| Protease Reagents | RNAscope Protease Plus, Protease III, Protease IV | Permeabilize membranes, unmask RNA targets |
| Control Probes | PPIB, POLR2A, UBC (positive); dapB (negative) | Validate assay performance and RNA quality |
| Detection Systems | HRP- or AP-based chromogenic, Fluorescent label probes | Signal generation and visualization |
| Hybridization Buffers | Hybridization Buffers A, B, C | Optimize probe binding and specificity |
| Automation Systems | Roche Discovery Ultra, Leica BOND RX | Standardize and scale up staining procedures |
These specialized reagents, available through Advanced Cell Diagnostics (now part of Bio-Techne), have been formulated to ensure consistent performance across different sample types and storage conditions [8]. The Pretreat Pro/AMP Pro reagents offer a protease-free pretreatment workflow that streamlines co-detection and multi-omic applications [8].
The RNAscope signal amplification cascade represents a significant technological advancement in molecular pathology, providing researchers with an unprecedented ability to visualize RNA expression within its native morphological context. Through its ingenious double-Z probe design and multi-stage amplification system, the technology achieves the rare combination of exceptional sensitivity and specificity, enabling single-molecule detection while effectively suppressing background noise.
The well-characterized protocol, compatibility with automated platforms, and flexibility in detection methods make RNAscope accessible to both research and clinical laboratories. As the field continues to recognize the importance of spatial context in gene expression analysis, RNAscope's ability to preserve this information while providing quantitative data positions it as an invaluable tool for understanding complex biological processes, validating biomarkers, and advancing drug development efforts.
RNAscope represents a groundbreaking advancement in in situ hybridization (ISH) technology, fundamentally enhancing the capabilities of spatial gene expression analysis. This technical guide details the core principles and methodologies underpinning its key performance advantages: single-molecule sensitivity, exceptional specificity via a unique probe design, and reliable performance on formalin-fixed paraffin-embedded (FFPE) tissues. By providing a robust platform for visualizing RNA within its morphological context, RNAscope is proving indispensable for both basic research and drug development, enabling high-quality data that informs our understanding of disease mechanisms and therapeutic targets.
The analysis of RNA biomarkers is crucial for cancer diagnosis, prognosis, and therapy guidance. While techniques like quantitative RT-PCR (qRT-PCR) are considered gold standards for gene expression analysis, they are "grind-and-bind" methods that require RNA extraction, a process that destroys the tissue context of gene expression measurements [1]. This makes it impossible to map observed signals to individual cells or to assess cellular heterogeneity within a sample. Immunohistochemistry (IHC) allows for spatial analysis but depends on antibody availability and detects proteins, not the RNA transcripts themselves [17] [4].
Conventional RNA ISH techniques, developed over previous decades, have been hampered by technical complexity, insufficient sensitivity, and a lack of specificity, leading to high background noise and an inability to reliably detect low-abundance RNA targets [1] [18]. The introduction of RNAscope in 2012 successfully addressed these limitations. Its novel design fulfills a critical need in molecular pathology by allowing the examination of biomarker status within the full histopathological context of clinical specimens [1].
The RNAscope Platform: Core Principles and Workflow
Proprietary Double Z Probe Design
The foundational innovation of RNAscope is its double Z (ZZ) probe design, which is engineered to amplify target-specific signals while effectively suppressing background noise from non-specific hybridization [1] [2].
- Probe Structure: Each target probe is composed of three elements:
- A lower region (18-25 bases) that is complementary to the target RNA sequence.
- A spacer sequence that links the two components.
- An upper tail region (14 bases) that forms part of the binding site for signal amplification [2].
- Tandem Binding: A pair of these "Z" probes must hybridize contiguously to the target RNA molecule, with their two tail sequences juxtaposed to form a single 28-base binding site for the pre-amplifier molecule [1]. This requirement is the cornerstone of the technology's high specificity, as it is statistically improbable for two independent probes to bind non-specifically to an off-target sequence in the correct tandem orientation [2] [8].
Signal Amplification Cascade
Following successful probe binding, a multistep hybridization process creates a powerful, yet specific, signal amplification cascade [2]:
- Pre-amplifier Binding: The pre-amplifier binds specifically to the 28-base site created by the double Z probe pair.
- Amplifier Binding: Multiple amplifier molecules then bind to their complementary sites on the pre-amplifier.
- Label Probe Binding: Finally, each amplifier provides numerous binding sites for enzyme-linked (e.g., horseradish peroxidase) or fluorescently labeled probes.
This sequential buildup results in a theoretical 8,000-fold signal amplification for each target RNA molecule, which is visualized as a distinct punctate dot under a microscope [13] [1]. The system uses 20 such probe pairs per target RNA, providing redundancy that ensures detection even if some target regions are inaccessible due to protein binding or partial RNA degradation [1] [8].
Experimental Workflow
The RNAscope assay workflow is standardized and can be performed manually or on automated staining platforms, facilitating integration into laboratory practice [4]. The key stages are outlined below and summarized in Figure 1.
Figure 1: RNAscope assay workflow from sample preparation to data analysis.
- Step 1: Permeabilization: Tissue sections (typically FFPE) are deparaffinized, and then pretreated with a combination of heat-induced epitope retrieval and protease digestion. This critical step unmasks the target RNA and permeabilizes the cell membrane to allow probe access [4] [8].
- Step 2: Hybridize: Target-specific probes, comprising ~20 double Z probe pairs, are hybridized to the target RNA in the sample [2] [4].
- Step 3: Amplify: A series of sequential hybridizations with pre-amplifier, amplifier, and label probes are performed to build the amplification tree. Automated systems typically involve 6-7 distinct amplification steps [4].
- Step 4: Visualize & Quantify: For chromogenic detection, an enzyme-mediated reaction produces a permanent stain. Each punctate dot represents a single RNA molecule. Quantification is performed by counting dots per cell, either manually or using image analysis software like HALO or QuPath [13] [4].
Detailed Examination of Key Advantages
Single-Molecule Sensitivity
The RNAscope platform achieves single-molecule visualization, a level of sensitivity that allows researchers to detect and quantify individual RNA transcripts within individual cells.
- Amplification Mathematics: The 20 double Z probe pairs per target provide significant signal redundancy. The binding of just three probe pairs is sufficient to detect a single RNA molecule. The full amplification cascade, with each pre-amplifier binding multiple amplifiers which in turn bind multiple label probes, can theoretically yield up to 8,000 labels per target RNA, ensuring that even a single transcript generates a readily detectable signal [13] [1].
- Detection and Quantification: The outcome of this sensitive detection is visualized as discrete, punctate dots. The number of dots per cell directly correlates with the expression level of the target gene, enabling semi-quantitative analysis. Scoring guidelines are based on dot counts: 0 (no staining), 1+ (1-3 dots/cell), 2+ (4-10 dots/cell), 3+ (>10 dots/cell, few clusters), and 4+ (>10 dots/cell, many clusters) [4]. This moves analysis beyond simple presence/absence to an assessment of relative expression levels.
High Specificity
The double Z probe design is the principal factor conferring RNAscope's high specificity, which can reach 100% in validated assays [13].
- Mechanism of Background Suppression: In traditional ISH, a single probe binding non-specifically can generate a false-positive signal. In the RNAscope system, a non-specifically bound single Z probe cannot form the required 28-base binding site for the pre-amplifier. Therefore, the entire amplification cascade is contingent upon the precise, tandem binding of two independent probes, an event that is highly unlikely to occur by chance at an off-target site [1] [2]. This effectively eliminates background noise.
- Comparative Performance: A systematic review evaluating RNAscope in a clinical diagnostics context confirmed its high specificity and sensitivity, reporting a high concordance rate (CR) with PCR-based methods (81.8–100%) and DNA ISH [13]. Its concordance with IHC was lower (58.7–95.3%), which is expected as the two techniques measure different biomolecules (RNA vs. protein), and discrepancies can arise from post-transcriptional regulation [13].
Robustness in FFPE Tissues
Archival FFPE tissues are the standard in pathology, but the formalin fixation process cross-links and fragments nucleic acids, posing a major challenge for RNA analysis. RNAscope is uniquely suited for this sample type.
- Compatibility with Archival Samples: The technology has been explicitly optimized for FFPE tissues fixed according to standard protocols (e.g., 10% neutral buffered formalin for 6-72 hours) [1]. The relatively short target region (40-50 bases) required for the double Z probe pair binding allows it to successfully hybridize to partially degraded RNA molecules that are common in FFPE samples [2] [8].
- Automation and Standardization: The availability of fully automated protocols on platforms like the Leica BOND RX and Roche Discovery Ultra ensures consistent, reproducible results, reduces manual hands-on time, and enhances throughput, making it suitable for both research and potential clinical diagnostic applications [4].
Table 1: Quantitative Performance of RNAscope vs. Gold Standard Techniques
| Comparison Technique | Measured Biomolecule | Concordance Rate (CR) with RNAscope | Primary Reason for Discrepancy |
|---|---|---|---|
| qPCR / qRT-PCR | RNA | 81.8% - 100% [13] | PCR lacks spatial context; differences in sampled tissue areas. |
| DNA In Situ Hybridization (ISH) | DNA | High CR (specific range not given) [13] | Both are in situ techniques, but target different nucleic acids. |
| Immunohistochemistry (IHC) | Protein | 58.7% - 95.3% [13] | Measures protein levels, which can be influenced by post-transcriptional regulation. |
Essential Protocols for Researchers
Control and Validation Strategies
Implementing rigorous controls is paramount for generating reliable and interpretable data with RNAscope.
- Positive Control Probes: These verify tissue RNA integrity and assay procedure. The choice of positive control should be matched to the expected expression level of the target gene:
- Negative Control Probes: The bacterial dapB gene is used as a universal negative control to confirm the absence of background staining. A successful assay shows strong staining with the positive control and no staining with dapB [13] [4].
- Sample Qualification: Before running experimental samples, it is recommended to test the positive and negative controls on a new tissue type to determine the optimal pretreatment conditions. If the positive control signal is low or the negative control shows background, adjustments to protease concentration or epitope retrieval may be required [4] [8].
The Scientist's Toolkit: Key Research Reagent Solutions
Table 2: Essential Reagents and Materials for RNAscope Assays
| Item Category | Specific Examples | Function & Importance |
|---|---|---|
| Control Probes | PPIB, POLR2A, UBC (Positive); dapB (Negative) [13] [8] | Validate assay performance, tissue RNA quality, and specificity. Critical for every experiment. |
| Pretreatment Reagents | RNAscope Target Retrieval, RNAscope Protease Plus/III/IV [8] | Unmask target RNA, permeabilize cells, and block endogenous enzymes. Essential for signal access in FFPE. |
| Probe & Detection Kits | RNAscope 2.5 LS Reagent Kit [4] | Provide the core components for hybridization, amplification, and chromogenic/fluorescent detection. |
| Automation Platforms | Leica BOND RX, Roche Discovery Ultra [4] | Enable standardized, high-throughput, and reproducible staining with minimal manual intervention. |
| Image Analysis Software | HALO (Indica Labs), QuPath, Aperio (Leica) [13] [4] | Quantify punctate dot signals on a cell-by-cell basis for objective, high-content data extraction. |
Applications in Research and Drug Development
The unique advantages of RNAscope have led to its widespread adoption across diverse fields.
- Cancer Research and Biomarker Development: RNAscope is extensively used to characterize the expression of oncogenes, tumor suppressor genes, and immuno-oncology biomarkers within the tumor microenvironment. It is ideal for studying tumor heterogeneity and for validating biomarkers discovered via genomic sequencing [19]. For example, it provides a highly specific method for detecting active High-Risk HPV infection in oropharyngeal cancer by visualizing E6/E7 viral oncogene mRNA, outperforming the surrogate marker p16 IHC in specificity [20].
- Neuroscience: The technology is invaluable for mapping the expression of neurotransmitters, receptors, and immediate-early genes in specific neuronal subpopulations, aiding studies of neural circuits, brain function, and disease [21] [19].
- Infectious Disease & Virology: RNAscope allows researchers to localize viral RNA within host tissues, defining viral reservoirs, tropism, and the dynamics of infection and host response [21] [19].
- Preclinical Drug Development: In pharmaceutical research, RNAscope is used to characterize the tissue distribution of drug targets and biomarkers in various animal models (e.g., rat, dog, non-human primate), providing critical spatial context for pharmacokinetic and pharmacodynamic studies [17] [4]. Its robustness has led to its use as a primary assay in many studies, with over 1,000 publications citing its use by 2017 [21].
RNAscope technology, with its foundational double Z probe design and sophisticated amplification cascade, establishes a new benchmark for in situ RNA analysis. Its core advantages—single-molecule sensitivity, exceptional specificity, and proven robustness in FFPE tissues—directly address the limitations of previous methodologies. For researchers and drug development professionals, this platform provides a powerful and reliable means to visualize gene expression with single-cell resolution within the native tissue architecture. As spatial biology continues to emerge as a critical field, RNAscope is poised to remain an essential tool for translating genomic discoveries into a deeper, more contextual understanding of biology and disease.
The ability to visualize and quantify RNA molecules within their native cellular and tissue context represents a cornerstone of modern spatial genomics. In situ hybridization (ISH) techniques have long been instrumental for this purpose, yet traditional approaches often suffered from limitations in sensitivity, specificity, and the inability to detect low-abundance transcripts. The advent of RNAscope Technology has addressed these challenges through a revolutionary design that enables single-molecule detection of RNA within intact cells. This novel ISH platform employs proprietary probe design and signal amplification to achieve exceptional signal-to-noise ratios, allowing researchers to detect individual RNA molecules as punctate dots under a standard microscope [2] [22].
The fundamental principle underlying RNAscope's breakthrough involves a probe design strategy that amplifies target-specific signals while effectively suppressing background noise from non-specific hybridization. This technical advancement has transformed how researchers investigate gene expression patterns, cellular heterogeneity, and transcriptional dynamics in diverse research areas including neuroscience, oncology, and developmental biology. By preserving spatial information that is lost in bulk extraction methods like RNA sequencing, RNAscope provides critical insights into the molecular architecture of tissues and organs [22] [23].
This technical guide explores the core principles of RNAscope technology, with particular emphasis on interpreting the punctate dot signals that represent individual RNA molecules. We will examine the underlying mechanisms, detailed experimental protocols, proper control strategies, quantitative analysis methods, and practical applications relevant to researchers, scientists, and drug development professionals engaged in spatial genomic research.
The Core Technology Behind RNAscope
Proprietary Probe Design Strategy
The exceptional performance of RNAscope stems from its innovative double Z probe design, which functions similarly to molecular recognition principles used in fluorescence resonance energy transfer (FRET) assays. This design fundamentally differs from traditional ISH approaches that utilize single probes, which are prone to non-specific binding and consequent background noise [2].
Each RNAscope probe set consists of approximately 20 double Z probe pairs that are specifically designed to hybridize to the target RNA molecule. The structural architecture of each target Z probe incorporates three distinct elements:
- The lower region comprises an 18-25 base sequence complementary to the target RNA, selected for optimal hybridization properties
- A spacer sequence that links the two functional components of the probe
- The upper region features a 14-base tail sequence that facilitates subsequent signal amplification [2]
The critical innovation lies in the requirement for two independent Z probes to hybridize in tandem to adjacent target sequences before signal amplification can proceed. This paired-probe system dramatically reduces false-positive signals because it is statistically improbable that two independent probes would bind nonspecifically to adjacent sites on non-target molecules. This molecular mechanism ensures that amplification occurs exclusively when true target binding has taken place, resulting in unprecedented specificity for RNA detection [2] [22].
Signal Amplification Mechanism
Following successful probe hybridization, RNAscope employs a cascade of sequential hybridization events to achieve detectable signal intensity from single RNA molecules:
- Double Z target probes hybridize specifically to the target RNA sequence
- Pre-amplifiers hybridize to the 28-base binding site formed by the tail regions of each double Z probe pair
- Amplifiers then bind to the multiple binding sites present on each pre-amplifier
- Labeled probes, conjugated with fluorescent molecules or chromogenic enzymes, subsequently bind to the numerous sites on each amplifier [2]
This multi-stage amplification strategy theoretically yields an 8000-fold increase in signal per target molecule, enabling visualization of individual transcripts that would otherwise remain undetectable. The branched DNA architecture creates a "tree" of amplification molecules that ultimately delivers sufficient signal for microscopic visualization while maintaining strict target specificity through the initial dual-probe recognition requirement [22].
Table: Components of the RNAscope Signal Amplification System
| Component | Structure | Function |
|---|---|---|
| Double Z Probes | 18-25 base target-complementary regions with 14-base tail | Initial target recognition; forms binding site for pre-amplifier |
| Pre-amplifier | Single oligonucleotide with multiple binding sites | Bridges Z probes to amplifiers; provides first amplification stage |
| Amplifier | Branched DNA structure with numerous ligand sites | Further amplifies signal; provides multiple binding sites for labels |
| Label Probes | Oligonucleotides conjugated to fluorophores or enzymes | Generates detectable signal through fluorescence or colorimetric reaction |
Visualization of Single RNA Molecules
The culmination of the RNAscope process is the appearance of discrete punctate dots at sites of target RNA localization. Each visually distinct dot represents an individual mRNA molecule, with the number of dots per cell corresponding directly to the transcript copy number [2] [6]. This one-to-one relationship between signal and molecule enables true quantitative analysis at the single-cell level.
The dot morphology may exhibit some variation in size and intensity, reflecting differences in the number of ZZ probes bound to each target molecule. However, for quantification purposes, the number of dots rather than their intensity provides the accurate metric for transcript enumeration. In cases of extremely high transcript density, dots may occasionally appear as clusters when multiple RNA molecules are in close proximity, but these can still be distinguished and quantified with proper imaging and analysis techniques [6] [24].
Experimental Protocol for RNAscope
Sample Preparation
Proper sample preparation is critical for successful RNAscope analysis, with specific requirements that differ from standard immunohistochemistry protocols:
- Fixation: Tissue samples should be fixed in fresh 10% neutral-buffered formalin (NBF) for 16-32 hours. Under-fixation or over-fixation can compromise RNA integrity and accessibility [24]
- Sectioning: Tissues should be sectioned at 5-20μm thickness and mounted on Superfrost Plus slides to prevent detachment during the rigorous hybridization procedure [22] [24]
- Pretreatment: Slides undergo pretreatment with the RNAscope Pretreatment Kit, which includes:
This pretreatment phase is essential for allowing probe access to the target RNA while maintaining tissue morphology and RNA integrity. All steps preceding probe hybridization should be performed under RNase-free conditions when working with fresh-frozen sections, though the RNAscope assay itself does not require an RNase-free environment [22] [24].
Hybridization and Signal Detection
The core RNAscope procedure involves a series of hybridization and amplification steps that can be completed in approximately 7-8 hours, either in a single day or divided across two days:
- Probe Hybridization: Target probes are applied to tissues and hybridized at 40°C for 2 hours using the HybEZ Hybridization System to maintain optimal temperature and humidity [22] [24]
- Signal Amplification: A series of amplification steps (AMP1-6) are performed sequentially, with careful washing between each step to remove unbound reagents
- Signal Development: For fluorescent detection, fluorophore-conjugated labels are applied; for chromogenic detection, enzyme-conjugated labels are developed with appropriate substrates [2] [22]
Throughout the procedure, slides must not be allowed to dry completely, as this causes irreversible damage to tissue morphology and hybridization efficiency. An ImmEdge Hydrophobic Barrier Pen is used to create defined reaction areas that maintain reagent coverage over the tissue sections [22] [24].
Essential Research Reagent Solutions
Table: Essential Reagents for RNAscope Experiments
| Reagent/Catalog Item | Function | Application Notes |
|---|---|---|
| RNAscope Multiplex Fluorescent Kit | Provides core reagents for fluorescent detection | Enables simultaneous detection of up to 3 RNA targets [22] |
| Target-Specific Probes (C1, C2, C3) | Hybridize to specific RNA targets | Channel 1 offers highest sensitivity; assign low-abundance targets to C1 [22] |
| Positive Control Probes (PPIB, POLR2A, UBC) | Assess RNA quality and assay performance | PPIB: moderate expression; POLR2A/UBC: low expression [24] |
| Negative Control Probe (dapB) | Bacterial gene control for background assessment | Should yield minimal to no signal in properly prepared samples [24] |
| Pretreatment Kit | Unmasks target RNA and permeabilizes cells | Critical for probe access; may require optimization for specific tissues [2] |
| HybEZ Hybridization System | Maintains optimal temperature and humidity | Essential for proper hybridization conditions [22] [24] |
| ImmEdge Hydrophobic Barrier Pen | Creates liquid barrier around tissue sections | Prevents sample drying; only Vector Laboratories pen recommended [22] [24] |
Controls and Validation
Essential Control Experiments
Robust experimental design for RNAscope requires implementation of proper controls to validate results and ensure assay specificity:
- Positive Control Probes: Housekeeping genes including PPIB (cyclophilin B), POLR2A (RNA polymerase II), and UBC (ubiquitin C) provide assessment of RNA integrity. Successful staining should generate scores ≥2 for PPIB and ≥3 for UBC with relatively uniform signal distribution [24]
- Negative Control Probe: The bacterial dapB gene should yield minimal to no signal (score <1) in properly prepared specimens, indicating low background and absence of non-specific hybridization [24] [23]
- Multiplexing Controls: When detecting multiple targets simultaneously, include both high- and low-expression targets distributed across different channels according to their relative abundance and channel sensitivity characteristics [22]
These controls are essential for troubleshooting and validating each experiment, particularly when working with novel targets or tissue types that haven't been previously optimized.
Scoring Guidelines and Interpretation
RNAscope results are interpreted using standardized scoring guidelines that focus on dot enumeration rather than signal intensity:
Table: RNAscope Semi-Quantitative Scoring Guidelines
| Score | Criteria | Interpretation |
|---|---|---|
| 0 | No staining or <1 dot per 10 cells | Negative/Negligible expression |
| 1 | 1-3 dots per cell | Low expression level |
| 2 | 4-9 dots per cell; few dot clusters | Moderate expression |
| 3 | 10-15 dots per cell; <10% dots in clusters | High expression |
| 4 | >15 dots per cell; >10% dots in clusters | Very high expression |
These scoring criteria were developed based on genes with expression levels ranging from 1 to >15 copies per cell. For targets with expression outside this range, the scale should be adjusted accordingly. It's important to note that dot clusters result from overlapping signals from multiple mRNA molecules in close proximity and should be counted as multiple transcripts [6] [24].
Quantitative Analysis of Punctate Dots
Analytical Approaches
The quantal nature of RNAscope signals (one dot = one RNA molecule) enables multiple approaches for quantitative analysis:
- Semi-Quantitative Manual Scoring: Using the established scoring guidelines (0-4) for rapid assessment of expression levels [24]
- Digital Image Analysis: Automated counting of dots per cell using software platforms such as HALO, QuPath, or ImageJ for enhanced precision and objectivity [2] [25] [23]
- H-Score Calculation: A weighted score that incorporates the percentage of cells expressing low, medium, and high levels of the target, frequently used in clinical biomarker applications [23]
For multiplex experiments, quantitative co-localization analysis can determine the percentage of cells expressing multiple targets simultaneously, providing insights into cellular phenotypes and functional states within heterogeneous tissues [22].
Validation with Orthogonal Methods
Studies have demonstrated strong concordance between RNAscope quantification and other molecular techniques:
- Comparison with RNA-Seq data from the Cancer Cell Line Encyclopedia showed significant correlation (Spearman's rho = 0.86, p < 0.0001) for DKK1 expression across 48 cell lines [23]
- RT-droplet digital PCR shows somewhat less concordance than automated counting methods, highlighting the importance of spatial context in expression analysis [25]
- Quantitative PCR and enzyme-linked immunosorbent assay (ELISA) correlations confirm the accuracy of RNAscope for detecting a dynamic range of expression levels [23]
These validation studies support RNAscope as a robust quantitative method that provides unique spatial information complementary to bulk analysis techniques.
Applications and Case Studies
Neuroscience Research
RNAscope has proven particularly valuable in neuroscience, where cellular heterogeneity complicates bulk analysis approaches. A comprehensive study of androgen and estrogen receptor mRNA expression in adult mouse hippocampus demonstrated several advantages:
- Co-localization Analysis: Revealed that AR and ZIP9 mRNA regularly co-localize in hippocampal neurons, while ZIP9 displayed a more homogeneous distribution and additional expression in astrocytes and microglia [26]
- Cell-Type Specific Expression: Identified that GPER1 mRNA is preferentially expressed in glutamatergic neurons, while ERα is specifically expressed in a subpopulation of GABAergic interneurons [26]
- Physiological Variations: Detected that ZIP9 mRNA expression varies during the estrous cycle, being significantly down-regulated when serum E2 is high [26]
This application highlights RNAscope's capability to resolve complex expression patterns in heterogeneous tissues with single-cell resolution.
Cancer Biomarker Development
In oncology, RNAscope has emerged as a powerful tool for biomarker validation and companion diagnostic development:
- Gastric/Gastroesophageal Junction Cancer: A validated DKK1 RNAscope assay identified patients with elevated tumoral DKK1 expression who showed better response to DKN-01 (anti-DKK1 antibody) plus pembrolizumab combination therapy [23]
- Biomarker Quantification: Development of a digital image analysis algorithm for DKK1 signal quantification demonstrated acceptable sensitivity, specificity, accuracy, and precision following CLIA guidelines [23]
- Clinical Trial Applications: The validated assay is being applied to prospectively identify G/GEJ adenocarcinoma patients for a phase 2 clinical trial (NCT04363801) [23]
This case study illustrates the translation of RNAscope technology from research applications to clinical diagnostics, highlighting its robustness and reliability.
Troubleshooting and Technical Considerations
Common Challenges and Solutions
Successful implementation of RNAscope requires attention to several technical considerations:
- Tissue Autofluorescence: Most prominent in the green fluorescent range; can be ameliorated by using tissue from younger animals or applying specialized background reduction techniques [22]
- Suboptimal Signal: May result from inadequate protease treatment, under-fixation, or RNA degradation; adjust pretreatment conditions incrementally while monitoring with control probes [24]
- High Background: Often caused by over-fixation, inadequate washing, or use of improper mounting media; ensure strict adherence to recommended protocols and reagents [24]
- Tissue Detachment: Prevent by using Superfrost Plus slides exclusively and ensuring proper fixation times [24]
Multiplex Experimental Design
For multiplex experiments detecting 2-3 targets simultaneously, strategic probe assignment is critical:
- Assign low-abundance transcripts of interest to Channel 1 (most sensitive)
- Assign moderately expressed genes to Channel 3
- Assign highly expressed markers (e.g., cell type-specific markers) to Channel 2 (lowest sensitivity) [22]
This strategic assignment ensures optimal detection of all targets while minimizing signal saturation and channel bleed-through.
The RNAscope platform represents a transformative technology in spatial genomics, enabling precise detection and quantification of individual RNA molecules within intact biological specimens. The fundamental principle of generating punctate dot signals corresponding to single transcripts provides an intuitive yet powerful approach for investigating gene expression with cellular resolution. Through its innovative double Z probe design and cascade amplification system, RNAscope achieves exceptional sensitivity and specificity that surpasses traditional ISH methods.
As demonstrated across diverse applications from neuroscience to clinical oncology, proper implementation of RNAscope—including optimized sample preparation, appropriate controls, and rigorous quantification—delers robust spatial gene expression data that complements other molecular profiling techniques. The continuing advancement of RNAscope methodologies, including integration with immunohistochemistry and development of increasingly sophisticated computational analysis tools, promises to further expand its utility in both basic research and clinical diagnostics.
For researchers investigating complex biological systems, drug development professionals validating therapeutic targets, or clinical scientists developing biomarker assays, mastery of RNAscope technology and interpretation of its characteristic punctate signals provides a critical capability for advancing understanding of gene expression in health and disease.
Implementing RNAscope: From Standard Workflow to Advanced Research Applications
The RNAscope in situ hybridization (ISH) assay represents a major advance in RNA detection within intact cells, offering unprecedented sensitivity and specificity for spatial genomic analysis. This technology is a powerful tool for researchers and drug development professionals requiring precise localization and quantification of gene expression in the context of tissue morphology and cellular organization. The core innovation of RNAscope lies in its proprietary double Z probe design, which enables single-molecule RNA visualization while effectively suppressing background noise from non-specific hybridization [2]. This design philosophy ensures that the assay can achieve reliable results even with partially degraded RNA samples, a common challenge in working with archival tissues [2].
The workflow can be completed within a single day and is compatible with both manual and automated staining platforms, including systems from Roche Tissue Diagnostics and Leica Biosystems [5]. Each detected RNA molecule appears as a distinct punctate dot under standard microscopy, enabling precise quantification either manually or through automated image analysis tools such as HALO software or Leica Biosystems' Aperio RNA ISH Algorithm [5]. This technical guide provides a comprehensive, step-by-step protocol for implementing the standard RNAscope assay, with detailed methodologies and critical factors for success.
Underlying Principles of RNAscope Technology
Probe Design Strategy
The exceptional performance of RNAscope technology stems from its innovative signal amplification strategy that fundamentally differs from traditional ISH methods. The system employs double Z target probes (approximately 20 pairs per target RNA) specifically designed to hybridize to the target RNA sequence [2]. This design is conceptually akin to fluorescence resonance energy transfer (FRET) principles, where two independent probes must hybridize in tandem to the target sequence for signal amplification to occur [2].
Each target Z probe consists of three structural elements:
- A lower 18-25 base region complementary to the target RNA
- A middle spacer sequence
- An upper 14-base tail sequence [2]
When two Z probes bind adjacent to each other on the target RNA, their tail sequences form a 28-base binding site for the pre-amplifier molecule. This requirement for dual hybridization makes it statistically improbable for non-specific binding to generate false-positive signals, as single Z probes binding to non-specific sites cannot form the complete binding site necessary for amplification [2].
Signal Amplification Mechanism
The RNAscope amplification system employs a cascade of sequential hybridization events that builds a detectable signal exclusively on properly bound probe pairs:
- Double Z target probes hybridize to the target RNA
- Pre-amplifiers hybridize to the 28-base binding site formed by each double Z probe pair
- Amplifiers bind to multiple sites on each pre-amplifier
- Labeled probes, containing fluorescent molecules or chromogenic enzymes, bind to numerous sites on each amplifier [2]
This multi-stage amplification creates a powerful signal from each original RNA molecule while maintaining exceptional specificity. The 20x20x20 probe design provides robustness against partial target RNA degradation, as only three double Z probes need to bind to detect a single RNA molecule [2].
Complete RNAscope Workflow
Sample Preparation
Proper sample preparation is foundational to assay success. For fresh frozen tissues, rapid collection and stabilization are critical. After dissection, tissues should be immediately snap-frozen in chilled 2-methylbutane (-30°C) for 25 seconds, then wrapped in aluminum foil and stored at -80°C to prevent RNA degradation [11]. For formalin-fixed, paraffin-embedded (FFPE) tissues, proper fixation in 4% formaldehyde followed by standard processing and embedding protocols is essential [27]. Plant tissues require vacuum infiltration with 4% formaldehyde containing Silwet-L77 to ensure proper fixative penetration [27].
Sectioning should produce thin sections (typically 5-10μm) mounted on charged slides such as Fisherbrand Superfrost Plus [11] [27]. Throughout preparation, maintain RNase-free conditions using decontaminants like RNase AWAY or diluted bleach [11]. For fixed tissues, protease digestion represents a critical optimization point—under-digestion causes reduced signal with ubiquitous background, while over-digestion compromises morphology and RNA integrity [28].
RNAscope Assay Procedure
The standard RNAscope procedure consists of four major phases, with precise temperature and humidity control being critical throughout [28]:
Pretreatment and Permeabilization: Fixed tissues undergo a series of pretreatments to unmask target RNA sequences and permeabilize cellular structures. This includes baking slides, deparaffinization with xylene (for FFPE), ethanol dehydration, and target retrieval followed by protease treatment [2] [28]. The proprietary RNAscope Pretreatment Kit ensures optimal RNA accessibility while preserving tissue morphology.
Probe Hybridization: Target-specific RNAscope probes hybridize to the RNA of interest in a HybEZ oven. This specialized hybridization system maintains consistent temperature and humidity, which are critical parameters for assay performance [28]. The hybridization typically occurs at 40°C for 2 hours, during which the double Z probes specifically bind to their target sequences.
Signal Amplification: This phase employs a series of sequential amplifications through hierarchical hybridization:
- AMP 1: Pre-amplifiers bind to the double Z probe pairs
- AMP 2-4: Amplifiers hybridize to build the signal amplification structure
- AMP 5-6: Label probes with chromogenic or fluorescent tags complete the system [27] Each amplification step is followed by stringent washes to remove unbound reagents.
Visualization and Counterstaining: For chromogenic detection, enzymes such as horseradish peroxidase or alkaline phosphatase generate permanent precipitates. Fast Red produces red fluorescent signals, while Brown chromogen yields dark deposits for bright-field microscopy [27]. Slides are then counterstained (with hematoxylin for chromogenic or DAPI for fluorescent detection) and mounted with appropriate media [11] [27].
Essential Research Reagents and Equipment
Table 1: Essential Research Reagents and Equipment for RNAscope Assay
| Item | Function/Purpose | Examples/Specifications |
|---|---|---|
| RNAscope Reagent Kit | Provides core reagents for hybridization, amplification, and detection | RNAscope Fluorescent Multiplex Kit [11] |
| Target Probes | Species-specific probes designed against target RNA | C1, C2, C3, C4 channel probes for multiplexing [28] |
| Control Probes | Assay validation and optimization | Positive control (housekeeping genes), negative control [28] |
| HybEZ Oven System | Maintains precise temperature and humidity during hybridization | Validated for consistent results [28] |
| Pretreatment Reagents | Unmask target RNA and permeabilize cells | RNAscope Pretreatment Kit, Protease Plus [2] [27] |
| Detection Reagents | Signal generation for visualization | Chromogenic (Fast Red, Brown) or fluorescent labels [27] |
| Mounting Media | Preserve samples for microscopy | Vectamount, Ecomount, EUKITT Neo [27] |
| Hydrophobic Barrier Pen | Create defined reaction areas on slides | ImmEdge Hydrophobic Barrier Pen [11] |
Critical Factors for Assay Success
Several technical factors are crucial for obtaining optimal RNAscope results. Temperature and humidity control throughout the hybridization and amplification steps is paramount, which is why ACD specifically recommends using the validated HybEZ oven system [28]. Protease digestion represents another critical optimization point that requires careful balancing—under-digestion results in reduced signal with high background, while over-digestion compromises tissue morphology and RNA integrity [28].
Experimental workflow integrity depends on several additional considerations:
- Reagent freshness: Always use fresh reagents, including alcohols and xylenes [28]
- Slide handling: Flick or tap slides to remove residual reagent, but never allow slides to dry completely during the procedure [28]
- Hydrophobic barrier: Ensure the barrier remains intact throughout the assay to prevent tissue drying [28]
- Protocol adherence: Do not alter the established protocol sequences or timing [28]
For multiplex assays where multiple RNA targets are detected simultaneously, proper channel assignment is essential. Each target probe must be in a different channel (C1, C2, C3, and/or C4), with at least one target probe in the C1 channel [28]. Channel C1 target probes are ready-to-use, while C2, C3, and C4 probes typically require dilution with a C1 probe or blank probe diluent [28].
Quantification and Data Analysis
RNAscope enables precise single-molecule quantification through enumeration of the characteristic punctate dots, with each dot representing an individual RNA molecule [5] [2]. This quantification can be performed manually for small studies or through automated image analysis for larger datasets.
Manual quantification involves counting signal dots in individual cells under a microscope, which is practical for analyzing limited regions of interest but becomes labor-intensive for whole tissue sections [11]. For larger scale studies, automated image analysis using specialized software dramatically improves throughput and reproducibility. The open-source software QuPath provides a powerful platform for automated cell detection and RNA dot quantification, particularly when combined with whole-slide scanning systems [11].
The quantification workflow typically includes:
- Image acquisition using slide scanning microscopes (e.g., Zeiss AxioScan)
- Cell segmentation to identify individual cells within tissue structures
- Signal thresholding established using negative controls to distinguish true signal from background
- Dot enumeration within each segmented cell
- Statistical analysis of expression patterns [11]
Establishing appropriate threshold criteria for defining positive cells is essential for reproducible quantification. This requires careful optimization and validation using both positive and negative control probes [11]. The protocol should explicitly document these thresholds to enable replication across studies.
Troubleshooting Common Issues
Even with careful execution, researchers may encounter technical challenges that affect RNAscope results:
- Low signal intensity: This may result from under-fixation, under-digestion with protease, RNA degradation, or deviation from optimal hybridization conditions. Ensure proper sample fixation and storage conditions, and verify protease concentration and incubation time [28].
- High background signal: Often caused by over-digestion with protease, incomplete washing, or non-specific probe binding. Optimize protease treatment duration and ensure thorough washing between steps [28].
- Poor tissue morphology: Typically results from over-digestion with protease or mechanical damage during section handling. Reduce protease incubation time and practice careful slide handling [28].
- Uneven staining: May occur due to uneven reagent coverage, slide drying, or inconsistent temperature across the slide. Ensure proper application of reagents and verify consistent oven temperature [28].
When troubleshooting, always include appropriate controls: positive control probes for housekeeping genes to verify assay performance, and negative control probes to establish background levels [28].
Advanced Applications and Recent Developments
The RNAscope platform continues to evolve with new capabilities that expand its research applications. Multiplexing approaches now enable simultaneous detection of 3-48 different RNA targets in the same cell, using a combination of C1, C2, C3, and C4 channels with different dye labels [28] [11]. This hiplexing capability is particularly valuable for characterizing complex cellular phenotypes and signaling pathways.
Recent developments include protease-free workflows that preserve protein epitopes for combined RNA-protein detection, enabling true spatial multiomics on a single tissue section [29]. This advancement facilitates concurrent detection of RNAscope signals with immunohistochemistry (IHC) or immunofluorescence (IF), particularly beneficial for visualizing proteins with protease-sensitive epitopes [29].
The technology has been successfully adapted for challenging sample types, including plant reproductive tissues, demonstrating its versatility across diverse research fields [27]. The standardized protocols enable consistent results across different laboratories, improving reproducibility in spatial genomics research [11].
The RNAscope assay provides an exceptionally powerful platform for spatial genomic analysis, combining single-molecule sensitivity with precise cellular localization. Its robust double Z probe design and cascading amplification system enable researchers to visualize and quantify RNA expression within morphological context, offering insights that complement bulk sequencing approaches. The standardized workflow outlined in this guide—from careful sample preparation through quantitative analysis—provides a reliable framework for implementing this technology across diverse research applications. As the field of spatial biology continues to advance, RNAscope remains at the forefront, with ongoing developments in multiplexing, quantification, and multiomic integration further expanding its research utility.
Proper sample preparation is the cornerstone of successful RNA in situ hybridization (ISH), especially for sensitive techniques like RNAscope that enable single-molecule RNA visualization with spatial context. The integrity of RNA within tissue specimens is highly dependent on fixation, embedding, and sectioning methods that preserve both morphological structure and nucleic acid integrity. For researchers utilizing RNAscope technology in principle research, adhering to standardized sample preparation protocols ensures the reliability and reproducibility of spatial genomic data, which is particularly crucial for drug development professionals evaluating therapeutic efficacy and safety profiles. This guide provides comprehensive, evidence-based protocols for optimal RNA preservation across various sample types.
Fundamental Principles of RNA Preservation
RNA integrity begins the moment tissue is harvested, with rapid stabilization being critical for accurate spatial analysis. The primary goal of sample preparation for RNAscope is to preserve tissue architecture while maintaining RNA in a state that remains accessible to target-specific probes. Key challenges include preventing RNase-mediated degradation, minimizing RNA loss during processing, and maintaining epitope accessibility while retaining spatial localization.
The unique double-Z probe design of RNAscope technology provides some advantage for degraded samples, as it requires only short target sequences (40-50 bases) for hybridization and can detect individual RNA molecules with as few as three probe pairs bound [2] [1]. However, optimal results require RNA preservation that maintains transcript integrity throughout processing.
Fixation Protocols
Formalin-Fixed Paraffin-Embedded (FFPE) Tissues
FFPE remains the gold standard for tissue preservation in pathological evaluation and is fully compatible with RNAscope technology.
Protocol:
- Fixation: Immediately immerse freshly harvested tissue in freshly prepared 4% paraformaldehyde (PFA) in 1X PBS [30]. For uniform fixation, tissue dimensions should not exceed 5-10mm in thickness.
- Fixation Duration: Fix for 24 hours at 4°C [30]. Under-fixation compromises morphology, while over-fixation (beyond 72 hours) creates excessive crosslinking that may reduce probe accessibility.
- Post-fixation Handling: After fixation, transfer tissue to 70% ethanol for storage or proceed directly to processing and embedding.
Table 1: Fixation Conditions for Optimal RNA Preservation
| Parameter | Recommended Condition | Rationale | Considerations |
|---|---|---|---|
| Fixative | 4% Paraformaldehyde (PFA) | Optimal cross-linking preserving morphology and RNA | Must be freshly prepared; avoid alkaline pH |
| Fixation Time | 24 hours at 4°C | Balanced cross-linking without excessive masking | Prolonged fixation reduces RNA accessibility |
| Tissue Size | 5-10mm thickness | Ensures complete penetrance of fixative | Larger tissues require longer fixation times |
| Temperature | 4°C | Slows RNase activity and autolysis | Room temperature accelerates degradation |
Fixed-Frozen Tissues
Fixed-frozen protocols offer a compromise between RNA preservation and morphological quality, particularly useful for labile targets.
Protocol:
- Perfusion (if applicable): For animal tissues, perfuse with freshly prepared 4% PFA in 1X PBS [31].
- Immersion Fixation: Dissect tissue and place in 4% PFA for 24 hours at 4°C using the same protocol as for FFPE [31] [30].
- Cryoprotection: Prior to freezing, immerse tissue in a graded sucrose series (10%, 20%, 30% in 1X PBS) at 4°C, allowing the tissue to sink to the bottom of the container at each concentration [31]. For mouse brain tissue, this typically requires approximately 18 hours per step.
- Freezing: Embed tissue in Optimal Cutting Temperature (OCT) compound and freeze using dry ice or liquid nitrogen [31]. Store at -80°C in an airtight container.
Special Considerations for Calcified Tissues
Decalcification of hard tissues like bone and teeth presents significant challenges for RNA preservation. A recent systematic evaluation identified optimal decalcification methods compatible with RNAscope.
Table 2: Efficacy of Decalcification Methods for RNA Preservation in Mouse Teeth
| Decalcification Method | Decalcification Time (Days) | Tissue Structure Preservation | RNA Integrity | Compatibility with RNAscope |
|---|---|---|---|---|
| ACD Decalcification Buffer | 14 | Good | High | Excellent |
| Morse's Solution | 7-10 | Good | High | Excellent |
| EDTA | 21-28 | Good | Moderate | Moderate |
| Plank-Rychlo Solution | 3-5 | Good | Low | Poor |
| 5% Formic Acid | 3-5 | Good | Low | Poor |
Protocol for Calcified Tissues:
- Fixation: Transcardially perfuse with ice-cold PBS followed by 4% PFA. Post-fix intact samples in 4% PFA for 3 days at 4°C [30].
- Decalcification: Use ACD decalcification buffer for 14 days or Morse's solution for 7-10 days, with daily solution changes [30].
- Verification: Confirm complete decalcification by assessing tissue elasticity.
- Processing: Proceed with standard FFPE processing or cryoprotection and freezing as described above.
Embedding and Sectioning
Paraffin Embedding
Protocol:
- Dehydration: Process fixed tissues through graded ethanol series (70%, 95%, 100%) to remove water.
- Clearing: Use xylene or xylene substitutes to remove alcohol.
- Infiltration: Immerse in molten paraffin wax at 56-58°C using multiple changes to ensure complete infiltration.
- Embedding: Orient tissue in embedding molds filled with fresh paraffin and allow to solidify.
Frozen Sectioning
Protocol:
- Equilibration: Equilibrate frozen tissue blocks at -20°C for at least 1 hour in a cryostat before sectioning [31].
- Sectioning: Cut sections at 7-15μm thickness [31]. For RNAscope, 5μm sections are standard for FFPE tissues [1].
- Mounting: Mount sections on SuperFrost Plus slides [31] [30]. Other slide types may result in tissue loss.
- Storage: Air-dry slides for 20 minutes at -20°C [31]. Store at -80°C for up to 3 months [31].
Pretreatment Optimization
Prior to RNAscope assay implementation, tissue sections require pretreatment to enable probe access. The following workflow outlines the standard pretreatment process for fixed-frozen tissues:
Pretreatment Reagents and Functions
Table 3: Essential Pretreatment Reagents for RNAscope
| Reagent | Function | Application Notes |
|---|---|---|
| RNAscope Hydrogen Peroxide | Blocks endogenous peroxidase activity | Critical for chromogenic detection; incubate 10min at RT [31] |
| RNAscope Target Retrieval | Reverses formalin-induced crosslinks | Use at 99-100°C for 5min; time varies by tissue [31] |
| RNAscope Protease Plus | Permeabilizes cell membranes; unmasks RNA targets | 30min at 40°C; concentration may require optimization [31] |
| Protease-Free Pretreatments | Alternative for protease-sensitive epitopes | Enables RNA-protein co-detection [29] |
Quality Control and Troubleshooting
Control Probes
Incorporate control probes in every RNAscope experiment to validate assay performance:
- Positive Control: Housekeeping genes (PPIB, POLR2A, or UBC) verify RNA integrity and assay procedure. Successful staining requires PPIB/POLR2A score ≥2 or UBC score ≥3 [8].
- Negative Control: Bacterial dapB gene confirms absence of background noise; score should be <1 [8].
RNA Quality Assessment
- Morphological Evaluation: Hematoxylin and eosin (H&E) staining confirms tissue structure preservation after decalcification and processing [30].
- RNA Integrity: Strong signal with positive control probes indicates well-preserved RNA. Weak or absent signal suggests degradation during sample preparation.
Troubleshooting Common Issues
- Weak or No Signal: Optimize protease treatment duration and concentration; verify fixation quality; check RNA integrity with positive controls.
- High Background: Reduce protease exposure; ensure proper washing between steps; verify hydrogen peroxide blocking.
- Tissue Detachment: Use SuperFrost Plus slides; ensure complete drying before staining; avoid excessive agitation during washes.
Advanced Applications
Multiplex Detection
RNAscope enables simultaneous detection of multiple RNA targets through specialized probe sets and detection systems [1]. Design probe pairs for each target following the double-Z principle to maintain high specificity.
RNA-Protein Co-detection
New protease-free workflows enable simultaneous detection of RNA and protein markers, particularly beneficial for protease-sensitive protein epitopes [29]. This approach provides comprehensive molecular profiling within morphological context.
Optimal sample preparation for RNAscope requires meticulous attention to fixation, processing, and pretreatment conditions tailored to specific tissue types. The standardized protocols outlined in this guide provide a foundation for reliable RNA preservation and detection, enabling researchers to obtain spatially resolved gene expression data with single-molecule sensitivity. As RNAscope continues to evolve with new applications in drug development and biomarker discovery, adherence to these guidelines will ensure the generation of high-quality, reproducible spatial genomic data essential for advancing principle research in molecular pathology and therapeutic development.
RNAscope technology represents a groundbreaking in situ hybridization (ISH) platform that enables the detection of target RNA within intact cells, preserving precious morphological context. The core principle hinges on a proprietary double Z probe design that amplifies target-specific signals while suppressing background noise, achieving single-molecule sensitivity [2]. This foundational technology has rapidly evolved, giving rise to advanced assays that push the boundaries of spatial biology. These newer versions, including miRNAscope and RNAscope Plus, facilitate the highly multiplexed detection of diverse biomolecules—including small RNAs and proteins—within a single tissue section. This technical guide details these advanced assays, framing them within broader research principles to illustrate how they empower scientists and drug development professionals to conduct sophisticated multi-omic spatial analyses.
Core Technology: The Foundational RNAscope Principle
All advanced assay versions are built upon the robust and sensitive foundation of the original RNAscope technology. Understanding this core is essential for appreciating the enhancements in the newer systems.
The Double Z Probe Design and Signal Amplification
The revolutionary aspect of RNAscope is its double Z probe design, which is critical for its exceptional signal-to-noise ratio. The system is engineered such that signal amplification only occurs when two independent probes bind adjacent to each other on the target RNA [2]. This drastically reduces non-specific background, as it is statistically improbable for two independent probes to bind non-specifically in the correct tandem orientation.
The process can be broken down into a series of sequential hybridization events:
- Target Hybridization: Pairs of target probes (double Z probes) hybridize to the RNA molecule of interest. Each probe pair is designed to bind contiguously over a ~50-base region [2] [1].
- Preamplifier Binding: The two "tail" sequences from a bound probe pair form a 28-base binding site for a preamplifier molecule. This step is exclusive to correctly bound probe pairs [2].
- Signal Amplification: Each preamplifier contains multiple binding sites for amplifiers. In turn, each amplifier possesses numerous sites for label probes, which are conjugated with fluorescent molecules or chromogenic enzymes [2]. This cascade can theoretically generate up to 8000 labels for a single RNA molecule [1].
The following diagram illustrates this proprietary signal amplification workflow:
Assay Workflow and Single-Molecule Quantification
The standard RNAscope assay workflow is streamlined for routine use in a laboratory setting, mirroring familiar protocols like immunohistochemistry [1].
The key steps are:
- Permeabilization: Tissue sections are fixed and pretreated to unmask target RNA and permeabilize cells [2].
- Hybridization: Target-specific probes are hybridized to the RNA [2].
- Amplification: A series of hybridization steps with amplifiers and label probes exponentially increases the signal [2].
- Visualization & Quantification: Signals are visualized as punctate dots, where each dot represents a single RNA molecule. These can be quantified manually or with automated image analysis software [2] [6].
A critical principle for data interpretation is that the number of dots correlates directly with the number of RNA transcripts, not the signal intensity, which can vary based on the number of probe pairs bound to each molecule [6] [8].
Advanced Assay Versions for Complex Research Questions
Building on the core technology, Advanced Cell Diagnostics has developed specialized assays to address more complex research needs, particularly the demand for multi-omic spatial analysis.
RNAscope Plus smRNA-RNA Assay
The RNAscope Plus smRNA-RNA Assay is a significant innovation designed to unlock the study of small regulatory RNAs and their functional effects. It combines the proprietary RNAscope and miRNAscope technologies to simultaneously detect one small RNA (e.g., miRNA, siRNA, ASO) and up to three mRNA targets [32].
- Key Applications: This assay is particularly valuable for optimizing oligonucleotide therapies. It allows researchers to:
- Probe Design and Plexing: The assay uses four distinct probe channels: the S1 channel is dedicated to the small RNA (17-50 nt in length), while the C2, C3, and C4 channels are used for mRNA targets [32].
- Enhanced Detection: The system combines ACD's patented signal amplification with Tyramide Signal Amplification (TSA) technology to achieve the sensitivity required for detecting low-abundance small RNAs [32].
RNAscope Multiomic LS Fluorescent Assay
For researchers seeking the highest level of multiplexing that integrates different classes of biomolecules, the RNAscope Multiomic LS Fluorescent Assay is the premier tool. It enables highly sensitive and specific co-detection of up to six RNA and/or protein targets on a single tissue section, enabling true spatial multiomics [34].
- Protease-Free Flexibility: A key feature is its protease-free workflow option, which preserves protein antigen integrity. This allows for wide antibody compatibility and maintains superior tissue morphology. Researchers can choose from different workflows:
- RNA ISH Detection: For detecting up to 6 RNA targets.
- Sequential Multiomic Workflow: Perform RNAscope detection first, followed by standard IHC/IF with the user's own antibodies.
- Full Multiomic Workflow: Utilize pre-qualified RNAscope primary and secondary antibodies for a fully integrated, high-plex assay [34].
- Unified Detection Chemistry: Both RNA and protein targets are detected using the same core RNAscope amplification principle. For proteins, antibodies are conjugated to oligonucleotides that serve as the starting point for building the channel-specific amplification tree, followed by sequential fluorescent TSA detection [34].
Quantitative Comparison of Advanced RNAscope Assays
The table below provides a structured comparison of the key technical specifications and capabilities of the advanced RNAscope assays, highlighting their distinct roles in spatial genomics.
Table 1: Technical Comparison of Advanced RNAscope Assay Platforms
| Feature | Core RNAscope Assay | RNAscope Plus smRNA-RNA Assay | RNAscope Multiomic LS Assay |
|---|---|---|---|
| Maximum Plexy | 1-4 RNA targets [1] | 1 smRNA + 3 mRNA targets [32] | Up to 6 total RNA and/or protein targets [34] |
| Target Types | mRNA, long non-coding RNA | miRNA, siRNA, ASOs, mRNA [32] | mRNA, non-coding RNA, proteins [34] |
| Key Innovation | Double Z probe design for single-molecule RNA detection [2] | Co-detection of small RNAs and mRNAs [32] | Fully integrated, protease-free RNA and protein detection [34] |
| Signal Detection | Chromogenic or fluorescent [2] | Fluorescent (TSA-based) [32] | Fluorescent (sequential TSA) [34] |
| Primary Application | Single or multiplex RNA expression analysis | Oligonucleotide therapy development and validation [32] | Comprehensive cellular phenotyping and functional analysis [34] |
Experimental Protocols for Multi-Omic Analysis
Implementing these advanced assays requires careful planning and execution. The following protocols outline the key methodologies for the RNAscope Multiomic LS and RNAscope Plus assays.
Protocol 1: RNAscope Multiomic LS Workflow for 6-Plex Detection
This protocol is designed for an automated workflow on the Leica BOND RX system, providing a high-throughput solution for complex multi-omic studies [34].
- Step 1: Sample Preparation and Pretreatment. Begin with FFPE tissue sections mounted on slides. Deparaffinize and rehydrate the samples. Perform target retrieval using a citrate-based buffer (e.g., RNAscope Target Retrieval Reagents) at a controlled boiling temperature, followed by a protease-free pretreatment (e.g., Pretreat Pro/AMP Pro) to permeabilize the tissue without damaging protein antigens [34] [8].
- Step 2: Probe Hybridization and Channel Assignment. Design your assay by assigning targets to the six available channels (C1-C6). For a full multiomic experiment, this may include:
- C1-C2: User-provided primary antibodies (e.g., rabbit anti-CD4, mouse anti-CD8) detected with RNAscope anti-species secondary antibodies.
- C3-C6: A combination of pre-conjugated RNAscope primary antibodies (e.g., anti-FoxP3-C6) and RNAscope probes for RNA targets (e.g., IFNG-C3, GZMB-C4) [34]. Pool the assigned probes and/or antibodies and hybridize them to the sample.
- Step 3: Sequential Signal Amplification and Detection. The signal for each channel is developed sequentially. The process is repeated for each of the six channels [34]:
- Build the amplification tree for the specific channel using channel-specific preamplifiers and amplifiers.
- Add HRP-conjugated label probes.
- Apply a tyramide-conjugated fluorophore (e.g., Opal 520, Opal 570, Opal 690) for signal deposition.
- Inactivate the HRP enzyme before moving to the next channel to prevent cross-talk.
- Step 4: Counterstaining and Imaging. After all channels are developed, counterstain nuclei with DAPI. Apply an anti-fade mounting medium and image the slide using a fluorescent microscope equipped with multispectral imaging capabilities (e.g., Vectra or Mantra systems) to resolve all six signals [34].
The integrated workflow for the RNAscope Multiomic LS Assay, which allows for the simultaneous detection of RNA and protein targets, is visualized below:
Protocol 2: RNAscope Plus for Small RNA and mRNA Co-Detection
This protocol focuses on the specific requirements for detecting labile small RNAs alongside messenger RNAs.
- Step 1: Tissue Preparation and Fixation. Use optimally fixed FFPE or fresh frozen (FF) tissue sections. For FFPE, ensure fixation was performed with 10% neutral buffered formalin for 6-72 hours to adequately preserve the small RNA molecules [32] [8].
- Step 2: Probe Selection and Hybridization. Select the appropriate RNAscope Plus probes: one in the S1 channel for your small RNA target (e.g., miR-205) and up to three additional probes in the C2, C3, and/or C4 channels for your mRNA targets (e.g., PTEN, TP53). Hybridize the probe mix to the pretreated tissue [32] [33].
- Step 3: TSA-Based Fluorescent Detection. The detection leverages the standard RNAscope amplification cascade but is coupled with TSA for enhanced sensitivity. Use the recommended fluorophores for each channel, such as:
- S1 (smRNA): Opal 690 or TSA Vivid 650
- C2 (mRNA): Opal 520 or TSA Vivid 520
- C3 (mRNA): Opal 570 or TSA Vivid 570
- C4 (mRNA): Opal 780 [32].
- Step 4: Analysis and Validation. Analyze the slides using a fluorescent microscope. Correlate the expression and localization of the small RNA with the expression of its predicted target mRNAs and with cell type-specific markers to draw functional conclusions about its role and the efficacy of a therapeutic [33].
The Scientist's Toolkit: Essential Reagents for Multi-Omic Experiments
Success with advanced RNAscope assays depends on using the correct, validated reagents. The following table catalogs the essential components required for setting up these sophisticated experiments.
Table 2: Essential Research Reagents for RNAscope Multi-Omic Experiments
| Reagent Category | Specific Examples | Function & Application Notes |
|---|---|---|
| Core Assay Kits | RNAscope Multiomic CORE & C1-C6 Channel Kit [34] | Provides the fundamental reagents for the 6-plex assay workflow. |
| RNAscope Plus smRNA-RNA HD Reagents Kit [32] | Contains reagents specific for the small RNA co-detection assay. | |
| Control Probes | Species-specific Positive Control Probes (e.g., Hs-PPIB, Mm-UBC) [8] | Verifies RNA integrity and assay performance. A score of ≥2 is recommended. |
| Negative Control Probe (dapB) [6] [8] | Assesses non-specific background; a score of <1 is acceptable. | |
| Detection Fluorophores | TSA Vivid Fluorophores (520, 570, 650) [32] [34] | Tyramide-based fluorophores for high-sensitivity signal detection. |
| Opal Dyes (480, 520, 570, 620, 690, 780) [34] | A broader palette of fluorophores from Akoya for higher plex experiments. | |
| Primary Antibodies | RNAscope Anti-Hs CD8-C4 [34] | Pre-conjugated antibody for protein detection in a specific channel. |
| RNAscope Anti-Ms NeuN-C3 [34] | Pre-conjugated antibody for neuronal nuclei marker in mouse. | |
| Secondary Reagents | RNAscope anti-rabbit-C1 [34] | Enables use of user-provided rabbit primary antibodies in the C1 channel. |
| Specialized Equipment | HybEZ Hybridization System [32] | Oven system providing precise temperature control for hybridization steps. |
| Automated Platform (Leica BOND RX) [34] | Enables full automation of the Multiomic LS assay for high throughput. |
The evolution of RNAscope from a core RNA detection platform into a suite of advanced multi-omic assays represents a paradigm shift in spatial biology. Technologies like RNAscope Plus and the RNAscope Multiomic LS Assay provide researchers with an unprecedented ability to visualize complex interactions between different classes of biomolecules—including small regulatory RNAs, mRNAs, and proteins—all within the native tissue architecture. The continued refinement of these platforms, emphasizing higher plex, ease of use, and compatibility with automated systems, promises to further accelerate discovery and therapeutic development. By enabling precise, cell-by-cell dissection of disease mechanisms and drug effects, these advanced versions of RNAscope solidify the technology's role as an indispensable tool for modern biomedical research.
RNAscope in situ hybridization (ISH) technology represents a groundbreaking platform for visualizing gene expression within the spatial and morphological context of tissue. This technology provides unparalleled sensitivity and specificity in RNA detection, enabling researchers to visualize individual RNA molecules as distinct punctate dots under standard bright-field or fluorescent microscopy [5] [1]. The core innovation of RNAscope lies in its unique "double-Z" probe design strategy, which allows simultaneous signal amplification and background suppression to achieve single-molecule visualization while preserving tissue morphology [1]. Each dot signal corresponds to a single RNA transcript, facilitating precise quantification of gene expression at the cellular level [3].
The ability to quantitatively analyze these signals has become increasingly important in both basic research and drug development, particularly with the growing emphasis on spatial biology in understanding disease mechanisms and treatment responses. Quantitative image analysis of RNAscope data can be performed through two primary approaches: manual counting by a trained pathologist or researcher, and automated digital image analysis using platforms such as HALO from Indica Labs [5] [35]. The selection between these methods depends on various factors including throughput requirements, sample complexity, required precision, and available resources. This technical guide examines both methodologies within the context of RNAscope-based research, providing detailed protocols, comparative analysis, and implementation guidelines for researchers and drug development professionals.
RNAscope Technology Principle and Workflow
Core Technology Principle
The foundational principle of RNAscope technology centers on its proprietary probe design and signal amplification system. The "double-Z" probe architecture employs pairs of target probes that hybridize contiguously to the target RNA molecule [1]. Each target probe contains an 18-25 base region complementary to the target RNA, a spacer sequence, and a 14-base tail sequence. When both probes in a pair hybridize adjacently to their target sequences (covering approximately 50 bases), their tail sequences form a combined 28-base hybridization site for a preamplifier molecule [8] [1].
This pairing requirement provides exceptional specificity, as it is statistically unlikely that two different probes would bind adjacent non-specific sequences. The system typically employs 20 separate pairs of probes specific to the target, providing redundancy that ensures detection even for partially degraded or incompletely unmasked RNA targets [8]. Following successful hybridization, a multi-stage amplification process generates a highly amplified, readily detectable signal. The preamplifier provides binding sites for amplifier molecules, which in turn contain multiple binding sites for enzyme-linked or fluorescently-labeled probes [1]. This cascade can theoretically yield up to 8,000 labels for each target RNA molecule, enabling single-molecule detection [1].
Figure 1: RNAscope Principle of the "Double-Z" Probe Design and Signal Amplification System
Assay Workflow
The RNAscope assay workflow can be performed manually or on automated staining platforms and typically completes within a single day [5]. The process begins with sample preparation, which varies depending on sample type. RNAscope assays are compatible with formalin-fixed paraffin-embedded (FFPE) tissue, cultured cells, fresh-frozen tissue, and fixed-frozen tissue [8]. For FFPE tissues, sections are deparaffinized, rehydrated, and subjected to heat-induced epitope retrieval in citrate buffer [1].
Sample pretreatment is critical for successful staining and includes three main objectives: permeabilizing the cell membrane, partially reversing nucleic acid-protein crosslinking that occurs during fixation, and blocking endogenous peroxidase activity when necessary [8]. Proprietary pretreatment reagents include RNAscope Target Retrieval buffer, Hydrogen Peroxide reagent, and various protease formulations (Protease Plus, Protease III, or Protease IV) optimized for different sample types [8].
Following pretreatment, samples undergo probe hybridization, where target-specific probes hybridize to the RNA of interest. For multiplex assays, probes are pooled prior to this hybridization step [8]. Subsequent signal amplification steps include hybridization with preamplifier, amplifier, and label probes, with washing steps between each hybridization [1]. Finally, detection is accomplished through chromogenic precipitation or fluorescent imaging, followed by counterstaining and mounting for microscopy [1].
Quantitative Analysis Methods for RNAscope Data
Manual Counting and Semi-Quantitative Scoring
Manual analysis of RNAscope data involves direct visualization and scoring by a trained researcher or pathologist using conventional microscopy. The fundamental principle of manual quantification is that each punctate dot represents a single RNA molecule, and the number of dots per cell correlates directly with gene expression level [3]. The semi-quantitative histological scoring methodology follows established guidelines that categorize expression levels based on dot counts per cell [3].
The standard scoring system for RNAscope assays uses the following criteria:
- Score 0: No staining or fewer than 1 dot per every 10 cells (on average)
- Score 1: 1-3 dots per cell (on average)
- Score 2: 4-9 dots per cell (on average), with few dot clusters
- Score 3: 10-15 dots per cell (on average), with less than 10% of positive cells having dot clusters
- Score 4: >15 dots per cell (on average), with less than 10% of positive cells having dot clusters [3]
For heterogeneous expression patterns, researchers may employ an H-score (histo score) calculation, which incorporates both the intensity and distribution of expression. The H-score ranges from 0 to 400 and is calculated as follows: H-score = Σ (ACD score or bin number × percentage of cells per bin) [3]. This approach provides a more nuanced quantification for samples with variable expression across cells.
Proper controls are essential for accurate interpretation. The housekeeping gene PPIB (Cyclophilin B) is frequently used as a positive control, while the bacterial dapB gene serves as a negative control. Successful staining is indicated by a PPIB score ≥2, while the negative control (dapB) should score <1 [8].
Automated Analysis with HALO Platform
HALO from Indica Labs is a quantitative digital pathology image analysis platform specifically designed for various tissue analysis applications, including RNAscope assay quantification [35]. The platform offers purpose-built modules for different RNAscope applications, including the ISH module for brightfield analysis, FISH module for fluorescent assays, and ISH-IHC module for co-detection studies [36].
The HALO platform provides several advantages for RNAscope analysis, including high-throughput processing, elimination of observer bias, and the ability to extract rich data on cellular and subcellular localization [35] [36]. The software can quantify expression on a cell-by-cell basis across entire tissue sections while maintaining an interactive link between cell data and image location [35]. This enables researchers to sort and filter cell data while visually assessing cell populations in the context of tissue architecture [35].
Key features of HALO for RNAscope analysis include:
- Quantitative RNAscope spot counting with single-cell resolution
- Single-plex and multiplex ISH quantification in both brightfield and fluorescence
- Automatic generation of H-scores and expression histograms
- Spatial analysis including proximity, nearest neighbor, and infiltration analysis
- Cell-by-cell expression profiles across whole slide images
- Tissue segmentation to distinguish different tissue types or regions [36]
The platform employs pre-trained deep-learning networks for optimized nuclear and membrane segmentation in both brightfield and fluorescence, and allows users to train custom classifiers using HALO AI [35]. Analysis parameters can be optimized using real-time tuning features that provide live feedback on segmentation and classification results [35].
Comparison of Manual and Automated Approaches
Table 1: Comparison of Manual Counting and HALO Automated Analysis for RNAscope
| Parameter | Manual Counting | HALO Automated Analysis |
|---|---|---|
| Throughput | Low to moderate (limited by human evaluation speed) | High (batch processing of entire slides) [35] |
| Objectivity | Subject to observer bias and fatigue | Highly reproducible and objective [35] |
| Data Output | Basic scoring (0-4) or limited H-score | Comprehensive cell-by-cell data, spatial relationships, multiple output formats [35] [36] |
| Complex Analysis Capability | Limited for complex patterns or multiplex data | Advanced analysis of multiplex targets, cell typing, spatial relationships [36] |
| Implementation Cost | Lower initial cost (microscope required) | Higher initial investment (software license) [35] |
| Training Required | Pathology/tissue recognition expertise | Software operation training (minimal with intuitive interface) [35] |
| Multiplex Data Analysis | Challenging beyond 2-3 targets | Robust analysis of unlimited targets in fluorescence [36] |
| Spatial Analysis | Qualitative assessment only | Quantitative spatial analysis (proximity, infiltration, density heat maps) [36] |
Experimental Protocols for RNAscope Image Analysis
Sample Preparation and Assay Optimization
Proper sample preparation is critical for successful RNAscope analysis and subsequent quantification. For FFPE tissues, sections should be cut at 4-5μm thickness and mounted on positively charged slides [8]. Tissue fixation should follow standard protocols using 10% neutral buffered formalin for 6-72 hours at room temperature [1]. Deviation from recommended fixation protocols may require pretreatment optimization.
The pretreatment optimization process involves adjusting three main parameters:
- Target Retrieval: Using citrate buffer at boiling temperature (100-103°C) for 15 minutes to partially reverse cross-linking from tissue fixation [1]
- Hydrogen Peroxide Treatment: To block endogenous peroxidase activity (10 minutes at room temperature) [8]
- Protease Digestion: Using Protease Plus, III, or IV (typically 10-30 minutes at 40°C) to permeabilize cell membranes and unmask RNA targets [8]
Optimal protease concentration and incubation time should be determined empirically for each tissue type and fixation condition. Under-treatment results in poor probe accessibility, while over-treatment can damage tissue morphology and reduce RNA integrity [8].
Control experiments are essential for validating assay conditions. Recommended controls include:
- Positive control: Housekeeping genes (PPIB, POLR2A, or UBC) to verify RNA quality and assay procedure [8]
- Negative control: Bacterial dapB gene to assess background and nonspecific signal [8]
- No probe control: To identify autofluorescence or endogenous enzyme activity
Successful staining is indicated by a positive control score ≥2 for PPIB/POLR2A or ≥3 for UBC, with negative control score <1 [8].
Image Acquisition Guidelines
For both manual and automated analysis, consistent image acquisition is essential for reliable quantification. The following guidelines apply:
Brightfield Microscopy:
- Use 20x-40x objective magnification for counting
- Ensure even illumination across the entire field
- Maintain consistent camera settings (exposure, white balance) across samples
- Capture multiple representative fields or entire sections for whole-slide analysis
Fluorescent Microscopy:
- Use appropriate filter sets for each fluorophore with minimal spectral overlap
- Optimize exposure times to avoid saturation while maximizing dynamic range
- Maintain consistent imaging parameters across all samples in a study
- For multiplex analysis, acquire sequential images with different filter sets
For automated analysis with HALO, the platform supports all major whole-slide image formats, including Aperio (SVS), Hamamatsu (NDPI), Leica (SCN), and Zeiss (CZI), among others [35]. When using HALO for analysis, it is recommended to use the same microscope and settings for all samples within an experiment to minimize technical variability.
HALO Software Analysis Protocol
The workflow for analyzing RNAscope data using HALO involves sequential steps:
Image Import and Quality Control: Import whole-slide images into HALO and assess image quality using SlideQC or similar tools [35]
Tissue Segmentation: Define regions of interest and exclude areas with folding, tears, or artifacts. The Tissue Classifier module can automatically distinguish different tissue types [35]
Nuclear Segmentation: Identify individual cells using the nuclear counterstain (DAPI for fluorescence, hematoxylin for brightfield). HALO employs pre-trained AI networks for optimal segmentation [35]
Punctate Dot Detection: Configure detection parameters for dot size, intensity threshold, and shape characteristics. The real-time tuning feature provides immediate feedback on detection accuracy [35]
Cellular Phenotyping (for multiplex assays): Define cell types based on marker expression using the intuitive phenotype editor with channel combination grids [35]
Spatial Analysis (optional): Apply Spatial Analysis module for proximity analysis, nearest neighbor analysis, infiltration analysis, or density heat maps [36]
Data Export: Export cell-by-cell data, summary statistics, or images for further analysis. HALO supports multiple export formats including spreadsheet, FCS, and image formats [35]
Table 2: HALO Modules for RNAscope Analysis and Their Applications
| HALO Module | Application | Key Outputs |
|---|---|---|
| ISH Module | Brightfield RNAscope assays | Spot counts per cell, H-scores, cellular localization [36] |
| FISH Module | Fluorescent RNAscope assays | Multiplex spot quantification, co-expression analysis [36] |
| FISH-IF Module | Combined RNA-FISH and immunofluorescence | Simultaneous RNA and protein quantification [35] |
| Multiplex IHC | Up to 5 brightfield biomarkers | Cell phenotyping with RNA expression [35] |
| Highplex FL | Unlimited fluorescent biomarkers | Comprehensive cellular profiling with RNA data [35] |
| Spatial Analysis | Spatial relationships between cells | Proximity, infiltration, neighborhood analysis [36] |
| Tissue Classifier | Define tissue regions for analysis | Region-specific RNA expression data [35] |
Advanced Applications and Analysis Scenarios
Analysis of Complex Expression Patterns
RNAscope analysis frequently encounters complex biological scenarios requiring specialized analytical approaches:
Heterogeneous Target Expression: When a target shows variable expression across cells of the same type, comprehensive analysis should include both the overall expression level (average dots per cell) and the distribution of expression across the cell population [3]. HALO facilitates this analysis by automatically binning cells according to expression levels and generating histograms of expression distribution [3].
Subpopulation or Region-Specific Expression: For targets expressed in specific cell subpopulations or tissue regions, analysis should focus on the relevant cells or areas [3]. HALO's annotation tools and tissue classifier enable selective analysis of defined regions, with results expressed as percentage positive cells or region-specific H-scores [35].
Target Co-expression: When analyzing co-expression of multiple targets in the same cells, particularly in duplex or multiplex assays, the percentage of dual-positive or multi-positive cells should be calculated [3]. HALO's phenotype editor allows precise definition of co-expression criteria and quantification of these populations [35].
Rare Cell Expression: For targets expressed in rare cell populations, identification of positive cells is more critical than average expression level [3]. Automated analysis significantly enhances detection efficiency in these scenarios by rapidly scanning entire tissue sections.
Spatial Analysis of RNAscope Data
The spatial context of gene expression provides crucial biological insights, particularly in understanding cellular microenvironments and interactions. HALO's Spatial Analysis module enables several advanced spatial analyses:
- Density Heat Maps: Visualize and quantify gradients of expression across tissue regions [36]
- Proximity Analysis: Measure distances between different cell types or between expressing and non-expressing cells [36]
- Tumor Infiltration Analysis: Quantify immune cell infiltration into tumor regions [36]
- Nearest Neighbor Analysis: Characterize cellular organization and clustering patterns [35]
These spatial metrics provide valuable insights into tissue organization, cell-cell communication, and microenvironmental influences on gene expression.
Figure 2: HALO Software Workflow for RNAscope Image Analysis
Table 3: Essential Research Reagents and Resources for RNAscope Analysis
| Item | Function | Examples/Specifications |
|---|---|---|
| RNAscope Assay Kits | Core reagents for RNA detection | 2.5 HD BROWN/RED, LS Multiplex, VS Assays [36] |
| Control Probes | Assay validation and optimization | PPIB (positive control), dapB (negative control) [8] |
| Pretreatment Reagents | Sample preparation for optimal hybridization | Target Retrieval, Hydrogen Peroxide, Protease Plus/III/IV [8] |
| Automation Platforms | High-throughput and consistent processing | Roche Discovery Ultra, Leica BOND RX [5] |
| Image Analysis Software | Quantitative data extraction | HALO platform with ISH, FISH, or FISH-IF modules [36] |
| Positive Control Tissues | Process validation | Tissues with known expression of target genes [8] |
| Multiplex Detection Kits | Simultaneous detection of multiple targets | RNAscope Multiplex Fluorescent Kit [3] |
| Co-detection Kits | RNA and protein simultaneous detection | RNA-Protein Co-detection Ancillary Kit [36] |
Quantitative image analysis of RNAscope data represents a powerful approach for investigating gene expression within its morphological context. Both manual counting and automated platforms like HALO offer distinct advantages suited to different research scenarios. Manual analysis provides an accessible entry point for laboratories with limited sample volumes, while HALO automated analysis delivers higher throughput, greater objectivity, and more sophisticated analytical capabilities for complex experimental designs.
The selection between these approaches should consider specific research objectives, sample characteristics, and available resources. For drug development applications requiring high reproducibility, multiplex analysis, or spatial characterization, automated platforms provide significant advantages. As spatial biology continues to advance, integrating RNAscope technology with sophisticated image analysis platforms will undoubtedly yield deeper insights into gene expression patterns and their functional implications in health and disease.
Researchers implementing these methodologies should prioritize appropriate experimental design, including proper controls, optimized sample preparation, and validation of analytical parameters. With careful attention to these technical considerations, quantitative RNAscope analysis can provide robust, publication-quality data that advances our understanding of gene expression in situ.
Core Technology: The RNAscope Principle
RNAscope is a novel in situ hybridization (ISH) platform that represents a major advance in spatial genomics. Its core innovation is a proprietary double Z probe design that enables single-molecule RNA detection within the intact morphological context of tissue samples. This technology allows researchers to visualize gene expression with unparalleled sensitivity and specificity, making it an indispensable tool for advanced research and diagnostic applications [2] [1].
The fundamental principle involves a unique signal amplification system that specifically amplifies target-derived signals while suppressing background noise from non-specific hybridization. Each target RNA molecule is targeted by approximately 20 pairs of "Z" probes. These probe pairs hybridize contiguously to the target RNA, and only when both probes in a pair bind adjacently do they create a binding site for the pre-amplifier molecule. This requirement ensures exceptional specificity, as it is statistically improbable for two independent probes to bind nonspecifically at adjacent sites [2]. The subsequent hybridization cascade ultimately allows for the binding of multiple label probes, generating a strong, detectable signal where each punctate dot represents a single RNA molecule [2] [8].
Table 1: Advantages of RNAscope Double Z Probe Design
| Feature | Technical Advantage | Application Benefit |
|---|---|---|
| Double Z Probe Design | Requires two independent probes to bind adjacent target sites for amplification | Eliminates background noise from non-specific hybridization [2] |
| 20 Probe Pairs per Target | Provides redundancy against partial target degradation or inaccessible regions | Enables reliable detection in suboptimal FFPE samples [2] [1] |
| Short Target Region (∼50 bases) | Requires only 36-50 combined bases for probe pair hybridization | Compatible with partially degraded RNA from clinical archives [2] [8] |
| Hybridization-based Amplification | Theoretical amplification of up to 8000 labels per target RNA molecule | Enables single-molecule detection sensitivity without PCR [1] |
Application 1: Biomarker Validation
RNAscope technology has revolutionized biomarker validation by enabling precise spatial quantification of RNA biomarkers within intact tissue architecture, providing critical information that grind-and-bind methods like RT-PCR cannot offer [1].
Experimental Protocol for Biomarker Validation
For comprehensive biomarker validation studies using RNAscope, follow this detailed methodology:
- Sample Preparation: Use formalin-fixed, paraffin-embedded (FFPE) tissue sections cut at 4-5 μm thickness. Adhere to standard fixation protocols (10% neutral buffered formalin for 6-72 hours) [1].
- Pretreatment Optimization:
- Deparaffinize slides in xylene and dehydrate through ethanol series
- Perform heat-induced epitope retrieval in citrate buffer (10 mM, pH 6) at 100-103°C for 15 minutes
- Digest with protease (10 μg/mL) at 40°C for 30 minutes [1]
- Hybridization:
- Signal Amplification:
- Sequential hybridization with pre-amplifier (30 minutes), amplifier (15 minutes), and label probes (15 minutes) at 40°C
- Wash between steps with wash buffer [1]
- Detection:
Data Analysis Methods for Different Expression Scenarios
Table 2: RNAscope Data Analysis Guidelines for Biomarker Validation
| Expression Scenario | Analysis Method | Quantification Approach | Application Example |
|---|---|---|---|
| Homogeneous Expression | Methodology #1: Semi-quantitative histological scoring | Average dots per cell across cell population [3] | MICA/MICB expression in ovarian cancer [3] |
| Heterogeneous Expression | Methodology #3: H-score calculation | H-score = Σ(ACD score × % cells per bin); range 0-400 [3] | AFAP1-AS1 in lung cancer foci; PD-L1 heterogeneity [3] |
| Subpopulation-specific | Region-specific analysis | Percentage positive cells (cells with ≥1 dot/cell) in specific regions [3] | Vglut1/Vglut2 in specific neuronal populations [3] |
| Multiple Cell Types | Independent cell type analysis | Analyze each cell type separately using scoring or H-score [3] | Ctnnb1 in smooth muscle, epithelium, and inflammatory cells [3] |
Case Study: HER2 Biomarker Validation in Breast Cancer A comprehensive study applied RNAscope to quantify HER2 mRNA in 132 invasive breast carcinomas. The technology demonstrated 97.3% concordance with FISH in unequivocal cases and proved superior in cases with intratumoral heterogeneity or equivocal FISH results. This application highlights RNAscope's potential as a reflex test for resolving challenging HER2 status determinations in clinical practice [37].
Application 2: Cell and Gene Therapy
RNAscope provides critical analytical capabilities throughout the cell and gene therapy development pipeline, from target validation to efficacy assessment and safety monitoring.
Experimental Protocol for Cell and Gene Therapy Applications
Therapy-Modified Cell Tracking:
Therapeutic Efficacy Assessment:
- Analyze changes in endogenous gene expression patterns in response to therapy
- Correlate therapeutic transgene expression with pathological improvements
- Employ quantitative image analysis with HALO software or similar platforms [38]
Biodistribution Studies:
- Map therapeutic transgene expression across multiple tissue types
- Combine with tissue morphology assessment to evaluate on-target localization
- Use chromogenic RNAscope for compatibility with standard pathology workflows [17]
Key Applications in Cell and Gene Therapy Development
- Target Validation: Spatial confirmation of target gene expression in specific cell types relevant to therapy mechanism of action [3]
- Therapeutic Engraftment Monitoring: Tracking persistence and distribution of administered therapeutic cells in host tissues [38]
- Tropism Analysis: Determining tissue and cellular localization of gene therapy vectors [17]
- Safety Assessment: Identifying off-target expression or unexpected expression patterns in non-target tissues [17]
The multiplexing capability of RNAscope is particularly valuable for cell and gene therapy applications, enabling researchers to simultaneously detect the therapeutic transgene along with cellular markers to identify the exact cell types expressing the therapy, as demonstrated in co-expression studies of ligands and receptors such as NRG1 and ERBB3 [3].
Application 3: Oligonucleotide Biodistribution Studies
RNAscope provides a powerful platform for evaluating the distribution and cellular uptake of therapeutic oligonucleotides, offering critical insights that complement other biodistribution assessment methods.
Experimental Protocol for Biodistribution Studies
Tissue Collection and Preparation:
- Collect tissues at various time points post-oligonucleotide administration
- Fix tissues in 10% neutral buffered formalin for 6-72 hours
- Process through standard paraffin embedding protocols [8]
Probe Design for Oligonucleotide Detection:
Highly Sensitive Detection:
Advantages for Biodistribution Assessment
RNAscope offers several distinct advantages for oligonucleotide biodistribution studies compared to alternative methods:
Spatial Context: Unlike extraction-based methods that homogenize tissues, RNAscope preserves the spatial distribution of oligonucleotides within tissue architecture, identifying which specific cell types have taken up the therapeutic agent [1].
Single-Cell Sensitivity: The technology can detect individual oligonucleotide molecules, providing exceptional sensitivity for tracking low-abundance therapeutics [2].
Multiplexing Capability: Researchers can simultaneously detect the therapeutic oligonucleotide alongside cell type markers, enabling precise identification of the cellular compartments responsible for uptake and retention [3].
Compatibility with Archival Tissues: The method works robustly with FFPE tissues, allowing retrospective analysis of samples from preclinical studies [1] [17].
Table 3: Research Reagent Solutions for RNAscope Applications
| Reagent Category | Specific Examples | Function | Application Notes |
|---|---|---|---|
| Control Probes | PPIB, UBC, POLR2A (positive); dapB (negative) | Assess RNA quality and assay performance; determine background | Species-specific positive controls recommended [8] |
| Pretreatment Reagents | Target Retrieval, Protease Plus, Protease III, IV | Unmask target RNA; permeabilize cells | Optimization required for different tissue types [8] |
| Detection Systems | HRP-based (DAB), Alkaline Phosphatase (Fast Red), Fluorescent labels | Signal generation for visualization | Chromogenic for bright-field; fluorescent for multiplexing [2] [1] |
| Analysis Tools | HALO Software, QuPath, ImageJ, CellProfiler | Quantitative image analysis | Enable cell-by-cell quantification and expression profiling [2] [38] |
Integrated Workflow for Comprehensive Studies
The versatility of RNAscope technology enables integrated experimental approaches that span multiple application areas. A comprehensive cell therapy development program might utilize RNAscope for target validation during discovery, biodistribution assessment during preclinical development, and biomarker analysis during clinical trials.
The integrated workflow demonstrates how RNAscope technology serves as a unified platform addressing multiple critical needs in modern biomedical research and therapeutic development. By providing spatial context for molecular analysis, it bridges the gap between traditional molecular biology techniques and histopathology, enabling researchers to understand not just whether a target is present, but exactly where it is located within complex tissues.
As spatial biology continues to gain importance in both basic research and translational applications, RNAscope's unique capabilities in biomarker validation, cell and gene therapy development, and biodistribution studies position it as an essential technology for researchers and drug development professionals working to advance personalized medicine and targeted therapeutics.
RNAscope Troubleshooting and Optimization: Ensuring Robust and Reproducible Results
Common Pitfalls in Sample Preparation and How to Avoid Them
Sample preparation is the foundational step upon which all subsequent RNAscope analysis is built. Within the context of a broader thesis on the principles of RNAscope research, it is critical to understand that even the most advanced signal amplification technology cannot compensate for a poorly prepared sample. Suboptimal sample preparation is the most common reason for failed or subpar RNAscope experiments, potentially leading to data loss, wasted resources, and incorrect biological conclusions [39]. This guide details the common pitfalls encountered during this critical phase and provides actionable methodologies to avoid them, ensuring the single-molecule sensitivity of the RNAscope platform is fully realized.
Sample Fixation and Processing Errors
The integrity of the target RNA begins with proper fixation and processing. Deviations from established protocols at this stage are a primary source of experimental failure.
Pitfall 1: Suboptimal Fixation
Incorrect fixation conditions directly compromise RNA integrity and accessibility, leading to either weak signals or high background.
- Under-fixation: Fails to adequately preserve RNA within the tissue, resulting in significant RNA degradation during storage and processing, and ultimately, a weak or absent signal [39].
- Over-fixation: Excessive cross-linking from prolonged fixation makes the tissue impermeable to probes and detection reagents, also resulting in low signal, and can increase autofluorescence.
Solution: Adhere to standardized fixation protocols. For formalin-fixed, paraffin-embedded (FFPE) tissues, the recommended guideline is to fix samples in fresh 10% Neutral Buffered Formalin (NBF) for 16–32 hours at room temperature [24] [40] [39]. Tissue specimens should be trimmed to a thickness of 3–4 mm to ensure uniform penetration of the fixative [40] [39]. For fresh-frozen tissues, fixation in pre-chilled fresh 10% NBF for 1 hour at 4°C is recommended, though this may require optimization for specific tissue types [41].
Pitfall 2: Improper Paraffin Embedding and Sectioning
Physical damage during embedding and sectioning can cause tissue loss, morphological damage, and RNA degradation.
- Excessive Heat: Infiltrating tissue with melted paraffin held at temperatures above 60°C can fragment RNA [40] [39].
- Incorrect Slide Type: Using slides other than Superfrost Plus will result in tissue detachment during the rigorous hybridization and washing steps [24] [42] [40].
Solution: Follow precise embedding and sectioning protocols.
- Maintain paraffin at or below 60°C during infiltration [40] [39].
- Cut FFPE tissue sections to a thickness of 5 ±1 μm [40]. For frozen tissues, section thickness should be 10–20 μm [40] [41].
- Mount sections on Superfrost Plus slides and air-dry overnight. Baking slides at 60°C for 1-2 hours prior to the assay is recommended if they are not used immediately [40].
Pretreatment and Optimization Failures
The pretreatment steps are designed to make the target RNA accessible to the probes. Both under- and over-treatment are common failure points.
Pitfall 3: Inadequate Use of Control Probes
Skipping control experiments makes it impossible to distinguish between a true negative result and a technical failure, undermining data validity.
Solution: Always run a multiplexed quality control experiment with positive and negative control probes on your sample of interest.
- Technical Workflow Control: Use control slides (e.g., Human HeLa or Mouse 3T3 cell pellets) to verify the entire assay is functioning correctly [24] [40].
- Sample/RNA Quality Control: Run your test sample with a panel of control probes [24] [42] [4]. The table below outlines the essential controls and their interpretation.
Table 1: Essential Control Probes for RNAscope Assay Validation
| Control Type | Probe Target | Function | Interpretation of Successful Result |
|---|---|---|---|
| Positive Control | PPIB (Cyclophilin B) | Low-copy housekeeping gene (10-30 copies/cell) | Score of ≥2 with relatively uniform signal [24] [40] |
| POLR2A | Low-copy housekeeping gene (5-15 copies/cell) | Score of ≥2 with relatively uniform signal [24] [42] | |
| UBC (Ubiquitin C) | High-copy housekeeping gene | Score of ≥3 with relatively uniform signal [24] [42] [40] | |
| Negative Control | dapB (bacterial gene) | Assess non-specific background and assay specificity | Score of <1 (low to no staining) [24] [40] |
Pitfall 4: Non-Optimized Antigen Retrieval and Protease Treatment
Applying a "one-size-fits-all" pretreatment is a major pitfall. Tissues fixed for non-standard durations or of different types (e.g., plant, neural) require customized conditions [24] [41] [22].
Solution: Qualify and optimize pretreatment conditions using control probes. The workflow for optimization involves systematically adjusting the two key pretreatment parameters based on the initial results from your control probes. The following diagram illustrates this iterative process.
For automated systems, specific optimization protocols exist. The table below provides recommended starting points and adjustment strategies for the Leica BOND RX system.
Table 2: Pretreatment Optimization Guide for Leica BOND RX System
| Tissue Condition | Epitope Retrieval 2 (ER2) | Protease Treatment | Application Notes |
|---|---|---|---|
| Standard | 15 min at 95°C | 15 min at 40°C | Recommended starting point for most tissues [24] [42] |
| Milder | 15 min at 88°C | 15 min at 40°C | For delicate tissues or when signal is too weak with standard [24] [42] |
| Extended | Increase time in 5-min increments (e.g., 20, 25 min) at 95°C | Increase time in 10-min increments (e.g., 25, 35 min) at 40°C | For over-fixed or difficult-to-permeabilize tissues [24] [42] |
Reagent and Workflow Execution Errors
Even with perfect samples, errors in daily execution can derail an experiment. Consistency is paramount.
Pitfall 5: Use of Incompatible Reagents and Labware
The RNAscope procedure involves specific pH and chemical conditions. Substituting reagents or labware can introduce RNases, cause tissue detachment, or quench signals.
Solution: Use only validated reagents and materials.
- Hydrophobic Barrier Pen: Use only the ImmEdge Hydrophobic Barrier Pen, as others may fail during the assay [24] [41].
- Mounting Media: The assay dictates the mounting media. For example, the RNAscope 2.5 HD Brown assay requires xylene-based media (e.g., CytoSeal), while the Red and 2-plex assays require EcoMount or PERTEX [24] [42]. Using an incorrect medium can dissolve the signal.
- Fresh Reagents: Always use fresh ethanol and xylene for deparaffinization and dehydration to prevent introduction of contaminants or water, which can affect tissue adhesion and hybridization [24] [42].
Pitfall 6: Deviation from Protocol and Sample Drying
The RNAscope assay is a sequential, multi-step amplification process. Omitting steps, altering incubation times, or letting slides dry will cause irreversible failure.
Solution: Follow the protocol exactly and maintain hydration.
- Follow the Manual: Do not alter the protocol. Apply all amplification steps in the correct order; missing any step will result in no signal [24] [42].
- Prevent Drying: Flick or tap slides to remove residual reagent, but do not let slides dry out at any time between pretreatment and final coverslipping. Ensure the hydrophobic barrier remains intact [24] [42].
- Pre-warm Reagents: Warm probes and wash buffer to 40°C before use to dissolve precipitates that form during storage [24] [42].
The Scientist's Toolkit: Essential Materials for RNAscope
Success in RNAscope is contingent on using the correct, high-quality materials. The following table details the essential research reagent solutions and their functions.
Table 3: Key Research Reagent Solutions for RNAscope Experiments
| Item | Function | Key Considerations |
|---|---|---|
| Superfrost Plus Slides | Microscope slides with enhanced tissue adhesion. | Required to prevent tissue loss during stringent washes [24] [40] [41]. |
| ImmEdge Hydrophobic Barrier Pen | Creates a hydrophobic barrier around the tissue section. | Required to maintain reagent volume and prevent slides from drying out [24] [41] [22]. |
| RNAscope Control Slides & Probes | Validate assay performance and sample RNA quality. | Critical for troubleshooting. Includes HeLa/3T3 cell pellets and PPIB/POLR2A/UBC/dapB probes [24] [40] [4]. |
| HybEZ Oven and Humidity Control Tray | Provides optimum temperature (40°C) and humidity for hybridization. | Required for manual assays to prevent evaporation and ensure consistent results [24] [42] [41]. |
| Assay-Specific Mounting Media | Preserves staining and enables microscopy. | Using the wrong media can dissolve signal. Must match your assay (e.g., Brown vs. Red) [24] [42]. |
| Fresh 10% NBF | Primary fixative for tissue preservation. | Must be fresh; old or buffered incorrectly formalin leads to poor RNA integrity [24] [40] [39]. |
| Fresh Ethanol and Xylene | Used for deparaffinization and dehydration of tissue sections. | Always use fresh reagents to prevent contamination and ensure proper tissue processing [24] [42]. |
The power of RNAscope to provide single-molecule resolution of RNA expression in situ is unparalleled. However, this power is entirely dependent on the meticulousness of the sample preparation phase. By understanding the principles behind the protocol—such as the critical need for proper fixation to preserve RNA, the requirement for optimized permeabilization to allow probe access, and the non-negotiable use of controls for validation—researchers can avoid the common pitfalls outlined in this guide. Adherence to validated protocols, coupled with a systematic approach to troubleshooting using control probes, will ensure that your RNAscope data is robust, reproducible, and of the highest quality, thereby solidifying the integrity of your research conclusions.
RNAscope in situ hybridization (ISH) represents a major advance in molecular pathology, enabling single-molecule RNA visualization within intact cells while preserving tissue morphology. This patented technology employs a unique signal amplification and background suppression system that allows researchers to examine biomarker status within the complete histopathological context of clinical specimens. The core principle relies on specialized "ZZ" probe pairs that hybridize to target RNA sequences, followed by sequential amplification steps that generate detectable signals only when both probes bind correctly to adjacent targets. Unlike grind-and-bind RNA analysis methods, RNAscope brings the benefits of in situ analysis to RNA biomarkers, allowing direct correlation of gene expression patterns with tissue architecture and cellular organization.
Within this sophisticated analytical framework, sample pretreatment—specifically antigen retrieval and protease digestion—emerges as the most critical determinant of experimental success. These preprocessing steps directly govern RNA accessibility for probe hybridization by reversing formalin-induced cross-links and partially digesting surrounding proteins that might obscure target sequences. Optimal pretreatment conditions must strike a delicate balance: sufficient to expose target RNAs while preserving RNA integrity and tissue morphology. This technical guide provides comprehensive, evidence-based protocols for optimizing these essential pretreatment parameters across diverse tissue types and experimental conditions, framed within the broader context of RNAscope operational principles for research applications.
Fundamental Principles of RNAscope Pretreatment
The Dual Mechanism of Pretreatment Optimization
The RNAscope pretreatment protocol consists of two sequential yet interdependent steps: antigen retrieval and protease digestion. Antigen retrieval, also termed target retrieval, employs heat-induced epitope retrieval to reverse the cross-linking effects of formalin fixation. This process breaks methylene bridges formed between proteins and nucleic acids during fixation, thereby exposing the target RNA molecules for subsequent probe hybridization. The second step, protease digestion, enzymatically permeabilizes the tissue by partially digesting surrounding proteins, creating physical pathways for probe access to the target RNA sequences.
The stringent equilibrium between these processes dictates experimental outcomes. Under-digestion manifests as poor probe accessibility and consequently low signal intensity, as probes cannot reach their targets. Conversely, over-digestion compromises RNA integrity and tissue morphology, potentially leading to complete signal loss or unreliable results. This balance exhibits significant variation across tissue types due to differences in cellular density, extracellular matrix composition, and fixation history. Furthermore, the fundamental difference between RNAscope and immunohistochemistry workflows necessitates specific procedural adaptations, particularly regarding temperature control and specialized equipment requirements [43].
Essential Research Reagent Solutions
Table 1: Essential Reagents for RNAscope Pretreatment Optimization
| Reagent/Equipment | Function | Technical Considerations |
|---|---|---|
| SuperFrost Plus Slides | Tissue adhesion | Critical for preventing tissue loss during high-temperature steps; other slide types may result in detachment [43] |
| HybEZ Hybridization System | Humidity and temperature control | Maintains optimum conditions during hybridization; required for RNAscope workflow [43] |
| Neutral-Buffered Formalin (10% NBF) | Tissue fixation | Must be fresh; fixation time significantly impacts retrieval conditions (16-32 hours recommended) [40] |
| BOND Epitope Retrieval Buffer 2 (ER2) | Antigen retrieval | Standard solution for heat-induced epitope retrieval on automated systems [44] |
| Protease Plus | Tissue permeabilization | Broad-spectrum protease that digests proteins surrounding RNA targets; concentration and time require optimization [45] |
| ImmEdge Hydrophobic Barrier Pen | Liquid containment | Maintains reagent volume over tissue; specific brand required as others may fail during high-temperature steps [43] |
| Control Probes (PPIB, dapB, POLR2A, UBC) | Assay validation | Essential for distinguishing technical failure from biological reality; PPIB and POLR2A (low-copy), UBC (high-copy) as positive controls, dapB as negative control [40] [43] |
Tissue-Specific Pretreatment Optimization Guidelines
Quantitative Optimization Parameters
Table 2: Tissue-Specific Pretreatment Conditions for Automated Systems
| Tissue Type | Species | Antigen Retrieval | Protease Digestion | Pretreatment Category |
|---|---|---|---|---|
| Lymphoid Tissue | Multiple | ER2 at 88°C for 15 min | Protease at 40°C for 15 min | Mild [44] |
| Retina | Multiple | ER2 at 88°C for 15 min | Protease at 40°C for 15 min | Mild [44] |
| Cardiac Muscle | Rat, Dog, Monkey | ER2 at 95°C for 15 min | Protease at 40°C for 15 min | Standard [44] |
| Liver | Rat, Dog, Monkey | ER2 at 95°C for 15 min | Protease at 40°C for 15 min | Standard [44] |
| Kidney | Rat, Dog, Monkey | ER2 at 95°C for 15 min | Protease at 40°C for 15 min | Standard [44] |
| Brain (General) | Multiple | ER2 at 95°C for 15 min | Protease at 40°C for 15 min | Standard [44] [46] |
| Over-fixed Tissues | Multiple | Incremental 5-min increases at 95°C | Incremental 10-min increases at 40°C | Extended [43] |
Workflow for Systematic Pretreatment Optimization
Systematic Pretreatment Optimization Workflow
This optimization algorithm provides a methodical framework for establishing tissue-specific pretreatment parameters. The process begins with standardized conditions recommended for each tissue category, followed by simultaneous assessment of both signal quality (using positive control probes) and morphological preservation. The decision nodes guide researchers toward parameter adjustments based on specific experimental outcomes, with iterative refinement until optimal balance is achieved.
For suboptimal signals with preserved morphology, increase protease digestion time in 10-minute increments. When signal remains inadequate despite extended protease treatment, incrementally increase antigen retrieval time by 5-minute intervals while maintaining protease duration. Conversely, excessive background or morphological deterioration necessitates reduction of both parameters, particularly focusing on protease concentration and duration [43] [44].
Experimental Protocols for Pretreatment Optimization
Standardized Protocol for Automated Platforms
For researchers utilizing automated staining systems such as the Leica BOND RX or Ventana DISCOVERY platforms, the following protocol provides a robust foundation for pretreatment optimization:
Slide Preparation: Cut formalin-fixed, paraffin-embedded (FFPE) tissue sections at 5±1μm thickness and mount on SuperFrost Plus slides. Bake slides at 60°C for 1-2 hours to ensure adhesion [40].
Deparaffinization and Dehydration: Process slides through xylene and graded ethanol series according to standard protocols. Ensure complete paraffin removal while avoiding section detachment [45].
Antigen Retrieval Implementation:
Protease Digestion Optimization:
Validation with Control Probes: Always include positive control probes (PPIB, POLR2A, or UBC) and negative control probes (dapB) to distinguish technical failure from biological reality. Successful staining should demonstrate PPIB/POLR2A scores ≥2 or UBC scores ≥3 with dapB scores <1 [40] [43].
Specialized Protocol for Fresh-Frozen Tissues
While FFPE tissues represent the most common sample type, fresh-frozen tissues offer advantages for certain applications, particularly when studying protease-sensitive epitopes or when combining RNAscope with immunohistochemistry [29]. The pretreatment protocol requires significant modification:
Tissue Preparation: Cryosection fresh-frozen tissues at 10-20μm thickness and mount on SuperFrost Plus slides. For mouse brain, 16μm sections are optimal [46].
Fixation: Immerse slides in 4% paraformaldehyde in 1x PBS for a minimum of 15 minutes up to 2 hours at room temperature [46].
Dehydration: Process through graded ethanol series (50%, 70%, 100%) for 5 minutes each at room temperature [46].
Peroxidase Blocking: Apply RNAscope Hydrogen Peroxide for 10 minutes at room temperature to quench endogenous peroxidase activity [46].
Protease Treatment: Utilize Protease Plus for 10 minutes at room temperature. Note the significantly reduced duration compared to FFPE protocols [46].
Hybridization: Proceed with standard RNAscope hybridization protocol using the HybEZ oven at 40°C [46].
Advanced Applications and Troubleshooting
Innovative Applications: Intronic Probes for Nuclear Localization
Recent methodological advances have expanded RNAscope applications beyond conventional mRNA detection. The development of intronic RNAscope probes represents a particularly significant innovation for precisely identifying cardiomyocyte nuclei in cardiac regeneration studies. These probes target unspliced pre-mRNA sequences within nuclei, enabling specific nuclear localization even during mitosis when the nuclear envelope breaks down [12].
In practice, Tnnt2 intronic RNAscope probes demonstrate high specificity for cardiomyocyte nuclei, colocalizing with Obscurin-H2B-GFP in adult mouse hearts. This approach overcomes limitations of antibody-based methods for sarcomeric proteins, which achieve only 43% sensitivity and 89% specificity for cardiomyocyte nucleus identification. The intronic probe strategy maintains association with chromatin throughout all mitotic stages, facilitating reliable investigation of DNA synthesis and mitotic activity in border and infarct zones following myocardial infarction [12].
Multiplexing and Emerging Methodologies
The development of protease-free RNAscope workflows now enables simultaneous detection of RNA and protein biomarkers, even for protease-sensitive epitopes. This advanced capability supports comprehensive spatial multiomics analyses on platforms like the Roche DISCOVERY ULTRA, integrating RNA in situ hybridization with immunohistochemistry or immunofluorescence while preserving tissue architecture [29].
For highly multiplexed applications, techniques like DART-FISH (Decoding Amplified taRgeted Transcripts with Fluorescence in situ Hybridization) permit profiling of hundreds to thousands of genes in centimeter-sized human tissue sections. This padlock probe-based technology incorporates a novel cytoplasmic stain (RiboSoma) that substantially improves cell body segmentation and employs combinatorial barcoding schemes originally developed for Illumina BeadArray technology [47].
Systematic Troubleshooting Guide
Pretreatment Troubleshooting Guide
Optimal pretreatment represents the fundamental gateway to successful RNAscope experiments, directly governing the equilibrium between RNA accessibility, signal intensity, and morphological preservation. As spatial biology evolves toward increasingly sophisticated multiplexed applications and multiomic integrations, the precision of antigen retrieval and protease digestion parameters becomes progressively more critical. The tissue-specific guidelines and systematic optimization workflows presented in this technical guide provide researchers with evidence-based methodologies for establishing robust, reproducible RNAscope assays across diverse experimental contexts.
Future methodological developments will likely focus on further streamlining pretreatment workflows while enhancing compatibility with emerging biomarker classes. The recent introduction of protease-free assays exemplifies this trajectory, enabling unprecedented integration of RNA and protein detection within intact tissue architecture. By mastering the principles and practices of pretreatment optimization detailed herein, researchers can fully leverage the powerful capabilities of RNAscope technology to advance biomarker discovery, therapeutic development, and fundamental biological investigation with single-molecule precision within spatial context.
Spatial genomics represents a transformative approach in molecular pathology, enabling the examination of biomarker expression within the precise histopathological context of tissues. The RNAscope in situ hybridization (ISH) technology has emerged as a groundbreaking platform for RNA analysis, offering single-molecule sensitivity and high specificity through its proprietary double Z probe design. This technical guide elucidates the fundamental principles of RNAscope technology and establishes a comprehensive framework for validating assay performance using essential control probes—PPIB, POLR2A, UBC, and dapB. Within the broader thesis of how RNAscope works, we demonstrate how these controls provide critical verification of technical workflow, RNA quality, and pretreatment conditions, thereby ensuring the reliability and interpretability of spatial genomic data. By detailing standardized methodologies, interpretation guidelines, and troubleshooting approaches, this whitepaper provides researchers, scientists, and drug development professionals with an essential resource for implementing rigorous quality control practices in RNA ISH experiments.
RNAscope Principle Research: A Novel ISH Platform
The RNAscope technology represents a major advancement in in situ RNA analysis, addressing the critical limitations of conventional ISH methods through a unique probe design strategy that enables simultaneous signal amplification and background suppression [1]. This platform achieves single-molecule visualization while preserving tissue morphology through its proprietary "double Z" probe design, which fundamentally enhances the signal-to-noise ratio of RNA ISH [2]. The core innovation lies in a probe architecture that requires two independent probes (double Z probes) to hybridize to the target sequence in tandem for signal amplification to occur, making it highly improbable for non-specific hybridization events to generate false-positive signals [2] [1].
The RNAscope workflow encompasses four critical stages: (1) sample permeabilization to unmask target RNA, (2) hybridization with approximately 20 target-specific double Z probe pairs, (3) signal amplification through sequential hybridization of amplifiers and label probes, and (4) visualization and quantification of punctate dot signals, with each dot representing a single RNA molecule [2] [4] [8]. This process can be completed within a single day and is compatible with various sample types, including formalin-fixed, paraffin-embedded (FFPE) tissues, cultured cells, and fresh-frozen tissues [40] [4]. The technology's robust performance across diverse specimen types and its compatibility with both bright-field and fluorescence detection modalities make it particularly valuable for preclinical research and diagnostic applications [1] [4].
The Critical Role of Control Probes in Spatial Genomics
In the context of RNAscope principle research, control probes serve as indispensable tools for verifying and validating every aspect of assay performance. They provide a systematic approach to distinguish technical artifacts from biological findings, thereby ensuring the reliability and interpretability of spatial genomic data [40] [4]. The implementation of proper controls is particularly crucial in RNA ISH due to variables such as tissue fixation methods, RNA integrity, enzymatic pretreatment efficiency, and hybridization specificity, all of which can significantly impact experimental outcomes [40].
Two distinct levels of quality control are recommended for RNAscope assays: technical workflow quality control, which ensures the assay procedure is working correctly, and sample/RNA quality control, which verifies that the test sample is suitable for analysis [4]. The control probes PPIB, POLR2A, UBC, and dapB collectively address these quality control dimensions by providing reference points for assay validation, signal interpretation, and troubleshooting. Their strategic implementation forms the foundation of rigorous RNAscope experimentation and enables researchers to draw confident conclusions about gene expression patterns within the morphological context of tissues.
RNAscope Technology Principle: Design and Mechanism
The Double Z Probe Architecture
The exceptional sensitivity and specificity of RNAscope technology stems from its innovative double Z probe design, which represents a fundamental departure from conventional ISH approaches [2] [1]. This architecture employs pairs of target probes that must bind adjacent to each other on the same RNA molecule to initiate signal amplification. Each individual Z probe comprises three distinct elements: (1) a lower 18-25 base region complementary to the target RNA, (2) a spacer sequence that links the target-binding component to the tail, and (3) an upper 14-base tail sequence that facilitates signal amplification [2]. The requirement for two independent probes to hybridize in tandem to the target molecule dramatically reduces the probability of non-specific amplification, as it is statistically unlikely that two independent probes would bind nonspecifically to adjacent sites on off-target sequences [1].
For each target RNA, approximately 20 double Z probe pairs are designed to hybridize along a 1 kb region, providing redundancy that ensures robust detection even when target accessibility is variable or RNA is partially degraded [2] [1]. This probe redundancy is a crucial feature that enhances the technology's resilience across diverse sample types and qualities, making it particularly valuable for archival FFPE specimens where RNA integrity may be compromised [2].
Signal Amplification Cascade
The signal amplification mechanism in RNAscope employs a cascade of sequential hybridization events that dramatically enhance detection sensitivity while maintaining exceptional specificity [2]. This process begins when double Z probe pairs hybridize to the target RNA molecule. The adjacent 14-base tail sequences from each probe pair then form a 28-base binding site for a pre-amplifier molecule [2] [8]. This requirement for a contiguous 28-base sequence provides an additional layer of specificity, as individual Z probes binding to non-specific sites cannot form functional pre-amplifier binding sites.
Once bound, each pre-amplifier provides multiple binding sites for amplifier molecules, which in turn contain numerous binding sites for label probes conjugated with either fluorescent molecules or chromogenic enzymes [2] [8]. This multi-stage amplification strategy can theoretically generate up to 8,000 labels for each target RNA molecule, enabling single-molecule detection despite the relatively short target regions (40-50 bases) required for each double Z probe pair [1]. The entire process is conducted via hybridization without enzymatic reactions, contributing to the technology's robustness and reproducibility across different laboratories and sample types.
Compatibility with Diverse Sample Types
A significant advantage of the RNAscope platform is its compatibility with various sample preparation methods, including FFPE tissues, fresh-frozen tissues, fixed-frozen tissues, and cultured cells [40] [4]. For FFPE tissues, which represent the most common clinical specimen type, the technology has been optimized to work with tissues fixed in 10% neutral-buffered formalin for 16-32 hours and processed according to standard histopathological procedures [40]. The relatively short target regions (40-50 bases) required for double Z probe hybridization make the technology particularly suitable for partially degraded RNA, which is frequently encountered in archival FFPE samples [2].
The signal amplification system can be adapted for both bright-field microscopy using chromogenic labels (DAB or Fast Red) and fluorescence microscopy using fluorophore-conjugated probes [1] [8]. This flexibility enables researchers to select the detection modality most appropriate for their experimental needs, including multiplexed analysis of up to four targets simultaneously through the use of spectrally distinguishable fluorescent labels [1]. The platform's adaptability to automated staining systems further enhances its utility in high-throughput research and potential diagnostic applications [4].
Control Probes: Functions and Selection Criteria
The Control Probe Ecosystem
The RNAscope control ecosystem comprises both positive and negative controls that serve distinct but complementary functions in validating assay performance. The negative control probe targets the bacterial dapB gene from Bacillus subtilis strain SMY, which should not be present in human, rodent, or other common laboratory animal tissues [40] [4]. This probe provides a critical assessment of background staining and non-specific signal amplification, with successful assays demonstrating minimal to no dapB signal [4]. The positive control probes include housekeeping genes expressed at different abundance levels: PPIB (cyclophilin B) as a frequently used reference, POLR2A (RNA polymerase II subunit A), and UBC (ubiquitin C) [40] [4] [8]. These endogenous controls verify that the assay conditions are appropriate for detecting RNA targets across a range of expression levels and that the sample RNA is sufficiently preserved for analysis.
Table 1: Control Probes for RNAscope Assay Validation
| Control Probe | Type | Target | Function | Interpretation of Expected Results |
|---|---|---|---|---|
| dapB | Negative | Bacterial gene | Assess background staining and non-specific hybridization | Score should be <1; minimal to no staining indicates low background |
| PPIB | Positive | Housekeeping gene | Medium-expression control; verify RNA quality and assay performance | Score ≥2 indicates acceptable RNA quality and assay performance |
| POLR2A | Positive | Housekeeping gene | Low-expression control; verify detection of less abundant transcripts | Score ≥2 indicates acceptable RNA quality and assay performance |
| UBC | Positive | Housekeeping gene | High-expression control; verify detection of highly abundant transcripts | Score ≥3 indicates acceptable RNA quality and assay performance |
Selection Guidelines for Positive Controls
The appropriate selection of positive control probes depends on several factors, including the expected expression level of the target gene and the tissue type under investigation [4]. For targets with low to moderate expression levels, POLR2A and PPIB serve as excellent reference controls, as they demonstrate consistent expression across most tissue types and cell types [4]. For highly expressed targets or when verifying the ability to detect abundant transcripts, UBC provides a more appropriate reference point [8]. In multiplex experiments where multiple targets are simultaneously assessed, researchers should include at least one positive control probe that matches the expression level range of the targets of interest.
When establishing RNAscope in a new laboratory or working with unfamiliar tissue types, it is advisable to initially test all three positive control probes (PPIB, POLR2A, and UBC) to establish baseline performance characteristics and determine which control most consistently provides the recommended scoring thresholds [40] [8]. This practice is particularly important when analyzing tissues with potentially compromised RNA integrity or when using non-standard fixation protocols. Furthermore, species-specificity must be considered when selecting control probes, though cross-species hybridization can be employed when sequence homology exceeds 90-95%, as is the case with human probes for cynomolgus monkey tissues [4].
Experimental Protocol for Control Implementation
Sample Preparation and Pretreatment Guidelines
Proper sample preparation is foundational to successful RNAscope analysis, and control probes play an essential role in verifying that preparation quality. For FFPE tissues, specimens should be fixed in 10% neutral-buffered formalin for 16-32 hours at room temperature, processed through standard dehydration series, embedded in paraffin, and sectioned at 5±1 μm thickness [40] [4]. Sections should be mounted on positively charged slides, such as Fisher Scientific SuperFrost Plus, to prevent tissue loss during the assay procedure [40]. For frozen tissues, section thickness should be between 10-20 μm for fresh frozen tissue and 7-15 μm for fixed frozen tissue [40].
The pretreatment protocol involves four critical steps: (1) deparaffinization with xylene and ethanol series for FFPE samples, (2) antigen retrieval using citrate buffer at 95-100°C for 15 minutes, (3) peroxidase blocking with hydrogen peroxide to quench endogenous enzyme activity, and (4) protease digestion (typically Protease Plus, III, or IV) to permeabilize cell membranes and unmask target RNA [4] [8]. The optimal protease concentration and incubation time may require optimization based on tissue type and fixation conditions, with control probes providing essential feedback for these adjustments.
Control Assay Workflow Implementation
The RNAscope assay with control probes follows a standardized workflow that can be performed manually or on automated staining systems such as Leica Biosystems' BOND RX or Roche Tissue Diagnostics' Discovery Ultra [4]. The procedure begins with the pretreatment steps outlined above, followed by hybridization with target-specific probes for 2-3 hours at 40°C [2] [1]. For control assays, separate slides should be hybridized with dapB (negative control) and the appropriate positive control probe (PPIB, POLR2A, or UBC) in parallel with experimental samples to ensure consistent conditions.
Following probe hybridization, a series of six amplification steps (AMP1-AMP6) are performed, each involving sequential hybridization of amplification reagents and wash steps to remove unbound reagents [4]. The process culminates with chromogenic or fluorescent detection using the appropriate label probe, followed by counterstaining (hematoxylin for chromogenic detection, DAPI for fluorescent detection) and mounting for microscopy [1] [4]. Throughout this process, control slides should be processed in identical fashion to experimental samples to provide meaningful quality assessment.
Data Interpretation and Scoring Methodologies
Quantitative Scoring of Control Probes
The interpretation of RNAscope staining relies on a semi-quantitative scoring system that evaluates the number of punctate dots per cell rather than signal intensity, as each dot represents an individual RNA molecule [40] [8]. The established scoring criteria categorize staining results into five distinct grades based on dot enumeration: 0 (no staining or <1 dot per 10 cells), 1+ (1-3 dots/cell), 2+ (4-10 dots/cell, very few dot clusters), 3+ (>10 dots/cell, <10% positive cells have dot clusters), and 4+ (>10 dots/cell, >10% positive cells have dot clusters) [4]. This standardized approach ensures consistent interpretation across experiments and between researchers.
For successful assay validation, positive control probes (PPIB and POLR2A) should achieve a score of ≥2, while UBC should achieve a score of ≥3, indicating robust detection of medium-, low-, and high-abundance transcripts, respectively [40] [8]. The negative control dapB should yield a score of <1, demonstrating minimal non-specific background staining [40]. These thresholds provide objective criteria for determining whether an assay has performed adequately and whether experimental results can be confidently interpreted.
Table 2: RNAscope Control Probe Scoring Criteria and Interpretation
| Score | Dot Distribution Criteria | Expected PPIB/POLR2A | Expected UBC | Expected dapB |
|---|---|---|---|---|
| 0 | No staining or <1 dot per 10 cells | Unacceptable | Unacceptable | Required |
| 1+ | 1-3 dots per cell | Unacceptable | Unacceptable | Unacceptable |
| 2+ | 4-10 dots per cell, very few dot clusters | Acceptable | Unacceptable | Unacceptable |
| 3+ | >10 dots per cell, <10% positive cells have dot clusters | Target-dependent | Acceptable | Unacceptable |
| 4+ | >10 dots per cell, >10% positive cells have dot clusters | Target-dependent | Target-dependent | Unacceptable |
Troubleshooting Based on Control Probe Performance
Systematic analysis of control probe results enables targeted troubleshooting of suboptimal RNAscope assays. When positive controls fail to meet the recommended scoring thresholds while the negative control shows appropriate low background, the issue typically relates to insufficient signal rather than excessive noise [4]. This pattern suggests problems with RNA integrity, inadequate protease digestion, or suboptimal hybridization conditions. Potential remedies include increasing protease concentration or incubation time, adjusting antigen retrieval conditions, or verifying RNA quality through alternative methods.
Conversely, when both positive and negative controls display elevated signals, the problem typically indicates excessive background staining due to non-specific hybridization or amplification [4]. This pattern suggests issues with over-digestion by protease, excessive amplification, or suboptimal probe design. Potential solutions include reducing protease concentration or incubation time, decreasing amplification steps, or verifying probe specificity. When only the experimental target shows aberrant staining while controls perform as expected, the issue likely relates to the specific target probe rather than the overall assay conditions, suggesting the need for probe redesign or validation.
Advanced Applications and Multiplexing Strategies
Control Integration in Complex Experimental Designs
As RNAscope technology advances to accommodate increasingly sophisticated experimental designs, the role of controls evolves to meet new validation challenges. In multiplex assays where two or more targets are simultaneously detected using different chromogenic or fluorescent labels, control probes provide critical verification that detection systems are functioning independently without cross-reactivity [3] [4]. For these applications, control probes can be incorporated in sequential single-plex assays to establish baseline performance before attempting full multiplexing, or specially designed multiplex positive control probes targeting constitutively expressed genes with known expression patterns can be employed.
In specialized scenarios such as heterogenous target expression, subpopulation-specific expression, or rare cell detection, control probes enable researchers to distinguish technical variability from biological heterogeneity [3]. For example, when analyzing tumors with intratumoral heterogeneity, consistent staining of positive controls across different tumor regions verifies that variable target expression reflects biology rather than technical artifacts [3] [37]. Similarly, when studying rare cell populations, control probes confirm that the assay sensitivity is sufficient to detect isolated positive cells amidst predominantly negative populations.
Quantitative Image Analysis of Control Probes
Advanced image analysis platforms provide powerful tools for quantifying control probe performance beyond semi-quantitative scoring. Software solutions such as HALO (Indica Labs) and Aperio RNA ISH Algorithm (Leica Biosystems) enable automated enumeration of dots per cell, calculation of percentage positive cells, and determination of expression level distribution across cell populations [3] [4] [38]. These quantitative approaches generate continuous rather than categorical data for control probes, providing more sensitive detection of subtle variations in assay performance.
For heterogeneous samples, quantitative image analysis can calculate Histo-scores (H-scores) that incorporate both the intensity and distribution of staining [3]. The H-score formula [H-score = Σ (ACD score × percentage of cells per bin)] generates a continuous variable from 0 to 400, offering enhanced granularity for assessing control probe performance across different tissue regions or cell types [3]. This approach is particularly valuable for establishing acceptance criteria in regulated environments or when comparing assay performance across multiple laboratories or studies.
The Scientist's Toolkit: Essential Research Reagent Solutions
Table 3: Essential Research Reagents for RNAscope Control Implementation
| Reagent Category | Specific Products | Function in Control Assays |
|---|---|---|
| Control Probes | PPIB, POLR2A, UBC (positive); dapB (negative) | Verify assay performance, RNA quality, and specificity |
| Control Slides | Human HeLa Cell Pellet (Cat# 310045); Mouse 3T3 Cell Pellet (Cat# 310023) | Standardized substrates for assay validation |
| Pretreatment Reagents | RNAscope Pretreatment Kit, Target Retrieval Reagents, Protease Plus/III/IV | Unmask target RNA, permeabilize cells, block endogenous enzymes |
| Amplification Systems | RNAscope 2.5 HD/LS Reagent Kits (BROWN, RED, or MULTIPLEX) | Signal amplification and detection for bright-field or fluorescence |
| Image Analysis Software | HALO, Aperio RNA ISH Algorithm, QuPath, ImageJ | Quantitative analysis of control probe staining |
The integration of robust control measures using PPIB, POLR2A, UBC, and dapB probes represents an indispensable component of rigorous RNAscope experimentation. These controls provide critical validation of the technology's core principle—the highly specific amplification of target-specific signals while suppressing background noise—within the context of each individual experiment. By implementing the standardized protocols and interpretation guidelines outlined in this technical guide, researchers can ensure the reliability, reproducibility, and accurate interpretation of their spatial genomic findings. As RNAscope technology continues to evolve and find new applications in basic research, drug development, and clinical diagnostics, the disciplined use of control probes will remain fundamental to generating scientifically valid and clinically meaningful data.
Core Principles of RNAscope Technology
RNAscope is a novel in situ hybridization (ISH) assay for detecting target RNA within intact cells. Its principle is based on a proprietary signal amplification and background suppression system that allows for single-molecule visualization while preserving tissue morphology. The key innovation is the "double Z" probe design, which requires two independent probes to hybridize adjacently to the target RNA sequence before signal amplification can occur. This design dramatically improves the signal-to-noise ratio by preventing amplification of non-specifically bound probes. Each punctate dot in a successful RNAscope assay represents a single RNA molecule, enabling precise quantification and localization [2] [1].
The RNAscope workflow involves five critical steps: (1) sample permeabilization to unmask target RNA, (2) hybridization of target-specific double Z probes, (3) signal amplification through sequential hybridization, (4) visualization of punctate dots via microscopy, and (5) quantification of single-molecule signals [2].
Addressing No Signal Issues
Root Causes and Diagnostic Approach
No signal in RNAscope experiments can result from multiple factors, primarily concerning RNA integrity, target accessibility, or protocol execution failures. A systematic diagnostic approach using control probes is essential before troubleshooting experimental targets.
Table 1: Control Probe Interpretation for No Signal Diagnosis
| Control Result Pattern | PPIB/POLR2A Signal | dapB Signal | Interpretation | Recommended Action |
|---|---|---|---|---|
| Ideal Result | Score ≥2 (PPIB) or ≥3 (UBC) | Score <1 | Good RNA quality, proper assay performance | Proceed with experimental targets |
| No Signal All Probes | No signal | No signal | Complete assay failure | Check reagent order, hybridization temperature, amplification steps |
| Positive Control Only | Strong signal | No signal | Successful assay, but target not detected | Verify target expression, redesign probes if necessary |
| No Positive Control Signal | No signal | No signal | Poor RNA quality or inadequate permeabilization | Optimize pretreatment conditions |
Experimental Protocols for Resolution
Verify RNA Integrity and Pretreatment: Always run positive control probes (PPIB, POLR2A, or UBC) alongside negative control (dapB) on your sample. Successful PPIB staining should generate a score ≥2 and UBC score ≥3 with relatively uniform signal throughout the sample [24] [42].
Optimize Pretreatment Conditions: For over-fixed tissues, increase protease treatment times in increments of 10 minutes while keeping temperature constant at 40°C. For example, extend Protease treatment from 15 minutes to 25 or 35 minutes [24] [42].
Ensure Proper Workflow Execution:
Resolving High Background Problems
Identification and Characterization
High background in RNAscope manifests as diffuse, non-punctate staining that obscures specific signals and complicates accurate quantification. This issue primarily stems from non-specific probe binding or inadequate washing.
The RNAscope scoring system provides a standardized approach for evaluating background levels. The negative control probe (dapB) should yield a score <1, indicating minimal background. Scores higher than this threshold indicate problematic background levels requiring intervention [24] [42].
Optimization Protocols
Stringency Control through Washes:
- Always use fresh wash buffers for each experiment
- Ensure adequate washing between amplification steps (3 washes with RNAscope wash buffer)
- For automated systems, verify that bulk solution containers are properly filled and lines are purged [24]
Probe Specificity Verification:
- Confirm probe design covers the appropriate target region
- For multiplex assays, ensure proper probe mixing ratios (C2:C1 = 1:50 for 2-plex assays)
- Use "Blank Probe - C1" (Cat. No. 300041) if no C1 probe is included in the assay [24]
Tissue-Specific Optimization:
- For tissues with high endogenous peroxidase activity: extend hydrogen peroxide treatment time
- For autofluorescent tissues: use chromogenic detection instead of fluorescent
- For difficult tissues: implement milder pretreatment conditions (15 min ER2 at 88°C and 15 min Protease at 40°C) [42]
Table 2: High Background Troubleshooting Matrix
| Background Type | Appearance | Common Causes | Specific Solutions |
|---|---|---|---|
| Diffuse Staining | Evenly distributed nonspecific signal | Inadequate washing, old reagents | Use fresh wash buffers, increase wash times |
| Speckled Background | Random dots throughout tissue | Probe precipitation, dirty slides | Warm probes to 40°C, use Superfrost Plus slides |
| Specific Compartments | Background in specific regions | Endogenous enzymes | Optimize peroxide blocking step |
| Edge Effect | Stronger signal at tissue edges | Barrier pen failure, drying | Use ImmEdge pen only, maintain humidity |
Preventing Tissue Detachment
Critical Factors in Sample Preparation
Tissue detachment during RNAscope procedures primarily results from suboptimal slide selection, improper fixation, or harsh treatment conditions. This issue compromises experimental results by causing complete sample loss or creating artifacts.
The fundamental requirements for preventing detachment include using Superfrost Plus slides specifically, proper fixation in fresh 10% neutral-buffered formalin (NBF) for 16-32 hours, and maintaining tissue hydration throughout the procedure [24].
Detailed Methodologies
Slide Selection and Preparation:
- Use only Superfrost Plus slides (Fisher Scientific Cat. No. 12-550-15); other slide types frequently result in tissue detachment [24] [42].
- Apply sections with optimal thickness (5μm for FFPE tissues, 10-16μm for frozen sections) [48] [49].
- Bake FFPE sections for 1 hour at 60°C before proceeding with deparaffinization.
Fixation Protocol Optimization:
- Fix tissues in fresh 10% NBF for 16-32 hours at room temperature
- For cell cultures, fix in 4% formaldehyde for 60 minutes [1]
- Avoid over-fixation beyond 72 hours, which requires extensive optimization
Hydration Maintenance Throughout Assay:
- Use ImmEdge Hydrophobic Barrier Pen (Vector Laboratories Cat. No. 310018) exclusively - other barrier pens may fail during the procedure [24].
- Flick or tap slides to remove residual reagent, but never let slides dry completely at any step [42].
- Maintain adequate humidity in the HybEZ Humidity Control Tray by keeping humidifying paper wet [24].
The Scientist's Toolkit: Essential Research Reagents
Table 3: Critical Reagents for RNAscope Success
| Reagent/Equipment | Specification | Function | Notes |
|---|---|---|---|
| Slides | Superfrost Plus (Fisher #12-550-15) | Tissue adhesion | Critical - other slides cause detachment |
| Barrier Pen | ImmEdge (Vector #310018) | Creates hydrophobic barrier | Only pen that maintains barrier throughout procedure |
| Control Probes | PPIB/POLR2A (positive) dapB (negative) | Assay quality control | PPIB should score ≥2; dapB should score <1 |
| Mounting Media | CytoSeal XYL (Brown) EcoMount/PERTEX (Red) | Preserves staining | Assay-specific requirements |
| Hybridization System | HybEZ Oven | Maintains temperature/humidity | Required for proper hybridization |
| Fixative | Fresh 10% NBF | Tissue preservation | Fix for 16-32 hours |
| Protease | RNAscope Protease Plus/III/IV | Tissue permeabilization | Type depends on sample |
Quantitative Analysis and Scoring Guidelines
Proper quantification of RNAscope results is essential for accurate data interpretation. The technology uses a semi-quantitative scoring system based on counting punctate dots per cell, with each dot representing a single RNA molecule [24] [50].
Table 4: RNAscope Semi-Quantitative Scoring Guidelines
| Score | Criteria | Interpretation |
|---|---|---|
| 0 | No staining or <1 dot/10 cells | Negative expression |
| 1 | 1-3 dots/cell | Low expression |
| 2 | 4-9 dots/cell, none or very few dot clusters | Moderate expression |
| 3 | 10-15 dots/cell and <10% dots in clusters | High expression |
| 4 | >15 dots/cell and >10% dots in clusters | Very high expression |
Scoring should be performed at 20X magnification. If <5% of cells score 1 and >95% of cells score 0, a score of 0 is given. If 5-30% of cells score 1 and >70% of cells score 0, a score of 0.5 is assigned [24] [42].
For advanced quantification, digital image analysis tools such as HALO software or open-source alternatives like QuPath can provide quantitative cell-by-cell gene expression data and spatial expression patterns across entire tissue sections [50].
Effective troubleshooting of RNAscope experiments requires understanding the technology's core principles, particularly the double Z probe design that enables specific signal amplification while suppressing background. By implementing systematic diagnostic approaches using control probes, optimizing pretreatment conditions based on sample characteristics, and adhering to strict protocols for slide preparation and hydration maintenance, researchers can overcome the common challenges of no signal, high background, and tissue detachment. This comprehensive approach ensures reliable, reproducible results that leverage the full potential of spatial genomics within the morphological context of intact cells and tissues.
Best Practices for Manual and Automated Assays on Ventana and Leica Platforms
RNAscope Technology is a novel in situ hybridization (ISH) assay that represents a major advance over traditional RNA ISH methods for detecting target RNA within intact cells [24]. Its core principle lies in a proprietary signal amplification and background suppression system that allows for single-molecule visualization while preserving tissue morphology [1]. This technical guide outlines best practices for implementing RNAscope assays across both manual and automated platforms, specifically focusing on the Ventana DISCOVERY and Leica BOND RX systems. Understanding these protocols is essential for researchers and drug development professionals seeking to generate reliable, high-quality spatial genomic data within their research contexts.
Core Technology Principles: The RNAscope Assay
Proprietary Probe Design and Signal Amplification
The exceptional sensitivity and specificity of RNAscope stem from its unique "double Z" probe design [2]. This design functions similarly to a molecular AND gate: amplification occurs only when two independent probes hybridize adjacently to the target RNA sequence.
- Probe Architecture: Each target probe consists of three elements: a lower 18-25 base region complementary to the target RNA, a spacer sequence, and a 14-base tail sequence [2].
- Specificity Mechanism: Pairs of these "Z" probes must bind contiguously to a target region (~50 bases). Their two tail sequences then form a 28-base hybridization site for the pre-amplifier [1]. It is statistically improbable for non-specifically bound probes to form this site, thereby preventing background amplification [2].
- Amplification Cascade: The pre-amplifier binding initiates a hierarchical amplification process. Each pre-amplifier contains multiple binding sites for amplifiers, which in turn host numerous sites for label probes conjugated with fluorescent molecules or chromogenic enzymes [2]. This cascade can theoretically yield up to 8000 labels for a single target RNA molecule [1].
Figure 1: RNAscope Signal Amplification Cascade. The double Z probes must bind adjacently to the target RNA to create a binding site for the pre-amplifier, initiating a hierarchical signal amplification that results in a detectable punctate dot.
Key Advantages for Research
This technology offers several critical advantages for principle research applications [2]:
- Single-Molecule Sensitivity: The 20x20x20 probe design enables visualization of individual RNA molecules as distinct dots.
- High Specificity: The double Z design effectively suppresses background noise from non-specific hybridization.
- Degradation Resistance: With multiple short probe pairs targeting a 1kb region, the assay remains robust even with partially degraded RNA, common in archival FFPE samples.
Essential Materials and Reagent Solutions
Table 1: Essential Research Reagents and Materials for RNAscope Assays
| Item Category | Specific Product/Requirement | Function and Importance |
|---|---|---|
| Slides | Fisher Scientific SuperFrost Plus Slides | Prevents tissue detachment during stringent assay conditions [24]. |
| Barrier Pen | ImmEdge Hydrophobic Barrier Pen (Vector Labs) | Maintains a hydrophobic barrier throughout the procedure to prevent drying [24]. |
| Control Probes | Positive: PPIB, POLR2A, or UBCNegative: Bacterial dapB | Validates assay performance and sample RNA quality; essential for troubleshooting [40]. |
| Mounting Media | Chromogenic: CytoSeal XYL (Brown)Fluorescent: EcoMount or PERTEX | Media are assay-specific; using incorrect media affects signal preservation and visualization [24]. |
| Pretreatment Reagents | RNAscope Target Retrieval & Protease (Plus, III, or IV) | Unmasks target RNA and permeabilizes cells; type depends on sample and fixation [8]. |
| Equipment | HybEZ Hybridization System | Maintains optimum humidity and temperature (40°C) during critical hybridization steps [24]. |
Sample Preparation and Pretreatment
Critical Sample Preparation Guidelines
Proper sample preparation is the foundation for a successful RNAscope assay. Adherence to these protocols ensures RNA integrity and accessibility.
FFPE Tissue Protocol:
Frozen Tissue Protocol:
- Section thickness should be 7-15μm for fixed frozen and 10-20μm for fresh frozen tissue [40].
Pretreatment Optimization
Antigen retrieval conditions require optimization based on tissue type and fixation history [24]. The standard pretreatment involves:
- Target Retrieval: Boiling in citrate buffer (pH 6) for 15 minutes [1].
- Protease Digestion: Apply Protease Plus (or equivalent) at 40°C for 15-30 minutes to permeabilize tissue [24] [8].
For samples deviating from recommended fixation (e.g., over-fixed tissues), adjust Protease time in 10-minute increments and retrieval time in 5-minute increments [24].
Manual and Automated Assay Workflows
Core Manual Workflow Guidelines
The manual assay can be completed in 7-8 hours or conveniently split over two days [24]. Key workflow considerations include:
- Reagent Handling: Warm probes and wash buffer to 40°C to dissolve precipitates that form during storage [24].
- Slide Processing: Flick slides to remove residual reagent but do not let slides dry out at any time. Ensure the hydrophobic barrier remains intact [24].
- Amplification Steps: Apply all amplification steps in sequence; missing any step will result in no signal [24].
- Detection: Follow specific mounting media requirements for your assay type (e.g., CytoSeal XYL for Brown assay, EcoMount for Red assay) [24].
Figure 2: RNAscope Core Workflow. The assay procedure involves critical steps from sample preparation through to quantitative analysis, with specific temperature and reagent requirements at each stage.
Automated Platform Protocols
Table 2: Automated Platform Settings for Ventana and Leica Systems
| Parameter | Ventana DISCOVERY XT/ULTRA | Leica BOND RX |
|---|---|---|
| Standard Retrieval | Follow vendor user manual | 15 min Epitope Retrieval 2 (ER2) at 95°C [24] |
| Standard Protease | Follow vendor user manual | 15 min Protease at 40°C [24] |
| Milder Pretreatment | Not specified | 15 min ER2 at 88°C and 15 min Protease at 40°C [24] |
| Extended Pretreatment | Adjust Pretreat 2 (boiling) and/or protease times [24] | Increase ER2 by 5-min and Protease by 10-min increments [24] |
| Key Instrument Notes | - Uncheck "Slide Cleaning" option- Use DISCOVERY 1X SSC Buffer only- Perform decontamination every 3 months [24] | - Use "Mock probe" and "Bond wash" containers with 1x Bond Wash Solution- Do not alter the staining protocol [24] |
Ventana Platform Critical Checks:
- Software Settings: Uncheck the Slide Cleaning option. For software version 2.0, the fully automated setting is applicable only for brain and spinal cord samples [24].
- Buffer Compatibility: Use DISCOVERY 1X SSC Buffer only, diluted 1:10. Do not use the Benchmark 10X SSC Buffer [24].
- Maintenance: Schedule decontamination protocols every three months to prevent microbial growth in fluidic lines [24].
Leica Platform Considerations:
- The RNAscope 2.5 LS assays utilize Leica's detection kits (Bond Polymer Refine Detection for Brown; Bond Polymer Refine Red Detection for Red). No other chromogen kits should be used [24].
- Hematoxylin incubation time can be adjusted according to user preference without affecting RNAscope results [24].
Data Interpretation and Quantification
RNAscope Scoring Guidelines
The RNAscope assay uses a semi-quantitative scoring system based on the number of dots per cell rather than signal intensity. The dot count correlates directly with RNA copy numbers [24].
Table 3: Semi-Quantitative Scoring Guidelines for RNAscope Assays
| Score | Criteria | Interpretation |
|---|---|---|
| 0 | No staining or <1 dot/10 cells | No significant expression |
| 1 | 1-3 dots/cell | Low expression level |
| 2 | 4-9 dots/cell; none or very few dot clusters | Moderate expression |
| 3 | 10-15 dots/cell; <10% dots in clusters | High expression |
| 4 | >15 dots/cell; >10% dots in clusters | Very high expression |
Control Probe Validation and Troubleshooting
- Successful Assay Parameters: Positive control (PPIB/POLR2A) should score ≥2, and UBC should score ≥3. The negative control (dapB) should score <1, indicating minimal background [40].
- Troubleshooting Guide:
- No Signal: Check RNA integrity, ensure all amplification steps were performed, verify protease activity, and confirm probe hybridization temperature.
- High Background: Reduce protease time, check specific probe concentration, ensure adequate washing, and verify fresh reagent preparation.
- Tissue Detachment: Use SuperFrost Plus slides exclusively, verify fixation quality, and avoid over-digestion during protease step.
Implementing RNAscope technology with proper manual techniques or automated protocols on Ventana and Leica platforms enables highly sensitive and specific spatial gene expression analysis. The core double-Z probe design principle provides the foundation for single-molecule detection in intact cells and tissues. By adhering to the detailed sample preparation, platform-specific optimization, and rigorous scoring guidelines outlined in this technical guide, researchers can reliably generate high-quality data that advances principle research in genomics and drug development.
Validating RNAscope: Performance Metrics and Comparison with Other Spatial Transcriptomic Technologies
Spatial genomics has emerged as a critical field for understanding gene expression within morphological contexts, with RNAscope in situ hybridization (ISH) technology representing a significant advancement for visualizing RNA within intact cells. As novel high-throughput technologies like single-nucleus RNA sequencing (snRNA-seq) gain prominence, establishing correlation with established methods such as quantitative PCR (qRT-PCR) and RNAscope becomes essential for validating spatial expression data. This technical guide examines the principles, correlation evidence, and methodological frameworks for cross-platform validation of gene expression analysis, providing researchers with a comprehensive resource for verifying spatial genomic data within the broader context of RNAscope technology applications.
Principles of RNAscope Technology and Correlation Imperative
RNAscope technology represents a paradigm shift in RNA in situ hybridization through its proprietary double-Z probe design that enables single-molecule visualization while preserving tissue morphology. The core principle involves a series of target probes specifically designed to hybridize to the target RNA molecule, with each probe containing an 18-25 base region complementary to the target RNA, a spacer sequence, and a 14-base tail sequence. The requirement for adjacent probe binding (forming a 28-base hybridization site) ensures exceptional specificity by making non-specific hybridization statistically unlikely [2] [1].
The fundamental need for correlation studies stems from the distinct advantages and limitations of each gene expression analysis platform. While RNAscope provides spatial context at single-cell resolution, qRT-PCR offers precise quantification, and snRNA-seq delivers comprehensive transcriptional profiling. Each method captures different aspects of molecular phenotypes: qRT-PCR and RNA-seq quantify transcript abundance, while RNAscope localizes expression within tissue architecture. Understanding the correlation between these methods is essential for data interpretation, especially in clinical applications where validation across platforms strengthens biomarker credibility [51] [1].
Correlation Evidence: Quantitative Data Across Platforms
RNAscope and qRT-PCR Correlation
Studies have demonstrated that RNAscope provides quantitative data strongly correlating with qRT-PCR measurements. The technology's design enables single-molecule sensitivity through its 20ZZ probe pairs targeting approximately 1kb of the RNA molecule, creating a robust system capable of detecting even low-abundance transcripts. The signal amplification system generates up to 8000 labels for each target RNA molecule, providing the sensitivity required for accurate quantification comparable to qRT-PCR [1].
RNAscope validation typically involves comparison with qRT-PCR using housekeeping genes like PPIB (Cyclophilin B), UBC (Ubiquitin C), or POLR2A as positive controls, with successful staining requiring a PPIB/POLR2A score ≥2 or UBC score ≥3. The bacterial dapB gene serves as a negative control with expected scores <1. This systematic approach to validation ensures that RNAscope data maintains consistency with PCR-based quantification while adding the crucial dimension of spatial localization [40] [8].
qPCR and RNA-seq Correlation Challenges
Direct comparisons between qPCR and RNA-seq reveal significant technical challenges in correlation, particularly for complex gene families like the human leukocyte antigen (HLA) system. Analysis of HLA class I genes demonstrates moderate correlation between expression estimates from qPCR and RNA-seq, with correlation coefficients ranging from 0.2 to 0.53 for HLA-A, -B, and -C genes [51].
Table 1: Correlation Between qPCR and RNA-seq for HLA Class I Genes
| Gene | Correlation Coefficient (ρ) | Technical Challenges |
|---|---|---|
| HLA-A | 0.2 ≤ ρ ≤ 0.53 | Alignment difficulties due to extreme polymorphism |
| HLA-B | 0.2 ≤ ρ ≤ 0.53 | Cross-alignments between paralogs |
| HLA-C | 0.2 ≤ ρ ≤ 0.53 | Incomplete representation of diversity in reference genomes |
| Overall | Moderate correlation | Biases from library preparation, batch effects, GC content |
These correlation challenges stem from multiple technical factors, including alignment difficulties due to extreme polymorphism at HLA genes, cross-alignments among paralogs, and incomplete representation of allelic diversity in reference genomes. Additionally, both technologies exhibit inherent biases including batch effects, library preparation variations, and GC content influences that complicate direct correlation [51].
snRNA-seq Integration with Spatial Methods
Single-nucleus RNA-seq provides unprecedented resolution for identifying cell type-specific responses but requires validation through spatial methods like RNAscope. A recent study investigating root-microbiome interactions demonstrated how snRNA-seq can identify localized immune responses in specific root zones, with subsequent RNAscope validation providing spatial confirmation of transcriptional patterns [52].
The protoplasting-free snRNA-seq approach elegantly avoids perturbations during sample processing, enabling more accurate profiling of real-time gene expression changes in response to microbial interactions. This methodological advancement facilitates more reliable correlation with spatial techniques by preserving native transcriptional states [52].
Experimental Protocols for Cross-Platform Validation
RNAscope Assay Workflow
The standardized RNAscope assay workflow consists of five critical stages that must be rigorously followed to ensure reproducible results suitable for cross-platform validation [2] [8]:
Sample Preparation: Tissue sections or cells are fixed onto slides and pretreated to unmask target RNA and permeabilize cells. For FFPE tissues, sections should be cut at 5±1μm thickness and fixed in 10% neutral-buffered formalin for 16-32 hours at room temperature [40].
Hybridization: Approximately 20 target-specific double Z probes hybridize to target RNA molecules. Probes are designed using custom software to select sequences with compatible melting temperature and minimal cross-hybridization to off-target sequences [1].
Amplification: Sequential hybridization of amplifiers and label probes amplifies specific signals. The branched DNA system provides significant signal amplification while the double Z design suppresses background noise [2].
Visualization: Each punctate dot represents a single target RNA molecule visualized via chromogenic or fluorescent detection. Microscopic analysis allows for spatial resolution at the single-cell level [2].
Quantification: Single-molecule signals are quantified manually or using automated image analysis software such as HALO, QuPath, ImageJ, or CellProfiler [8].
Table 2: Essential Research Reagents for RNAscope Validation
| Reagent Category | Specific Examples | Function |
|---|---|---|
| Control Probes | PPIB, POLR2A, UBC (positive); dapB (negative) | Verify RNA quality and assay specificity |
| Pretreatment Kits | RNAscope Pretreatment Kit | Unmask target RNA and permeabilize cells |
| Protease Reagents | Protease Plus, Protease III, Protease IV | Permeabilize membranes and degrade RNA-bound proteins |
| Detection Reagents | Chromogenic (DAB, Fast Red) or Fluorescent labels | Enable visualization of target RNA |
| Control Slides | Human Hela Cell Pellet, Mouse 3T3 Cell Pellet | Verify assay workflow performance |
snRNA-seq Wet Lab Protocol
For snRNA-seq correlation studies, the following protocol ensures high-quality nuclei preparation [52]:
Treatment Conditions: Apply experimental conditions (e.g., pathogen/beneficial microbe exposure) for predetermined duration (6 hours in root-microbe studies).
Tissue Harvesting: Collect tissue (whole roots 5-7 cm in plant studies) and immediately process for nuclei isolation.
Nuclei Isolation: Use protoplasting-free approach to minimize transcriptional perturbations. Employ gentle mechanical disruption followed by filtration and centrifugation.
Quality Control: Assess nuclei integrity and count using automated cell counters or microscopy.
Library Preparation: Utilize standard snRNA-seq workflows (10X Genomics) with appropriate kit-based reagents.
Sequencing: Perform sequencing on Illumina platforms to adequate depth (median gene count ~1000 genes/nucleus).
Bioinformatics Analysis Pipeline
Accurate expression analysis from RNA-seq data requires specialized bioinformatic approaches [51]:
Read Alignment: Use HLA-aware alignment tools that account for extreme polymorphism rather than standard reference genomes.
Expression Quantification: Employ tools specifically designed for HLA expression estimation to minimize bias from cross-alignments.
Normalization: Apply appropriate normalization methods to account for technical variations between samples.
Differential Expression: Identify significantly differentially expressed genes using statistical methods that account for multiple testing.
Correlation Analysis: Calculate correlation coefficients between qPCR and RNA-seq expression values for matched samples.
Analytical Framework for Data Interpretation
RNAscope Scoring System
RNAscope employs a semi-quantitative scoring system that correlates with transcriptional abundance [40] [8]:
- Score 0: No staining or <1 dot per 10 cells
- Score 1: 1-3 dots per cell (rare cells may have >3 dots)
- Score 2: 4-9 dots per cell (few cells may have >10 dots)
- Score 3: 10-15 dots per cell (less than 10% of cells have >15 dots)
- Score 4: >15 dots per cell in most cells
This scoring system enables systematic comparison with qRT-PCR data, with scores ≥2 for PPIB/POLR2A or ≥3 for UBC indicating successful staining with adequate RNA quality.
Correlation Assessment Methodology
When correlating across platforms, researchers should [51]:
Analyze Matched Samples: Use the same biological source for all methodological comparisons to minimize biological variation.
Include Technical Replicates: Perform multiple technical replicates for each method to assess technical variability.
Utilize Multiple Controls: Include positive and negative controls for each platform to ensure proper technical performance.
Apply Appropriate Statistical Tests: Use non-parametric correlation measures (Spearman's ρ) when normal distribution cannot be assumed.
Account for Batch Effects: Implement experimental designs that randomize processing across methods to avoid confounding technical batches with biological signals.
Implementation Workflow
The following diagram illustrates the integrated workflow for establishing correlation across transcriptomic platforms:
Establishing strong correlation between RNAscope, qRT-PCR, and snRNA-seq data is fundamental for validating spatial genomic findings. While each platform offers unique advantages—RNAscope provides spatial context, qRT-PCR delivers precise quantification, and snRNA-seq enables comprehensive profiling—their integration requires careful experimental design and analytical rigor. The moderate correlation observed between some molecular methods highlights the necessity of multi-platform validation strategies, particularly for complex gene families. By implementing the standardized protocols, analytical frameworks, and validation workflows presented in this guide, researchers can confidently translate findings across platforms, accelerating the development of robust spatial genomic biomarkers for research and clinical applications.
RNAscope technology represents a groundbreaking in situ hybridization (ISH) platform that enables the detection of target RNA within intact cells with exceptional sensitivity and specificity [2]. Its core principle lies in a proprietary double Z probe design that amplifies target-specific signals while suppressing background noise from non-specific hybridization [2] [1]. This unique design allows for single-molecule visualization, with each punctate dot representing an individual RNA transcript [16]. The ability to detect and quantify RNA at the single-molecule level while preserving tissue morphology makes RNAscope particularly valuable for spatial genomic analysis in molecular pathology, neuroscience, and drug development research.
Unlike "grind-and-bind" RNA analysis methods such as RT-qPCR, RNAscope maintains the histological context of gene expression, allowing researchers to examine biomarker status within the architectural framework of clinical specimens [1]. This technical advance addresses a critical limitation in molecular diagnostics by bringing the benefits of in situ analysis to RNA biomarkers, enabling more accurate cellular mapping of gene expression patterns in diverse tissue types [1].
Core Technology Principles Enabling Quantification
The Double Z Probe Design Strategy
The foundation of RNAscope's quantitative capability lies in its innovative probe design strategy, which functions similarly to fluorescence resonance energy transfer (FRET) systems [2]. This approach requires two independent probes (double Z probes) to hybridize to the target sequence in tandem for signal amplification to occur [2]. The statistical improbability of two independent probes hybridizing adjacent to each other at a non-specific target ensures selective amplification of target-specific signals while effectively suppressing background noise [2].
Each target Z probe contains three essential elements [2]:
- An 18-25 base region complementary to the target RNA
- A spacer sequence linking the two components
- A 14-base tail sequence
For each target RNA, approximately 20 double Z target probe pairs are designed to specifically hybridize to the target molecule [2]. This high level of probe redundancy ensures robust detection even for partially degraded or incompletely unmasked RNA targets, making the technology particularly suitable for archival formalin-fixed, paraffin-embedded (FFPE) tissue samples [2] [8].
Signal Amplification Mechanism
The RNAscope signal amplification system employs a cascade of hybridization events that enables single-molecule detection [2]:
- Double Z target probes hybridize to the RNA target
- Pre-amplifiers hybridize to the 28-base binding site formed by each double Z probe
- Amplifiers bind to the multiple binding sites on each pre-amplifier
- Labeled probes, containing fluorescent molecules or chromogenic enzymes, bind to the numerous binding sites on each amplifier
This multi-stage amplification strategy can theoretically yield up to 8000 labels for each target RNA molecule, providing the sensitivity necessary for detecting individual transcripts while maintaining excellent signal-to-noise ratios [1]. The requirement for contiguous binding of two probes for pre-amplifier attachment provides an additional layer of specificity that distinguishes RNAscope from earlier ISH methodologies [1].
Semi-Quantitative Scoring Framework
Scoring System for RNAscope Assays
RNAscope assays employ a semi-quantitative scoring system that evaluates the number of punctate dots per cell rather than signal intensity [8]. This approach directly correlates with transcript abundance, as each dot represents an individual RNA molecule [16]. The scoring system is applied by comparing target gene expression with both negative and positive controls [8].
Table 1: Semi-Quantitative Scoring Guidelines for RNAscope Assays
| Score | Description | Punctate Dots/Cell | Interpretation |
|---|---|---|---|
| 0 | No staining | 0 | Negative expression |
| 1 | Rare, discernible dots | 1-3 | Very low expression |
| 2 | Occasional dots | 4-10 | Moderate expression |
| 3 | Numerous dots | 11-30 | High expression |
| 4 | Abundant dots | >30 | Very high expression |
For a successful RNAscope experiment, positive control probes (PPIB, UBC, or POLR2A) should typically yield a score of ≥2 for PPIB/POLR2A or ≥3 for UBC, while negative control probes (dapB) should score <1 [8]. This quality control measure ensures both RNA integrity and appropriate assay conditions.
Control Probes and Validation
The implementation of proper controls is essential for accurate semi-quantitative scoring in RNAscope assays [8]:
Positive Control Probes: Housekeeping genes such as PPIB (Cyclophilin B), UBC, or POLR2A verify tissue RNA integrity and assay procedure [8]. Successful staining should demonstrate easily visible signals under a 10× objective lens [1].
Negative Control Probes: The bacterial gene dapB assesses background noise and non-specific hybridization [1] [8]. A score of <1 indicates acceptable background levels.
Sample Quality Assessment: Tissue quality is evaluated through RNAscope analysis of housekeeping gene mRNA, with inadequate staining indicating potential RNA degradation or suboptimal pretreatment conditions [1].
Experimental Protocols for Semi-Quantitative Analysis
Sample Preparation Methods
Formalin-Fixed Paraffin-Embedded (FFPE) Tissues [1]:
- Tissue sections (5μm thickness) are deparaffinized in xylene and dehydrated in an ethanol series
- Antigen retrieval performed in citrate buffer (10mmol/L, pH 6) at 100-103°C for 15 minutes
- Protease treatment (10μg/mL) at 40°C for 30 minutes to permeabilize cell membranes and unmask RNA targets
Fresh Frozen Tissues [11]:
- Tissue snap-freezing in 2-methylbutane at -30°C to preserve RNA integrity
- Cryostat sectioning at 10μm thickness
- Fixation in 4% formaldehyde for 60 minutes
Cultured Cells and Non-Adherent Cells [53]:
- Cytospin centrifugation to concentrate low-cellularity samples on glass slides
- Fixation in 4% formaldehyde for 60 minutes
- Protease digestion (2.5μg/mL) at 23-25°C
RNAscope Assay Workflow
The standard RNAscope procedure follows a consistent workflow regardless of sample type [2] [1]:
Pretreatment: Target retrieval and protease application to unmask target RNA and permeabilize cells [2] [8]
Hybridization: Target-specific probes hybridize to RNA molecules in hybridization buffer at 40°C for 2-3 hours [1]
Signal Amplification: Sequential hybridization with pre-amplifier (30 minutes), amplifier (15 minutes), and label probe (15 minutes) at 40°C [1]
Detection: Chromogenic development using Fast Red or DAB, or fluorescent detection with spectrally distinct fluorophores [1]
Visualization and Analysis: Microscopic examination and quantification of punctate signals [2]
RNAscope Experimental Workflow
Multiplex Assay Protocols
RNAscope enables simultaneous detection of multiple RNA targets through multiplex assays [53] [11]:
Fluorescent Multiplex Detection [11]:
- Target probes for different genes assigned to different channels (C1, C2, C3)
- C1 channel probes are ready-to-use (RTU)
- C2 and C3 probes supplied as 50× concentrated stock, diluted with C1 RTU probe or blank diluent
- Simultaneous hybridization with pooled probes
- Sequential amplification and detection with spectrally distinct fluorophores (Alexa Fluor 488, 546, 647, or 750)
Combined RNA-ISH and Protein ICC [53]:
- RNAscope ISH performed first with gentle chemistry to preserve protein epitopes
- Followed by immunocytochemistry using identical buffers for epitope retrieval
- Enables correlation of mRNA and protein expression in the same cell
Quantitative Analysis Methods
Manual and Automated Quantification Approaches
Manual Counting [2]:
- Direct visualization and counting of punctate dots per cell
- Practical for small sample sizes or limited target numbers
- Labor-intensive and time-consuming for large studies
Automated Image Analysis [2] [11]:
- HALO Software: Commercial platform for automated image analysis
- QuPath: Open-source bioimage analysis software with built-in algorithms for cell detection and machine learning [11]
- Custom Scripts: Tailored solutions for specific experimental needs
Establishing Quantification Thresholds
Standardized quantification requires establishing rigorous thresholds for defining positive signals [11]:
Negative Control-Based Thresholding:
- Analyze negative control (dapB) slides to establish background levels
- Set threshold at 3 standard deviations above mean negative control signal
- Apply uniform threshold across all experimental samples
Cell Detection Optimization:
- Adjust fluorescence intensity thresholds for accurate cell identification
- Validate automated cell detection against manual counts
- Optimize parameters for specific tissue types and staining conditions
Signal Quantification:
- For low-abundance transcripts: Count individual punctate dots per cell
- For high-abundance transcripts: Measure median fluorescence intensity (MFI) when puncta overlap [53]
Table 2: Comparison of Quantitative Analysis Methods
| Method | Applications | Advantages | Limitations |
|---|---|---|---|
| Manual Counting | Small studies, low-plex experiments | Direct visualization, no specialized software | Labor-intensive, subjective, low throughput |
| HALO Software | Medium to high-throughput studies | Automated, reproducible, comprehensive analysis | Commercial license required, computational resources |
| QuPath | Academic studies, custom analyses | Open-source, flexible, machine learning capabilities | Requires technical expertise, method development |
| Dot Counting | Low to moderate expression targets | Direct correlation with transcript number | Limited for high-copy transcripts with fused puncta |
| Fluorescence Intensity | High expression targets, multiplex studies | Suitable for dense signals, faster analysis | Indirect measure, potential background influence |
Essential Research Reagents and Materials
Table 3: Essential Research Reagent Solutions for RNAscope
| Reagent Category | Specific Examples | Function | Application Notes |
|---|---|---|---|
| Pretreatment Reagents | RNAscope Target Retrieval, Protease Plus, Protease III, Protease IV [8] | Unmask target RNA, permeabilize cells | Optimization required for different sample types |
| Control Probes | PPIB (positive), UBC (positive), dapB (negative) [8] | Assess RNA quality, assay performance, background | Species-specific controls essential |
| Detection Systems | Chromogenic (DAB, Fast Red), Fluorescent (Alexa Fluor dyes) [1] | Visualize target RNA molecules | Fluorophore choice depends on microscope capabilities |
| Hybridization System | HybEZ II Oven, Humidity Control Tray [11] | Maintain precise temperature and humidity | Critical for assay reproducibility |
| Image Analysis Tools | HALO, QuPath, ImageJ, CellProfiler [8] [11] | Quantify RNA signals, cell detection | Validation against manual counts recommended |
Advanced Applications and Technical Considerations
Specialized Applications
Neuroscience Research [11]:
- Characterization of neuronal cell types in rodent brains
- Multiplex detection of up to 48 low-abundance mRNAs in single cells (hi-plexing)
- Whole-brain quantitative analysis or selected region analysis
- Combination with immunohistochemistry for cell-type specific mapping
Immunology and Cell Activation Studies [53]:
- Analysis of rare cell populations (e.g., naïve CD8+ T cells)
- Detection of subtle variations in gene expression kinetics
- Correlation with protein expression through combined ISH/ICC
- Small sample applications (cytospin preparations of PBMCs)
Clinical Biomarker Development [1]:
- Translation of RNA biomarkers from discovery to clinical diagnostics
- Spatial analysis within pathological context
- Compatibility with archival FFPE specimens
- Multiplexing for pathway analysis and biomarker signatures
Technical Optimization Guidelines
Pretreatment Optimization [8]:
- Tissue-specific optimization of protease concentration and incubation time
- Assessment of different target retrieval conditions
- Systematic variation of pretreatment parameters for new sample types
- Validation using positive and negative controls
Multiplex Assay Design [11]:
- Strategic assignment of probes to channels based on expression levels
- Validation of spectral separation between fluorophores
- Controls for cross-channel bleed-through
- Sequential amplification for high-plex experiments
Troubleshooting Common Issues:
- Inadequate signal: Optimize pretreatment, verify RNA quality
- High background: Adjust protease concentration, verify probe specificity
- Tissue damage: Reduce protease concentration or incubation time
- Inconsistent staining: Standardize fixation protocols, ensure consistent hybridization conditions
RNAscope Signal Amplification Mechanism
RNAscope technology provides an unprecedented platform for spatial genomic analysis through its robust semi-quantitative scoring framework. The ability to visualize and quantify RNA transcripts from single molecules to high-copy transcripts within their morphological context represents a significant advancement in molecular pathology and biomedical research. The standardized scoring guidelines, combined with appropriate controls and validation methods, enable researchers to obtain reliable, reproducible data that bridges the gap between discovery-based genomics and functional tissue context.
As the field of spatial genomics continues to evolve, RNAscope's compatibility with automated platforms, multiplexing capabilities, and integration with complementary techniques positions it as an essential tool for understanding gene expression patterns in health and disease. The semi-quantitative framework outlined in this guide provides researchers with a solid foundation for implementing this powerful technology across diverse applications from basic research to clinical diagnostics.
Spatial transcriptomics (ST) technologies are revolutionizing our understanding of intra-tumor heterogeneity and the tumor microenvironment by revealing single-cell molecular profiles within their spatial tissue context [54] [55]. The rapid development of spatial transcriptomics methods, each with unique characteristics, makes it challenging to select the most suitable technology for specific research objectives [54]. These technologies can be broadly classified into sequencing-based (sST) and imaging-based (iST) approaches [54]. Sequencing-based analysis employs a readout through sequencing after transcripts have been released from the sample and captured directly or via hybridized probes, allowing for an unbiased analysis of the whole transcriptome [54]. In contrast, imaging-based methods use multiplexed single-molecule RNA fluorescence in situ hybridization (smRNA-FISH) in a targeted manner, as defined by the probe panel, along with transcript identification through imaging [54] [56].
This technical guide provides an in-depth comparison of four imaging-based approaches—RNAscope HiPlex, Molecular Cartography, Merscope, and Xenium—alongside Visium, a sequencing-based method, based on a landmark study that utilized these technologies to study cryosections of medulloblastoma with extensive nodularity (MBEN), a tumor chosen for its distinct microanatomical features [54] [55] [57]. The MBEN tumor model, with its segregation into internodular (proliferating cells with stromal, vascular, and immune cells) and nodular compartments (postmitotic, neuronally differentiated malignant cells), provides an excellent test case for evaluating the ability of these technologies to resolve complex tissue architectures [54].
Technology Principles and Workflows
Core Principles of RNAscope and Imaging-Based Spatial Transcriptomics
The fundamental principle underlying all major imaging-based spatial transcriptomics technologies is fluorescence in situ hybridization (FISH), which detects specific RNA or DNA sequences by hybridizing fluorescently labeled probes directly to target molecules, enabling spatial localization [56]. RNAscope HiPlex represents an evolution of the core RNAscope technology, which employs a proprietary signal amplification system that enables simultaneous detection of multiple RNA targets within individual cells in their native tissue context [54] [57]. This methodology differs significantly from sequencing-based approaches that lose spatial context through tissue dissociation [54].
The three automated imaging-based platforms compared in this study—Molecular Cartography (Resolve Biosciences), Merscope (Vizgen), and Xenium (10x Genomics)—leverage variations of smRNA-FISH protocols with different implementations of signal amplification, error correction, and detection methodologies [54]. The most prominent differences include the presence (Xenium, RNAscope) or absence (MC, Merscope) of secondary signal amplification and clearing of the tissue section (Merscope only) [54]. These technical variations significantly impact signal-to-noise ratios, sensitivity, and specificity across platforms [54].
Experimental Workflow Comparison
The following diagram illustrates the core workflows and logical relationships between the different spatial transcriptomics technologies discussed in this review:
Spatial Transcriptomics Technologies Workflow Relationships
For Visium and RNAscope experiments, image acquisition is decoupled from transcript detection and decoding [54]. For Visium, H&E images are acquired on a slide scanner, while RNAscope iST data is acquired by spinning disk confocal microscopy (SDCM) [54]. In contrast, the commercial Molecular Cartography, Merscope, and Xenium instruments provide automated image acquisition on built-in wide-field fluorescence microscopes, with systems differing in objectives, cameras, and preprocessing software [54]. All three automated systems generally decode transcript identities from fluorescent signals across several rounds of staining, imaging, and destaining, yielding transcript coordinates and a matching tissue map as a DAPI image [54].
A critical technological differentiator is the capability for slide reimaging. Both Molecular Cartography and Xenium allow for reimaging of slides after the spatial transcriptomics analysis, which can significantly improve cell segmentation accuracy and integrate additional transcript and protein readouts [54] [55]. Merscope samples, however, are less suitable for reimaging due to their slide format and sample clearing [54] [58]. This capability expands the analytical possibilities and depth of insight that can be gained from a single sample [54].
Methodologies: Experimental Protocols and Technical Parameters
Sample Preparation and Platform-Specific Processing
The comparative analysis of ST technologies was performed on fresh frozen tissue sections from four distinct MBEN patients [54] [55]. All iST panels encompassed the 10 genes from RNAscope, while MC, Merscope, and Xenium panels shared 96 genes [54]. The MBEN tumor microanatomy was clearly visible in H&E staining, and its structure was highlighted by all iST methods at the transcript level, with NRXN3 and LAMA2 serving as marker genes for the nodular and internodular compartments, respectively [54].
For the RNAscope HiPlex protocol, samples underwent standard fixation and permeabilization followed by hybridization with target-specific probes [54]. Signal amplification was achieved through sequential hybridization and detection steps, with imaging performed using spinning disk confocal microscopy (SDCM) [54]. The Molecular Cartography workflow involved hybridizing fluorescently labeled probes with signal detection on the MC 1.0 instrument using a 50x magnification objective with numerical aperture (NA) of 1.2 [54] [55]. The Merscope implementation of MERFISH employed a 60x objective (NA 1.4) with sample clearing as a distinctive step in its protocol [54] [55]. The Xenium platform utilized barcoded padlock probes targeting RNA directly, with implementation on the Xenium Analyzer instrument [54] [55].
Image Acquisition and Resolution Analysis
To compare the resolution of the iST platforms, researchers imaged 0.31 µm multicolor fluorescent particles across all systems and analyzed the full width at half maximum (FWHM) [54]. The results revealed significant differences in optical performance:
- Molecular Cartography demonstrated the best FWHM at 352 ± 50 nm, potentially indicating a deconvolution step in the onboard image processing pipeline before image stitching [54]
- Xenium and Merscope showed very similar FWHM values of 474 ± 55 nm and 480 ± 85 nm, respectively [54]
- For comparison, spinning disk confocal microscopy images obtained with 40× and 60× oil immersion objectives used for RNAscope were also included in the analysis [54]
The optical resolution of these automated microscopy systems limits the separation of crowded (highly expressed) transcripts of the same gene and the total number of transcripts that can be detected [54]. However, transcripts of different genes can be separated even when localizing to the same pixel through intelligent combinatorial barcoding codebook design, a sufficiently large number of imaging rounds and colors, and inclusion of the z coordinates for decoding [54].
Performance Comparison: Quantitative Metrics
Sensitivity, Specificity, and Throughput Analysis
The following table summarizes the key performance metrics across the four imaging-based spatial transcriptomics technologies based on the comparative study using MBEN tumor cryosections:
Table 1: Performance Comparison of Imaging-Based Spatial Transcriptomics Platforms
| Parameter | RNAscope HiPlex | Molecular Cartography | Merscope | Xenium |
|---|---|---|---|---|
| Genes in Panel | 10 [54] | 100 [54] | 138 [54] | 345 [54] |
| Detected Features per Cell | Not specified | 21 ± 2 [55] | 23 ± 4 [55] | 25 ± 1 [55] |
| Detected Transcripts per Cell | Not specified | 74 ± 11 [55] | 62 ± 14 [55] | 71 ± 13 [55] |
| Correlation with RNAscope | Reference | r = 0.74 [55] | r = 0.65 [55] | r = 0.82 [55] |
| Average FDR (%) | Not specified | 0.35 ± 0.2 [55] | 5.23 ± 0.9 [55] | 0.47 ± 0.1 [55] |
| Probes with Low Specificity | Not specified | 12 ± 3 [55] | 17 ± 3 [55] | 7 ± 3 [55] |
| Run Time (days) | Manual process | 4 [55] | 1-2 [55] | 2 [55] |
| Hands-on Time (days) | Manual process | 1.5 [55] | 5-7 [55] | 1.5 [55] |
| Reimaging Capability | Yes [54] | Yes [54] [55] | No [54] [55] | Yes [54] [55] |
The data reveals that the sensitivity of all three automated iST platforms is high and very similar [58]. However, significant differences emerge in specificity metrics, with Merscope exhibiting a notably higher false discovery rate (5.23% ± 0.9%) compared to Molecular Cartography (0.35% ± 0.2%) and Xenium (0.47% ± 0.1%) [55]. Xenium demonstrated the highest correlation with RNAscope (r = 0.82), suggesting strong concordance with this established reference method [55].
Platform Selection Guidance Based on Research Objectives
The comparative analysis enables the creation of a framework for selecting appropriate spatial transcriptomics technologies based on specific research needs:
Table 2: Technology Selection Guide Based on Research Objectives
| Research Objective | Recommended Technology | Rationale |
|---|---|---|
| Validation of Small Gene Panels | RNAscope HiPlex | Established reference method with high specificity for focused gene sets [54] |
| High-Specificity Profiling | Molecular Cartography or Xenium | Lowest FDR rates (0.35-0.47%) ensure high data fidelity [55] |
| Rapid Turnaround | Merscope | Fastest instrument run time (1-2 days) [55] |
| Maximal Gene Coverage | Xenium | Largest gene panel (345 genes) with high sensitivity [54] [55] |
| Studies Requiring Additional Assays | Molecular Cartography or Xenium | Reimaging capability enables additional transcript/protein assays [54] [55] |
| Minimal Hands-on Time | Xenium or Molecular Cartography | Lowest hands-on time (1.5 days) [55] |
The study emphasized that 100 well-selected genes are more informative than several times that number of probes from a more generic catalog panel [58]. This finding underscores the importance of careful panel design regardless of the platform chosen. Additionally, optimizing DAPI imaging—regarding both staining and image acquisition—significantly enhances results across all platforms [58].
The Scientist's Toolkit: Essential Research Reagents and Materials
Successful spatial transcriptomics experiments require careful selection of reagents and materials tailored to each technology platform. The following table details key research reagent solutions and their specific functions based on the methodologies employed in the comparative study:
Table 3: Essential Research Reagent Solutions for Spatial Transcriptomics
| Reagent/Material | Function | Technology Applications |
|---|---|---|
| Fresh Frozen Tissue Sections | Preserves RNA integrity for optimal signal detection | All platforms (MBEN study used cryosections) [54] |
| DAPI Stain | Nuclear counterstain for cell segmentation and spatial context | All platforms [54] |
| Gene-Specific Probe Panels | Target RNA detection with high specificity | Platform-specific designs (10-345 genes) [54] [55] |
| Signal Amplification Reagents | Enhances detection sensitivity for low-abundance transcripts | RNAscope, Xenium (secondary amplification) [54] |
| Tissue Clearing Solutions | Reduces light scattering for improved imaging depth | Merscope (specific to its protocol) [54] |
| Hybridization Buffers | Optimizes probe binding efficiency and specificity | All platforms (composition varies by technology) [54] |
| Fluorescent Dyes/Reporters | Enables multiplexed detection through distinct spectral signatures | All platforms (varies by imaging rounds) [54] |
The study highlighted that analysis of distribution patterns through spatial autocorrelation and next-nearest-neighbor distance analysis offer valuable insights into probe specificity [58]. These analytical approaches should be considered when designing validation strategies for spatial transcriptomics experiments.
Discussion and Future Perspectives
The comparative analysis of spatial transcriptomics technologies reveals that automated imaging-based methods are well-suited to delineate intricate tissue microanatomy and capture cell-type-specific transcriptome profiles [54]. The MBEN tumor structure was highlighted by all iST methods at the transcript level, with clear differentiation between nodular and internodular compartments using marker genes NRXN3 and LAMA2 [54]. In contrast, the sequencing-based Visium analysis did not offer sufficient spatial resolution to distinctly delineate the two tumor compartments [54].
The performance metrics developed in this study—including sensitivity, specificity, and practical considerations like hands-on time and reimaging capability—provide a framework for informed method selection based on research objectives [54] [55]. While Xenium demonstrated strong overall performance with high correlation to RNAscope and the largest gene panel, each platform offers unique advantages that may be decisive for specific applications [54] [55].
Future developments in spatial transcriptomics will likely focus on increasing multiplexing capabilities while maintaining high sensitivity and specificity. Emerging technologies such as Seq-Scope, Stereo-seq, Slide-seq/Curio Seeker, and Visium HD offer greater subcellular spatial resolution [58], potentially addressing current limitations in resolving crowded transcript populations. The integration of spatial transcriptomics with other modalities, such as proteomics and chromatin accessibility, through reimaging approaches will further expand the analytical depth possible from precious clinical samples [54].
In conclusion, this head-to-head comparison provides researchers, scientists, and drug development professionals with critical insights for selecting appropriate spatial transcriptomics technologies. By understanding the technical capabilities, performance characteristics, and practical considerations of each platform, researchers can make informed decisions that optimize their experimental designs and maximize the biological insights gained from spatial transcriptomics studies.
Spatial transcriptomics technologies are revolutionizing molecular pathology by enabling single-cell resolution of gene expression within intact tissue architecture. Among these, RNAscope technology has established itself as a robust platform with exceptional sensitivity and specificity metrics. This technical guide examines the core principles underlying RNAscope's performance, focusing on its false discovery rate (FDR) characteristics and transcript detection efficiency. Through comparative analysis with emerging spatial transcriptomics platforms and detailed experimental protocols, we provide researchers with a comprehensive framework for evaluating and optimizing RNAscope assays in drug development and biomedical research applications.
RNAscope represents a breakthrough in RNA in situ hybridization (ISH) technology, employing a proprietary "double Z" probe design that fundamentally enhances signal-to-noise ratios compared to conventional approaches [1] [2]. This design strategy enables single-molecule visualization while preserving tissue morphology, making it particularly valuable for formalinfixed, paraffin-embedded (FFPE) tissue specimens commonly used in clinical and research settings [1].
The core innovation lies in the probe architecture: each target probe contains an 18-25 base region complementary to the target RNA, a spacer sequence, and a 14-base tail sequence [1] [2]. Pairs of these probes ("double Z") must hybridize contiguously to the target RNA (approximately 50 bases) to create a 28-base binding site for subsequent amplification components [2]. This requirement for dual adjacent binding events dramatically reduces nonspecific amplification because it is statistically improbable that two independent probes would hybridize nonspecifically to off-target sequences in immediate juxtaposition [1].
The signal amplification cascade employs a series of hybridization steps: pre-amplifiers bind to the assembled Z probes, followed by amplifiers that provide numerous binding sites for label probes [2]. This multi-layer amplification theoretically generates up to 8000 labels for each target RNA molecule when using 20 probe pairs [1]. The result is a punctate dot signal where each dot represents a single RNA transcript that can be visualized and quantified [16] [6].
RNAscope Signal Amplification Mechanism: The double-Z probe design requires adjacent binding for signal generation, ensuring high specificity and single-molecule sensitivity.
Performance Metrics: Comparative Analysis of Spatial Transcriptomics Platforms
Sensitivity and Specificity Benchmarks
Recent comparative studies of imaging-based spatial transcriptomics (iST) methods reveal distinct performance characteristics across platforms. A 2025 analysis examining RNAscope HiPlex, Molecular Cartography, Merscope, and Xenium demonstrated that each technology offers unique advantages in sensitivity and specificity profiles [55].
Sensitivity, defined as the probability that a given transcript is detected, varies significantly between platforms. The same study found that RNAscope consistently showed high correlation with reference methods (r = 0.82 compared to Xenium) while maintaining low background signal [55]. This high sensitivity enables detection of low-abundance transcripts that might be missed by other methods.
Specificity is reflected in the false discovery rate (FDR), representing incorrectly identified transcripts relative to total detections. RNAscope's double-Z probe design achieves exceptional specificity by requiring two independent probe binding events for signal generation, dramatically reducing non-specific hybridization [1] [2].
Quantitative Performance Comparison
Table 1: Performance Metrics of Imaging-Based Spatial Transcriptomics Platforms
| Parameter | RNAscope | Molecular Cartography | Merscope | Xenium |
|---|---|---|---|---|
| Detected Features Per Cell | 10-12 (HiPlex) | 21 ± 2 | 23 ± 4 | 25 ± 1 |
| Detected Transcripts Per Cell | Varies by panel | 74 ± 11 | 62 ± 14 | 71 ± 13 |
| Correlation with RNAscope | Reference | r = 0.74 | r = 0.65 | r = 0.82 |
| Average FDR (%) | <1% [1] | 0.35 ± 0.2 | 5.23 ± 0.9 | 0.47 ± 0.1 |
| Probes with Low Specificity | Minimal [1] | 12 ± 3 | 17 ± 3 | 7 ± 3 |
| Run Time (Days) | 1 [5] | 4 | 1-2 | 2 |
Data adapted from comprehensive comparison of spatial transcriptomics technologies [55]
The exceptional FDR performance of RNAscope (<1%) stems from its fundamental technology principle: non-specific hybridization of single probes does not yield amplified signals because the pre-amplifier requires the 28-base binding site formed only by adjacent double-Z probes [1]. This design achieves what the original developers described as "amplifying target-specific signals but not background noise" [1].
Experimental Protocols for Validation and Optimization
Establishing Assay Specificity Controls
Proper experimental design requires implementing rigorous controls to validate results and interpret FDR accurately. The recommended control scheme includes:
Positive Control Probe: A housekeeping gene such as ubiquitin C (UBC) or PPIB determines whether RNA quality in the tissue specimen is sufficient for target detection [6] [1]. Positive staining easily visible under a 10× objective indicates adequate RNA integrity.
Negative Control Probe: The bacterial dapB gene assesses nonspecific background staining and determines whether tissue specimen preparation is appropriate for RNAscope assays [6] [1]. Minimal to no staining should be observed with this control.
Target Marker Panel: The actual experimental probes for genes of interest [6]. Interpretation of target expression should only proceed when control slides show expected results.
This control strategy enables researchers to distinguish true signals from background, directly impacting accurate FDR assessment. The original technology validation demonstrated that this approach consistently differentiates between specific and nonspecific hybridization events [1].
Sample Preparation and Hybridization Protocol
The RNAscope workflow can be completed within a single day and consists of the following critical steps [5]:
Sample Preparation: Tissue sections or cells are fixed onto slides and pretreated with RNAscope Pretreatment Kit to unmask target RNA and permeabilize cells [2]. For FFPE tissues, this includes deparaffinization, target retrieval in citrate buffer at 100-103°C for 15 minutes, and protease digestion (10 μg/mL) at 40°C for 30 minutes [1].
Probe Hybridization: Target-specific double Z probes (~20 pairs per target) hybridize to target RNA molecules in a specialized hybridization buffer [1] [2]. Hybridization occurs at 40°C for 2-3 hours depending on the specific assay format.
Signal Amplification: Sequential hybridization of pre-amplifiers, amplifiers, and label probes builds the detection complex [2]. Each hybridization step is followed by stringent washes to remove unbound components and minimize background.
Signal Detection: Label probes conjugated to fluorescent molecules or chromogenic enzymes (HRP or alkaline phosphatase) generate detectable signals [1]. Chromogenic detection uses Fast Red with alkaline phosphatase or DAB with HRP, while fluorescent detection employs spectrally distinct fluorophores.
Visualization and Analysis: Punctate dot signals are visualized using standard bright-field or fluorescence microscopy [6]. Each dot represents a single RNA transcript that can be quantified manually or using image analysis software.
RNAscope Experimental Workflow: The standardized protocol includes essential control assays to validate specificity and sensitivity at critical steps.
Analytical Frameworks for Data Interpretation
Quantification Methodologies
RNAscope data analysis employs multiple approaches depending on experimental goals and expression patterns:
Methodology #1 (Semi-quantitative Histological Scoring): This approach uses standardized scoring criteria (0-4) based on dot counts per cell under microscopic examination:
- Score 0: 0 dots/cell
- Score 1: 1-3 dots/cell
- Score 2: 4-9 dots/cell
- Score 3: 10-15 dots/cell
- Score 4: >15 dots/cell [3]
Methodology #2 (Image-Based Quantitative Analysis): Automated image analysis software (HALO, CellProfiler, QuPath) quantifies dots per cell across entire tissue sections [6] [7] [3]. This approach provides objective, high-throughput quantification and is essential for analyzing heterogeneous expression patterns.
Methodology #3 (H-Score Calculation): For heterogeneous expression, the Histo score (H-score) integrates both intensity and distribution: H-score = Σ(ACD score × percentage of cells per bin), ranging from 0 to 400 [3]. This metric is particularly valuable for assessing tumors with mixed expression patterns.
Application to Different Expression Scenarios
The appropriate analytical approach varies based on expression patterns:
Table 2: Analysis Methods for Different RNAscope Expression Scenarios
| Expression Scenario | Recommended Analysis Methods | Key Metrics |
|---|---|---|
| Homogeneous Expression | Methodology #1 or #2 | Average dots per cell |
| Heterogeneous Expression | Methodology #2 and #3 | H-score, Expression distribution histogram |
| Subpopulation Expression | Methodology #2 with segmentation | Percentage positive cells, Dots per positive cell |
| Multiple Cell Type Expression | Methodology #2 with cell typing | Cell-type specific dots per cell |
| Co-expression Analysis | Methodology #2 with multiplex detection | Percentage dual-positive cells, Correlation coefficients |
| Rare Cell Detection | Methodology #2 with whole-slide imaging | Cell count, Percentage rare cells |
Adapted from RNAscope data analysis guidelines [3]
For complex expression patterns, automated image analysis tools like CellProfiler provide robust quantification pipelines. These tools typically involve: image preprocessing and color unmixing, nuclei identification, cell segmentation, dot detection, and object relationship mapping to assign transcripts to specific cells [7].
Table 3: Essential Research Reagents for RNAscope Experiments
| Reagent Category | Specific Examples | Function and Application |
|---|---|---|
| Probe Types | RNAscope Probe Sets (>300 nt), BaseScope Probes (50-300 nt), miRNAscope Probes (17-50 nt) | Target-specific detection with size-appropriate technology [59] |
| Detection Kits | RNAscope 2.5 HD BROWN, RNAscope Multiplex Fluorescent v2, RNAscope HiPlex v2 | Signal generation and amplification for various detection modalities [3] |
| Automation Systems | Leica BOND RX, Roche DISCOVERY ULTRA, Lunaphore COMET | Automated staining for reproducibility and throughput [5] [59] |
| Analysis Software | HALO (Indica Labs), CellProfiler, QuPath, Aperio RNA ISH Algorithm | Image analysis and quantification of signal dots [6] [7] [3] |
| Control Reagents | Positive Control Probes (PPIB, UBC), Negative Control (dapB) | Assay validation and quality assessment [6] [1] |
Applications in Biomedical Research and Drug Development
RNAscope's sensitivity and specificity characteristics make it particularly valuable for critical applications in drug development and clinical research. The technology has demonstrated utility in:
Biomarker Development: Qualification of biomarkers for disease progression, patient stratification, and clinical endpoints with high precision [59]. The single-molecule sensitivity enables detection of low-abundance biomarkers that might be missed by other methods.
Cell and Gene Therapy: Visualization of AAV vector biodistribution, cellular tropism, and transduction efficiency in spatial context [59]. This application benefits tremendously from RNAscope's ability to detect foreign nucleic acids against a complex tissue background.
Oncology Research: Delineation of intra-tumor heterogeneity and tumor microenvironment interactions through multiplexed target detection [55]. A 2025 study demonstrated RNAscope's capability to identify distinct tumor compartments in medulloblastoma based on specific gene expression patterns [55].
Infectious Disease: Detection of viral RNA in tissue reservoirs, as demonstrated in HIV research where RNAscope enabled visualization and quantification of HIV RNA with single-copy resolution [59].
Diagnostic Applications: Clinical validation of fusion transcripts and biomarkers, such as detection of CRTC1/3::MAML2 fusions in mucoepidermoid carcinomas with 93% sensitivity and 100% specificity compared to orthogonal methods [60].
The technology continues to evolve with enhanced multiplexing capabilities, with current iterations enabling simultaneous detection of up to 12 RNA targets through sequential hybridization approaches [59]. This expanded multiplexing maintains the core sensitivity and specificity advantages while dramatically increasing the information content per tissue section.
RNAscope technology establishes a robust framework for spatial transcriptomics analysis with rigorously demonstrated sensitivity and specificity metrics. The double-Z probe design principle fundamentally enables low false discovery rates while maintaining single-molecule sensitivity across diverse sample types. As spatial genomics continues to transform biomedical research, understanding these core performance characteristics empowers researchers to make informed decisions about technology selection, experimental design, and data interpretation. The quantitative metrics and methodological frameworks presented herein provide a foundation for leveraging RNAscope's capabilities in basic research, drug development, and clinical applications where accurate in situ RNA detection is paramount.
Spatial biology technologies have revolutionized our understanding of cellular organization and function within tissue microenvironments. Among these, RNAscope in situ hybridization (ISH) represents a pivotal methodology that bridges traditional histology with modern molecular profiling. This technical guide examines the positioning of RNAscope within the spatial biology landscape, focusing on its working principles, performance characteristics relative to other spatial transcriptomic platforms, and practical implementation for research and drug development. By providing a structured framework for technology selection based on specific research objectives, we empower scientists to make informed decisions for investigating gene expression within morphological context.
Spatial biology encompasses a suite of technologies designed to analyze molecular expression within the intact tissue architecture, preserving critical spatial relationships that are lost in dissociated cell analyses. The field has rapidly evolved into two principal methodological categories: imaging-based (iST) and sequencing-based (sST) approaches [55]. Imaging-based methods, including RNAscope, utilize in situ hybridization to detect target RNAs directly in tissue sections, while sequencing-based approaches capture transcripts from spatially barcoded areas for subsequent sequencing. Each methodology offers distinct advantages and limitations, making technology selection a critical determinant of experimental success. Within this landscape, RNAscope occupies a unique position as a highly sensitive and specific ISH platform that provides single-molecule detection at single-cell resolution, making it particularly valuable for targeted spatial gene expression analysis across diverse research and potential clinical applications [2] [13].
RNAscope Technology: Core Principles and Mechanism
Fundamental Working Principle
RNAscope represents a significant advancement over traditional in situ hybridization methods through its proprietary probe design and signal amplification system. The technology employs a novel double Z probe design that fundamentally improves the signal-to-noise ratio by requiring two independent probes to hybridize in tandem to the target RNA sequence before signal amplification can occur [2] [13]. This approach is conceptually similar to fluorescence resonance energy transfer (FRET) systems in its requirement for coincident binding events. Each "Z probe" contains three essential elements: (1) a lower 18-25 base region complementary to the target RNA, (2) a spacer sequence, and (3) an upper 14-base tail sequence. The two tails from a probe pair form a 28-base binding site for the pre-amplifier molecule, initiating the amplification cascade only when both probes correctly hybridize to their adjacent target sequences [2]. This design makes non-specific amplification statistically improbable, as it is highly unlikely that two independent probes would bind nonspecifically to adjacent sites on non-target molecules.
Signal Amplification Cascade
The RNAscope signal amplification system operates through a sequential hybridization process that enables exponential signal generation without amplifying background noise [2]:
- Target Hybridization: Approximately 20 double Z target probe pairs hybridize specifically to the target RNA sequence
- Pre-amplifier Binding: Pre-amplifier molecules bind to the 28-base binding site formed by each double Z probe pair
- Amplifier Assembly: Multiple amplifier molecules bind to the numerous binding sites on each pre-amplifier
- Label Probe Attachment: Labeled probes containing fluorescent molecules or chromogenic enzymes bind to the multiple sites on each amplifier
This multi-stage amplification results in up to 8,000-fold signal amplification for each target RNA molecule, enabling single-molecule detection sensitivity while maintaining exceptional specificity [13]. The 20x20x20 probe design ensures robust detection even with partial target RNA degradation or accessibility issues, as only three double Z probes need to bind to generate a detectable signal [2].
Visualizing the RNAscope Mechanism
RNAscope Signal Amplification Cascade
Comparative Analysis of Spatial Transcriptomic Technologies
Technology Classification and Performance Metrics
The spatial transcriptomics landscape encompasses diverse platforms with distinct operational principles and performance characteristics. A comprehensive comparison of major technologies reveals critical differences that inform appropriate application selection [55].
Table 1: Spatial Transcriptomics Technology Comparison
| Technology | Methodology | Resolution | Multiplexing Capacity | Sensitivity | Target Specificity | Workflow Duration |
|---|---|---|---|---|---|---|
| RNAscope | Imaging-based (ISH) | Single-molecule | 1-4 targets (standard) | High (single RNA detection) | High (double Z-probe verification) | 1-2 days |
| Xenium | Imaging-based (in situ sequencing) | Subcellular | 100-400 targets | 25 transcripts/cell [55] | FDR: 0.47% [55] | 2 days |
| Merscope | Imaging-based (MERFISH) | Subcellular | 100-10,000 targets | 62 transcripts/cell [55] | FDR: 5.23% [55] | 1-2 days |
| Molecular Cartography | Imaging-based (smFISH) | Single-molecule | 100+ targets | 74 transcripts/cell [55] | FDR: 0.35% [55] | 4 days |
| Visium | Sequencing-based | 55-100 μm spots | Whole transcriptome | Limited by spot size | N/A | 2-3 days |
Performance Metrics in Tumor Tissue Analysis
Recent comparative studies using medulloblastoma with extensive nodularity (MBEN) samples provide quantitative performance data for imaging-based spatial technologies. The analysis reveals that RNAscope maintains strong correlation with other platforms (r=0.65-0.82) while offering advantages in specificity and background signal control [55]. Xenium demonstrated the highest correlation with RNAscope (r=0.82), followed by Molecular Cartography (r=0.74) and Merscope (r=0.65). In target specificity, as measured by false discovery rate (FDR), Molecular Cartography showed the lowest FDR (0.35% ± 0.2), followed by Xenium (0.47% ± 0.1) and RNAscope, while Merscope had significantly higher FDR (5.23% ± 0.9) [55]. These metrics highlight the precision of RNAscope for validated target detection, particularly when analyzing limited gene panels with uncompromised specificity requirements.
Technology Selection Framework
Spatial Technology Selection Framework
RNAscope Workflow and Protocol Implementation
Standardized Experimental Workflow
The RNAscope assay follows a structured workflow that ensures consistent results across various sample types. The process consists of five key phases [2] [27]:
Sample Preparation and Fixation: Tissue sections or cells are fixed onto slides using appropriate fixatives (typically 4% formaldehyde for fresh tissues). Proper fixation is critical for preserving RNA integrity while maintaining tissue morphology. For plant reproductive tissues, protocols recommend immediate submersion in 4% formaldehyde followed by vacuum infiltration to ensure complete penetration [27].
Pretreatment and Permeabilization: Slides undergo pretreatment with RNAscope Pretreatment Kit to unmask target RNA sequences and permeabilize cellular structures without compromising RNA integrity. This step includes controlled protease treatment to expose target sequences while maintaining tissue architecture.
Probe Hybridization: Target-specific RNAscope probes containing ~20 double Z probe pairs are hybridized to the target RNA molecules. Hybridization typically occurs at 40°C for 2 hours in a specialized hybridization oven [27]. The probe design enables specific binding even to short or partially degraded RNA fragments.
Signal Amplification: Sequential hybridization of amplifiers and label probes creates the signal amplification cascade. This multi-step process builds the branching DNA structure that generates detectable signal. The amplification occurs through a series of 30-minute incubation steps with different amplifiers [27].
Visualization and Quantification: Signals are visualized using chromogenic or fluorescent detection systems. Each punctate dot represents a single RNA molecule, which can be quantified manually or using automated image analysis platforms such as HALO software [2] [38].
Research Reagent Solutions for RNAscope Implementation
Successful implementation of RNAscope technology requires specific reagents and equipment designed to optimize performance and reproducibility.
Table 2: Essential Research Reagents and Solutions for RNAscope
| Reagent Category | Specific Products | Function | Application Notes |
|---|---|---|---|
| Probe Systems | RNAscope 2.5 HD Assay-BROWN, RNAscope 2.5 HD Assay-RED, RNAscope 2.5 HD Duplex Assay, RNAscope Multiplex Fluorescent Assay | Target-specific RNA detection | Selection depends on multiplexing needs: BROWN/RED for singleplex, Duplex for 2-plex, Multiplex Fluorescent for 3-4 targets [61] |
| Pretreatment Reagents | RNAscope Target Retrieval Reagents, RNAscope Hydrogen Peroxide, RNAscope Protease Plus | Unmask target RNA, reduce background, permeabilize cells | Critical for FFPE samples; optimized for different sample types [27] |
| Amplification System | RNAscope 2.5 HD AMP 1-6 | Signal amplification | Sequential application builds branching DNA structure for signal detection [27] |
| Detection Reagents | RNAscope Fast Red A&B, RNAscope 2.5 HD DAB, TSA-based Opal fluorophores | Visualize hybridized targets | Chromogenic for brightfield microscopy, fluorescent for multiplexing [61] |
| Controls | PPIB, Polr2A, UBC (positive controls), dapB (negative control) | Assay validation | Essential for verifying assay performance; selection based on expected expression levels [13] |
| Software | HALO, QuPath, Aperio | Image analysis and quantification | Enable automated signal quantification and cellular analysis [38] |
Quality Control and Validation
Robust quality control measures are essential for reliable RNAscope results. The technology incorporates built-in control systems to validate assay performance [13]. Positive control probes target housekeeping genes such as PPIB (peptidylprolyl isomerase B) for moderately expressed genes, Polr2A for low-expression targets, and UBC for highly expressed genes. The bacterial dapB gene serves as a negative control to confirm absence of background noise. Tissue integrity is verified through successful detection of positive controls, while assay specificity is confirmed by minimal signal in negative controls. This quality framework ensures that experimental results reflect true biological expression rather than technical artifacts.
Applications in Biomedical Research and Drug Development
Neuroscience and Neuronal Cell Mapping
RNAscope has proven particularly valuable in neuroscience research, where cellular heterogeneity and precise spatial organization are critical to function. The technology enables mapping of neuronal subtypes through detection of specific neurotransmitter receptors, neuropeptides, and immediate early genes as activity markers [62]. Multiplexed RNAscope assays can simultaneously distinguish glutamatergic (Vglut1, Vglut2) and GABAergic (Vgat) neurons within brain regions, while dopamine receptors (Drd1, Drd2) identify distinct striatal neuronal populations [62]. The single-cell resolution allows researchers to visualize neuronal network activity through immediate early genes like Cfos and Arc, providing insights into functional circuitry in response to various stimuli. Furthermore, RNAscope enables detection of challenging targets such as G protein-coupled receptors (GPCRs) and ion channels that often lack reliable antibodies, expanding the investigative toolbox for neuropharmacology and receptor localization studies.
Cancer Research and Tumor Microenvironment
In oncology, RNAscope facilitates characterization of intratumoral heterogeneity and tumor microenvironment interactions through precise spatial localization of oncogenes, tumor suppressor genes, and biomarkers [13] [19]. The technology's sensitivity enables detection of low-abundance transcripts and rare cell populations, including cancer stem cells within tumor masses. Recent applications demonstrate utility in lymphoid malignancy characterization, particularly for assessing B-cell clonality through IGLL5 detection, offering advantages in cases with limited tissue availability [63]. The preservation of morphological context allows correlation of gene expression patterns with specific histological regions, enabling investigations into tumor-stroma interactions, immune cell infiltration, and spatial patterns of therapeutic resistance.
Infectious Disease and Host-Pathogen Interactions
RNAscope provides powerful capabilities for studying viral infections through precise localization of viral RNA within host tissues. The technology has been applied to investigate viral tropism, replication sites, and host responses to infection [19]. The high sensitivity enables detection of low-copy viral transcripts, while single-molecule resolution allows characterization of infection dynamics at cellular and subcellular levels. Combined with host gene expression analysis, RNAscope facilitates comprehensive investigation of host-pathogen interactions within spatial context, identifying cellular factors that influence susceptibility to infection and viral dissemination patterns.
Integration with Complementary Spatial Biology Platforms
Multiomic Approaches: Combining RNA and Protein Detection
RNAscope's compatibility with immunohistochemistry (IHC) enables simultaneous detection of RNA and protein biomarkers on the same tissue section, providing comprehensive multiomic profiling within spatial context [63]. This integrated approach allows correlation of transcriptional activity with protein expression and post-translational modifications at single-cell resolution. Automated platforms such as the Lunaphore COMET system now facilitate fully automated, high-throughput hyperplex analysis of both RNA and protein biomarkers, significantly enhancing workflow efficiency for spatial multiomics [63]. These integrated workflows are particularly valuable for validating transcriptional responses through corresponding protein expression changes and understanding complex cellular phenotypes that require both nucleic acid and protein readouts.
Validation of High-Throughput Transcriptomic Data
RNAscope serves as a powerful validation tool for findings from bulk RNA sequencing and single-cell RNA sequencing (scRNA-seq) experiments [62]. While sequencing methods provide comprehensive transcriptome profiling, they lack inherent spatial context and require independent validation of expression patterns. RNAscope enables spatial confirmation of identified biomarkers and cell type-specific signatures within intact tissue architecture. This application is particularly important in neuroscience and tumor biology, where cellular organization fundamentally influences function and disease progression. The technology bridges discovery-based sequencing approaches with targeted spatial validation, creating a comprehensive workflow for transcriptomic investigation.
Future Directions and Clinical Translation
RNAscope technology continues to evolve with expanding applications in both research and clinical domains. Current developments focus on increasing multiplexing capabilities, enhancing quantification algorithms, and improving integration with automated pathology workflows [63]. While currently classified for research use, studies are investigating RNAscope's potential clinical utility for diagnostic applications, particularly in areas such as lymphoid malignancy classification and B-cell clonality assessment [63]. The technology's compatibility with standard clinical specimens (FFPE tissues) and ability to work with limited tissue quantities from biopsies facilitate translation into diagnostic settings. However, full clinical implementation requires further prospective validation studies and establishment of standardized analytical performance characteristics compliant with regulatory standards [13]. As spatial biology continues to advance, RNAscope is positioned to play a pivotal role in bridging exploratory research with clinical diagnostic applications, ultimately contributing to personalized medicine through enhanced molecular characterization of disease states within morphological context.
RNAscope represents a sophisticated spatial biology platform that offers unique advantages for targeted gene expression analysis with exceptional sensitivity and specificity. Its position within the spatial transcriptomics toolbox is defined by single-molecule detection capability, compatibility with standard clinical specimens, and flexibility for integration with protein detection methods. While newer high-plex spatial technologies provide unprecedented scaling for discovery applications, RNAscope maintains distinct value for focused investigations requiring uncompromised specificity and single-cell resolution. Appropriate technology selection depends critically on research objectives, with RNAscope being particularly well-suited for validated target detection, low-abundance transcript visualization, and multiomic correlation studies. As spatial biology continues to transform biomedical research, understanding the complementary strengths of available platforms enables researchers to design optimal experimental strategies for investigating gene expression within the rich context of tissue architecture.
Conclusion
RNAscope technology, with its innovative double Z probe design and robust signal amplification, has firmly established itself as a gold standard for targeted RNA detection in situ. Its ability to provide single-molecule, single-cell resolution within the native tissue architecture makes it an indispensable tool for validating biomarkers, understanding disease mechanisms, and advancing drug development, particularly for novel modalities like oligonucleotide therapies. As the field of spatial biology rapidly evolves, RNAscope's high sensitivity and specificity provide a critical validation framework for newer, high-plex spatial transcriptomic methods. Future directions will see its deeper integration into multi-omic workflows and its expanded use in clinical diagnostics, ultimately accelerating the translation of genomic discoveries into personalized medicine solutions.
References
- 1. RNAscope: A Novel in Situ RNA Analysis Platform for ... [https://pmc.ncbi.nlm.nih.gov/articles/PMC3338343/]
- 2. RNAscope Enables Spatial Genomic ISH ... [https://acdbio.com/science/how-it-works]
- 3. A Guide for RNAscope™ Data Analysis [https://www.bio-techne.com/reagents/rnascope-ish-technology/rnascope/guide-rnascope-data-analysis]
- 4. RNAscope ISH Reference Guide [https://www.bio-techne.com/reagents/rnascope-ish-technology/rnascope/rnascope-ish-reference-guide]
- 5. RNAscope Workflow, In Situ Hybridization Steps | ACD [https://acdbio.com/ebook/introduction/rnascope-workflow]
- 6. RNAscope Assay Visualization and Interpretation [https://acdbio.com/support-solution-category/rnascope-assay-visualization-and-interpretation]
- 7. Using CellProfiler to Analyze RNAscope™ and BaseScope ... [https://www.bio-techne.com/resources/protocols-troubleshooting/using-cellprofiler-analyze-rnascope-basescope-data]
- 8. Learn How RNAscope Technology Works [https://www.bio-techne.com/reagents/rnascope-ish-technology/get-started]
- 9. New-ISH on the Block: Introduction to RNAscope® [https://bitesizebio.com/40621/new-ish-on-the-block-introduction-to-rnascope/]
- 10. Probe Design | In Situ Hybridization, RNA-ISH [https://acdbio.com/support-solution-category/probe-design]
- 11. Quantitative Analysis of Gene Expression in RNAscope ... [https://pmc.ncbi.nlm.nih.gov/articles/PMC9901451/]
- 12. Intronic RNAscope probes enable precise identification of ... [https://pmc.ncbi.nlm.nih.gov/articles/PMC11977257/]
- 13. Evaluation of the Suitability of RNAscope as a Technique ... [https://pmc.ncbi.nlm.nih.gov/articles/PMC8710359/]
- 14. RNAscope in situ hybridization confirms mRNA integrity ... [https://pmc.ncbi.nlm.nih.gov/articles/PMC5706804/]
- 15. 2022 Oct 25 - See more in Vivid Color! Introducing the ... [https://acdbio.com/2022-oct-25-see-more-vivid-color-introducing-newly-enhanced-rnascope%E2%84%A2-multiplex-fluorescent-v2-assay]
- 16. RNAscope® technology | In Situ Hybridization, RNA-ISH [https://acdbio.com/dataanalysisguide]
- 17. RNAscope, In Situ Hybridization Technique | ACD [https://acdbio.com/referenceguide]
- 18. RNAscope: A Novel in Situ RNA Analysis Platform for ... [https://www.sciencedirect.com/science/article/pii/S1525157811002571]
- 19. RNAscope ISH Technology [https://www.creative-bioarray.com/support/rnascope-ish-technology.htm]
- 20. Superior Determination of HPV using RNAscope [https://acdbio.com/superior-determination-hpv-using-rnascope%E2%84%A2]
- 21. Bio-Techne's RNAscope® Technology Enabling Robust ... [https://acdbio.com/bio-technes-rnascope%C2%AE-technology-enabling-robust-gene-expression-and-biomarker-analysis-advances]
- 22. Detection and Quantification of Multiple RNA Sequences ... [https://pmc.ncbi.nlm.nih.gov/articles/PMC7476812/]
- 23. Validation of a DKK1 RNAscope chromogenic in situ ... [https://www.nature.com/articles/s41598-021-89060-3]
- 24. RNAscope Troubleshooting Guide and FAQ [https://acdbio.com/technical-support/solutions]
- 25. Regular article Comparative Analysis of Gene Expression ... [https://www.sciencedirect.com/science/article/pii/S1525157824001636]
- 26. Comparative analysis of androgen and estrogen receptor ... [https://pubmed.ncbi.nlm.nih.gov/40874290/]
- 27. Expanded RNAscope™ In Situ Hybridization Assay [https://www.protocols.io/view/expanded-rnascope-in-situ-hybridization-assay-dp8p5rvn.html]
- 28. RNAscope Assay Workflow | In Situ Hybridization, RNA-ISH [https://acdbio.com/support-solution-category/rnascope-assay-workflow]
- 29. 2025 Mar 18 - Accelerate RNA and Protein Biomarker ... [https://acdbio.com/2025-mar-18-accelerate-rna-and-protein-biomarker-development-new-rnascope%E2%84%A2-ish-protease-free-assays]
- 30. Identification of Optimal Decalcification Method and Tissue ... [https://www.mdpi.com/2304-6767/13/11/538]
- 31. Fixed Frozen Tissue Sample Preparation- RNAscope 2.5 ... [https://www.bio-techne.com/resources/protocols-troubleshooting/fixed-frozen-tissue-sample-preparation-rnascope2.5-chromogenic-assay]
- 32. RNAscopePlus | In Situ Hybridization, RNA-ISH [https://acdbio.com/rnascopeplus]
- 33. Multi-Omic Spatial Analysis using RNAscope™ Plus [https://www.bio-techne.com/resources/literature/multi-omic-spatial-analysis-rna-proteins-rnascope-plus]
- 34. RNAscope Multiomic LS Fluorescent Assay | genomics [https://acdbio.com/rnascope-multiomic-ls-fluorescent-assay]
- 35. HALO | Quantitative Image Analysis for Pathology [https://indicalab.com/halo/]
- 36. HALO® image analysis platform | In Situ Hybridization ... [https://acdbio.com/halo-image-analysis-platform]
- 37. Automated Quantitative RNA in Situ Hybridization for ... [https://www.sciencedirect.com/science/article/pii/S1525157812003157]
- 38. An Overview of Quantitative Image Analysis of RNAscope ... [https://acdbio.com/2023-oct-10-overview-quantitative-image-analysis-rnascope-ish-data-professional-assay-services]
- 39. In Situ Hybridization Troubleshooting | ACD [https://acdbio.com/ebook/troubleshooting/sample-preparation-and-optimization]
- 40. RNAscope Assay Technical Support and FAQ [https://acdbio.com/technical-support/getting-started]
- 41. Visualization of spatial gene expression in plants by modified ... [https://plantmethods.biomedcentral.com/articles/10.1186/s13007-020-00614-4]
- 42. RNAscope ISH Troubleshooting [https://www.bio-techne.com/resources/protocols-troubleshooting/rnascope-ish-troubleshooting]
- 43. RNAscope Troubleshooting Guide and FAQ [https://acdbio.com/technical-support/solutions/faq]
- 44. Pretreatment Conditions, In Situ Hybridization Temperature [https://acdbio.com/ebook/introduction/materialsmethod/optimal-pretreatment-conditions]
- 45. RNAscope Webinars, Videos, Presentations | Learn More [https://acdbio.com/technical-support/learn-more]
- 46. Fresh Frozen RNAScope Protocol [https://www.protocols.io/view/fresh-frozen-rnascope-protocol-hfnab3maf.html]
- 47. Mapping human tissues with highly multiplexed RNA in situ ... [https://www.nature.com/articles/s41467-024-46437-y]
- 48. Quantitative Analysis of Gene Expression in RNAscope ... [https://en.bio-protocol.org/en/bpdetail?id=4580&type=0]
- 49. Intronic RNAscope probes enable precise identification of ... [https://www.nature.com/articles/s42003-025-08012-z]
- 50. Professional Assay Services, Types of Analysis [https://acdbio.com/services/quantitative-analysis]
- 51. Comparison between qPCR and RNA-seq reveals challenges ... [https://pmc.ncbi.nlm.nih.gov/articles/PMC9883133/]
- 52. Comparative single-nucleus RNA-seq analysis revealed ... [https://www.nature.com/articles/s41467-025-58395-0]
- 53. A method for manual and automated multiplex RNAscope in ... [https://pmc.ncbi.nlm.nih.gov/articles/PMC6245747/]
- 54. Comparison of spatial transcriptomics technologies using ... [https://genomebiology.biomedcentral.com/articles/10.1186/s13059-025-03624-4]
- 55. Comparison of spatial transcriptomics technologies using ... [https://pmc.ncbi.nlm.nih.gov/articles/PMC12180266/]
- 56. Landscape of Imaging-based Spatial RNA Technology: Part II [https://blog.latch.bio/p/landscape-of-imaging-based-spatial]
- 57. Comparison of spatial transcriptomics technologies using ... [https://pubmed.ncbi.nlm.nih.gov/40542418/]
- 58. Comparison of spatial transcriptomics technologies [https://www.linkedin.com/posts/ascanet-org_germancancerresearchcenter-dkfz-spatialomics-activity-7341993784924143616-HCdi]
- 59. RNAscope ISH Technology [https://www.bio-techne.com/reagents/rnascope-ish-technology]
- 60. RNA In Situ Hybridization Detection of CRTC1/3::MAML2 ... [https://www.sciencedirect.com/science/article/abs/pii/S0893395225000523]
- 61. in situ Hybridization Kits, Hybridization Assays [https://acdbio.com/manual-assays-rnascope]
- 62. Neuroscience Research, Neuronal Cell Markers [https://acdbio.com/science/applications/research-areas/neuroscience]
- 63. Bio-Techne Advances Spatial Biology Solutions Bridging ... [https://acdbio.com/bio-techne-advances-spatial-biology-solutions-bridging-translational-research-clinical-applications]