SMART-seq2 vs. 10X Genomics for Embryo Cells: A Definitive Guide for Developmental Biologists
Selecting the optimal single-cell RNA sequencing platform is crucial for advancing research in human embryonic development and stem cell-based embryo models.
SMART-seq2 vs. 10X Genomics for Embryo Cells: A Definitive Guide for Developmental Biologists
Abstract
Selecting the optimal single-cell RNA sequencing platform is crucial for advancing research in human embryonic development and stem cell-based embryo models. This article provides a comprehensive comparison of SMART-seq2 and 10X Genomics technologies, tailored specifically for the analysis of embryo cells. We explore the foundational principles of each method, their specific methodological applications in embryonic studies, practical troubleshooting and optimization strategies, and a direct validation of their performance. Designed for researchers, scientists, and drug development professionals, this guide synthesizes current evidence to inform platform selection, enhance experimental design, and ensure rigorous authentication of embryo models through appropriate benchmarking.
Understanding scRNA-seq Core Technologies: SMART-seq2 and 10X Genomics
Single-cell RNA sequencing (scRNA-seq) has revolutionized biological research by enabling transcriptome profiling at individual cell resolution. The two predominant methodological paradigms in this field are full-length transcript sequencing and 3' end counting, exemplified by Smart-seq2 and 10X Genomics Chromium platforms respectively [1] [2]. These approaches differ fundamentally in their molecular capture strategies, sequencing outputs, and analytical applications, making platform selection critical for experimental design, particularly in specialized fields such as embryo cells research.
Full-length protocols like Smart-seq2 employ a plate-based approach where mRNA is reverse transcribed to generate complete cDNA molecules, preserving transcript sequence integrity across the entire coding region [1]. In contrast, 3' end counting methods like 10X Genomics utilize droplet-based microfluidics to capture cells and barcode mRNA transcripts specifically at their 3' ends, focusing quantification through unique molecular identifiers (UMIs) [1] [2]. This fundamental distinction in transcript capture dictates their respective strengths in detecting isoform diversity versus quantifying gene expression across cell populations.
Technical Comparison of Platforms
Experimental Workflows
Smart-seq2 Workflow: Cells are individually sorted into multi-well plates containing lysis buffer [3]. The protocol utilizes template switching mechanism at the 5' end of RNA template during reverse transcription to generate full-length cDNA [3]. This is followed by cDNA amplification via PCR, library preparation through tagmentation or fragmentation, and Illumina sequencing [4]. The method preserves strand orientation and complete transcript information, enabling detection of sequence variants along the entire transcript length.
10X Genomics Chromium Workflow: The 10X system employs a droplet-based approach where single cells, reagents, and barcoded gel beads are co-encapsulated in oil emulsion droplets [3]. Within each droplet, cell lysis occurs and mRNA transcripts are barcoded with cell-specific barcodes and UMIs during reverse transcription [1]. The barcoded cDNA is then pooled, amplified, and sequenced, allowing digital counting of individual transcripts through UMI deduplication [1] [2].
Performance Characteristics
Table 1: Experimental Design and Output Comparison
| Parameter | Smart-seq2 | 10X Genomics Chromium |
|---|---|---|
| Throughput | 10-100s of cells [5] | 1,000-10,000s of cells [1] |
| Sequencing Depth | 1.7-6.3 million reads/cell [1] | 20,000-92,000 reads/cell [1] |
| Genes Detected per Cell | 2,500-9,000 [6] | Varies with sequencing depth |
| Transcript Coverage | Full-length | 3' end only |
| UMI Incorporation | No [2] | Yes [1] |
| Multiplexing Capability | Limited | High [7] |
Table 2: Technical Performance Metrics
| Performance Metric | Smart-seq2 | 10X Genomics Chromium |
|---|---|---|
| Mitochondrial Gene % | ~30% [1] | 0-15% [1] |
| Ribosomal Gene % | Lower (0.4-3.3x less) [1] | Higher [1] |
| lncRNA Detection | 2.9-3.8% of transcripts [1] | 6.5-9.6% of transcripts [1] |
| Dropout Rate | Lower for low-abundance transcripts [1] | Higher, especially for low-expression genes [1] |
| Doublet/Multiplet Rate | Lower (visual inspection possible) [3] | Higher (emulsion-based) [4] |
Key Methodological Studies
Direct Comparative Analysis
A landmark 2021 study directly compared both platforms using the same samples of CD45- cells from cancer patients, providing robust experimental data for performance benchmarking [1]. The researchers employed fluorescence-activated cell sorting (FACS) to obtain CD45- cells from hepatocellular carcinoma and rectal cancer patients, including liver tumor, non-tumor adjacent tissue, primary tumor, and metastasized tumor tissues [1]. For each sample, cells were split and processed in parallel using both 10X Genomics Chromium and Smart-seq2 platforms, with bulk RNA-seq data also generated for reference [1].
The experimental protocol for Smart-seq2 followed established methods with average total reads of 1.7-6.3 million per cell, while 10X data had substantially lower reads per cell (20,000-92,000) but covered significantly more cells (528-5,282 versus 94-189 cells per sample) [1]. For transcriptome analysis, researchers used uniquely mapped reads with similar unique mapping ratios (~80%) for both datasets [1]. Data analysis included examination of read counts, mapping statistics, gene detection sensitivity, cell cycle phase distribution, and differential expression analysis between platforms.
Recent Benchmarking Evidence
A 2023 comprehensive benchmarking study compared multiple scRNA-seq methods, including Smart-seq3 (an evolved version of Smart-seq2) and 10X Genomics, providing updated performance metrics [4]. The researchers used human K562 cells and mouse embryonic stem cells (mESCs) as model systems, with cells sorted into 96- or 384-well plates in a checkerboard pattern using a CellenOne X1 instrument [4]. For 10X, they followed the Chromium Next GEM Single Cell 3' protocol v3.1, loading 8,250 cells to target recovery of 5,000 cells [4].
The study implemented standardized data processing pipelines in Snakemake v6.11.0, using the same reference genome for all methods and normalizing samples to 20,000 read pairs per cell on average for comparative analyses [4]. Their evaluation included detected features, transcriptome diversity, mitochondrial RNA abundance, multiplets, and comparison against bulk RNA sequencing as a gold standard [4].
Analytical Output Comparison
Transcriptomic Applications
Table 3: Analytical Applications and Outputs
| Application | Smart-seq2 | 10X Genomics Chromium |
|---|---|---|
| Alternative Splicing | Excellent detection [1] | Limited |
| Variant Calling | Suitable [3] | Limited |
| Isoform Diversity | Full-length enables detection [2] | 3' end limits analysis |
| Cell Type Identification | Limited by cell numbers [1] | Excellent for rare populations [1] |
| Differential Expression | Detects distinct gene sets [1] | Detects distinct gene sets [1] |
| Gene Network Analysis | Comprehensive transcript information | UMI-based quantification |
Data Quality Considerations
The comparative analysis revealed that Smart-seq2 detected more genes per cell, particularly low-abundance transcripts and alternatively spliced transcripts, while capturing a higher proportion of mitochondrial genes (approximately 30% versus 0-15% in 10X) [1]. The composite of Smart-seq2 data more closely resembled bulk RNA-seq data, providing a more comprehensive transcriptome representation [1]. Smart-seq2 demonstrated superior sensitivity for detecting low-expression genes, while 10X data exhibited higher noise for mRNAs with low expression levels and more severe dropout effects, particularly for genes with lower expression levels [1].
For non-coding RNA analysis, approximately 10-30% of all detected transcripts by both platforms were from non-coding genes, with long non-coding RNAs (lncRNAs) accounting for a higher proportion in 10X data (6.5-9.6% versus 2.9-3.8% in Smart-seq2) [1]. The platforms also showed divergent enrichment for specific gene categories, with 10X data displaying higher proportions of house-keeping genes and transcriptional factor genes, while Smart-seq2-specific highly variable genes (HVGs) only enriched in two KEGG pathways compared to 34 pathways for 10X-specific HVGs [1].
Research Reagent Solutions
Table 4: Essential Research Reagents and Materials
| Reagent/Material | Function | Platform Application |
|---|---|---|
| Oligo-dT Primers | mRNA capture and reverse transcription priming | Both platforms |
| Template Switching Oligos | Full-length cDNA extension | Smart-seq2 [3] |
| Barcoded Gel Beads | Cell-specific barcoding | 10X Genomics [1] |
| Unique Molecular Identifiers (UMIs) | Digital transcript counting | 10X Genomics [1] [2] |
| Cell Lysis Buffer | RNA release and stabilization | Both platforms |
| Reverse Transcriptase | cDNA synthesis from mRNA templates | Both platforms |
| Tagmentation Enzymes | Library preparation via fragmentation | Smart-seq2 [4] |
| Polymerase Chain Reaction (PCR) Reagents | cDNA/library amplification | Both platforms |
Implications for Embryo Cells Research
For embryo cells research, the choice between full-length and 3' end counting methods depends heavily on specific research objectives. Smart-seq2 is preferable for investigating transcript isoform diversity, allele-specific expression, and splicing variants during embryonic development, where complete transcript information is crucial [1] [3]. Its higher sensitivity for low-abundance transcripts makes it suitable for detecting rare regulatory transcripts that might govern developmental pathways.
Conversely, 10X Genomics provides superior capability for comprehensive cellular atlas projects of embryonic development, where capturing the full spectrum of cell types and transitional states is essential [1]. The ability to process thousands of cells enables researchers to reconstruct developmental trajectories and identify rare progenitor populations that might be missed in lower-throughput platforms. The UMI-based quantification also provides more accurate digital counting for precise expression measurements across developing cell lineages.
Platform selection must also consider sample availability constraints common in embryo research. Smart-seq2 requires fewer cells overall but provides deeper profiling of individual cells, while 10X requires larger initial cell inputs but distributes sequencing depth across more cells. For precious embryonic samples, this tradeoff between cellular depth and population breadth becomes a critical consideration in experimental design.
In the field of developmental biology, particularly in the study of precious human embryo cells, selecting the appropriate single-cell RNA sequencing (scRNA-seq) technology is paramount. The choice often centers on two dominant approaches: plate-based microfluidics (exemplified by full-length transcript protocols like SMART-seq2) and droplet-based microfluidics (represented by high-throughput systems like 10X Genomics Chromium). These technologies offer fundamentally different trade-offs between transcriptional detail and cellular throughput, which can directly impact biological conclusions in sensitive applications like embryo research [1] [8]. This guide provides an objective comparison of their performance, supported by experimental data, to inform researchers and drug development professionals selecting a platform for their specific experimental needs.
Plate-Based Microfluidics (SMART-seq2)
Plate-based methods rely on the physical isolation of individual cells into separate wells of a multi-well plate. The SMART-seq2 protocol is a benchmark full-length transcript method. Its core chemistry involves a mechanism called Template Switching [8]. An Oligo-dT primer binds to the poly-A tail of mRNAs and initiates reverse transcription. The reverse transcriptase enzyme adds a few non-templated cytosines to the cDNA end, allowing a specially designed template-switching oligonucleotide (TSO) to bind. This enables the polymerase to "copy" the TSO sequence, resulting in cDNA that has known sequences on both ends, which is crucial for subsequent PCR amplification [8]. While highly sensitive, this approach limits throughput to hundreds of cells per experiment due to manual handling and pipetting steps [9] [8].
Droplet-Based Microfluidics (10X Genomics)
Droplet-based microfluidics, used by the 10X Genomics Chromium system, encapsulates individual cells with barcoded beads in nanoliter-scale aqueous droplets within an oil phase [9] [10] [11]. Each bead is coated with millions of oligonucleotides featuring three key elements: a cell barcode (unique to each bead), a unique molecular identifier (UMI), and an Oligo-dT sequence [1]. Inside each droplet, cell lysis occurs, and the mRNAs bind to the barcoded beads. The beads from all droplets are then harvested, and the libraries are prepared in a bulk process, where the cell barcode and UMI assigned to each transcript allow bioinformatic deconvolution of which molecule came from which cell after sequencing [1]. This approach enables the profiling of thousands to tens of thousands of cells in a single run [9].
Workflow Visualization
The diagram below illustrates the fundamental procedural differences between these two technologies.
Direct Performance Comparison: Experimental Data
A direct comparative analysis of the 10X Genomics Chromium (v2 chemistry) and Smart-seq2 platforms, using the same samples of CD45- cells, provides objective performance data [1] [12].
Table 1: Key Metric Comparison from Direct Platform Analysis [1]
| Performance Metric | Smart-seq2 (Plate-Based) | 10X Genomics (Droplet-Based) |
|---|---|---|
| Average Reads/Cell | ~1.7M - 6.3M | ~20K - 92K |
| Genes Detected/Cell | Higher | Lower |
| Low-Abundance Transcripts | Better detection | Higher noise |
| Mitochondrial Gene % | Higher (~30%) | Lower (0-15%) |
| Ribosomal Gene % | Lower | 2.6-7.2x Higher |
| lncRNA Proportion | Lower (2.9-3.8%) | Higher (6.5-9.6%) |
| Data Resemblance to Bulk RNA-seq | Closer resemblance | Less similar |
| Cell Throughput per Run | Low (hundreds) | High (thousands) |
| Dropout Rate (Technical Zeros) | Lower | More severe for low-expression genes |
| Isoform & Mutation Detection | Possible (full-length) | Not possible (3'/5' tagged) |
Table 2: Protocol and Cost Considerations for Full-Length Methods [8]
| Characteristic | NEB SMART-seq | Takara SMART-seq HT | G&T-seq | SMART-seq3 |
|---|---|---|---|---|
| Gene Detection | Lower | Similar High | Highest | High (with UMIs) |
| Hands-On Time | Moderate | Minimal | High | Moderate |
| Cost per Cell (12-plex) | ~46 € | ~73 € | ~12 € | Low |
| Ease of Use | Commercially available, all-in-one kit | Commercially available, minimal steps | Not commercial, complex setup | Not commercial, improved chemistry |
Analysis of a Relevant Use Case: Embryo Research
The creation of a comprehensive human embryo reference tool using scRNA-seq data underscores the critical importance of platform selection [13]. Such references, which integrate data from multiple studies covering development from zygote to gastrula, are essential for authenticating stem cell-based embryo models. The choice between plate-based and droplet-based methods in this context involves several key considerations.
- Cell Number vs. Transcriptome Depth: A key application is validating embryo models against in vivo references. Initial studies might use plate-based methods to deeply characterize small numbers of cells from specific lineages (e.g., epiblast, hypoblast) and identify robust marker genes. Subsequently, droplet-based methods could be used to profile tens of thousands of cells from a complex embryo model to ensure all expected lineages are present in correct proportions [13].
- Data Quality for Benchmarking: The high sensitivity and full-length transcript data from plate-based protocols like Smart-seq2 can provide a more reliable "gold standard" for annotating cell identities in the reference atlas, as it allows for the verification of markers based on full-length transcript information [13] [8].
- Risk of Misannotation: When benchmarking embryo models, using an incomplete or inappropriate reference can lead to misannotation of cell lineages. A high-quality reference built from deeply sequenced cells is crucial. Relying solely on a droplet-based dataset with a higher dropout rate might fail to detect lowly expressed but biologically critical markers, leading to incorrect assignments of cell identity in the model [13].
The Scientist's Toolkit: Essential Reagent Solutions
Table 3: Key Reagents and Their Functions in scRNA-seq Workflows
| Reagent / Solution | Function | Platform Relevance |
|---|---|---|
| Oligo-dT Primers | Binds to poly-A tail of mRNA to initiate reverse transcription. | Core to both platforms |
| Template Switching Oligo (TSO) | Adds universal primer sequence to 5' end of cDNA during RT. | Core to SMART-seq2 chemistry [8] |
| Barcoded Beads (Gel Beads) | Provides cell barcode and UMI for multiplexing; core to droplet systems. | Essential for 10X Genomics [1] |
| Surfactants | Stabilizes droplets and prevents coalescence in oil-phase. | Critical for droplet microfluidics [10] [14] |
| Cell Lysis Buffer | Breaks open cell and nuclear membranes to release RNA. | Core to both platforms |
| Reverse Transcriptase | Synthesizes cDNA from an RNA template. | Core to both platforms |
| PCR Enzymes & Master Mix | Amplifies cDNA prior to library preparation. | Core to both platforms |
| Nextera XT Kit | Used for tagmentation-based library preparation from cDNA. | Common for plate-based libraries [8] |
The choice between plate-based and droplet-based microfluidics is not about finding a universally superior technology, but rather about matching the platform's strengths to the research question.
- Choose Plate-Based SMART-seq2 when: Your research priority is maximal transcriptional detail from each cell. This is the preferred method for identifying splice variants, detecting low-abundance transcripts, characterizing novel isoforms, or when working with very limited cell numbers (e.g., rare cell types from early embryonic stages) where capturing the most information from each cell is critical [1] [8].
- Choose Droplet-Based 10X Genomics when: Your research goal is to profile a large, heterogeneous population to discover rare cell types, understand cellular diversity, or construct a comprehensive cellular atlas of a complex tissue. Its high throughput and cost-effectiveness make it ideal for large-scale studies where the statistical power of cell numbers outweighs the need for full-length transcript data [1] [13].
- Adopt a Hybrid Approach for embryo research: For the most comprehensive insights in studies of human development and embryo models, a combined strategy is powerful. Use plate-based methods to establish a deep, high-confidence reference atlas with full-length transcriptome data. Then, use droplet-based methods to map new samples or embryo models onto this reference at scale, validating findings and assessing cellular composition and fidelity [13].
Transcripts per Million (TPM) vs. Unique Molecular Identifiers (UMIs)
In single-cell RNA sequencing (scRNA-seq), Transcripts per Million (TPM) and Unique Molecular Identifiers (UMIs) represent two fundamentally different approaches to gene expression quantification. TPM is a relative normalization method used primarily with full-length transcript protocols like SMART-seq2, providing coverage across the entire transcript. In contrast, UMIs are molecular barcodes that enable absolute molecule counting in 3'-end focused methods like 10X Genomics Chromium, effectively reducing technical noise from amplification biases. The choice between these quantification strategies carries significant implications for data characteristics, analytical capabilities, and biological interpretations in embryonic development research.
Table 1: Core Characteristics of TPM and UMI Quantification Methods
| Feature | TPM (SMART-seq2) | UMI (10X Genomics) |
|---|---|---|
| Primary Protocol | Plate-based, full-length | Droplet-based, 3'-end counting |
| Quantification Basis | Read counts normalized by library size and gene length | Digital counting of unique molecules |
| Amplification Bias Correction | No | Yes |
| Transcript Coverage | Full-length | 3'-end only |
| Typical Genes/Cell | 4,000-9,000 [1] [3] | 500-3,000 [3] |
| Detection Sensitivity | Higher for low-abundance transcripts [1] | Higher for rare cell types [1] |
| Mitochondrial Gene Proportion | Higher (~30%) [1] | Lower (0-15%) [1] |
| Applications | Isoform detection, allele-specific expression [3] | Large-scale cell mapping, rare population identification [1] |
Experimental Data and Performance Comparison
Methodological Foundations
The technical differences between TPM and UMI quantification stem from their respective library preparation protocols. SMART-seq2 generates full-length cDNA through template switching mechanisms, allowing for read coverage across entire transcripts [3]. This enables detection of alternatively spliced isoforms but lacks molecular barcoding to correct for PCR amplification biases. Expression values are normalized as TPM, which accounts for both library size and gene length.
In contrast, 10X Genomics employs droplet-based encapsulation where each mRNA molecule is labeled with a cell barcode and UMI during reverse transcription [3]. After amplification and sequencing, reads with identical UMIs are collapsed to count original molecules, providing digital quantification that is less affected by PCR duplicates [15] [16]. This approach focuses on 3'-end sequencing, sacrificing transcriptome-wide coverage for greatly increased cell throughput.
Direct Comparative Evidence from Embryonic Studies
Systematic comparisons of these platforms using identical biological samples reveal critical performance differences. A 2021 study directly compared SMART-seq2 and 10X Genomics using the same CD45⁻ cell samples from multiple tissue types [1]. The research demonstrated that SMART-seq2 detected more genes per cell, particularly low-abundance transcripts and alternatively spliced isoforms, while 10X data exhibited more severe dropout effects for genes with lower expression levels.
Notably, 10X-based data displayed a higher proportion of long non-coding RNAs (6.5%-9.6% vs. 2.9%-3.8% in SMART-seq2) and detected distinct groups of differentially expressed genes between cell clusters [1]. This suggests that each platform may reveal different biological aspects of embryonic development, with SMART-seq2 providing deeper transcriptional characterization per cell and 10X enabling identification of rare cell populations through profiling of thousands of cells.
Table 2: Quantitative Performance Metrics from Direct Comparisons
| Performance Metric | SMART-seq2 (TPM) | 10X Genomics (UMI) |
|---|---|---|
| Average Reads/Cell | 1.7M-6.3M [1] | 20K-92K [1] |
| Unique Mapping Ratio | ~80% [1] | ~80% [1] |
| Mitochondrial Gene % | ~30% (similar to bulk) [1] | 0-15% [1] |
| Ribosomal Gene % | Lower [1] | 2.6-7.2× higher [1] |
| Non-coding RNA % | 10-30% (lower lncRNAs) [1] | 10-30% (higher lncRNAs) [1] |
| Dropout Rate | Lower for low-expression genes [1] | Higher for low-expression genes [1] |
Statistical Characteristics and Analytical Considerations
Noise Modeling and Differential Expression
UMI counts demonstrate distinct statistical properties that simplify downstream analysis. Research shows that UMI counts generally follow a negative binomial distribution without requiring zero-inflation parameters, whereas read counts often need more complex zero-inflated models to account for technical noise [15]. This statistical characteristic makes UMI data more amenable to standard differential expression tools.
For detecting differentially expressed genes, UMI-based quantification demonstrates improved false discovery rate control and power compared to read-count methods [15]. The digital nature of UMI counting reduces the impact of amplification biases that can distort expression measurements in TPM-based data [17]. However, when UMIs are not available, computational methods like quasi-UMIs can transform read counts to approximate UMI count distributions through quantile normalization [18].
Impact on Embryo Research Applications
In embryonic development studies, each method offers distinct advantages. SMART-seq2's full-length coverage enables detection of isoform dynamics during cell fate specification and can identify allele-specific expression patterns crucial for understanding genomic imprinting [3]. The higher genes detected per cell provides deeper characterization of heterogeneous embryonic cell states.
Conversely, 10X Genomics' high throughput enables comprehensive cell atlas construction of developing embryos, as demonstrated in integrated human embryo references spanning zygote to gastrula stages [13]. The ability to profile thousands of cells makes it possible to identify rare transitional states during lineage specification that might be missed with lower-throughput methods.
The Scientist's Toolkit
Table 3: Essential Reagents and Computational Tools
| Resource | Function | Application Context |
|---|---|---|
| UMI-tools [16] | Bioinformatics pipeline for UMI error correction and read deduplication | Essential for processing 10X Genomics data; groups similar UMIs to account for sequencing errors |
| scumi Pipeline [19] | Universal processing workflow for various scRNA-seq methods | Enables standardized comparison across platforms; includes quality control and filtering |
| Salmon/Kallisto [16] | Pseudoalignment for rapid transcript quantification | Useful for large-scale 3'-end sequencing data; faster than traditional aligners |
| STAR Aligner [16] | Spliced read alignment to reference genome | Recommended for TPM-based full-length data; enables isoform detection |
| Poisson-lognormal Distribution [18] | Statistical model for UMI count characteristics | Forms basis for quasi-UMI normalization of read-count data |
| ERCC Spike-in Controls [17] | External RNA controls for quality assessment | Enables technical variance estimation and protocol performance evaluation |
The choice between TPM and UMI quantification strategies represents a fundamental trade-off between transcriptome depth and cellular throughput. For embryonic development research requiring detailed isoform characterization or allele-specific expression analysis, SMART-seq2 with TPM normalization provides superior transcriptional coverage. For projects aiming to construct comprehensive cell atlases or identify rare cell populations during embryogenesis, 10X Genomics with UMI quantification offers the necessary scalability. The most advanced studies may strategically employ both approaches to leverage their complementary strengths in unraveling the complexity of early human development.
The Critical Role of scRNA-seq in Human Embryo Research and Model Authentication
Single-cell RNA sequencing (scRNA-seq) has revolutionized the study of early human development by enabling the unbiased transcriptional profiling of individual cells. This technology is particularly crucial for authenticating stem cell-based embryo models, which serve as indispensable tools for understanding human development, infertility, and congenital diseases given the scarcity and ethical constraints associated with natural human embryos. The usefulness of these models hinges on their molecular, cellular and structural fidelities to their in vivo counterparts, making accurate transcriptomic assessment paramount [13]. Among the plethora of available scRNA-seq platforms, the plate-based SMART-seq2 and the droplet-based 10X Genomics Chromium (10X) represent two frequently used and methodologically distinct approaches. Selecting the appropriate platform is not merely a technical decision but a strategic one that directly influences the biological insights that can be gained. This guide provides an objective comparison of these two platforms, framing their performance within the specific context of human embryo research and model validation, to empower researchers in making an informed choice for their studies.
The fundamental difference between SMART-seq2 and 10X Genomics lies in their core methodology: one is a full-length, plate-based protocol, and the other is a 3'-end counting, droplet-based system.
SMART-seq2 is a plate-based scRNA-seq method where individual cells are typically sorted into multi-well plates. Its protocol is designed to generate full-length cDNA through template-switching mechanism. This allows for read coverage across the entire transcript, which is beneficial for detecting gene isoforms, allelic expression, and single-nucleotide polymorphisms (SNPs). A key characteristic of SMART-seq2 is that it does not incorporate Unique Molecular Identifiers (UMIs), which are essential for correcting amplification bias [3] [2]. The protocol generally involves cell lysis, reverse transcription, cDNA amplification via PCR, and subsequent library preparation, often requiring manual pipetting unless automated [3] [20].
10X Genomics Chromium, in contrast, is a high-throughput droplet-based system that encapsulates single cells in gel bead-in-emulsions (GEMs). Each gel bead is coated with oligonucleotides containing cell barcodes and UMIs. This platform is a 3' end-counting method, meaning it captures and sequences only the 3' ends of transcripts. The incorporation of UMIs enables accurate quantification of original mRNA molecules by accounting for PCR duplication events. The key advantage of 10X is its ability to profile thousands of cells in a single run, making it highly scalable for large, heterogeneous samples [1] [3].
A recent advancement, Smart-seq3xpress, has miniaturized and streamlined the Smart-seq3 protocol (an evolution of Smart-seq2 that includes UMIs) to substantially reduce reagent use and increase cellular throughput while retaining full-transcript coverage. This demonstrates the ongoing innovation in full-length transcriptome sequencing [21].
Direct Performance Comparison: Key Metrics for Embryo Research
A direct comparative study using the same biological samples of CD45‑ cells provides rigorous, head-to-head performance data for these platforms [1] [12]. The findings are summarized in the table below, highlighting metrics critical to embryo research.
Table 1: Direct Performance Comparison of SMART-seq2 and 10X Genomics Chromium
| Performance Metric | SMART-seq2 | 10X Genomics Chromium |
|---|---|---|
| Genes Detected per Cell | Higher (detects more genes, especially low-abundance transcripts) [1] | Lower [1] |
| Transcript Coverage | Full-length [3] | 3'-end only [3] |
| Unique Molecular Identifier (UMI) | No (Smart-seq2) [2]; Yes (Smart-seq3) [21] | Yes [1] |
| Throughput (Number of Cells) | Lower (typically hundreds) [1] | Higher (thousands to tens of thousands) [1] |
| Sensitivity to Low-Abundance Transcripts | Higher [1] | Lower, with higher noise for low-expression mRNAs [1] |
| Detection of Non-Coding RNA | Lower proportion of lncRNAs (~2.9–3.8%) [1] | Higher proportion of lncRNAs (~6.5–9.6%) [1] |
| Mitochondrial Gene Proportion | Higher (similar to bulk RNA-seq) [1] | Lower [1] |
| Data Composite | Resembles bulk RNA-seq data more closely [1] [12] | Less similar to bulk data [1] [12] |
| Dropout Rate (Technical zeros) | Less severe for low-expression genes [1] | More severe, especially for genes with lower expression levels [1] |
| Rare Cell Type Detection | Limited by lower cell throughput [1] | Excellent, due to high cell throughput [1] |
| Isoform & Splicing Analysis | Suitable (detects alternatively spliced transcripts) [1] | Not suitable [3] |
This comparative data shows a clear trade-off: SMART-seq2 offers greater depth of information per cell, while 10X Genomics provides a broader census of cellular diversity.
Application in Human Embryo Research and Model Authentication
The construction of a comprehensive human embryo reference dataset, integrating multiple scRNA-seq studies from the zygote to the gastrula stage, is a pivotal application of these technologies. Such a reference is essential for benchmarking the fidelity of stem cell-based embryo models [13]. The choice of scRNA-seq platform directly impacts the resolution of this reference and the subsequent validation process.
For Reference Atlas Construction, the high cellular throughput of 10X Genomics is advantageous for capturing the full spectrum of cellular heterogeneity present in developing embryos. It can effectively profile the rare and transient cell populations that emerge during lineage specification, such as the divergence of the inner cell mass (ICM), trophectoderm (TE), and hypoblast, and the later emergence of primitive streak, mesoderm, and definitive endoderm during gastrulation [13].
For In-Depth Characterization of Specific Lineages, the superior sensitivity and full-length transcript coverage of SMART-seq2 makes it more suitable for validating the molecular maturity of embryo models. Its ability to detect more genes per cell and its closer resemblance to bulk RNA-seq data allow for a more detailed comparison of key lineage markers, transcription factor dynamics, and signaling pathway activities. This is crucial for ensuring that in vitro models not only contain the correct cell types but also exhibit transcriptomes that accurately mirror their in vivo counterparts at comparable developmental stages [1] [13].
A study employing an integrated human embryo reference to evaluate published embryo models highlighted the risk of misannotation when inappropriate references are used for benchmarking. This underscores the necessity of selecting a scRNA-seq platform whose technical characteristics align with the biological question to ensure authentic authentication [13].
Experimental Protocols and Workflow
SMART-seq2 Workflow Protocol
The typical SMART-seq2 workflow involves the following key steps [3] [20]:
- Cell Isolation: Single cells are isolated via Fluorescence-Activated Cell Sorting (FACS) into individual wells of a 96- or 384-well plate containing lysis buffer. "Index sorting" can be used to record the phenotypic properties of each cell as it is sorted.
- Cell Lysis and Reverse Transcription: Cells are lysed, and mRNA is reverse-transcribed using an oligo-dT primer and a template-switching oligonucleotide (TSO) to generate full-length cDNA.
- cDNA Amplification: The full-length cDNA is amplified via PCR.
- Library Preparation and Sequencing: The amplified cDNA is fragmented and tagged with sequencing adapters. A key note is that libraries are typically demultiplexed, meaning each cell generates a separate set of FASTQ files [2].
10X Genomics Chromium Workflow Protocol
The 10X Genomics workflow is highly integrated and automated [1] [3]:
- Cell Encapsulation: A single-cell suspension is loaded onto a Chromium chip, where each cell is co-encapsulated with a single gel bead into a nanoliter-scale droplet. Each bead is coated with barcoded oligos containing a cell barcode, a UMI, and a poly-dT sequence.
- Reverse Transcription: Inside the droplet, the cells are lysed, and the mRNA is reverse-transcribed, creating cDNA tagged with the cell barcode and UMI.
- Library Preparation: The droplets are broken, and the barcoded cDNA is pooled, cleaned, and prepared for sequencing. The final output is one set of FASTQ files for the entire experiment, where cell identities are later bioinformatically inferred from the barcodes [2].
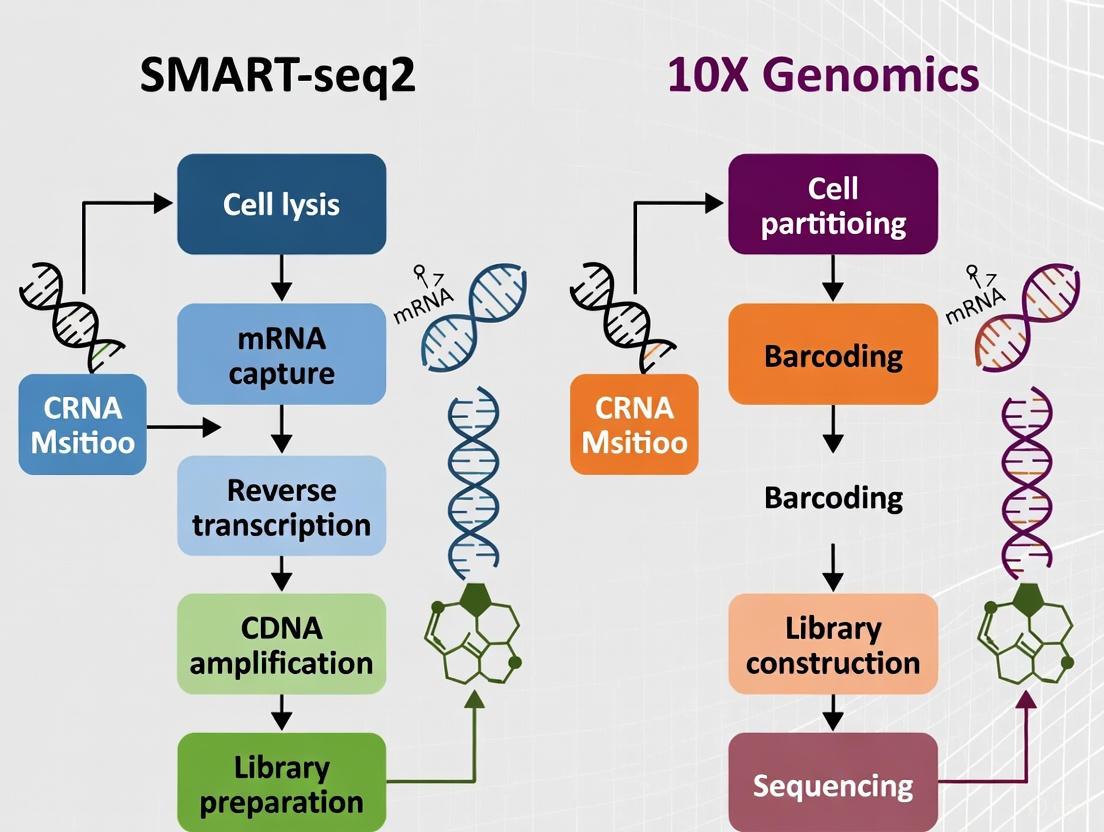
Diagram: scRNA-seq Platform Workflows. This diagram illustrates the distinct experimental workflows for SMART-seq2 (blue) and 10X Genomics (red), highlighting the plate-based versus droplet-based approaches and their different output structures.
The Scientist's Toolkit: Essential Reagents and Materials
The following table details key reagents and materials used in these scRNA-seq platforms, which are critical for experimental planning and execution.
Table 2: Essential Research Reagent Solutions for scRNA-seq
| Item | Function/Role | Platform Specificity |
|---|---|---|
| Template Switching Oligo (TSO) | Enables synthesis of full-length cDNA during reverse transcription by adding a universal adapter sequence to the 5' end of the RNA template. | Critical for SMART-seq2/3 [21] |
| Barcoded Gel Beads | Provides cell barcodes and UMIs for labeling all transcripts from a single cell during reverse transcription within a droplet. | Critical for 10X Genomics [1] |
| Polymerases for Pre-amplification | Enzymes like SeqAmp or KAPA HiFi used to amplify the initial cDNA product to generate sufficient material for library construction. | Critical for SMART-seq2/3; choice affects performance [21] [20] |
| Tn5 Transposase | An enzyme used to simultaneously fragment and tagment (add sequencing adapters to) cDNA during library preparation. | Used in both, but optimization is key for Smart-seq3xpress [21] |
| Cell Lysis Buffer | A solution designed to rupture the cell membrane and release cellular RNA while stabilizing the RNA and inhibiting RNases. | Used in both platforms [3] |
| Hydrophobic Overlay (e.g., Vapor-Lock) | An inert substance layered over low-volume reactions in plates to prevent evaporation during thermal cycling. | Critical for miniaturized protocols like Smart-seq3xpress [21] |
The choice between SMART-seq2 and 10X Genomics for human embryo research and model authentication is not a matter of one platform being superior to the other, but rather of selecting the right tool for the specific research objective.
Choose SMART-seq2 when your research question requires maximum transcriptional detail per cell. This includes validating the expression of low-abundance key transcription factors, analyzing splice isoforms, or achieving the closest possible transcriptomic resemblance to bulk RNA-seq data from reference embryos. It is ideal for deeply characterizing a defined number of cells from a specific lineage or stage.
Choose 10X Genomics when the primary goal is to capture cellular heterogeneity at scale. This is essential for comprehensive atlas-building of entire embryos, identifying rare or unexpected cell populations within complex models, or when the developmental process involves continuous and dynamic transitions between cell states that are best understood by profiling thousands of cells.
As the field advances, protocols like Smart-seq3xpress are emerging to bridge this divide by offering higher throughput for full-length methods. Furthermore, computational tools like CMAP are being developed to integrate single-cell data with spatial transcriptomics, endowing cells with spatial coordinates to better understand the tissue microenvironment [21] [22]. Ultimately, an informed platform selection, grounded in the trade-offs of sensitivity and throughput, is foundational to generating reliable data for authenticating human embryo models and advancing our understanding of early human development.
Tailoring scRNA-seq Protocols for Embryonic Cell Analysis
Assessing Cell Throughput and Input Requirements for Embryo-Derived Cells
The selection of an appropriate single-cell RNA sequencing (scRNA-seq) platform is a critical step in experimental design, profoundly impacting the resolution and scope of biological insights, particularly in the nuanced field of embryo-derived cell research. The plate-based Smart-seq2 and the droplet-based 10X Genomics Chromium (10X) represent two frequently used yet fundamentally different approaches to scRNA-seq. This guide provides an objective, data-driven comparison of these platforms, focusing on their performance characteristics when applied to cells from limited and precious samples, such as human embryos. The following analysis synthesizes direct comparative studies to inform researchers, scientists, and drug development professionals in making an informed choice for their investigations into early development.
The core difference between these platforms lies in their methodology: Smart-seq2 is a plate-based protocol that generates full-length transcript data, while 10X Chromium is a droplet-based system that uses 3’-end counting with Unique Molecular Identifiers (UMIs) to enable the profiling of thousands of cells in a single run [3].
A direct comparative study, which processed the same samples of CD45⁻ cells on both platforms, provides a robust foundation for this comparison. The key quantitative findings from this study are summarized in the table below.
Table 1: Direct Experimental Comparison of Smart-seq2 and 10X Genomics Chromium
| Performance Metric | Smart-seq2 | 10X Genomics Chromium |
|---|---|---|
| Cell Throughput | Low (10s to 100s of cells) [5] [3] | High (thousands of cells) [12] [3] |
| Genes Detected per Cell | Higher [12] [1] | Lower [12] [1] |
| Sensitivity for Low-Abundance Transcripts | Higher [12] [23] | Lower, with higher noise for low-expression mRNAs [12] [1] |
| Detection of Alternatively Spliced Transcripts | Yes, due to full-length coverage [12] [3] | Limited, due to 3'-end counting [2] [3] |
| Data Resemblance to Bulk RNA-seq | Closer resemblance [12] [23] | Less resemblance [12] |
| Mitochondrial Gene Proportion | Higher (∼30% average) [1] | Lower (0–15%) [1] |
| Ribosomal Gene Proportion | Lower [1] | Higher (2.6–7.2x higher than Smart-seq2) [1] |
| Long Non-Coding RNA (lncRNA) Proportion | Lower (2.9–3.8%) [1] | Higher (6.5–9.6%) [1] |
| Dropout Rate (Technical zeros) | Less severe [12] | More severe, especially for low-expression genes [12] [23] |
| Ability to Detect Rare Cell Types | Limited by throughput [12] | High, due to high cell number coverage [12] [23] |
Experimental Workflows and Protocol Details
Understanding the experimental workflow is essential for planning and resource allocation. The two platforms involve distinct processes from cell preparation to sequencing.
Smart-seq2 Workflow
Smart-seq2 is a plate-based method where individual cells are manually or robotically sorted into multi-well plates containing lysis buffer [3]. The protocol involves:
- Full-length cDNA Synthesis: Utilizes template-switching to generate cDNA that covers the entire transcript length [3].
- cDNA Amplification: The full-length cDNA is amplified via PCR without the incorporation of UMIs. This lack of UMIs means there is no built-in molecular correction for PCR amplification bias [2].
- Library Preparation and Sequencing: The amplified cDNA is fragmented and prepared for sequencing, typically resulting in one set of FASTQ files per cell [2].
10X Genomics Chromium Workflow
The 10X platform is a droplet-based system that automates and parallelizes the initial steps [3]:
- Gel Bead-in-Emulsion (GEM) Generation: Single cells, gel beads coated with barcoded oligonucleotides, and reagents are co-encapsulated into nanoliter-scale droplets.
- Barcoding and Reverse Transcription: Within each droplet, cell lysis and reverse transcription occur. The oligonucleotides on the gel beads contain a cell barcode (to tag all mRNAs from the same cell), a unique molecular identifier (UMI) (to tag individual mRNA molecules), and a poly(dT) sequence for mRNA capture.
- Library Preparation and Sequencing: After breaking the droplets, the barcoded cDNA is pooled, amplified, and prepared for sequencing. This results in a single set of FASTQ files where cell identity is later bioinformatically decoded using the barcodes [2].
The following diagram illustrates the key differences in these two foundational workflows.
Application in Embryo-Derived Cell Research
The choice between Smart-seq2 and 10X Genomics becomes particularly significant when working with embryo-derived cells, where sample size is often limited and cellular heterogeneity is a key focus.
The high cellular throughput of the 10X platform makes it exceptionally powerful for defining the complete cellular landscape of a complex embryonic tissue. It enables the identification of rare, transient, or previously uncharacterized cell populations [12] [13]. For instance, building a comprehensive reference of human embryogenesis from the zygote to gastrula stage requires the integration of thousands of cells to capture all lineages, including epiblast, hypoblast, trophectoderm, and their derivatives [13].
Conversely, Smart-seq2 excels in focused studies on specific, pre-identified progenitor or lineage populations. Its higher sensitivity and full-length transcript coverage allow researchers to delve deeper into the biology of these specific groups. This includes detecting critical transcription factors at low levels, analyzing allele-specific expression, and investigating alternative splicing events—analyses that are crucial for understanding the regulatory mechanisms driving early cell fate decisions [12] [3]. For example, trajectory inference analysis of epiblast, hypoblast, and trophectoderm lineages relies on the sensitive detection of dynamically expressed key transcription factors like NANOG, GATA4, and CDX2 [13].
Table 2: Platform Selection Guide for Embryo Cell Research Applications
| Research Objective | Recommended Platform | Rationale |
|---|---|---|
| Census-taking: Comprehensive atlas building of a whole embryo or complex tissue. | 10X Genomics Chromium | High cell throughput ensures rare cell types (e.g., a specific progenitor population) are captured within the dataset [12] [13]. |
| Deep phenotyping: In-depth molecular analysis of a known, sorted cell population (e.g., inner cell mass cells). | Smart-seq2 | Higher genes detected per cell and sensitivity provides a more complete transcriptomic profile of the target population [12] [3]. |
| Rare cell discovery within a heterogeneous sample without prior knowledge. | 10X Genomics Chromium | Profiling thousands of cells maximizes the probability of capturing and identifying unexpected or very rare cell states [12] [23]. |
| Isoform analysis & allele-specific expression. | Smart-seq2 | Full-length transcript sequencing is required to resolve different splice variants and assess SNP-level expression [5] [3]. |
| Studies requiring UMI-based digital gene expression counting. | 10X Genomics Chromium | UMIs correct for PCR amplification bias, providing more accurate quantitative data for gene expression levels [2] [3]. |
The Scientist's Toolkit: Essential Research Reagents and Materials
The following table details key reagents and materials used in these scRNA-seq workflows, which are critical for experimental planning.
Table 3: Key Research Reagent Solutions for scRNA-seq
| Item | Function | Platform Usage |
|---|---|---|
| Oligo-dT Primers | Binds to poly-A tail of mRNA to initiate reverse transcription. | Universal (Both Platforms) |
| Template Switching Oligo (TSO) | Enables synthesis of full-length cDNA by adding a universal primer sequence to the 5' end of mRNA. | Core to Smart-seq2 protocol [3]. |
| Barcoded Gel Beads | Contains cell barcode and UMI sequences for massively parallel labeling of transcripts within droplets. | Exclusive to 10X Genomics [3]. |
| Unique Molecular Identifiers (UMIs) | Short random nucleotide sequences that tag individual mRNA molecules to correct for PCR amplification bias. | Core feature of 10X; absent in Smart-seq2 [2] [3]. |
| Cell Lysis Buffer | Breaks open the cell membrane to release RNA while preserving its integrity. | Universal (Both Platforms) |
| Reverse Transcriptase | Synthesizes complementary DNA (cDNA) from an RNA template. | Universal (Both Platforms) |
| PCR Reagents | Amplifies cDNA to generate sufficient material for sequencing library construction. | Universal (Both Platforms) |
Integrated Data Analysis and Pathway Considerations
A critical finding from comparative studies is that Smart-seq2 and 10X can identify distinct groups of differentially expressed genes and highly variable genes (HVGs) due to their different technical characteristics [12] [1]. For instance, one study found that while about 33% of the top 1000 HVGs were shared, the remainder were platform-specific, with 10X-specific HVGs enriching for cancer-related pathways like "PI3K–Akt signaling" [1]. This implies that biological conclusions can be influenced by the choice of platform.
Therefore, when integrating datasets generated from both platforms (e.g., to augment a public 10X dataset with new Smart-seq2 data), specialized bioinformatics methods are required to correct for batch effects that are not just technical but also biological in nature. Methods such as Mutual Nearest Neighbors (MNN) have been successfully used to integrate multiple human embryo scRNA-seq datasets into a unified reference, correcting for batch effects while preserving biological heterogeneity [13]. The following diagram visualizes this integration and analysis concept.
In summary, the decision between Smart-seq2 and 10X Genomics for profiling embryo-derived cells is not a matter of one platform being superior to the other, but rather a strategic choice based on the specific research question.
- Choose 10X Genomics Chromium when the primary goal is to profile a large number of cells to understand cellular heterogeneity at scale, discover rare cell types, and map the complete composition of a complex embryonic sample.
- Choose Smart-seq2 when the study focuses on a pre-defined, often limited, population of cells where the depth of transcriptional information—including the detection of low-abundance transcripts, alternative splicing, and single-nucleotide variants—is the paramount concern.
By aligning the distinct advantages of each platform with their experimental objectives, researchers can maximize the insights gained from precious embryo-derived cell samples, driving forward our understanding of early human development.
Comparing Gene Detection Sensitivity and Transcriptome Coverage
Single-cell RNA sequencing (scRNA-seq) has revolutionized biological research by enabling the profiling of transcriptomes at individual cell resolution. For researchers studying embryo cells, where each cell can represent a critical lineage decision, the choice of scRNA-seq platform is particularly consequential. This guide provides an objective comparison of two widely used technologies—the plate-based, full-length SMART-seq2 and the droplet-based, 3'-counting 10X Genomics Chromium—focusing on their gene detection sensitivity and transcriptome coverage. Performance differences between these platforms can significantly impact the identification of rare cell types, the detection of low-abundance transcripts, and the overall biological interpretation of data, making an informed platform selection essential for robust experimental design in embryonic development research.
The fundamental differences between SMART-seq2 and 10X Genomics Chromium protocols establish the framework for their performance characteristics.
The workflow diagram above illustrates the fundamental procedural differences between the two platforms. SMART-seq2 is a plate-based method where individual cells are sorted into multi-well plates, typically via fluorescence-activated cell sorting (FACS). It utilizes template-switching mechanisms during reverse transcription to generate full-length cDNA, which is subsequently amplified by PCR [3]. This approach provides uniform coverage across the entire transcript length, enabling the detection of alternative splicing events and single nucleotide polymorphisms. A significant limitation, however, is its lack of unique molecular identifiers (UMIs) in its standard protocol, making it impossible to correct for PCR amplification bias [2].
In contrast, the 10X Genomics Chromium system is a droplet-based method that encapsulates single cells in nanoliter-scale droplets together with barcoded beads. Each bead contains oligonucleotides with cell barcodes, UMIs, and poly(dT) sequences that capture the 3' ends of transcripts [3]. The incorporation of UMIs allows for precise digital counting of individual RNA molecules by correcting for PCR duplicates, thus providing more accurate quantitative expression data [2]. However, this method only sequences the 3' ends of transcripts, which limits its ability to detect isoform-level information.
Direct Performance Comparison
Quantitative Metrics and Experimental Findings
Direct comparisons using the same biological samples provide the most reliable performance assessment. The table below summarizes key quantitative findings from controlled comparative studies.
Table 1: Direct Performance Comparison Between SMART-seq2 and 10X Genomics Chromium
| Performance Metric | SMART-seq2 | 10X Genomics Chromium | Experimental Context |
|---|---|---|---|
| Genes Detected per Cell | ~4,000-9,000 [1] [3] | ~3,000-5,000 [1] [24] | CD45- cells & immune cell lines [1] [24] |
| Transcripts Detected per Cell | Higher detection of low-abundance transcripts [1] | Higher noise for low-expression genes [1] | CD45- cells from tumor tissues [1] |
| Mapping Efficiency | ~80% unique mapping ratio [1] | ~80% unique mapping ratio [1] | CD45- cells from tumor tissues [1] |
| Throughput (Cells per Run) | 96-384 cells (manual) [3] | 1,000-10,000+ cells [1] | Standard protocol specifications [1] [3] |
| Mitochondrial Gene % | ~30% (similar to bulk RNA-seq) [1] | 0-15% [1] | CD45- cells from tumor tissues [1] |
| Dropout Rate | Lower for low-expression genes [1] | Higher, especially for low-expression genes [1] | CD45- cells from tumor tissues [1] |
| Multiplet Rate | Low (visually identifiable) [3] | ~5% (at target loading concentration) [24] | Defined cell line mixtures [24] |
The data reveals a consistent pattern: SMART-seq2 demonstrates superior sensitivity in gene detection per cell, identifying significantly more genes than 10X Chromium across multiple studies [1] [3]. This advantage is particularly pronounced for low-abundance transcripts, making SMART-seq2 preferable for applications requiring detection of weakly expressed genes [1]. The higher mitochondrial gene percentage observed with SMART-seq2 likely results from more thorough cell lysis protocols rather than indicating poorer cell quality [1].
Conversely, 10X Chromium exhibits a more severe "dropout" problem (false zeros), particularly for genes with lower expression levels [1]. However, it offers a decisive advantage in cellular throughput, enabling the profiling of thousands of cells in a single run, which is crucial for identifying rare cell populations and comprehensive characterization of cellular heterogeneity [1].
Transcriptomic Characteristics and Bias Profiles
The technological differences between platforms lead to distinct transcriptomic bias profiles that significantly impact data interpretation.
Table 2: Transcriptomic Characteristics and Biological Applications
| Characteristic | SMART-seq2 | 10X Genomics Chromium | Biological Implication |
|---|---|---|---|
| Transcript Coverage | Full-length [2] [3] | 3' counting [2] [3] | SMART-seq2 enables isoform detection & SNP identification |
| Amplification Bias Correction | No UMIs (standard protocol) [2] | UMI-based correction [2] | 10X provides more accurate transcript quantification |
| Non-coding RNA Detection | Lower proportion of lncRNAs [1] | Higher proportion of lncRNAs [1] | 10X may be superior for non-coding RNA studies |
| Ribosomal RNA Content | 10.2-28.0% (rDNA) [1] | 0.03-0.4% (rDNA) [1] | SMART-seq2 requires careful rRNA removal |
| Expression Quantification | TPM (Transcripts Per Million) [1] | Normalized UMI counts [1] | Metrics not directly comparable between platforms |
| Biological Pathway Emphasis | Limited pathway enrichment in HVGs [1] | 34 enriched pathways in HVGs [1] | 10X may better capture biologically relevant heterogeneity |
SMART-seq2's full-length transcript coverage provides distinct advantages for specific research applications. The uniform coverage across transcripts enables the detection of alternative splicing events, allele-specific expression, and single-nucleotide polymorphisms [3]. This capability is particularly valuable in embryonic development research where isoform switching plays a crucial role in cell fate determination.
10X Chromium excels in capturing biologically relevant heterogeneity through its highly multiplexed design. Studies have shown that highly variable genes (HVGs) identified from 10X data enrich for 34 KEGG pathways—including biologically relevant pathways like "PI3K-Akt signaling pathway"—compared to only two pathways enriched in SMART-seq2-specific HVGs [1]. This suggests that 10X data may be more effective for identifying biologically meaningful cell subpopulations despite detecting fewer genes per cell.
Experimental Protocols for Technology Comparison
To ensure valid comparisons between platforms, researchers must follow rigorous experimental designs. The methodology below outlines a standardized approach for benchmarking scRNA-seq technologies.
Sample Preparation and Processing
- Biological Sample Selection: Use the same primary tissue source (e.g., embryonic tissue, cultured embryo models) for both platforms to enable direct comparison. The scarcity of human embryo samples makes the use of authenticated stem cell-based embryo models particularly valuable [13].
- Cell Sorting and Partitioning: Process the tissue into a single-cell suspension and split it into two aliquots. For SMART-seq2, use FACS to index-sort individual cells into 96- or 384-well plates containing lysis buffer, recording the phenotypic parameters of each cell [3]. For 10X Chromium, process the second aliquot according to the manufacturer's recommended cell concentration protocols.
- Library Preparation and Sequencing: Follow established protocols for each platform—SMART-seq2 with its full-length cDNA amplification [3] and 10X Chromium with its UMI-based 3' counting approach [24]. Sequence libraries to appropriate depths: typically 1-5 million reads per cell for SMART-seq2 and 20,000-100,000 reads per cell for 10X [1].
Data Processing and Quality Control
A standardized computational pipeline is essential for fair cross-platform comparison. The scumi pipeline offers a universal framework that processes both full-length and UMI-based data through consistent filtering and normalization steps [19].
- Read Alignment and Quantification: Map reads to an appropriate reference genome (e.g., GRCh38 for human embryo studies [13]) using STAR or similar aligners. For SMART-seq2, generate read counts per gene; for 10X, count unique UMIs per gene.
- Quality Control Filtering: Remove low-quality cells using consistent thresholds. For complex tissues like embryos, use cluster-based filtering rather than fixed cutoffs to avoid biasing against cell types with naturally lower RNA content [19].
- Data Normalization: Normalize data using appropriate methods—TPM for SMART-seq2 and normalized UMI counts for 10X [1]. For cross-platform comparison, consider downsampling to the same number of reads per cell before calculating detection metrics [19].
The Scientist's Toolkit
Essential Reagents and Materials
Table 3: Key Research Reagent Solutions for scRNA-seq Experiments
| Reagent/Material | Function | Platform Compatibility |
|---|---|---|
| Barcoded Beads | Cell barcoding and UMI labeling in droplets | 10X Genomics Chromium specific |
| Template Switching Oligos | Full-length cDNA synthesis | SMART-seq2 specific |
| Poly(dT) Primers | mRNA capture via poly-A tail | Both platforms |
| Cell Lysis Buffer | Release of cellular RNA | Both platforms (composition may vary) |
| Reverse Transcriptase | cDNA synthesis from RNA templates | Both platforms |
| PCR Reagents | cDNA amplification | Both platforms |
| Library Preparation Kit | Sequencing library construction | Platform-specific formulations |
| SPRIselect Beads | Size selection and clean-up | Both platforms |
Experimental Considerations for Embryo Research
When applying these technologies to embryo research, several specialized considerations apply. For studies of early human development, an organized and integrated human scRNA-seq reference dataset spanning from zygote to gastrula stages serves as an essential benchmarking resource [13]. Such references are particularly valuable for authenticating stem cell-based embryo models against their in vivo counterparts.
Researchers should also consider that each platform detects distinct groups of differentially expressed genes between cell clusters due to their different technical characteristics [1]. This suggests that the most comprehensive biological insights may come from leveraging both technologies complementarily, rather than relying on a single platform.
The choice between SMART-seq2 and 10X Genomics Chromium involves fundamental trade-offs between gene detection sensitivity and cellular throughput. SMART-seq2 provides superior sensitivity per cell, detecting more genes—particularly low-abundance transcripts—and enables full-length transcript analysis for isoform detection, making it ideal for focused studies of transcriptional dynamics in embryo cells where depth of transcriptome information is prioritized. Conversely, 10X Genomics Chromium offers superior scalability for profiling thousands of cells, identifies more biologically relevant pathways in heterogeneous populations, and provides more accurate transcript quantification through UMI incorporation, making it better suited for comprehensive atlas-building of embryonic cell types and states.
For embryo research specifically, the decision should be guided by the developmental stage, specific biological questions, and required resolution of cellular heterogeneity. Studies focusing on detailed transcriptome characterization of small numbers of critically important cells (e.g., early lineage specification) may benefit from SMART-seq2's sensitivity, while investigations of complex, heterogeneous systems (e.g., later organogenesis stages) may require 10X's throughput. As the field advances, automated implementations of full-length methods like Smart-seq3 are emerging that bridge some of these methodological gaps, offering both improved sensitivity and increased throughput [20].
Single-cell RNA sequencing (scRNA-seq) has become an indispensable tool for delineating cellular heterogeneity, especially in complex fields like embryo research. However, technical artifacts inherent to different platforms can significantly impact data interpretation. This guide provides a systematic comparison of two widely used scRNA-seq technologies—the plate-based SMART-seq2 and the droplet-based 10X Genomics Chromium—focusing on two critical technical parameters: mitochondrial read percentages and gene dropout rates. By synthesizing experimental data from multiple benchmarking studies, we aim to empower researchers to make informed decisions that enhance the validity and reliability of their findings in embryonic development studies.
In embryonic development research, where cellular identities are in constant flux, selecting an appropriate scRNA-seq platform is paramount. The 10X Genomics Chromium system is a high-throughput, droplet-based method that captures cells in nanoliter droplets, utilizing Unique Molecular Identifiers (UMIs) for digital transcript counting. It excels in profiling thousands to tens of thousands of cells per run, making it ideal for uncovering rare cell populations within a complex tissue. In contrast, SMART-seq2 is a plate-based, full-length RNA sequencing method. It provides greater sequencing depth per cell, enabling the detection of more genes per cell, including low-abundance transcripts and alternatively spliced isoforms, but with a lower overall cellular throughput [1] [3].
Two of the most critical technical artifacts that vary significantly between these platforms are:
- Mitochondrial Read Percentages: A high percentage of reads mapping to the mitochondrial genome can indicate cellular stress or apoptosis, but it is also highly influenced by protocol-specific cell lysis efficiency.
- Gene Dropout Rates: This refers to the stochastic failure to detect mRNA molecules that are actually present in the cell, a phenomenon that disproportionately affects genes with low to medium expression levels and can obscure true biological signals.
Understanding the source and expected magnitude of these artifacts is the first step in designing robust experiments and implementing appropriate corrective bioinformatic measures.
Quantitative Performance Comparison
Data from controlled comparative studies reveal distinct performance profiles for SMART-seq2 and 10X Genomics. The table below summarizes key metrics directly influencing data interpretation in embryonic research.
Table 1: Direct comparison of key technical metrics between SMART-seq2 and 10X Genomics Chromium
| Performance Metric | SMART-seq2 | 10X Genomics Chromium | Key Implications for Embryo Research |
|---|---|---|---|
| Mitochondrial Read Percentage | ~30% (2.8-9.1x higher than 10X) [1] | 0-15% [1] | High % in Smart-seq2 may require careful QC thresholds to avoid filtering stressed embryonic cells. |
| Gene Dropout Rate | Lower, especially for low-expression genes [1] [20] | More severe, particularly for genes with lower expression levels [1] | 10X data may miss critical, lowly expressed transcription factors in early embryogenesis. |
| Genes Detected per Cell | Higher (e.g., 4,000-7,000) [3] | Lower (e.g., 1,288-4,776) [1] [7] [25] | Smart-seq2 offers deeper transcriptome coverage per cell, beneficial for characterizing novel states. |
| Throughput (Number of Cells) | Lower (96-384 per plate) [3] | Higher (thousands per run) [3] | 10X is superior for constructing comprehensive atlases from entire embryos or complex tissues. |
| Detection of Low-Abundance Transcripts | Superior [1] | Higher noise for low-expression mRNAs [1] | Smart-seq2 is more sensitive for rare transcripts, which can be crucial in early lineage specification. |
| Data Composition (lncRNA) | Lower proportion (2.9-3.8%) [1] | Higher proportion (6.5-9.6%) [1] | 10X may provide more data on non-coding RNAs, an important regulatory layer in development. |
Detailed Experimental Protocols from Benchmarking Studies
To ensure the reproducibility of the comparative data presented, this section outlines the key experimental methodologies employed in the cited benchmark studies.
Direct Comparative Analysis of 10X Genomics Chromium and Smart-seq2
Cell Source and Preparation:
- The study used CD45− cells isolated from multiple tissue types (liver tumor, non-tumor adjacent tissue, primary rectal tumor, and metastasized tumor) from two cancer patients.
- Cells were sorted using Fluorescence-Activated Cell Sorting (FACS) to ensure a consistent starting population for both platforms [1].
Library Preparation and Sequencing:
- Smart-seq2: Single cells were sorted into 96-well plates containing lysis buffer. The protocol followed the established Smart-seq2 method, which includes reverse transcription with template-switching and PCR amplification to generate full-length cDNA. Libraries were sequenced to an average depth of 1.7–6.3 million reads per cell [1].
- 10X Genomics Chromium: Single-cell suspensions were loaded onto the Chromium Single Cell Controller to generate gel bead-in-emulsions (GEMs). Libraries were constructed using the standard 10X Genomics protocol, which involves barcoding with UMIs and PCR amplification. Sequencing depth was lower, averaging 20–92 thousand reads per cell [1].
Data Analysis:
- Read mapping was performed using a standardized pipeline for both datasets. Mitochondrial read percentages were calculated as the fraction of uniquely mapped reads that aligned to the mitochondrial genome.
- Gene detection sensitivity and dropout rates were assessed by analyzing the relationship between gene expression levels and the frequency of non-detection (zero counts) across cells [1].
Comparative Analysis of Thymocytes Using 10x Genomics and Parse scRNA-seq
While this study compared 10X to a different platform (Parse), its methodology for quality control is highly relevant.
Cell Source:
- Thymi were isolated from age- and sex-matched C57BL/6N mice. The thymic lobes were separated into biological and technical replicates to assess variability [7].
Quality Control Metrics:
- The fraction of reads mapping to mitochondrial genes was calculated for each cell.
- The proportion of long non-coding RNA (lncRNA) transcripts was also examined as an indicator of sample quality [7].
The Scientist's Toolkit: Essential Research Reagent Solutions
The following table catalogues key reagents and materials critical for performing the scRNA-seq experiments discussed and for mitigating the described technical artifacts.
Table 2: Key research reagent solutions for scRNA-seq in embryonic research
| Reagent/Material | Function | Consideration for Technical Artifacts |
|---|---|---|
| Cell Lysis Buffer | Breaks open cell and nuclear membranes to release RNA. | Lysis efficiency impacts mitochondrial RNA release; harsher lysis (often in plate-based methods) increases mitochondrial reads [1]. |
| Oligo-dT Primers | Binds to poly-A tails of mRNA for cDNA synthesis. | The design (e.g., anchored vs. non-anchored) and concentration can influence capture efficiency and 3' bias. |
| Template Switching Oligo (TSO) | Enables template switching during reverse transcription, a key step in SMART-seq chemistry. | Critical for full-length cDNA synthesis in SMART-seq2; its efficiency affects gene detection rates [8]. |
| UMI Barcoded Beads (10X) | Provides cell barcode and UMI for mRNA transcript tagging in droplet-based platforms. | UMIs are essential for accurate transcript quantification and mitigating amplification noise in 10X data [25]. |
| mRNA Magnetic Beads | Purifies and selects poly-A RNA from the total cDNA or lysate. | Reduces background and ribosomal RNA contamination, improving library complexity and sensitivity. |
| Nextera XT DNA Library Prep Kit | Prepares sequencing-ready libraries from amplified cDNA. | Used in many plate-based protocols (e.g., Takara SMART-seq HT); tagmentation efficiency affects library complexity [8]. |
Workflow and Technical Artifact Relationships
The following diagram illustrates the fundamental workflow differences between the two platforms and how specific steps contribute to the technical artifacts in focus.
The choice between SMART-seq2 and 10X Genomics is not a matter of superiority but of strategic alignment with research goals, balanced against the inherent technical artifacts of each platform.
Choose SMART-seq2 when your research question demands maximum transcriptional information per cell. This is crucial for:
- Resolving subtle differences between closely related embryonic cell states.
- Detecting lowly expressed but biologically critical genes, such as certain transcription factors and signaling components.
- Studying alternative splicing or allele-specific expression, as it provides full-length transcript coverage [1] [8].
- Mitigation Strategy: Be prepared to implement stringent quality control filters based on mitochondrial read percentages and utilize experimental designs that account for lower throughput.
Choose 10X Genomics Chromium when the objective is to map cellular heterogeneity at scale. This is ideal for:
- Constructing comprehensive reference atlases of entire embryos or complex tissues [13].
- Identifying rare, transient cell populations that might be missed in lower-throughput studies.
- Projects where cost-per-cell is a significant constraint.
- Mitigation Strategy: Employ advanced imputation and normalization algorithms to address the high dropout rate. Focus validation efforts on low-expression genes identified as differentially expressed.
For the most ambitious projects aiming to capture both breadth and depth, a tiered approach can be highly effective. Use 10X Genomics to survey the entire embryonic landscape and identify key populations or stages of interest. Subsequently, apply SMART-seq2 to perform deep transcriptional profiling on targeted, FACS-sorted cells from these populations to uncover deeper regulatory mechanisms. By understanding and strategically managing technical artifacts, researchers can fully leverage the power of scRNA-seq to unravel the complexities of embryonic development.
Single-cell RNA sequencing (scRNA-seq) has revolutionized developmental biology by enabling the transcriptomic profiling of individual embryonic cells. Among the leading technologies, plate-based Smart-seq2 and droplet-based 10X Genomics Chromium offer distinct advantages and limitations for constructing embryonic references and tracing cell lineages. This guide objectively compares their performance using published experimental data, providing researchers with evidence-based selection criteria for embryo research applications.
Technical Performance Comparison
Direct comparative analysis using the same biological samples reveals significant technical differences between platforms that impact their utility for embryonic studies.
Table 1: Key Technical Performance Metrics for Embryo Research
| Performance Metric | Smart-seq2 | 10X Genomics Chromium |
|---|---|---|
| Genes detected per cell | Higher (especially low-abundance transcripts) [1] | Lower, with higher noise for low-expression genes [1] |
| Transcript coverage | Full-length transcript coverage [21] | 3' or 5' end counting only [21] |
| Cell throughput | Limited (typically 96-384 cells per run) [1] | High (thousands of cells per run) [1] |
| Mitochondrial gene capture | Higher proportion (average ~30%) [1] | Lower proportion (0-15%) [1] |
| Unique molecular identifiers | Not typically used (TPM normalization) [1] | UMI-based quantification [1] |
| Dropout rate | Lower for low-expression genes [1] | More severe, especially for low-expression genes [1] |
| Isoform detection | Capable of detecting alternatively spliced transcripts [1] | Limited by 3'/5' end counting [1] |
| Non-coding RNA detection | Lower proportion of lncRNAs (2.9-3.8%) [1] | Higher proportion of lncRNAs (6.5-9.6%) [1] |
Table 2: Experimental Design Considerations for Embryo Studies
| Consideration | Smart-seq2 | 10X Genomics Chromium |
|---|---|---|
| Optimal application | Deep molecular phenotyping, isoform analysis, rare transcript detection [1] | Cell atlas construction, rare cell type discovery, lineage tracing [1] |
| Starting material | Single cells or low-input samples [26] | Single-cell suspensions [27] |
| Lineage tracing integration | Compatible with fluorescent marker systems (e.g., Rainbow-seq) [28] | Compatible with barcoding approaches [29] |
| Spatial context preservation | Requires additional experimental methods [29] | Can integrate with spatial transcriptomics [29] |
| Cost per cell | Higher [26] [30] | Lower [26] [30] |
| Hands-on time | More intensive protocol [21] | Streamlined workflow [27] |
Experimental Protocols for Embryo Research
Smart-seq2 Workflow for Embryonic Cells
The plate-based Smart-seq2 protocol provides high-sensitivity full-length transcriptome data essential for detailed embryonic characterization.
Key methodological details:
- Cell collection: Embryonic cells are individually sorted into plate wells using fluorescence-activated cell sorting (FACS) [28]
- Reverse transcription: Utilizes template-switching oligonucleotides (TSOs) to ensure full-length cDNA synthesis [21]
- Amplification: PCR pre-amplification enables sequencing from minimal starting material [21]
- Library preparation: Tagmentation-based approaches (e.g., Smart-seq3xpress) have streamlined the process while maintaining quality [21]
10X Genomics Workflow for Embryonic Atlas Construction
The droplet-based 10X Genomics approach enables large-scale embryonic cell atlas development.
Key methodological details:
- Cell encapsulation: Thousands of cells are partitioned into nanoliter droplets with barcoded beads [27]
- Molecular barcoding: Each transcript receives a unique molecular identifier (UMI) during reverse transcription [1]
- Library preparation: Pooled processing enables cost-effective analysis of thousands of cells [26]
- Bioinformatics: Cell Ranger pipeline processes barcoded data into gene-cell matrices [27]
Applications in Embryo Reference and Lineage Tracing
Recent efforts to create integrated embryonic references highlight the complementary value of both technologies. A 2025 study developed a human embryo reference tool integrating six published datasets from zygote to gastrula stages, enabling authentication of stem cell-based embryo models [13]. The reference successfully captured:
- Lineage branching points from inner cell mass to epiblast and hypoblast
- Transcription factor activities driving lineage specification (e.g., DUXA in 8-cell lineages, OVOL2 in trophectoderm)
- Developmental trajectories using Slingshot inference revealing three main lineages [13]
For mouse embryonic development, researchers have combined 10X Genomics v3 with enrichment strategies to overcome the underrepresentation of endodermal cells in early stages [29]. This approach enabled identification of novel foregut subpopulations and comprehensive mapping of endodermal organogenesis.
Lineage Tracing Applications
Genetic lineage tracing combined with scRNA-seq has proven particularly powerful for understanding embryonic development:
Table 3: Lineage Tracing Approaches in Embryo Research
| Method | Technology | Application | Key Finding |
|---|---|---|---|
| Rainbow-seq [28] | Smart-seq2 | Mouse preimplantation development | Lineage differences become clear at whole-transcriptome level, not single-gene level |
| Cre-loxP systems [29] | 10X Genomics v3 | Mouse endodermal organogenesis | Widespread fate convergence and divergence within endodermal organ progenitors |
| Spatial lineage tracing [29] | Multi-platform integration | Spatiotemporal analysis | Bridged critical gap between division history and single-cell RNA-seq assays |
The Rainbow-seq method exemplifies Smart-seq2's application in lineage tracing, combining fluorescent protein markers as expressible genomic barcodes with full-length transcriptome sequencing [28]. This approach revealed that approximately two-thirds of mouse embryos exhibited unbalanced distribution of cell lineages between embryonic and abembryonic poles at the blastocyst stage [28].
The Scientist's Toolkit
Table 4: Essential Research Reagent Solutions for Embryo scRNA-seq
| Reagent/Resource | Function | Example Applications |
|---|---|---|
| Smart-seq2/3 reagents [21] | Full-length scRNA-seq | Low-input embryonic samples, isoform analysis [28] |
| 10X Genomics Chromium [26] [30] | High-throughput scRNA-seq | Embryonic cell atlas construction [29] |
| Fluorescent marker systems [28] | Lineage tracing | Rainbow-seq, division history tracking [28] |
| Cre-loxP models [29] | Genetic lineage tracing | Endodermal subpopulation mapping [29] |
| FACS instrumentation | Cell sorting | Specific embryonic cell population isolation [29] |
| Reference datasets [13] | Benchmarking | Human embryo model authentication [13] |
Pathway to Experimental Success
Signaling Pathways in Embryonic Development
Comprehensive embryonic references have elucidated critical signaling pathways governing development:
The choice between Smart-seq2 and 10X Genomics for embryo research depends heavily on experimental goals. Smart-seq2 provides superior sensitivity for detecting low-abundance transcripts, alternative splicing, and full-length isoform information, making it ideal for deep molecular phenotyping of limited embryonic cell populations. Conversely, 10X Genomics offers superior scalability for constructing comprehensive embryonic atlases and identifying rare cell populations, albeit with reduced sensitivity per cell. The most advanced embryonic studies increasingly leverage both technologies' complementary strengths, with 10X Genomics enabling broad cellular surveys and Smart-seq2 providing deep validation of key developmental transitions. As embryo references become more comprehensive, this multi-platform approach will continue to drive discoveries in developmental biology.
The choice between Smart-seq2 and 10X Genomics Chromium (10X) single-cell RNA sequencing (scRNA-seq) platforms significantly influences the strategy and success of integrating transcriptomic data with other modalities, such as T-cell Receptor (TCR) sequencing and Assay for Transposase-Accessible Chromatin using sequencing (ATAC-seq). These technologies have distinct technical philosophies: Smart-seq2 is a plate-based, full-length transcript method that provides high sensitivity and coverage across the entire transcript, while 10X is a droplet-based, 3'-end counting method that uses Unique Molecular Identifiers (UMIs) to enable the profiling of thousands of cells in a single experiment [1] [2] [31]. This fundamental difference dictates their compatibility with accompanying assays, the biological questions they can address, and the computational tools required for integrative analysis. Within the specific context of embryo cell research, understanding these trade-offs is essential for designing studies that can robustly link gene expression to immune repertoire and epigenetic regulation.
Direct Comparative Analysis of SMART-seq2 and 10X Genomics
A direct comparative study analyzing data from the same CD45- cell samples revealed distinct performance characteristics for each platform [1] [12] [23].
Table 1: Key Performance Metrics from a Direct Comparative Study
| Feature | Smart-seq2 | 10X Genomics Chromium |
|---|---|---|
| Transcript Coverage | Full-length [2] | 3'-end only [2] [31] |
| Genes Detected per Cell | Higher [1] [12] [23] | Lower [1] [12] [23] |
| Sensitivity for Low-Abundance Transcripts | Higher [1] [12] [23] | Lower, with higher noise [1] [12] [23] |
| Throughput (Number of Cells) | Low (tens to hundreds) [1] [31] | High (thousands to tens of thousands) [1] [31] |
| UMI Utilization | No (prior to Smart-seq3) [2] | Yes [2] [31] |
| Data Composite | More closely resembles bulk RNA-seq data [1] [12] [23] | Distinct from bulk data [1] [12] [23] |
| Detection of Rare Cell Types | Limited by throughput [1] | Excellent, due to high cell throughput [1] |
| Proportion of Mitochondrial Genes | Higher [1] [12] [23] | Lower [1] [12] [23] |
| Proportion of Long Non-Coding RNAs (lncRNAs) | Lower (2.9%-3.8%) [1] | Higher (6.5%-9.6%) [1] |
Experimental Protocol for Direct Comparison
The experimental data in Table 1 were generated from a systematic study designed to minimize biological variability [1]. Researchers collected CD45- cells from multiple cancer tissue samples (liver tumor, non-tumor adjacent tissue, primary rectal tumor, and metastasized liver tumor). For each sample, the same population of sorted cells was split and profiled using both the 10X Genomics Chromium platform and the plate-based Smart-seq2 protocol. For Smart-seq2, cells were individually sorted into plates, followed by reverse transcription and PCR pre-amplification to generate full-length cDNA [1]. For 10X, cells were loaded onto the Chromium instrument to create single-cell barcoded droplets, where library construction relies on in vitro transcription and captures 3' ends of transcripts with UMIs [1]. Bulk RNA-seq data was also generated from the same samples to serve as a benchmark. This paired experimental design allowed for a direct and fair assessment of sensitivity, precision, and power for subpopulation identification between the two platforms.
Integration with T-cell Receptor (TCR) Sequencing
Platform-Specific TCR Sequencing Strategies
The choice of scRNA-seq platform dictates the method for obtaining paired transcriptome and TCR data.
Table 2: Strategies for Integrating scRNA-seq with TCR Sequencing
| Platform | Integration Strategy | Key Advantage | Key Limitation |
|---|---|---|---|
| Smart-seq2 | Targeted amplification of TCR genes from the full-length cDNA generated during library prep. | Full-length V(D)J sequence allows for precise reconstruction of paired clonotypes from a single cell. | Requires additional experimental steps and primer sets, and is lower throughput. |
| 10X Genomics | Commercially available paired kits (e.g., Single Cell 5' V(D)J + Gene Expression). | Seamless and simultaneous capture of 5' transcriptome (including V(D)J transcripts) and immune repertoire from thousands of cells. | Only sequences the 5' end of the TCR transcript, which may limit the resolution of full-length analysis. |
Workflow for Integrated Analysis
The following diagram illustrates the general workflow for obtaining paired scRNA-seq and TCR data, with platform-specific divergences.
Integrated TCR and Transcriptome Profiling Workflow
Integration with ATAC-seq
Compatibility and Workflow Considerations
Integrating scRNA-seq with single-cell ATAC-seq (scATAC-seq) to link transcriptomic states with chromatin accessibility is a powerful multi-omic approach. The characteristics of each platform shape the integration strategy.
For 10X Genomics, the most straightforward path is using the commercial Single Cell Multiome ATAC + Gene Expression kit, which simultaneously profiles chromatin accessibility and gene expression from the same single nucleus [32]. This method uses the same microfluidic and barcoding principles as their standard 3' or 5' assays, ensuring seamless data alignment. The scATAC-seq protocol involves tagmentation with a Tn5 transposase loaded with adapters, and the recommended sequencing depth is 25,000 read pairs per nucleus [32].
For Smart-seq2, a multi-modal integration requires a different approach. Because it is a plate-based method, one common strategy is to perform scATAC-seq and Smart-seq2 on separate aliquots of cells from the same sample. The data is then integrated computationally using tools like MAESTRO [33]. MAESTRO is a comprehensive workflow designed for integrative analysis of scRNA-seq and scATAC-seq data from multiple platforms. It models "gene regulatory potential" from scATAC-seq peaks by calculating the accumulated accessibility of peaks surrounding a gene's transcription start site, with the influence of a peak decaying exponentially with distance [33]. This modeled regulatory potential can then be correlated with the gene expression data from Smart-seq2 to identify linked regulatory elements and target genes.
Workflow for Multi-modal scATAC-seq Integration
The diagram below contrasts the two primary paths for integrating transcriptome and chromatin accessibility data.
Strategies for scRNA-seq and scATAC-seq Integration
The Scientist's Toolkit: Essential Research Reagent Solutions
Successful integration of scRNA-seq with other modalities relies on a suite of specialized reagents and tools.
Table 3: Key Reagents and Tools for Multi-Modal Single-Cell Studies
| Item | Function | Considerations for Smart-seq2 vs 10X |
|---|---|---|
| Template Switch Oligo (TSO) | Critical for cDNA synthesis in Smart-seq2/3 protocols; enables full-length transcript coverage [21]. | Smart-seq3xpress uses improved TSO designs to reduce mis-priming artifacts [21]. Not used in standard 10X 3' kits. |
| Tn5 Transposase | Enzyme that simultaneously fragments ("tagments") DNA and adds sequencing adapters for ATAC-seq [32]. | Used in both 10X Multiome ATAC and plate-based scATAC-seq. Miniaturization in Smart-seq3xpress reduces required Tn5 amounts [21]. |
| UMI Barcoded Beads | Functional beads containing cell barcodes and UMIs to label all mRNAs from a single cell in droplet methods [1] [31]. | Core component of 10X Genomics and other droplet-based systems (e.g., Drop-seq). Not used in standard Smart-seq2. |
| Combinatorial Indexing Oligos | Oligonucleotides used in multi-round barcoding strategies (e.g., Microwell-seq3) for high-throughput, low-cost single-nucleus RNA-seq and ATAC-seq [34]. | An alternative to plate-based Smart-seq2 and commercial 10X kits, offering flexibility and lower cost per cell [34]. |
| Cell Ranger / MAESTRO | Computational pipelines for analyzing single-cell data. Cell Ranger is optimized for 10X data [33] [31]. MAESTRO supports multiple platforms and integrates scRNA-seq and scATAC-seq [33]. | Cell Ranger is the standard for 10X data. MAESTRO is platform-agnostic, making it suitable for integrating Smart-seq2 data with other modalities [33]. |
The decision between Smart-seq2 and 10X Genomics for studies integrating TCR or ATAC-seq is not a matter of one platform being universally superior, but rather of selecting the right tool for the specific biological question and experimental constraints.
Choose 10X Genomics Chromium when the research goal requires profiling a large, heterogeneous population of cells to identify rare immune cell types or complex cell states within an embryo. Its standardized, commercially available kits for paired V(D)J + 5' gene expression and the Multiome ATAC + Gene Expression assay offer the most streamlined and robust path for true single-cell multi-omics, where transcriptome and other data are captured from the exact same cell.
Choose Smart-seq2 when the primary research question demands maximum sensitivity for gene detection, the ability to analyze alternative splicing, or the detection of low-abundance transcripts, and when the cell number is manageable. Its full-length coverage is advantageous for detailed isoform-level analysis. Integration with TCR or ATAC-seq in this context typically requires separate assays followed by powerful computational integration using tools like MAESTRO.
For embryo cell research, where cell numbers may be limited and the characterization of novel, transient cell states is crucial, researchers must weigh the high cellular throughput of 10X against the high informational depth per cell of Smart-seq2. The emergence of newer, scaled-up full-length methods like Smart-seq3xpress [21] and highly sensitive, low-cost platforms like Microwell-seq3 [34] provides promising avenues that may someday bridge the current gap between sensitivity and scale.
Optimizing scRNA-seq Experiments and Mitigating Technical Challenges
Single-cell RNA sequencing (scRNA-seq) has revolutionized biological research by enabling the examination of gene expression at the individual cell level. For researchers studying embryo cells, selecting the appropriate scRNA-seq platform is crucial as it directly influences experimental design, data quality, and quality control (QC) procedures. This guide focuses on two widely used technologies—SMART-seq2 (a plate-based full-length transcript method) and 10X Genomics Chromium (a droplet-based 3' counting method)—providing an objective comparison of their performance and detailed best practices for interpreting QC metrics, with special emphasis on the Cell Ranger analysis pipeline used with 10X Genomics data [3].
The fundamental technological differences between these platforms create distinct QC requirements. SMART-seq2 generates full-length transcript data without unique molecular identifiers (UMIs), allowing for isoform detection but lacking built-in correction for amplification bias. In contrast, 10X Genomics Chromium uses UMIs to quantitatively count mRNA molecules while sequencing only the 3' end, making it susceptible to different technical artifacts [23] [2] [3]. Understanding these distinctions is essential for implementing appropriate QC strategies when working with embryo cells, which often present challenges due to their small size, unique transcriptional profiles, and the dynamic nature of embryonic development.
Technology Comparison: SMART-seq2 vs. 10X Genomics Chromium
Fundamental Technological Differences
The core distinction between these platforms lies in their molecular approaches to single-cell isolation, transcript capture, and library preparation. 10X Genomics Chromium is a droplet-based system that encapsulates individual cells in oil droplets along with barcoded beads. It captures poly-adenylated RNA using gel beads-in-emulsion (GEM) technology, incorporating cell barcodes and UMIs during reverse transcription. This method sequences only the 3' ends of transcripts, focusing on digital quantification through UMI counting rather than full-length transcript information [35] [3]. The platform is optimized for profiling thousands to tens of thousands of cells simultaneously, making it suitable for comprehensive cataloging of cellular heterogeneity in complex tissues like developing embryos.
SMART-seq2 employs a plate-based approach where individual cells are sorted into multi-well plates. Unlike 10X Genomics, it utilizes template-switching mechanism during reverse transcription to generate full-length cDNA, enabling detection of isoform variations and single-nucleotide polymorphisms. A significant limitation is its lack of UMIs, making it impossible to distinguish between technical amplification duplicates and biologically distinct transcripts [2] [3]. This method typically processes 96-384 cells per run but with substantially greater sequencing depth per cell, potentially revealing more complete transcriptome information for each profiled cell.
Performance Metrics for Embryo Cell Research
The table below summarizes key performance characteristics based on independent comparative studies, with specific considerations for embryo cell research:
Table 1: Performance Comparison of SMART-seq2 vs. 10X Genomics Chromium
| Performance Metric | SMART-seq2 | 10X Genomics Chromium | Implications for Embryo Cell Research |
|---|---|---|---|
| Genes Detected per Cell | ~4,000-9,000 genes [23] [3] | ~500-3,000 genes [23] [3] | SMART-seq2 better for characterizing transcriptional complexity in rare embryonic cells |
| Transcript Coverage | Full-length [3] | 3' end only [3] | SMART-seq2 enables isoform analysis important for developmental regulation |
| UMI Incorporation | No [2] [3] | Yes [35] [3] | 10X provides more accurate quantification; SMART-seq2 susceptible to amplification bias |
| Cell Throughput | 96-384 cells/run [3] | 500-10,000 cells/run [3] | 10X better for comprehensive embryonic cell atlas; SMART-seq2 for focused studies |
| Sensitivity for Low-Abundance Transcripts | Higher [23] | Lower [23] | SMART-seq2 advantageous for detecting rare transcripts in early embryonic development |
| Doublet Rate | Lower (visual verification possible) [3] | Higher (droplet encapsulation) [36] | 10X requires computational doublet detection for embryonic cells which may have similar sizes |
| Multiplexing Capability | Limited [3] | High [35] | 10X enables pooling embryos/samples, reducing batch effects in developmental time series |
| Equipment Requirements | Cell sorter, thermal cycler [3] | Chromium Controller [3] | Accessibility considerations for embryo research labs |
For embryo cell research, the choice between platforms involves important trade-offs. 10X Genomics provides superior cellular throughput for comprehensively profiling heterogeneous embryonic cell populations, while SMART-seq2 offers deeper transcriptional characterization of individual cells, which can be crucial for understanding developmental transitions and rare cell states [23]. Recent benchmarking indicates that 10X data exhibits more severe dropout effects (especially for low-expression genes), while SMART-seq2 detects a higher proportion of mitochondrial genes, a potentially confounding factor in QC assessment [23].
Experimental Protocols for scRNA-seq in Embryo Cell Research
10X Genomics Chromium Experimental Workflow
The following diagram illustrates the complete experimental and computational workflow for 10X Genomics Chromium, with key QC checkpoints identified for embryo cell research:
Diagram 1: 10X Genomics Chromium scRNA-seq workflow for embryo cells
The 10X Genomics protocol begins with preparing a high-quality single-cell suspension from embryo tissue—a particularly critical step when working with embryonic material that may be more sensitive to dissociation stress. Key considerations for embryo cells include:
- Cell Viability: Target >80% viability to minimize ambient RNA from dead cells [36]
- Cell Concentration Optimization: Carefully titrate input cell concentration (typically 100-1,000 cells/μL) to balance target cell recovery with multiplet rates [35]
- Embryo-Specific Considerations: Adapt dissociation protocols to embryonic developmental stage; include RNA stability agents if necessary
Following single-cell encapsulation and barcoding in the Chromium Controller, libraries are prepared following the Chromium Single Cell 3' Reagent Kits user guide. Sequencing is typically performed on Illumina platforms with recommended read configurations (28 bp Read 1, 91 bp Read 2, and 8 bp I7 index). The resulting FASTQ files are processed through the Cell Ranger pipeline, which performs alignment, filtering, and UMI counting, ultimately generating the QC report and count matrices for downstream analysis [35].
SMART-seq2 Experimental Workflow
The SMART-seq2 protocol employs a fundamentally different approach, as detailed below:
Diagram 2: SMART-seq2 scRNA-seq workflow for embryo cells
For SMART-seq2, the protocol begins with fluorescence-activated cell sorting (FACS) of individual embryo cells into multi-well plates containing lysis buffer. A significant advantage for embryo research is the option of index sorting, which records the phenotypic parameters of each individually sorted cell, enabling retrospective correlation of transcriptional profiles with morphological or surface marker characteristics [3]. This feature is particularly valuable when studying heterogeneous embryonic populations where developmental relationships are not fully understood.
The core SMART-seq2 biochemistry utilizes template-switching reverse transcription to generate full-length cDNA, followed by PCR preamplification. Notably, this protocol lacks UMI incorporation, making it impossible to distinguish biological duplicates from technical amplification artifacts during computational analysis [2]. Libraries are typically sequenced more deeply than 10X Genomics (0.5-2 million reads per cell versus 20-50,000 reads per cell), with paired-end reads facilitating isoform resolution and mutation detection. Bioinformatic processing involves alignment with tools like STAR or HISAT2, followed by gene quantification without UMI deduplication [31].
Interpreting Cell Ranger QC Reports for Embryo Cells
Key QC Metrics and Their Interpretation
The Cell Ranger pipeline generates comprehensive QC reports in the web_summary.html file (or qc_report.html for multi-sample experiments), which provides critical metrics for assessing data quality. The table below outlines key metrics and their expected ranges, with special considerations for embryo cells:
Table 2: Key Cell Ranger QC Metrics and Interpretation for Embryo Cells
| QC Metric | Definition | Optimal Range | Embryo-Specific Considerations |
|---|---|---|---|
| Estimated Number of Cells | Barcodes identified as containing cells | Close to target cell recovery | Embryo cells may have different RNA content affecting cell calling |
| Sequencing Saturation | Fraction of reads from observed UMIs | 50-90% [37] | Lower saturation may indicate need for more sequencing for rare embryonic transcripts |
| Median Genes per Cell | Median genes detected per cell | Varies by cell type | Embryonic stem cells typically higher; differentiating cells may show decreasing trends |
| Median UMI Counts per Cell | Median transcripts detected per cell | Varies by cell type | Compare across embryonic cell types; neural/secretory cells often have higher counts |
| Q30 Bases in RNA Read | Fraction of bases with quality ≥30 | >80% [37] | Critical for variant calling in embryonic mutant studies |
| Reads Mapped to Genome | Confidently mapped reads to genome | >85% [35] | Lower values may indicate contamination or poor reference for embryonic transcripts |
| Reads Mapped to Transcriptome | Confidently mapped to transcriptome | >70% [35] | Embryo-specific isoforms might be missing from standard transcriptomes |
| Fraction Reads in Cells | Reads associated with cell barcodes | >60% [35] | Lower values indicate high ambient RNA - concerning for dissociated embryonic tissues |
| Mitochondrial RNA Ratio | Fraction of mitochondrial reads | Varies; <20% typically [36] | May be higher in metabolically active embryonic cells - establish baseline carefully |
Diagnostic Plots in Cell Ranger Reports
Cell Ranger provides several diagnostic plots essential for quality assessment. The Barcode Rank Plot displays UMI counts per barcode in descending order, showing the characteristic "knee" and "inflection point" that separate cell-containing barcodes from background empty droplets [35]. For embryo cells, this plot may show less distinct separation if cells have highly variable RNA content, which is common in developing tissues containing both mitotically active and quiescent cells.
The Sequencing Saturation Plot shows how saturation changes with sequencing depth, with the curve typically plateauing as additional sequencing yields diminishing returns. For embryo research where novel or rare transcripts may be of interest, a less saturated library (below 70%) might warrant additional sequencing [37].
The Median Genes vs. Sequencing Depth Plot illustrates how gene detection increases with sequencing. Embryo cell studies should ensure the curve is approaching plateau to confirm sufficient sequencing depth for capturing transcriptional diversity [37].
Post-Cell Ranger QC Filtering Strategies
After initial Cell Ranger processing, additional QC filtering is typically performed using tools like Seurat or Scanpy. The following diagram illustrates the decision process for filtering embryo cell data:
Diagram 3: Post-Cell Ranger QC filtering workflow for embryo cells
Three key filtering criteria are particularly important for embryo cell data:
UMI Count Filtering: Remove barcodes with UMI counts that are extreme outliers—high counts potentially indicating multiplets (multiple cells per droplet) and very low counts likely representing empty droplets or damaged cells [36]. The optimal threshold is dataset-specific but typically ranges from 500 to 5,000 UMIs for embryo cells.
Gene Count Filtering: Similar to UMI filtering, remove outliers with extremely high or low numbers of detected genes [36]. Embryonic stem cells typically exhibit higher gene counts than more differentiated progeny, so consider cluster-specific thresholds when working with heterogeneous embryonic populations.
Mitochondrial Percentage Filtering: Cells with high mitochondrial RNA percentage (>20-25%) often indicate compromised cell integrity or stress response [36]. However, carefully establish embryo-specific baselines as certain embryonic cell types (e.g., cardiomyocyte precursors) may naturally exhibit higher mitochondrial content.
For embryo cell research, computational doublet detection using tools like DoubletFinder or Scrublet is particularly important [36]. Developing embryonic tissues often contain closely related cell types with similar transcriptional profiles, making doublets harder to identify through standard filtering. These tools generate artificial doublets and compare expression profiles to identify likely multiplets that might otherwise be misinterpreted as novel transitional states in developmental trajectories.
Essential Research Reagents and Tools for scRNA-seq QC
The table below summarizes key reagents, tools, and their functions specifically relevant to scRNA-seq quality control in embryo cell research:
Table 3: Essential Research Reagents and Computational Tools for scRNA-seq QC
| Category | Item | Function in QC Process |
|---|---|---|
| Wet Lab Reagents | Cell viability stains (Trypan Blue, Propidium Iodide) | Pre-sequencing assessment of sample quality |
| Single cell dissociation reagents | Tissue-specific enzymes for embryo dissociation | |
| RNase inhibitors | Prevent RNA degradation during processing | |
| BSA/PBS-based suspension buffers | Maintain cell viability without clumping | |
| Nucleic acid binding beads (SPRIselect) | Library purification and size selection | |
| 10X Genomics Specific | Chromium Single Cell 3' Reagent Kits | All-in-one reagent system for GEM generation |
| Chromium Chip B/Series | Microfluidic chips for cell partitioning | |
| Dual Index Kit TT Set A | Sample multiplexing to reduce batch effects | |
| SMART-seq2 Reagents | Template switching oligo (TSO) | Full-length cDNA generation |
| Betaine | PCR additive for improved amplification | |
| KAPA HiFi HotStart ReadyMix | High-fidelity amplification for full-length cDNA | |
| Computational Tools | Cell Ranger | 10X-specific processing, alignment, counting [35] |
| Loupe Browser | Interactive visualization of 10X data [35] | |
| Seurat/Scanpy | Comprehensive analysis environment with QC modules [38] | |
| FastQC/MultiQC | Raw read quality assessment [31] | |
| DoubletFinder/Scrublet | Computational doublet detection [36] | |
| SoupX/CellBender | Ambient RNA background correction [35] [36] |
Quality control in single-cell RNA sequencing represents a critical foundation for valid biological interpretation, particularly in embryo cell research where developmental processes hinge on accurate characterization of cellular heterogeneity and transcriptional dynamics. The distinct technological approaches of SMART-seq2 and 10X Genomics Chromium necessitate platform-specific QC strategies. 10X Genomics, with its UMI-based quantification and high cellular throughput, enables comprehensive atlas-building of embryonic cell states but requires vigilant filtering for multiplets and ambient RNA. SMART-seq2 provides superior sensitivity for gene detection and isoform resolution valuable for mechanistic studies but lacks built-in controls for amplification bias.
For embryo researchers, establishing platform-specific baseline QC metrics is essential, as embryonic cells may exhibit distinct characteristics including varying RNA content, mitochondrial percentages, and stress responses compared to adult cells. Additionally, as the field advances, emerging computational methods for doublet detection and ambient RNA removal are becoming increasingly sophisticated, offering enhanced capabilities for extracting biological signal from technical noise. By implementing rigorous, platform-appropriate QC practices detailed in this guide, researchers can ensure the reliability of their single-cell data and build robust conclusions about the complex regulatory programs governing embryonic development.
Single-cell RNA sequencing (scRNA-seq) has revolutionized biological research by enabling transcriptome profiling at cellular resolution. However, technical artifacts can significantly impact data quality and biological interpretation. For researchers working with precious embryo cells, understanding and mitigating platform-specific noise is essential for experimental success. The droplet-based 10X Genomics Chromium (10X) and the plate-based Smart-seq2 are two widely used scRNA-seq platforms that exhibit distinct advantages, limitations, and susceptibility to technical artifacts [12] [1]. Ambient RNA and barcode swapping represent two major sources of platform-specific noise that can compromise data integrity. Ambient RNA occurs when transcripts from lysed cells contaminate the transcriptomes of intact cells, while barcode swapping involves the mislabeling of sequencing reads between samples during multiplexed sequencing [39] [7]. This guide provides a comprehensive comparison of how these artifacts manifest across platforms and offers evidence-based strategies for their mitigation in embryo cell research.
Fundamental Technological Differences
The 10X and Smart-seq2 platforms employ fundamentally different approaches to single-cell capture and library preparation, which directly influence their susceptibility to technical artifacts:
10X Genomics Chromium: This droplet-based system uses gel beads-in-emulsion (GEM) technology where each cell is encapsulated in a droplet with a barcoded bead. It captures 3' ends of transcripts and utilizes Unique Molecular Identifiers (UMIs) for digital counting, enabling high-throughput profiling of thousands of cells simultaneously [1] [3]. The platform's high-cell throughput makes it particularly valuable for detecting rare cell types in heterogeneous populations like developing embryos [12].
Smart-seq2: This plate-based method provides full-length transcript coverage with higher sensitivity for detecting genes, especially low-abundance transcripts and alternatively spliced isoforms [12] [1]. Unlike 10X, it typically does not incorporate UMIs, relying instead on total transcript counts. Its lower cellular throughput is offset by greater depth of transcriptome information per cell, which can be critical for studying transcriptional dynamics in embryo development.
Comprehensive Performance Comparison
Table 1: Direct performance comparison between 10X Genomics and Smart-seq2 platforms
| Performance Metric | 10X Genomics | Smart-seq2 |
|---|---|---|
| Genes detected per cell | Lower (particularly for low-abundance transcripts) | Higher (1.7–2.3× more sensitive for gene detection) [12] [1] |
| Throughput | High (thousands to tens of thousands of cells) | Low (hundreds of cells) [12] [1] |
| Transcript coverage | 3' end-biased | Full-length [1] |
| Mitochondrial gene capture | Lower (0%–15% of total RNA) | Higher (approximately 30%, similar to bulk RNA-seq) [1] |
| Dropout rate | Higher (especially for low-expression genes) | Lower [12] |
| lncRNA detection | Higher proportion (6.5%–9.6% of detected transcripts) | Lower proportion (2.9%–3.8% of detected transcripts) [1] |
| Data resemblance to bulk RNA-seq | Less similar | More similar [12] [1] |
Ambient RNA Contamination
Mechanisms and Platform-Specific Manifestations
Ambient RNA consists of mRNA molecules released from lysed or damaged cells that contaminate the transcriptomes of intact cells during single-cell isolation and processing. This artifact creates a background "soup" of transcripts that can be misattributed to viable cells, potentially obscuring true biological signals and leading to misclassification of cell types [7].
The mechanisms and severity of ambient RNA contamination differ substantially between platforms:
10X Genomics: Ambient RNA is particularly problematic in droplet-based systems [7]. During the droplet generation process, free-floating RNA from damaged cells can be co-encapsulated with intact cells or empty droplets, leading to misattribution of transcripts. This effect is especially pronounced in tissues with high rates of cell death or in sensitive samples like embryo cells that may be more susceptible to dissociation stress.
Smart-seq2: Plate-based methods are generally less susceptible to ambient RNA because cells are processed in physically separated wells [7]. However, contamination can still occur if the cell suspension contains significant amounts of free RNA before plating, particularly during the sorting process.
Experimental Evidence and Impact on Data Quality
Recent comparative studies have quantified the impact of ambient RNA on different platforms. A 2024 benchmark study comparing 10X with Parse Biosciences (another split-pool combinatorial indexing method) found that droplet-based technologies showed higher susceptibility to ambient RNA, requiring more rigorous bioinformatic correction [7]. While direct comparisons between 10X and Smart-seq2 specifically measuring ambient RNA are limited in the available literature, the fundamental differences in their workflows support the observation that droplet-based methods generally exhibit higher levels of this artifact.
Ambient RNA contamination disproportionately affects the detection of low-abundance transcripts and can artificially inflate apparent gene expression in cell types that are actually inactive for those genes. For embryo research, this could potentially lead to misidentification of transitional states or obscure subtle transcriptional differences between closely related cell lineages.
Mitigation Strategies for Ambient RNA
Experimental Design:
- Optimize tissue dissociation protocols to minimize cell damage [7]
- Use viability staining to exclude dead cells during sorting
- Incorporate cell hashing techniques with sample-specific barcodes
- Include empty droplets or wells controls to quantify background RNA
Bioinformatic Correction:
- Implement dedicated algorithms for ambient RNA removal (e.g., SoupX, DecontX)
- Use regression-based approaches that model background contamination
- Employ quality control metrics that flag cells with unusual expression profiles
Table 2: Reagent solutions for mitigating ambient RNA
| Reagent/Kit | Function | Application |
|---|---|---|
| Viability dyes (e.g., DAPI, propidium iodide) | Identify and exclude dead cells during cell sorting | Both platforms |
| Cell hashing antibodies | Label cells with sample-specific barcodes for multiplexing | Primarily 10X |
| RNase inhibitors | Prevent RNA degradation during sample processing | Both platforms |
| MACS dead cell removal kits | Deplete dead cells before single-cell processing | Both platforms |
Barcode Swapping
Mechanisms and Platform-Specific Manifestations
Barcode swapping occurs when sequencing reads are misassigned between samples during multiplexed sequencing on patterned flow-cell Illumina machines (e.g., HiSeq 4000, HiSeq X, NovaSeq) [39]. This artifact results from cross-contamination of barcodes between different libraries sequenced on the same flow cell lane, potentially creating hybrid cell transcriptomes that don't exist biologically.
The underlying mechanism involves the physical proximity of DNA clusters during sequencing on patterned flow cells. When multiple libraries are pooled, free barcodes or barcoded fragments can "jump" between physically adjacent clusters, causing misassignment [39]. The impact of barcode swapping varies by platform:
10X Genomics: In droplet-based systems, barcode swapping can create artificial cell libraries that appear valid but represent chimeric transcriptomes [39]. This is particularly problematic because these artifacts can display convincing clustering patterns that might be misinterpreted as novel cell types. Swapping primarily affects the sample barcode rather than cell barcodes, except when the same cell barcode is used in multiple multiplexed samples.
Smart-seq2: Plate-based methods show more severe barcode swapping rates, with approximately 2.5% of reads mislabeled between samples on HiSeq 4000 instruments according to systematic quantification [39]. This is significantly higher than the 0.22% rate observed on non-patterned flow cells like HiSeq 2500. Since each cell typically receives a unique barcode combination in plate-based methods, swapping can create "impossible" cell barcodes that weren't included in the original experimental design.
Experimental Evidence and Quantification
A rigorous 2018 study systematically quantified barcode swapping rates by analyzing plate-based scRNA-seq datasets with designed "impossible" barcode combinations that should contain zero reads under perfect conditions [39]. Through regression analysis of the relationship between library sizes of impossible barcodes and real cell libraries, researchers estimated a swapping rate of 2.18% ± 0.08% on HiSeq 4000 compared to just 0.22% ± 0.01% on HiSeq 2500 [39].
Interestingly, contrary to previous reports, this study found no correlation between swapping rates and the concentration of free barcode in the library, suggesting the phenomenon is not primarily driven by this factor under typical experimental conditions [39]. The global nature of barcode swapping means that nearly all expressed genes are affected, potentially impacting any downstream analysis.
Mitigation Strategies for Barcode Swapping
Experimental Design:
- Utilize unique dual indexing where possible, despite reduced multiplexing capacity [39]
- Leave a fraction of possible barcode combinations unoccupied to enable swapping quantification [39]
- Use non-patterned flow cell sequencers (e.g., HiSeq 2500, MiSeq) when feasible
- Process positive and negative controls on the same sequencing run
Bioinformatic Correction:
Diagram Title: Barcode Swapping Mechanisms and Solutions
Table 3: Research reagent solutions for barcode swapping mitigation
| Reagent/Kit | Function | Application |
|---|---|---|
| Unique dual indices | Prevent sample misassignment by using unique barcode pairs | Both platforms (with multiplexing limitations) |
| Custom barcode plates | Design barcode layouts with unoccupied combinations for QC | Primarily plate-based methods |
| In-house Tn5 | Control tagmentation conditions to optimize library preparation | Smart-seq2 and related protocols |
Experimental Protocols for Artifact Quantification
Protocol for Quantifying Barcode Swapping
For researchers needing to empirically measure barcode swapping in their experiments, particularly with plate-based methods:
Experimental Design:
- Plate cells using a barcode layout where 10-15% of possible row-column combinations are left unoccupied [39]
- Ensure that the unused combinations represent a random distribution across the plate
Library Preparation and Sequencing:
- Process samples according to standard Smart-seq2 protocol [1]
- Multiplex libraries and sequence on both patterned (e.g., NovaSeq) and non-patterned (e.g., MiSeq) flow cells for comparison
Data Analysis:
- Demultiplex sequencing data allowing for all possible barcode combinations, including unused ones
- Align reads to reference genome and quantify expression for all barcodes
- Perform regression analysis comparing library sizes of impossible barcodes against the sum of libraries sharing exactly one barcode [39]
- Calculate swapping fraction from the regression slope
Protocol for Assessing Ambient RNA
For systematic evaluation of ambient RNA contamination:
Control Experiments:
- Include empty wells (for plate-based methods) or empty droplets (for droplet-based methods) as negative controls
- Process these controls alongside experimental samples through the entire workflow
Sequencing and Analysis:
- Sequence control samples to sufficient depth (typically 10-20% of main experiment depth)
- Map reads and generate expression profiles for empty controls
- Use these profiles to estimate background contamination in experimental samples
- Compare expression in low-quality cells (high mitochondrial percentage) to high-quality cells to identify likely ambient transcripts
Platform Selection Guide for Embryo Research
Decision Framework
Selecting the appropriate scRNA-seq platform for embryo research requires balancing multiple factors while considering specific research goals:
Choose 10X Genomics when:
- Studying highly heterogeneous cell populations where rare cell type detection is prioritized
- Large cell numbers (thousands) are needed to capture full cellular diversity
- The research question focuses on cell type identification and classification
- Available computational resources for robust ambient RNA correction
Choose Smart-seq2 when:
- Investigating splicing variants, isoform diversity, or allele-specific expression
- Working with limited cell numbers where maximum gene detection is critical
- Studying subtle transcriptional differences where dropout events could obscure signals
- The experimental design can accommodate lower throughput
Integrated Noise Mitigation Strategy
For the most demanding embryo research applications, consider a hybrid approach:
- Pilot Study: Use 10X Genomics to characterize cellular heterogeneity and identify key cell populations
- Focused Profiling: Apply Smart-seq2 to specific populations of interest for deep transcriptional characterization
- Cross-Platform Validation: Verify key findings using both technologies when feasible
Diagram Title: Platform Selection Guide for Embryo Research
Technical artifacts including ambient RNA and barcode swapping present significant challenges in scRNA-seq studies of embryo cells, with each platform exhibiting distinct vulnerabilities. 10X Genomics shows higher susceptibility to ambient RNA but offers unparalleled throughput for discovering rare cell populations. Smart-seq2 provides superior gene detection and full-length transcript information but is more affected by barcode swapping, particularly on modern patterned flow cell sequencers. Understanding these platform-specific characteristics enables researchers to select appropriate technologies, implement effective mitigation strategies, and make informed interpretations of their data. As single-cell technologies continue to evolve, remaining vigilant about technical artifacts will be essential for generating biologically accurate insights into embryonic development.
Filtering Strategies for Low-Quality Cells and Doublets in Embryo Datasets
Single-cell RNA sequencing (scRNA-seq) has revolutionized the study of embryonic development by enabling the characterization of cellular heterogeneity and lineage specification at unprecedented resolution. However, the full potential of these technologies can only be realized through rigorous quality control (QC) procedures to address technical artifacts inherent in scRNA-seq data. The choice between plate-based methods like SMART-seq2 and droplet-based platforms like 10X Genomics significantly influences the strategies required for effective filtering of low-quality cells and doublets. This guide provides a comprehensive comparison of QC approaches tailored specifically for embryo research, leveraging experimental data to inform best practices for data preprocessing and analysis.
The integrity of embryonic single-cell datasets is particularly crucial as these resources serve as references for authenticating stem cell-based embryo models [13]. Inadequate QC can compromise downstream analyses, leading to misannotation of cell lineages and erroneous biological interpretations. We systematically evaluate platform-specific technical artifacts, provide quantitative metrics for quality assessment, and outline robust filtering workflows to ensure data reliability for studying early human development.
Platform Comparison: Technical Considerations for Embryo Research
Fundamental Technological Differences
SMART-seq2 and 10X Genomics Chromium represent two distinct approaches to scRNA-seq with complementary strengths and limitations. SMART-seq2 is a plate-based method that provides full-length transcript coverage with high sensitivity for gene detection, especially for low-abundance transcripts and alternatively spliced isoforms [1]. This platform captures the complete coding sequence, enabling comprehensive transcriptome characterization. In contrast, 10X Genomics employs a droplet-based system that uses unique molecular identifiers (UMIs) for digital counting of transcript molecules, significantly reducing amplification bias but focusing sequencing on the 3' or 5' ends of transcripts [40].
For embryonic studies, each platform offers distinct advantages. SMART-seq2's superior sensitivity per cell makes it ideal for analyzing limited cell numbers, such as preimplantation embryos, where detecting subtle transcriptional differences is critical. Meanwhile, 10X Genomics enables profiling of thousands of cells simultaneously, providing the necessary throughput to capture rare cell populations during later developmental stages, such as gastrulation [13]. Recent advancements in 10X's GEM-X technology have improved sensitivity, with demonstrated increases of 61-98% in gene detection and up to 80% cell recovery efficiency [40], narrowing the performance gap between platforms.
Quantitative Performance Metrics
Table 1: Platform-Specific Technical Characteristics Affecting Quality Control
| Performance Metric | SMART-seq2 | 10X Genomics | Biological Implications |
|---|---|---|---|
| Genes Detected/Cell | Higher (especially low-abundance transcripts) [1] | Lower, but improved with GEM-X [40] | SMART-seq2 better for subtle expression differences; 10X sufficient for major cell types |
| Mitochondrial Gene % | Higher (~30%) [1] | Lower (0-15%) [1] | Different thresholds needed for filtering; SMART-seq2 requires higher thresholds |
| Doublet Rate | Lower (manual loading) | 0.4% per 1,000 cells (GEM-X) [40] | 10X requires more aggressive doublet detection, especially at high cell loads |
| Throughput (Cells/Run) | Hundreds [8] | Thousands (up to 20,000 per channel with GEM-X) [40] | 10X better for comprehensive atlases; SMART-seq2 for focused studies |
| RNA Recovery Efficiency | Varies with protocol | Up to 80% (GEM-X) [40] | 10X better for rare cells and precious embryonic samples |
| Spliced Transcript Detection | Higher [1] | Lower | SMART-seq2 preferred for isoform-level analyses |
| Non-coding RNA Detection | Lower proportion lncRNAs [1] | Higher proportion lncRNAs (6.5-9.6%) [1] | 10X may better characterize regulatory networks |
Table 2: Platform-Specific Technical Artifacts and Contamination Profiles
| Contamination Type | SMART-seq2 | 10X Genomics | Recommended QC Approach |
|---|---|---|---|
| Ambient RNA | Lower (single-cell lysis) | Higher (shared medium in droplets) [41] | DecontX [41] or similar tools for 10X data |
| Nuclear Contamination | Lower concern | Significant in reference atlases [42] | Nuclear fraction calculation essential for 10X datasets |
| Ribosomal RNA | 10.2-28.0% (mostly removed with unique mapping) [1] | 0.03-0.4% [1] | Unique read mapping critical for SMART-seq2 |
| Empty Droplets/Wells | Manual verification | ~90% empty droplets [41] | EmptyDrops algorithm for 10X data [41] |
| Cell Stress Signatures | Membrane category over-represented [1] | Ribosome-related genes enriched [1] | Platform-specific signature awareness during interpretation |
Quality Control Metrics and Filtering Strategies
Standard QC Metrics for Embryo Datasets
Quality control for embryonic scRNA-seq data requires special consideration of the unique biological context of developing systems. Standard metrics include total UMIs or counts per cell, genes detected per cell, and mitochondrial gene percentage, but threshold selection must be adapted for embryonic cells which may have inherently different metabolic characteristics [1] [41].
Mitochondrial percentage is particularly informative for identifying damaged cells, with typical thresholds at 10-20% for most cell types. However, SMART-seq2 consistently demonstrates higher mitochondrial percentages (averaging ~30%) compared to 10X Genomics (0-15%), reflecting differences in cell lysis efficiency rather than true biological differences [1]. This platform-specific variation necessitates adjusted thresholds, with stricter limits for 10X data and more permissive thresholds for SMART-seq2 datasets.
The nuclear fraction, calculated from intronic read content, has emerged as a crucial metric for identifying intact cells, particularly in challenging tissues [42]. Cells with absent or extremely high intronic content likely represent empty droplets or lysed cells, respectively. For embryonic tissues, which often require aggressive dissociation protocols, this metric is particularly valuable. MALAT1 expression can serve as a proxy for nuclear content when intronic reads are unavailable [42].
Doublet Detection in Embryo Datasets
Doublets present a significant challenge in embryonic datasets where closely related cell types are common and misclassification can lead to erroneous lineage assignments. The risk of doublets increases with cellular loading density and is inherently higher in droplet-based systems. 10X's GEM-X technology has reduced multiplet rates to 0.4% per 1,000 cells [40], but this remains substantial when processing thousands of cells.
Doublet detection algorithms typically work by generating artificial doublets and identifying cells with similar hybrid expression profiles [41]. For embryonic data, it is essential to use methods that account for developmental continuum rather than discrete cell types. Doublets between adjacent developmental stages can be particularly challenging to identify but may create artificial transitional populations that misinterpret developmental trajectories.
Diagram 1: Comprehensive QC Workflow for Embryo scRNA-seq Data. This workflow highlights essential steps with special considerations for embryonic datasets, particularly nuclear fraction assessment.
Platform-Specific Filtering Recommendations
SMART-seq2 Specific Workflow
For SMART-seq2 data generated from embryonic samples, quality control should begin with assessment of read counts and mapping statistics. The average total reads for SMART-seq2 typically range from 1.7-6.3 million per cell [1], significantly higher than 10X Genomics (20-92 thousand). This high sequencing depth enables more reliable detection of low-abundance transcripts but requires careful filtering.
Recommended steps for SMART-seq2 embryo data include:
- Library Size Filtering: Remove cells with total counts below 500,000 reads or significantly deviating from the sample median.
- Gene Detection Threshold: Exclude cells detecting fewer than 3,000-5,000 genes, adjusting for embryo stage-specific transcriptome complexity.
- Mitochondrial Content: Apply a higher threshold (15-25%) than used for 10X data, reflecting the platform's technical characteristics [1].
- Housekeeping Gene Expression: Verify expression of developmental essential genes appropriate for the embryo stage.
- Doublet Detection: Use scDblFinder or similar tools, despite lower doublet rates in plate-based methods.
Special consideration should be given to the over-representation of membrane-related genes and under-representation of cytoplasmic categories in SMART-seq2 data, reflecting more complete membrane lysis [1]. This systematic bias should be acknowledged when interpreting cell type-specific signatures.
10X Genomics Specific Workflow
The 10X Genomics workflow presents distinct QC challenges due to the presence of empty droplets, higher doublet rates, and increased ambient RNA. The SCTK-QC pipeline provides a comprehensive framework for addressing these issues [41], with specific adaptations recommended for embryonic data.
Essential steps for 10X embryo data include:
- Empty Droplet Removal: Implement the EmptyDrops algorithm to distinguish cells from background [41].
- UMI Thresholding: Filter cells with fewer than 1,000-3,000 UMIs, depending on embryo stage and cell size.
- Gene Detection: Exclude cells with fewer than 500-1,000 genes detected.
- Mitochondrial Threshold: Apply stringent filtering (5-10%) due to naturally low mitochondrial content in 10X data [1].
- Nuclear Fraction Assessment: Calculate intronic content and filter cells with absent or extremely high nuclear fractions [42].
- Doublet Detection: Use multiple algorithms (Scrublet, DoubletFinder) with conservative thresholds.
- Ambient RNA Correction: Apply DecontX or similar tools to address background contamination [41].
The high proportion of long non-coding RNAs (6.5-9.6%) detected in 10X data [1] represents both an opportunity for regulatory insights and a potential confounder if not properly accounted for in quality metrics.
Diagram 2: Platform-Specific QC Pathways. The diagram highlights different prioritization for each platform, with mitochondrial content more permissive for SMART-seq2, and nuclear fraction critical for 10X data.
Implementation Framework and Quality Assessment
Computational Tools and Pipelines
The SCTK-QC pipeline within the singleCellTK R package provides a unified framework for implementing comprehensive quality control across both platforms [41]. This pipeline incorporates multiple QC algorithms, generates standardized metrics, and produces interactive HTML reports for quality assessment. For embryonic datasets, we recommend the following tool selection:
- Empty Droplet Detection: EmptyDrops for 10X data [41]
- Doublet Detection: ScDblFinder for its sensitivity to developmental continua
- Ambient RNA Correction: DecontX for 10X data [41]
- Nuclear Fraction Calculation: DropletQC R package [42]
- Batch Effect Detection: fastMNN for integrating multiple embryos [13]
The pipeline can import data from multiple preprocessing tools (CellRanger, STARsolo, BUStools) and accommodates both plate-based and droplet-based data structures, making it ideal for comparative studies.
Quality Benchmarking and Validation
After filtering, dataset quality should be validated using biological benchmarks specific to embryonic development. These include:
- Developmental Continuum: Preservation of expected differentiation trajectories without abrupt discontinuities
- Lineage Marker Co-expression: Verification that known lineage-specific markers appear in appropriate patterns
- Cell Cycle Distribution: Expected proportions of cycling cells appropriate for developmental stage
- Transcriptional Noise: Assessment of whether filtering has disproportionately affected certain cell types
The human embryo reference spanning zygote to gastrula stages provides an essential benchmark for evaluating filtered datasets [13]. Projection of filtered data onto this reference should yield appropriate lineage assignments and developmental timing.
Table 3: Essential Research Reagent Solutions for scRNA-seq QC
| Reagent/Tool | Function | Platform Compatibility | Considerations for Embryo Research |
|---|---|---|---|
| DropletQC [42] | Nuclear fraction calculation | Primarily 10X Genomics | Essential for challenging dissociations |
| DecontX [41] | Ambient RNA correction | Primarily 10X Genomics | Critical for high-ambience tissues |
| EmptyDrops [41] | Empty droplet identification | 10X Genomics | First step in 10X QC workflow |
| ScDblFinder | Doublet detection | Both platforms | Sensitive to developmental continua |
| SCTK-QC Pipeline [41] | Comprehensive QC workflow | Both platforms | Standardizes metrics across platforms |
| SingleCellExperiment [41] | Data container for R | Both platforms | Facilitates reproducible analyses |
Effective filtering of low-quality cells and doublets is foundational to reliable interpretation of embryonic scRNA-seq data. The distinct technical characteristics of SMART-seq2 and 10X Genomics necessitate platform-specific quality control approaches, with particular attention to mitochondrial content thresholds for SMART-seq2 and nuclear fraction assessment for 10X Genomics. As single-cell technologies continue evolving, with improvements in sensitivity and throughput [40], quality control practices must similarly advance to ensure these powerful tools realize their full potential for illuminating the complex process of human development.
By implementing the rigorous, platform-appropriate filtering strategies outlined in this guide, researchers can maximize the biological insights gained from precious embryonic samples while minimizing technical artifacts. The standardized workflows and quantitative metrics provided here offer a pathway to more reproducible and reliable single-cell analyses of embryonic development.
For researchers studying embryo cells, the choice between SMART-seq2 and 10X Genomics single-cell RNA sequencing technologies presents a fundamental trade-off: deep transcriptional detail against broad cellular surveying. This guide provides a direct, data-driven comparison to inform your experimental design, framing the selection as a strategic decision based on the specific goals of your embryonic research project.
The core distinction lies in their sequencing approach and scale. SMART-seq2 is a plate-based, full-length transcript method, ideal for deep profiling of a limited number of cells. In contrast, 10X Genomics Chromium is a droplet-based, 3'-end counting method designed for high-throughput profiling of thousands of cells simultaneously [1] [3].
Experimental Protocol Insights:
- SMART-seq2: Individual cells are sorted via FACS into 96- or 384-well plates containing lysis buffer. The protocol generates full-length cDNA through template-switching and does not incorporate UMIs, complicating the accurate quantification of transcript counts [2] [3].
- 10X Genomics: A single-cell suspension is co-encapsulated with barcoded beads in oil droplets within a microfluidic "Chip" on the Chromium Controller. Each bead contains oligonucleotides with a cell barcode, a unique molecular identifier (UMI), and a poly(dT) sequence for mRNA capture. Reverse transcription occurs inside the droplets, barcoding all cDNA from the same cell [43].
The following workflow diagram illustrates the fundamental procedural differences between these two technologies.
Direct Performance Comparison
A systematic comparison using the same biological samples (CD45- cells from patient tissues) revealed significant performance differences [1]. The table below summarizes key quantitative metrics critical for evaluating the cost-benefit ratio of each method.
Table 1: Experimental Performance Metrics for Embryo Cell Research
| Performance Metric | SMART-seq2 | 10X Genomics Chromium | Implication for Embryo Research |
|---|---|---|---|
| Genes Detected per Cell | Higher (Detects more genes, especially low-abundance transcripts) [1] | Lower | SMART-seq2 is superior for characterizing subtle transcriptional states and rare mRNA species in early embryos. |
| Transcript Coverage | Full-length [43] | 3' or 5' Tagged (End-counting) [3] | SMART-seq2 enables isoform detection, SNP analysis, and allele-specific expression, crucial for studying embryonic gene regulation. |
| Cell Throughput | Low (96 - 384 cells per run) [3] | High (Thousands to tens of thousands of cells per run) [1] [43] | 10X is essential for profiling large, heterogeneous cell populations, such as in later-stage embryos or entire organoids. |
| Dropout Rate (Technical Noise) | Lower for low-expression genes [1] | Higher, especially for genes with lower expression levels [1] | SMART-seq2 provides more reliable data on weakly expressed developmental transcription factors. |
| Multiplexing Capability | No UMI, complicating quantification [2] [3] | UMI for precise quantification, reduces amplification bias [2] | 10X provides more accurate digital counts of transcript numbers across a vast number of cells. |
| Proportion of Mitochondrial Genes | Higher (Average ~30%) [1] | Lower (0-15%) [1] | Higher mtDNA in SMART-seq2 may indicate more thorough cell lysis but complicates QC for embryo cells with naturally high metabolic activity. |
| Proportion of Non-Coding RNA | Lower proportion of lncRNA [1] | Higher proportion of lncRNA [1] | 10X may be better for studying the role of long non-coding RNAs in epigenetic regulation during development. |
Cost and Practical Considerations
Beyond performance, the financial and practical investment required for each method is a major determinant for project planning. Independent benchmarking studies recommend SMART-seq2 for experiments with low cell numbers and 10X Chromium for projects requiring high cell numbers [43].
Table 2: Project Planning and Budgetary Considerations
| Consideration | SMART-seq2 | 10X Genomics Chromium |
|---|---|---|
| Typical Project Scale | Focused studies on pre-defined, rare cell populations (e.g., specific progenitor lineages) [43] | Large-scale atlas building, discovering novel cell types, and mapping complex differentiation trajectories [43] |
| Sample Input Requirements | Optimized for low cell numbers; ideal when cells are rare or precious [43] | Requires a high-quality suspension of thousands of cells; unsuitable for very rare populations [43] |
| Library Preparation Cost (Example) | ~$90 - $175 per sample (Pitt Genomics Core, 2025) [30] | ~$2,287 - $3,270 per sample (Pitt Genomics Core, 2025) [30] |
| Sequencing Depth per Cell | High (Often >1 million reads/cell) to utilize full-length advantage [2] | Lower (Typically 20,000-50,000 reads/cell) as it only sequences the 3' end [31] |
| Hands-on Time & Equipment | More manual pipetting unless automated; requires FACS [3] | Highly automated on Chromium Controller; requires specific microfluidics chips [3] |
| Data Analysis Complexity | Lacks UMIs, requiring different bioinformatics pipelines for PCR duplicate handling [2] [31] | Standardized pipelines (e.g., Cell Ranger); UMI-based counting simplifies quantification [31] |
The Scientist's Toolkit: Essential Research Reagents and Materials
Successful execution of a single-cell RNA-seq experiment requires careful preparation and specific reagents. The following table details the core components needed for each platform.
Table 3: Key Research Reagent Solutions for Single-Cell RNA-seq
| Item | Function | Technology Platform |
|---|---|---|
| Fluorescence-Activated Cell Sorter (FACS) | Precisely deposits individual cells into each well of a plate. | SMART-seq2 [3] |
| Chromium Controller & Chip | A microfluidic instrument that generates gel bead-in-emulsions (GEMs) for cell barcoding. | 10X Genomics [43] |
| Barcoded Gel Beads | Beads containing cell barcode and UMI sequences for mRNA capture within droplets. | 10X Genomics [43] |
| Template Switching Oligo (TSO) | A key oligonucleotide for SMART-seq chemistry that enables full-length cDNA synthesis. | SMART-seq2 [43] |
| Poly(dT) Primers | Primers that bind to the poly-A tail of mRNA for reverse transcription. | Both |
| Unique Molecular Identifiers (UMIs) | Short random nucleotide sequences that tag individual mRNA molecules to correct for PCR bias. | 10X Genomics [2] [3] |
The choice between SMART-seq2 and 10X Genomics is not a question of which technology is universally better, but which is optimal for your specific embryonic research question. The following decision pathway synthesizes the experimental data to guide your selection.
In conclusion, a strategic cost-benefit analysis that aligns with your project's scale, budget, and required sequencing depth is paramount.
- Choose SMART-seq2 when your research on embryo cells demands the deepest possible transcriptional characterization for a defined, limited number of cells, and when your budget favors intensive sequencing of fewer cells over high-throughput library preparation [1] [43].
- Choose 10X Genomics when the primary goal is to map the full cellular landscape of a complex embryonic sample, discovering novel cell types and states across thousands of cells, and your budget can accommodate the higher initial kit cost to achieve this breadth [1] [43].
By applying this framework and considering the comparative data presented, you can make an informed, cost-effective decision that maximizes the scientific return from your embryonic single-cell RNA sequencing project.
Within the field of early human development and embryogenesis research, single-cell RNA sequencing (scRNA-seq) has become an indispensable tool for profiling the transcriptomes of individual cells. scRNA-seq is generally used for profiling the transcriptome of individual cells, providing a unique perspective on cellular heterogeneity that bulk RNA-seq cannot achieve [1] [44]. For researchers studying precious samples, such as human embryos or stem cell-based embryo models, selecting the optimal scRNA-seq platform is crucial [13]. The droplet-based 10X Genomics Chromium (10X) approach and the plate-based Smart-seq2 full-length method are two frequently used scRNA-seq platforms [1]. While 10X offers high cellular throughput, Smart-seq2 provides superior sensitivity and full-length transcript coverage. This guide objectively compares these technologies, with a specific focus on how automation and miniaturization strategies are being employed to enhance the throughput and reproducibility of the Smart-seq2 protocol, making it a more powerful tool for embryo cell research.
Experimental Comparisons: Direct Performance Benchmarking
A direct comparative analysis of 10X Genomics Chromium and Smart-seq2 was performed using CD45- cells from the same patient samples, providing a robust, side-by-side evaluation of their performance using a wide spectrum of analyses [45] [1] [12].
Experimental Protocol
- Sample Origin: CD45- cells were obtained from two cancer patients: one with hepatocellular carcinoma (providing liver tumor and adjacent non-tumor tissues) and one with rectal cancer with liver metastasis (providing primary and metastasized tumor tissues) [1].
- Cell Processing: Fluorescence Activated Cell Sorting (FACS) was used to isolate single cells, which were then processed using both 10X and Smart-seq2 platforms following standard protocols [1].
- Sequencing and Analysis: For Smart-seq2, an average of 1.7 to 6.3 million total reads per cell were generated. For 10X, the average was lower, from 20,000 to 92,000 reads per cell. Bioinformatic analyses followed conventional practices for each platform [1].
Key Quantitative Findings
The table below summarizes the core performance metrics derived from this direct comparison, highlighting the complementary strengths and weaknesses of each platform.
Table 1: Direct Performance Comparison of Smart-seq2 and 10X Genomics Chromium
| Performance Metric | Smart-seq2 | 10X Genomics Chromium |
|---|---|---|
| Genes Detected Per Cell | Higher [45] [1] | Lower |
| Detection of Low-Abundance Transcripts | Superior [45] [1] | More susceptible to noise [1] |
| Transcript Isoform & SNP Analysis | Excellent (Full-length coverage) [46] | Limited (3'-end biased) [2] |
| Proportion of Mitochondrial Genes | Higher (∼30%, similar to bulk) [1] | Lower (0-15%) [1] |
| Proportion of Non-Coding (lncRNA) Transcripts | Lower (2.9-3.8%) [1] | Higher (6.5-9.6%) [1] |
| Dropout Rate (Technical Noise) | Lower for low-expression genes [1] | More severe, especially for low-expression genes [1] |
| Cells Captured Per Run | Lower (plate-based, 96-384 wells) [1] [44] | Higher (droplet-based, thousands of cells) [1] |
| Rare Cell Type Detection | Limited by cell number [1] | Superior due to high cell throughput [45] [1] |
| Differential Expression Gene Sets | Distinct and complementary sets compared to 10X [45] [1] | Distinct and complementary sets compared to Smart-seq2 [45] [1] |
Workflow Analysis: Pathways to Enhanced Scalability
The fundamental difference between Smart-seq2 and 10X Genomics lies in their core workflows. Smart-seq2 is a plate-based protocol that generates full-length cDNA, while 10X is a droplet-based system that captures 3' transcripts with cell barcodes and UMIs [1] [2]. The following diagram illustrates the pathway toward an automated and miniaturized Smart-seq2 workflow, which addresses its traditional limitations in throughput.
Figure 1: Automation and miniaturization pathway for the Smart-seq2 workflow. Traditional manual steps (yellow) are enhanced by automated solutions (green) to increase throughput and reproducibility.
The Evolving Ecosystem of Full-Length scRNA-seq
The drive to improve upon Smart-seq2 has led to the development of newer protocols like Smart-seq3 and FLASH-seq, which incorporate design elements that enhance performance and are inherently more automation-friendly [46].
- Smart-seq3: This version introduced a redesigned template-switching oligonucleotide (TSO) with unique molecular identifiers (UMIs) to control for PCR amplification bias. It also features a completely revised reverse transcription mix to enhance sensitivity [46].
- FLASH-seq: Developed by the creator of Smart-seq2, FLASH-seq represents a significant leap forward. It integrates reverse transcription and cDNA amplification into a single step, reducing the workflow from two days to just seven hours. It uses a more processive reverse transcriptase and a simplified TSO design, resulting in significantly higher cDNA yield, greater sensitivity, and improved cell-to-cell correlations compared to Smart-seq2 and Smart-seq3 [46].
Table 2: Comparison of Full-Length scRNA-seq Method Evolution
| Feature | Smart-seq2 | Smart-seq3 | FLASH-seq |
|---|---|---|---|
| UMIs | No [2] | Yes (5' end) [46] | Optional [46] |
| Workflow Duration | ~2 days [46] | ~2 days [46] | ~1 day (7 hours) [46] |
| Sensitivity (Genes/Cell) | Baseline (High) [1] | Improved vs. SS2 [46] | Highest [46] |
| Cell-to-Cell Correlation | Good | Good | Significantly Improved [46] |
| Automation & Throughput | Compatible (96-/384-well) | Compatible (96-/384-well) | Highly compatible and designed for automation [46] |
Application in Embryo Research and Practical Implementation
In the context of embryo research, the choice between high-sensitivity (Smart-seq2) and high-throughput (10X) platforms is critical. Studies aiming to create comprehensive reference atlases of human development, from the zygote to the gastrula stage, benefit from the ability of 10X to profile thousands of cells, revealing rare cell types [13]. Conversely, research focused on the molecular details of specific embryonic lineages, such as detecting splice isoforms, allelic variants, and single-nucleotide polymorphisms (SNPs) within epiblast or hypoblast cells, would leverage the superior sensitivity and full-length coverage of Smart-seq2 [13] [46]. The following diagram illustrates how these technologies can be viewed as complementary tools in this field.
Figure 2: A decision logic flowchart for selecting a scRNA-seq platform in embryo research, highlighting the complementary nature of 10X Genomics and automated full-length methods.
The Scientist's Toolkit: Key Reagent Solutions
Successful automation and execution of full-length scRNA-seq protocols depend on specific reagent components. The table below details key solutions used in these methods.
Table 3: Key Research Reagent Solutions for Full-Length scRNA-seq
| Reagent / Solution | Function in the Protocol |
|---|---|
| Oligo(dT) Primer | Priming reverse transcription at the poly-A tail of mRNAs [44]. |
| Template Switching Oligo (TSO) | Enabling the reverse transcriptase to add a universal adapter sequence to the 3' end of the first-strand cDNA, a cornerstone of SMART technology [46]. |
| Locked Nucleic Acid (LNA) / Riboguanosine | Modified nucleotides in the TSO (e.g., LNA in Smart-seq2, riboguanosine in FLASH-seq) that enhance template-switching efficiency and reduce artifacts [46]. |
| Betaine | An additive that reduces secondary structures in RNA and cDNA, improving the efficiency of reverse transcription and PCR amplification, particularly for GC-rich transcripts [46]. |
| Polyethylene Glycol (PEG) | A molecular crowding agent (used in Smart-seq3) that increases reaction efficiency by reducing the effective volume [46]. |
| Unique Molecular Identifiers (UMIs) | Short random nucleotide sequences (in Smart-seq3/FLASH-seq) that tag individual mRNA molecules pre-amplification, allowing for digital counting and correction of PCR bias [46] [2]. |
The comparative analysis clearly demonstrates that Smart-seq2 and 10X Genomics Chromium are complementary technologies. Smart-seq2 excels in sensitivity and full-length transcript detection, while 10X offers superior cellular throughput. For embryo research, this means the choice is not one of superiority but of objective. Research questions demanding deep molecular characterization of specific lineages will benefit most from the high-fidelity data of Smart-seq2. The traditional limitations of Smart-seq2 in throughput and reproducibility are being effectively addressed through a concerted trend toward automation and miniaturization. The development of next-generation protocols like FLASH-seq, which offer a streamlined, sensitive, and automation-ready workflow, signifies a major step forward. By leveraging these advancements, researchers can harness the superior sensitivity of full-length scRNA-seq to unravel the complex molecular events of human embryogenesis with greater efficiency and confidence than ever before.
Direct Performance Comparison and Biological Validation
The selection of an appropriate single-cell RNA sequencing (scRNA-seq) platform is a critical step in experimental design, directly impacting the resolution of cellular heterogeneity, the identification of rare cell types, and the overall biological conclusions. For researchers studying embryo cells, where sample material is often scarce and cellular transitions are finely regulated, this choice is paramount. Two of the most prominent technologies are the plate-based, full-length transcript profiling SMART-seq2 and the droplet-based, 3'-counting 10X Genomics Chromium system. This guide provides an objective, data-driven comparison of their performance metrics—specifically genes detected per cell, UMI counts, and multiplet rates—to inform scientists in developmental biology and related fields.
The fundamental differences in the methodologies of SMART-seq2 and 10X Genomics Chromium underpin their performance characteristics. SMART-seq2 is a plate-based method where individual cells are sorted into wells. It uses template-switching to generate full-length cDNA, which enables the detection of isoform usage and single-nucleotide polymorphisms [3]. A key limitation is that it does not incorporate Unique Molecular Identifiers (UMIs), making its gene quantification more susceptible to amplification bias [3].
In contrast, the 10X Genomics platform is a droplet-based system that encapsulates thousands of single cells in oil droplets along with barcoded beads. It performs 3'-end counting and incorporates UMIs. During analysis, reads with the same cell barcode and UMI are presumed to originate from the same original mRNA molecule, which corrects for amplification bias and provides more digital, quantitative counts [47] [48]. This high-throughput approach is designed for profiling tens of thousands of cells in a single run.
The table below summarizes the core technological differences.
Table 1: Fundamental Technological Profiles
| Feature | SMART-seq2 | 10X Genomics Chromium |
|---|---|---|
| Throughput | Low- to medium-throughput (tens to hundreds of cells) | High-throughput (thousands to tens of thousands of cells) |
| Transcript Coverage | Full-length | 3' (or 5')-end focused |
| UMI Incorporation | No | Yes |
| Cell Barcoding | No | Yes |
| Primary Quantification | Read counts (TPM) | UMI counts |
| Key Advantage | Detection of isoforms and sequence variants; high sensitivity per cell | Scalability and ability to profile rare cell populations |
Direct Performance Comparison of Key Metrics
A direct comparative study using the same samples of CD45– cells provides robust, head-to-head data on the performance of these two platforms [1] [12].
Sensitivity and Gene Detection
SMART-seq2 consistently detects more genes per individual cell compared to 10X Chromium. This is attributed to its full-length transcript coverage and deeper sequencing per cell. The study reported that Smart-seq2 detected a greater number of genes, particularly low-abundance transcripts and alternatively spliced transcripts [1].
Conversely, while 10X profiles more cells overall, it detects fewer genes per cell. Its data also exhibits a more severe "dropout" problem, where a gene is detected in one cell but not in another, especially for genes with lower expression levels [1]. However, due to its high cell throughput, 10X excels at detecting rare cell types within a heterogeneous population.
Data Composition and Quality Metrics
The technologies also differ in the composition of the transcripts they capture.
- Mitochondrial Gene Proportion: SMART-seq2 data showed a 2.8 to 9.1 times higher proportion of mitochondrial genes than 10X data. This is likely due to more thorough organelle membrane disruption in its protocol. While a high mitochondrial percentage can indicate poor cell quality, it is also a biological feature of certain cell types, such as cardiomyocytes [1].
- Non-coding RNA Detection: Both platforms detect a significant proportion (10%–30%) of non-coding RNAs. However, 10X data had a higher relative proportion of long non-coding RNAs (lncRNAs) [1].
- Ribosomal and Ambient RNA: 10X data contained a 2.6 to 7.2 times higher proportion of ribosome-related genes. Meanwhile, the 10X platform is more susceptible to background "ambient" RNA contamination, which requires specific computational tools for estimation and correction [1] [41].
Table 2: Head-to-Head Performance Metrics from Experimental Data
| Performance Metric | SMART-seq2 | 10X Genomics Chromium | Experimental Context |
|---|---|---|---|
| Genes Detected per Cell | Higher (Detects more genes, especially low-abundance and spliced transcripts) | Lower (Fewer genes detected per cell) | CD45– cells from human cancer patients [1] |
| Sequencing Depth per Cell | ~1.7M - 6.3M reads [1] | ~20K - 92K reads [1] | CD45– cells from human cancer patients |
| UMI Counting | Not Applicable (uses read counts) | Yes (Reduces amplification noise) | Fundamental to platform design [47] [48] |
| Multiplet Rate | Very low (manual cell loading) | ~0.4% per 1,000 cells recovered (increases with cells loaded) [49] | Platform specification [49] |
| Mitochondrial Gene % | Higher (2.8-9.1x higher than 10X) | Lower | CD45– cells from human cancer patients [1] |
| Drop-out Rate | Lower | Higher (especially for low-expression genes) | CD45– cells from human cancer patients [1] |
| Best Suited For | In-depth analysis of individual cells, isoform detection | Identifying population heterogeneity, discovering rare cell types | Inferred from performance characteristics [1] [3] |
Experimental Protocols for Platform Comparison
To ensure a fair and accurate comparison between scRNA-seq platforms, the experimental design and data analysis must be carefully controlled.
Sample Preparation and Data Generation
The foundational step is to profile the same biological sample using both technologies. In the cited study, CD45– cells from cancer patients were obtained by fluorescence-activated cell sorting (FACS). This sorted population was then split and processed in parallel using the standard Smart-seq2 and 10X Genomics Chromium protocols [1]. Using the same starting cell population is crucial for minimizing biological variation and isolating technical differences between the platforms.
For 10X data, the raw sequencing data is processed through the Cell Ranger pipeline. Key steps include:
- Read Trimming: The 5' template switch oligo (TSO) and 3' poly-A sequences are trimmed to improve mapping.
- Splicing-aware Alignment: Reads are aligned to the genome using the STAR aligner.
- UMI Counting: Confidently mapped, sense-strand reads are used to count UMIs for each gene and cell barcode. Cell Ranger includes error correction for both barcodes and UMIs.
- Cell Calling: An algorithm combining Order of Magnitude (OrdMag) and EmptyDrops distinguishes cells containing real RNA from empty droplets containing only ambient RNA [47] [41].
For Smart-seq2 data, which lacks UMIs, the standard analysis involves:
- Read Alignment: Reads are mapped to the reference genome.
- Gene Quantification: Reads mapped to each gene are counted, and expression is often normalized to Transcripts Per Million (TPM) [1].
Quality Control and Metric Calculation
After generating count matrices, a standardized set of quality control (QC) metrics should be calculated for both datasets to allow direct comparison. The singleCellTK (SCTK-QC) R package provides a comprehensive workflow for this purpose [41]. Key QC steps include:
- Empty Droplet Detection: For 10X data, tools like
EmptyDropsare used to confirm which barcodes represent real cells versus ambient RNA [41]. - Standard Metric Calculation: For all cells, metrics like the total number of genes detected, total reads/UMIs per cell, and percentage of mitochondrial reads are calculated.
- Doublet Detection: Algorithms that predict doublets by creating in-silico doublets and comparing gene expression profiles are run, which is especially important for 10X data [41].
- Ambient RNA Estimation: Tools like
DecontXcan estimate and correct for contamination from ambient RNA [41].
The following diagram illustrates the core computational workflow for processing 10X data and generating the metrics used for comparison.
The Scientist's Toolkit: Essential Reagents and Materials
Successful scRNA-seq experiments require careful preparation and quality control. The following table lists key materials and their functions, based on core facility guidelines [50] [49].
Table 3: Essential Research Reagent Solutions for scRNA-seq
| Item | Function / Purpose | Technical Notes |
|---|---|---|
| Single-Cell Suspension | Input material for profiling. | Must be a high-viability (>70-90%), single-cell suspension free of clumps and debris [49]. |
| Cell Staining Reagents | Viability assessment (e.g., AOPI stain for automated counters like Luna-FX7) [49]. | Critical for determining cell health and concentration prior to loading. |
| Cell Suspension Buffer | Maintains cell viability and integrity. | 1x PBS (Ca++/Mg++-free) + 0.04%–2% BSA is recommended. Must be free of EDTA, DNase, and surfactants [49]. |
| RNase Inhibitor | Prevents RNA degradation during sample prep. | Optional for fresh cells; highly recommended or required for nuclei preparations [49]. |
| 10X Barcoded Gel Beads | Contains cell barcode and UMI sequences for 10X platform. | Chemistry-specific (e.g., 3' v4, 5' v3). Part of the 10X kit [49]. |
| Library Preparation Kit | Creates sequencing-ready libraries from cDNA. | Platform-specific (e.g., 10X Chromium kit, SMART-seq2 reagents) [50] [49]. |
| Sequence Alignment & QC Software | Processes raw data into gene-cell count matrices and performs QC. | Cell Ranger (10X), singleCellTK (SCTK-QC), Seurat [47] [41]. |
Application in Embryo Cell Research
While the direct comparative data comes from somatic cells, the performance characteristics of these platforms are highly relevant to embryo research. The creation of a comprehensive human embryo reference atlas from zygote to gastrula stages, which integrated multiple scRNA-seq datasets, underscores the importance of platform selection [13]. This reference enables the authentication of stem cell-based embryo models by projecting their data onto the in vivo reference.
For such studies, the choice between SMART-seq2 and 10X depends on the biological question:
- Use SMART-seq2 when the goal is a deep, detailed molecular portrait of a limited number of precious embryo cells, such as analyzing transcriptional dynamics in early blastomeres.
- Use 10X Genomics Chromium to comprehensively map the diverse cell lineages emerging during gastrulation or to identify rare progenitor populations within a complex embryonic tissue [13].
The high multiplet rate of 10X, while generally low, is a critical consideration when processing embryonic cells that may naturally adhere together. Computational doublet detection becomes an essential step in the analysis workflow [41].
Benchmarking with a Universal Human Embryo Reference Tool
The selection of an appropriate single-cell RNA sequencing (scRNA-seq) platform is a critical determinant of success in developmental biology research. For the study of early human embryogenesis, where cell numbers are scarce and lineage specification events are rapidly unfolding, this choice is particularly consequential. The development of a comprehensive human embryo reference tool, which integrates multiple datasets to create a universal transcriptomic roadmap from zygote to gastrula, now provides an unprecedented benchmark for evaluating scRNA-seq technologies [13]. This article performs a direct comparative analysis of two widely used platforms—the full-length, plate-based SMART-seq2 and the droplet-based, 3'-end counting 10X Genomics Chromium—within the specific context of embryo cell research. We present objective performance data and methodological details to guide researchers in selecting the optimal technology for their investigative aims.
Experimental Protocols and Methodologies
To ensure a fair comparison, the cited studies processed the same biological samples across both platforms. The fundamental differences in their experimental designs are outlined below.
SMART-seq2 Workflow and Protocol
SMART-seq2 is a plate-based method designed to generate full-length cDNA [51] [3].
- Cell Isolation: Single cells are individually sorted into 96- or 384-well plates containing lysis buffer via Fluorescence-Activated Cell Sorting (FACS). This is compatible with "index sorting," which records the phenotypic markers of each cell as it is sorted [3].
- Reverse Transcription and cDNA Synthesis: The protocol employs an oligo-d(T) primer to target polyadenylated mRNA. The reverse transcriptase enzyme adds non-templated cytosines to the 3' end of the cDNA, enabling a template-switching oligonucleotide (TSO) to bind. This "switching mechanism" ensures full-length cDNA amplification [8].
- cDNA Amplification: The full-length cDNA is then amplified via PCR. A key limitation is that the standard SMART-seq2 protocol does not incorporate Unique Molecular Identifiers (UMIs), making it difficult to account for PCR amplification bias [2].
- Library Preparation and Sequencing: The amplified cDNA is fragmented and prepared for sequencing, typically generating one set of FASTQ files per cell [2].
10X Genomics Chromium Workflow and Protocol
The 10X Genomics Chromium system is a high-throughput, droplet-based method that captures expression data from the 3' end of transcripts [1] [51].
- Cell Encapsulation: A single-cell suspension is co-encapsulated with gel beads into nanoliter-scale droplets. Each gel bead is coated with barcoded oligos containing a poly(dT) sequence, a cell barcode (identical for all oligos on the same bead), and a UMI (unique to each oligo) [3].
- Barcoding and Reverse Transcription: Within each droplet, cell lysis occurs, and the released mRNA is primed by the gel bead oligos. Reverse transcription produces barcoded cDNA, where all transcripts from a single cell share the same cell barcode, and each individual transcript molecule is tagged with a unique UMI [1].
- Library Preparation and Sequencing: The droplets are broken, and the barcoded cDNA is pooled for amplification and library preparation. This results in a single set of FASTQ files for a large number of cells, wherein computational demultiplexing is used to assign reads to individual cells based on their barcodes [2].
Direct Performance Comparison for Embryo Research
A direct comparative analysis using the same samples of CD45⁻ cells provides a systematic evaluation of the strengths and weaknesses of each platform [1]. The following table summarizes key quantitative metrics from this benchmarking study.
Table 1: Direct Performance Comparison of SMART-seq2 and 10X Genomics Chromium
| Performance Metric | SMART-seq2 | 10X Genomics Chromium | Implication for Embryo Research |
|---|---|---|---|
| Genes Detected per Cell | Higher [1] | Lower [1] | SMART-seq2 is superior for detecting low-abundance transcripts and splice variants in rare embryo cells. |
| Transcript Coverage | Full-length [51] [3] | 3'-end only [1] [51] | SMART-seq2 enables isoform usage analysis and allelic expression detection [51]. |
| Cell Throughput | Low (96-384 cells/run) [3] | High (thousands of cells/run) [1] [51] | 10X is essential for profiling complex, heterogeneous tissues or for comprehensive embryo atlases. |
| Unique Molecular Identifiers (UMIs) | No (standard protocol) [2] | Yes [1] [3] | 10X data corrects for PCR amplification bias, enabling more accurate transcript quantification. |
| Mitochondrial Gene % | Higher (∼30%) [1] | Lower (0-15%) [1] | High % in SMART-seq2 may indicate more thorough cell lysis or be a natural feature of certain cell states. |
| Drop-out Rate | Lower for low-expression genes [1] | Higher, especially for low-expression genes [1] | SMART-seq2 provides more sensitive detection of weakly expressed developmental regulators. |
| Data Composition | Higher proportion of protein-coding genes [1] | Higher proportion of long non-coding RNAs (lncRNAs) [1] | Platform choice can bias biological discoveries; 10X may be better for studying non-coding RNA function. |
Application to Embryo Reference Tool Benchmarking
The integrated human embryo reference, spanning zygote to gastrula stages, provides a critical framework for benchmarking [13]. When authenticating stem cell-based embryo models, the choice of scRNA-seq platform directly influences the resolution and accuracy of the analysis.
- SMART-seq2 is advantageous for deep molecular characterization of a limited number of cells. Its high gene detection sensitivity and full-length transcript coverage make it ideal for validating key lineage markers, identifying novel isoforms, and performing detailed analyses of specific progenitor populations within a model. Its composite data also more closely resembles bulk RNA-seq data, facilitating direct comparisons with existing datasets [1].
- 10X Genomics Chromium is indispensable for cellular census and heterogeneity mapping. Its ability to profile thousands of cells from a single embryo model allows researchers to assess the presence and proportion of all expected cell lineages simultaneously. This is crucial for evaluating the "cellular fidelity" of a model—ensuring that it contains not only the correct cell types but in the right abundances and relationships [13]. The lower sequencing cost per cell makes it feasible to replicate experiments sufficiently for robust statistical analysis.
The Scientist's Toolkit: Essential Research Reagents and Materials
Table 2: Key Reagent Solutions for Single-Cell RNA Sequencing Experiments
| Item | Function | Technology Context |
|---|---|---|
| Oligo-d(T) Primers | Primes reverse transcription from the poly-A tail of mRNA. | Fundamental to both SMART-seq2 and 10X Genomics. |
| Template Switching Oligo (TSO) | Enables full-length cDNA synthesis by binding non-templated C nucleotides added by RT. | Core to SMART-seq2 and other "SMART" chemistry protocols [8]. |
| Barcoded Gel Beads | Deliver cell barcodes and UMIs to individual cells during droplet encapsulation. | Exclusive to droplet-based systems like 10X Genomics [3]. |
| Unique Molecular Identifiers (UMIs) | Short random nucleotide sequences that tag individual mRNA molecules to correct for PCR bias. | Incorporated in 10X; added in updated full-length protocols like SMART-seq3 [21] [2]. |
| Tn5 Transposase | Enzyme used to fragment and tagment amplified cDNA for Illumina library preparation. | Used in library prep for SMART-seq2 and many modern sequencing protocols [21]. |
Visualizing Platform Selection and Experimental Integration
The following diagram illustrates the decision-making workflow for platform selection and how data from each platform integrates with the human embryo reference tool for model authentication.
Figure 1. A decision workflow for selecting a scRNA-seq platform to authenticate stem cell-based embryo models using the universal human embryo reference. The choice depends on whether the research goal prioritizes deep molecular characterization (SMART-seq2) or a broad cellular census (10X Genomics). Data from both paths are ultimately projected onto the reference for annotation and benchmarking.
The dichotomy between SMART-seq2 and 10X Genomics is not a matter of one platform being universally superior, but rather a strategic choice aligned with specific research objectives. For research questions demanding the highest possible sensitivity and full-length transcript information from a limited number of precious embryo cells—such as validating specific lineage markers or discovering splice variants—SMART-seq2 remains the gold standard. Conversely, for projects aimed at mapping the complete cellular composition of an embryo model or tissue, identifying rare cell populations, and scaling to process many samples, 10X Genomics Chromium offers the necessary throughput and robust, UMI-based quantification. The recent development of a universal human embryo reference tool [13] now provides a powerful and essential benchmark for these technologies, enabling unbiased authentication of embryo models and ensuring that biological discoveries are built upon a foundation of precise and accurate cellular annotation.
This guide provides an objective performance comparison between two prominent single-cell RNA sequencing (scRNA-seq) technologies—the plate-based SMART-seq2 and the droplet-based 10X Genomics Chromium (10X)—within the specific application of mapping early human embryonic development. The journey from a zygote to a gastrula represents a period of rapid cellular differentiation and lineage specification. Accurately resolving this process requires scRNA-seq platforms that are sensitive enough to detect subtle transcriptional changes and capable of characterizing rare cell populations. Based on direct comparative analyses and benchmarking studies, this case study demonstrates that the choice between SMART-seq2 and 10X Genomics is not a matter of superiority, but rather a strategic decision based on the specific research objectives: SMART-seq2 is optimal for in-depth, full-length transcriptomic analysis of defined cell populations, while 10X Genomics excels in large-scale cellular census and rare cell type discovery.
Technology Comparison at a Glance
The table below summarizes the core technical attributes and performance metrics of SMART-seq2 and 10X Genomics, directly informed by comparative studies [1] [8].
Table 1: Direct Platform Comparison for scRNA-seq
| Feature | SMART-seq2 | 10X Genomics Chromium |
|---|---|---|
| Technology Base | Plate-based, full-length | Droplet-based, 3'-end captured |
| Throughput (Cells) | Hundreds | Thousands to Tens of Thousands |
| Sensitivity (Genes/Cell) | High (Detects more genes, especially low-abundance transcripts) [1] | Moderate |
| Transcript Coverage | Full-length (Enables isoform and splice variant analysis) [21] | 3'-focused |
| Quantification Basis | TPM (Transcripts Per Million) | UMI (Unique Molecular Identifier) counts |
| Key Strength | High gene detection & analytical depth | High cellular throughput & population breadth |
| Primary Limitation | Lower throughput, higher cost per cell | Lower sensitivity & transcript coverage |
| Ideal for Lineage Mapping | Deep transcriptional characterization of pre-defined lineages | Unbiased identification of all lineages, including rare populations |
Experimental Protocols for Embryonic Lineage Analysis
Sample Preparation and Single-Cell Isolation
For studies involving human embryos or embryo models, the initial steps are critical [13] [27].
- Embryo Dissociation: Tissues are dissociated into single-cell suspensions using optimized combinations of mechanical and enzymatic dissociation to maximize cell yield and viability.
- Cell Sorting: Fluorescence-Activated Cell Sorting (FACS) is commonly employed to isolate individual cells into well plates for SMART-seq2 or to ensure a high-viability single-cell suspension for 10X Genomics [1] [21]. This step can also be used to exclude apoptotic cells based on viability dyes.
Library Preparation Protocols
SMART-seq2 Protocol: This protocol is a plate-based method where single cells are sorted into individual wells containing lysis buffer [8]. The chemistry relies on the template-switching mechanism of reverse transcriptase. Key steps include:
- Reverse Transcription: An oligo-dT primer binds to the poly-A tail of mRNAs. The reverse transcriptase adds non-templated cytosines to the cDNA end.
- Template Switching: A Template Switching Oligo (TSO) with riboguanosines at its 3' end binds to the non-templated cytosines, allowing the reverse transcriptase to switch templates and copy the TSO sequence. This ensures full-length cDNA amplification and the incorporation of universal PCR handles.
- PCR Amplification: The full-length cDNA is amplified by PCR.
- Library Construction & Sequencing: Libraries are prepared (often via tagmentation) and sequenced to a high depth to achieve full-length coverage [8].
10X Genomics Protocol: This is a droplet-based, high-throughput method [1].
- Gel Bead Emulsion: Single cells, barcoded gel beads, and reverse transcription reagents are co-encapsulated into nanoliter-scale droplets.
- Barcoding: Within each droplet, cell-specific and molecule-specific barcodes (UMIs) are added to all cDNA molecules derived from a single cell during the reverse transcription reaction.
- Library Prep & Sequencing: The droplets are broken, and the barcoded cDNA is pooled for library preparation and sequencing. This method sequences the 3' ends of transcripts, with gene expression quantified by counting UMIs.
The following diagram illustrates the core workflow differences between the two technologies.
Performance Data in Developmental Biology Context
Direct comparative analyses using the same biological samples reveal critical performance trade-offs that directly impact their utility in lineage specification studies [1].
Table 2: Experimental Performance Metrics from Direct Comparison
| Performance Metric | SMART-seq2 | 10X Genomics | Implication for Lineage Mapping |
|---|---|---|---|
| Gene Detection per Cell | Higher | Lower | SMART-seq2 better characterizes complex transcriptional states in early lineages. |
| Detection of Low-Abundance Transcripts | Superior [1] | Moderate (Higher noise) | SMART-seq2 is more sensitive for detecting weakly expressed key transcription factors. |
| Transcriptomic Character | More closely resembles bulk RNA-seq [1] | Distinct | SMART-seq2 data may be more directly comparable to existing bulk developmental datasets. |
| Proportion of Mitochondrial Genes | Higher (~30%) [1] | Lower (0-15%) | Can indicate more thorough cell lysis; high levels may also signal lower cell quality. |
| Proportion of Non-Coding RNA | Lower proportion of lncRNA | Higher proportion of lncRNA [1] | 10X may provide more data on regulatory lncRNAs, which are crucial in development. |
| Dropout Rate (Technical zeros) | Lower | Higher, especially for low-expression genes [1] | 10X data is sparser, potentially missing key, lowly expressed developmental genes. |
Analysis for Embryonic Development Applications
Resolving Early Lineage Trajectories
Constructing an accurate transcriptional roadmap of early human development, from the zygote to the gastrula, requires integrating data across multiple studies and platforms. A comprehensive reference tool has been established by integrating several scRNA-seq datasets, enabling the projection and authentication of new data, such as from stem cell-derived embryo models [13]. Key analytical steps include:
- Data Integration: Combining datasets using methods like fastMNN to correct for batch effects and create a unified reference [13].
- Trajectory Inference: Using tools like Slingshot to reconstruct developmental lineages (e.g., epiblast, hypoblast, and trophectoderm) based on pseudotemporal ordering of cells, revealing key transcription factors driving each lineage [13].
The following diagram summarizes how data from both platforms contributes to building a lineage specification roadmap.
Platform-Specific Insights into Development
Each platform can yield distinct biological insights due to its inherent technical strengths:
- SMART-seq2, with its full-length coverage, is powerful for detecting alternative splicing events and isoform variation during cell fate decisions, a feature that is lost with 3'-end focused methods like 10X [21].
- 10X Genomics, with its high cellular throughput, is unparalleled for identifying rare cell populations within a complex tissue. In embryonic development, this capability is crucial for detecting transient progenitor states or very small nascent lineages [1].
- A study noted that each platform detected distinct groups of differentially expressed genes (DEGs) between cell clusters, indicating that the technologies are complementary and can reveal different facets of the underlying biology [1].
The Scientist's Toolkit: Essential Reagents and Materials
The following table details key reagents and their functions in these scRNA-seq workflows, crucial for experimental planning [1] [8].
Table 3: Key Research Reagent Solutions for scRNA-seq
| Reagent/Material | Function | Platform |
|---|---|---|
| Oligo-dT Primer | Primes reverse transcription from the poly-A tail of mRNA. | Both |
| Template Switching Oligo (TSO) | Enables full-length cDNA synthesis by template switching; SMART-seq2 uses LNA-modified TSO for higher efficiency [8]. | SMART-seq2 |
| Barcoded Gel Beads | Contains cell barcode and UMI sequences for multiplexing thousands of cells. | 10X Genomics |
| Tn5 Transposase | An enzyme used for efficient tagmentation (fragmentation and adapter tagging) in library preparation. | Both (e.g., in Smart-seq3xpress & 10X) [21] [8] |
| UMI (Unique Molecular Identifier) | Short random nucleotide sequence used to label individual mRNA molecules for accurate digital counting and reduction of PCR bias. | Primarily 10X (integrated in beads); also in SMART-seq3 [8] |
The choice between SMART-seq2 and 10X Genomics for studying lineage specification from zygote to gastrula is guided by the specific research question.
- Choose SMART-seq2 when your study requires maximum transcriptional detail per cell. This includes projects focused on characterizing splice variants, identifying lowly expressed but critical transcription factors, or achieving the deepest possible molecular profile of a defined, limited number of cells (e.g., specific lineages from embryo models).
- Choose 10X Genomics when the research goal is to catalog cellular heterogeneity and discover all constituent cell types, including rare and transient populations. This is ideal for building comprehensive atlases of entire embryos or complex embryo models where scale is a priority.
For the most comprehensive understanding, a synergistic approach is emerging. Researchers can use 10X Genomics to perform an unbiased cellular census of an entire embryo model and then use SMART-seq2 to perform deep, full-length transcriptomic profiling on specific, FACS-sorted cell populations of interest identified in the initial census.
The Risk of Misannotation in Embryo Models Without Proper Referencing
The accurate annotation of cell identities in human embryo models is paramount for validating their fidelity to in vivo development. Single-cell RNA sequencing (scRNA-seq) has become an indispensable tool for this authentication, with platforms such as SMART-seq2 and 10X Genomics Chromium being widely employed. However, these technologies possess distinct technical characteristics that can significantly influence the interpretation of data and the identification of cell lineages. This guide provides a direct comparative analysis of SMART-seq2 and 10X Genomics, drawing on experimental data to outline their performance differences. Furthermore, it highlights the substantial risk of misannotation in embryo models when an organized, integrated scRNA-seq reference from authentic human embryos is not utilized for benchmarking, a pitfall that can lead to erroneous biological conclusions.
Stem cell-based embryo models offer unprecedented experimental tools for studying early human development. Their usefulness, however, hinges entirely on their molecular, cellular, and structural fidelity to their in vivo counterparts. Single-cell RNA sequencing has been widely adopted for the unbiased transcriptional profiling required for this authentication [13]. The selection of an appropriate scRNA-seq platform is a critical first step, as the choice influences gene detection sensitivity, cellular throughput, and the ability to detect rare cell types.
Despite the existence of several human embryo transcriptome datasets, a well-organized and comprehensive human scRNA-seq dataset serving as a universal reference was historically unavailable [13]. This lack of a standardized benchmark, combined with the distinct technical biases of different scRNA-seq platforms, creates a landscape ripe for the misannotation of cell lineages. Such misannotation can obscure the true developmental stage of a model, misassign progenitor identities, and ultimately lead to flawed interpretations of developmental mechanisms. This article directly compares two leading scRNA-seq technologies—SMART-seq2 and 10X Genomics Chromium—within the context of embryo research and demonstrates how their proper use, anchored by a robust reference, is essential for accurate science.
A Direct Comparison of SMART-seq2 and 10X Genomics Chromium
SMART-seq2 (plate-based) and 10X Genomics Chromium (droplet-based) represent two frequently used but technically divergent scRNA-seq platforms [1] [12]. Their fundamental differences in methodology lead to complementary advantages and limitations, which are summarized in the table below.
Table 1: Technical Comparison of SMART-seq2 and 10X Genomics Chromium
| Feature | SMART-seq2 | 10X Genomics Chromium |
|---|---|---|
| Technology Principle | Plate-based, full-length sequencing | Droplet-based, 3'-end counting with UMIs |
| Throughput (Cells) | Lower (96-384 cells per run) [3] | Ultra-high (thousands of cells per run) [1] |
| Genes Detected per Cell | Higher (4,000-9,000 genes) [3] [1] | Lower (~500-3,000 genes) [3] [1] |
| Sensitivity | Superior for low-abundance transcripts [1] [12] | Higher noise for low-expression mRNAs [1] [12] |
| Transcript Coverage | Full-length, enables isoform & SNP analysis [3] | 3'-end focused, not suitable for isoform detection |
| Key Quality Metrics | Higher mitochondrial gene proportion [1] | Higher ribosomal & lncRNA proportion [1] [7] |
| Primary Advantage | High gene detection sensitivity & resolution | Ability to profile vast cell numbers for rare type discovery |
| Ideal Application | Deep transcriptional characterization of defined cell populations | Unbiased atlas-building and discovery of rare cell types |
Experimental Protocols and Data Generation
The experimental workflows for these two platforms differ significantly, contributing to their distinct outputs.
SMART-seq2 Protocol: Individual cells are first sorted into 96- or 384-well plates containing lysis buffer. The protocol then utilizes a template-switching mechanism during reverse transcription to generate full-length cDNA [3]. This cDNA is subsequently amplified via PCR. A key feature is that this method does not incorporate Unique Molecular Identifiers (UMIs), which makes gene quantification more susceptible to amplification biases. However, it provides uniform coverage across the entire transcript, allowing for the investigation of alternative splicing and single-nucleotide polymorphisms [3].
10X Genomics Chromium Protocol: This is a droplet-based method where single cells, reverse transcription reagents, and barcoded gel beads are co-encapsulated in nanoliter-scale droplets to form Gel Beads-in-Emulsion (GEMs) [3]. Within each droplet, mRNA from a single cell is reverse-transcribed, and the resulting cDNA is tagged with a cell-specific barcode and a UMI. The UMI allows for precise digital quantification of transcript abundance by correcting for PCR amplification noise [1] [3]. The libraries are 3'-end focused, prioritizing cell throughput and quantitative accuracy over information about the full transcript sequence.
The following diagram illustrates the core procedural differences between these two foundational protocols.
The Problem: Misannotation of Embryo Models Without a Unified Reference
The different technical profiles of SMART-seq2 and 10X mean that each platform can detect distinct sets of genes and exhibit biases in the biological pathways they highlight. For instance, a comparative study found that while SMART-seq2 detected more genes per cell, the highly variable genes (HVGs) identified by 10X data were enriched in 34 KEGG pathways, including the "PI3K–Akt signaling pathway," which are crucial for understanding biological differences [1]. This suggests that biological interpretation can be platform-dependent.
This inherent platform bias becomes critically dangerous when authentic human embryo references are not used for benchmarking. A recent effort to create a comprehensive human embryo reference tool noted that without such a resource, there is a demonstrated risk of misannotating cell lineages in stem cell-based embryo models [13]. When researchers use irrelevant references or rely solely on a limited number of marker genes without a global transcriptomic context, they can incorrectly assign cellular identities. For example, an embryo model cell might be labeled as "amnion" based on a single marker, but when projected onto a comprehensive reference spanning the zygote to gastrula stages, its transcriptome may more closely align with a different lineage, such as advanced mesoderm [13]. The following diagram conceptualizes this risk and its solution.
Establishing an Integrated Human Embryo Reference
To mitigate this risk, a unified reference was developed through the integration of six published human scRNA-seq datasets, covering developmental stages from the zygote to the gastrula [13]. This process involved:
- Data Reprocessing: Raw data from all studies were uniformly processed using the same genome reference and annotation to minimize batch effects.
- Data Integration: Fast mutual nearest neighbor (fastMNN) methods were employed to embed expression profiles of 3,304 early human embryonic cells into a common space.
- Lineage Annotation & Validation: Cell type annotations were contrasted and validated with available human and non-human primate datasets.
- Tool Development: A stabilized Uniform Manifold Approximation and Projection (UMAP) was constructed to create a prediction tool. Query datasets from embryo models can be projected onto this reference to annotate them with predicted cell identities [13].
This integrated atlas reveals a continuous developmental progression and allows for the precise annotation of all major lineages, from the initial segregation of the inner cell mass and trophectoderm to the later specification of the primitive streak, mesoderm, and definitive endoderm during gastrulation [13].
The Scientist's Toolkit: Essential Reagent Solutions
Table 2: Key Research Reagents and Kits for scRNA-seq in Embryo Research
| Reagent / Kit | Function | Platform Association |
|---|---|---|
| Fluorescence-Activated Cell Sorting (FACS) | Isolation of individual cells for plate-based methods; enables index sorting to record pre-sort phenotypes. | SMART-seq2 |
| SMART-seq2 Reagent Kit | Off-the-shelf reagents for full-length cDNA synthesis and amplification in low-throughput plate formats. | SMART-seq2 |
| 10X Genomics Chromium Chip & Kit | Microfluidic chip and reagent kit for generating barcoded GEMs for high-throughput cell capture. | 10X Genomics |
| Cell Hashing Antibodies | Oligo-tagged antibodies for sample multiplexing, allowing multiple samples to be pooled in a single 10X run. | 10X Genomics |
| Fixed RNA Profiling Kit | Reagents for cell fixation and permeabilization, enabling split-pool combinatorial indexing without microfluidics. | Parse Biosciences (Alternative) |
| Lambda DNA Spike-in | Exogenous DNA control added to each single-cell sample to help determine the ploidy of the cell. | scCOOL-seq (Multi-omics) |
The choice between SMART-seq2 and 10X Genomics is not a matter of selecting the objectively "better" platform, but rather the appropriate one for the specific research question.
- Use SMART-seq2 when the biological question requires the deepest possible transcriptional characterization of a defined, limited number of cells. Its sensitivity for detecting low-abundance transcripts and its ability to profile full-length transcripts make it ideal for investigating splicing variants, sequence heterogeneity, and achieving a transcriptome that most closely resembles bulk RNA-seq data [1] [12] [3].
- Use 10X Genomics when the goal is to build a comprehensive cellular atlas of a complex tissue or to discover rare cell populations. Its high throughput is indispensable for capturing the full spectrum of cellular heterogeneity in developing embryo models [1].
Crucially, regardless of the platform chosen, the authentication of embryo models must be conducted by projecting their scRNA-seq data onto a comprehensive and integrated reference of authentic human embryogenesis. This practice is the most effective safeguard against the persistent risk of cell lineage misannotation, ensuring that embryo models are validated against the most faithful standard available and that subsequent biological conclusions are built on a solid foundation.
Comparative Analysis with Emerging Platforms like Parse Biosciences
Single-cell RNA sequencing (scRNA-seq) has become an indispensable tool in developmental biology, particularly for profiling the intricate cellular heterogeneity within embryo cells. When designing studies, such as those investigating embryonic development, researchers must make a critical choice between two predominant technological approaches: plate-based full-length transcript protocols like SMART-seq2 and droplet-based high-throughput methods like 10X Genomics Chromium [3]. This decision has been further complicated by the emergence of new, highly multiplexed platforms such as Parse Biosciences' Evercode, which utilize combinatorial barcoding without the need for specialized instrumentation [52] [53]. This guide provides an objective, data-driven comparison of these platforms, synthesizing findings from recent benchmarking studies to inform experimental design for embryo cell research.
The fundamental difference between these platforms lies in their core methodology for cell partitioning and barcoding. SMART-seq2 is a plate-based method that provides full-length transcript coverage, making it suitable for isoform and SNP analysis [3]. 10X Genomics Chromium is a droplet-based system that encapsulates single cells with barcoded beads in microfluidic droplets, enabling profiling of thousands of cells [3]. Parse Biosciences Evercode employs a fixed, permeabilized cell strategy with split-pool combinatorial barcoding, requiring no specialized instrumentation and offering scalability from 10,000 to over 1 million cells [53].
Table 1: Fundamental Characteristics of scRNA-seq Platforms
| Platform | Core Technology | Throughput (Cells) | Transcript Coverage | Instrument Required |
|---|---|---|---|---|
| SMART-seq2 | Plate-based | 96-384 | Full-length | No (but liquid handler beneficial) |
| 10X Genomics Chromium | Droplet-based | 500-10,000 | 3' counting | Yes (Chromium Controller) |
| Parse Biosciences Evercode | Combinatorial barcoding | 10,000-1,000,000+ | 3' counting | No |
Performance Benchmarking and Experimental Data
Sensitivity and Gene Detection
Multiple independent studies have systematically compared the sensitivity of these platforms in terms of genes detected per cell. SMART-seq2 consistently demonstrates superior sensitivity for detecting genes per cell, especially for low-abundance transcripts [12]. In a direct comparison using CD45- cells, Smart-seq2 detected more genes per cell compared to 10X Genomics Chromium, particularly for low abundance transcripts and alternatively spliced transcripts [12]. The composite of Smart-seq2 data also more closely resembled bulk RNA-seq data [12].
Parse Biosciences Evercode shows enhanced sensitivity compared to 10X Genomics. In a 2024 benchmark study using PBMCs, Parse detected approximately 1.2 times more genes per cell than 10X (median of ~2,300 vs. ~1,900 genes) [52]. This increased sensitivity enabled better detection of rare cell types like plasmablasts and dendritic cells [52].
Table 2: Quantitative Performance Metrics Across Platforms
| Performance Metric | SMART-seq2 | 10X Genomics Chromium | Parse Evercode |
|---|---|---|---|
| Genes detected per cell | 4,000-7,000 [3] | ~1,900 [52] | ~2,300 [52] |
| Cell capture efficiency | High (manual selection) | ~53% [52] | ~27% [52] |
| Throughput capability | Low (hundreds) | Medium (thousands) | High (millions) |
| Doublet/multiplet rate | Low (visually detectable) | Variable (6-8% reported) [19] | Low (combinatorial barcoding) |
| Transcriptomic coverage | Full-length | 3' counting | 3' counting with reduced bias |
| UMI incorporation | No [3] | Yes | Yes |
Technical Considerations and Artifacts
Each platform exhibits distinct technical characteristics that may impact data interpretation. SMART-seq2 captures a higher proportion of mitochondrial genes, which could be problematic for certain sample types [12]. 10X-based data shows higher noise for mRNAs with low expression levels and displays a more severe dropout problem, especially for genes with lower expression levels [12]. Approximately 10-30% of all detected transcripts by both platforms were from non-coding genes, with long non-coding RNAs (lncRNAs) accounting for a higher proportion in 10X [12].
Parse demonstrates distinct distribution patterns for gene length and GC content compared to 10X [52]. It also produces a higher proportion of intronic reads and lower proportion of exonic reads (approximately 45% exonic for Parse vs. 70% for 10X), suggesting reduced bias in priming [52]. The duplicate rate in 10X was higher (50-56%) compared to Parse (35-38%), indicating differences in amplification efficiency [52].
Experimental Workflows and Practical Implementation
The experimental workflows differ significantly between platforms, impacting time investment, cost, and flexibility. The following diagram illustrates the key decision points in selecting an appropriate platform based on research objectives:
Experimental Design and Methodologies
Standardized Benchmarking Approaches
Recent comparative studies have employed rigorous experimental designs to enable fair platform evaluation. A typical benchmarking study involves processing the same biological sample across multiple platforms to minimize biological variability [52] [19]. Common reference samples include:
- Peripheral Blood Mononuclear Cells (PBMCs): Leverages well-defined cell types and marker genes for validation [52].
- Cell line mixtures: Allows precise multiplet rate calculation through species-mixing experiments [19].
- Embryonic stem cells: Particularly relevant for embryo research applications [4].
For data processing, standardized computational pipelines like scumi have been developed to uniformly process data from different platforms, removing processing differences introduced by platform-specific pipelines [19]. Studies typically normalize sequencing depth across platforms before comparison (e.g., downsampling to 20,000 reads per cell) to ensure fair evaluation [52].
Protocol-Specific Methodologies
SMART-seq2 Protocol: Cells are individually sorted into 96- or 384-well plates containing lysis buffer. The protocol utilizes template-switching reverse transcription to generate full-length cDNA, followed by PCR preamplification [3]. Library preparation typically involves tagmentation-based fragmentation and adapter addition. Recent miniaturization (Smart-seq3xpress) reduces reaction volumes to nanoliter scale while maintaining data quality [21].
10X Genomics Chromium Protocol: A cell suspension is combined with barcoded gel beads and partitioning oil on a Chromium chip. Single cells are co-encapsulated with single beads in droplets where reverse transcription occurs. After breaking droplets, cDNA is amplified and libraries are prepared following the 3' gene expression protocol [19].
Parse Biosciences Evercode Protocol: Cells are fixed and permeabilized, then distributed to a 96-well plate for the first barcoding round via in-cell reverse transcription. Cells are pooled, redistributed, and undergo additional barcoding rounds through split-pool processing. After four barcoding rounds, libraries are prepared from the pooled, barcoded cells [52] [53].
The Scientist's Toolkit: Essential Research Reagents and Materials
Table 3: Key Research Reagent Solutions for scRNA-seq Experiments
| Reagent/Material | Function | Platform Considerations |
|---|---|---|
| Oligo-dT Primers | mRNA capture via poly-A tail binding | 10X uses oligo-dT only; Parse uses oligo-dT with random hexamers for reduced bias [52] |
| Template Switching Oligo (TSO) | Enables full-length cDNA synthesis | Critical for SMART-seq2; optimized TSOs reduce mis-priming artifacts [21] |
| Barcoded Beads | Delivers cell/UMI barcodes to single cells | 10X uses gel beads in emulsion; Parse uses combinatorial barcoding in plates [52] [53] |
| Tagmentation Enzyme (Tn5) | Fragments and tags cDNA for sequencing | SMART-seq2 requires optimization of Tn5:cDNA ratio; miniaturization reduces reagent use 20-fold [21] |
| Cell Fixation Reagents | Preserves cellular RNA for delayed processing | Essential for Parse platform; enables sample batching over time [53] |
| Partitioning Oil | Creates microfluidic droplets for cell isolation | Required for 10X platform; specific viscosity properties needed [19] |
| Vapor-Lock | Prevents evaporation in low-volume reactions | Used in miniaturized SMART-seq3xpress protocols [21] |
Biological Insights and Application to Embryo Cell Research
The choice of platform can significantly impact biological conclusions, as different methods may detect distinct sets of differentially expressed genes between cell clusters [12]. For embryo research, where developmental trajectories and rare progenitor populations are of key interest, platform selection requires particular consideration:
Cellular Heterogeneity Mapping: 10X's higher throughput provides better representation of diverse cell populations, while SMART-seq2's superior sensitivity enables deeper characterization of each population [12] [3]. Parse's combination of high sensitivity and extreme throughput offers advantages for comprehensive embryonic atlas building.
Rare Cell Detection: While 10X can detect rare cell types due to its ability to profile thousands of cells [12], Parse's higher sensitivity may provide better characterization of rare embryonic progenitors [52].
Developmental Trajectory Inference: SMART-seq2's full-length coverage enables isoform-level analysis during embryonic development [3], while the molecular counting accuracy of UMI-based methods (10X and Parse) provides more precise quantification for pseudotime analysis.
The choice between SMART-seq2, 10X Genomics, and Parse Biosciences depends heavily on the specific objectives of the embryo research study. SMART-seq2 remains optimal for focused studies requiring full-length transcript information and maximum sensitivity for low-abundance genes. 10X Genomics provides a robust, well-established solution for profiling thousands of cells to map embryonic cellular heterogeneity. Parse Biosciences offers compelling advantages in scalability, cost-effectiveness at high throughput, and experimental flexibility—particularly valuable for large-scale embryonic atlas projects or when samples are collected over extended time periods. As the field progresses toward increasingly multiplexed experiments and integration with other omics modalities, these platform characteristics will guide researchers in selecting the most appropriate technology for their embryonic development studies.
Conclusion
The choice between SMART-seq2 and 10X Genomics for embryo cell analysis is not a matter of one platform being superior, but rather a strategic decision based on specific research goals. SMART-seq2, with its higher sensitivity and full-length transcript data, is unparalleled for deep molecular characterization of small, precious cell populations, such as early embryonic lineages. In contrast, 10X Genomics provides the scalability and cell throughput necessary to capture rare cell types and construct comprehensive developmental atlases. The critical practice of validating stem cell-based embryo models against integrated in vivo references, as highlighted by recent studies, is essential to prevent lineage misannotation. Future directions will involve greater integration of multi-omics data, increased automation, and the development of even more sensitive protocols to further unravel the complexities of early human development, with profound implications for understanding infertility, congenital diseases, and advancing regenerative medicine.
References
- 1. Direct Comparative Analyses of 10X Genomics Chromium ... [https://pmc.ncbi.nlm.nih.gov/articles/PMC8602399/]
- 2. Differences between SMART-seq2, SMART-seq3, and 10x [https://www.biostars.org/p/9488230/]
- 3. A Single-Cell Sequencing Guide for Immunologists [https://www.frontiersin.org/journals/immunology/articles/10.3389/fimmu.2018.02425/full]
- 4. Comparison of Single Cell Transcriptome Sequencing ... [https://pmc.ncbi.nlm.nih.gov/articles/PMC10743076/]
- 5. High-throughput targeted long-read single cell sequencing ... [https://www.nature.com/articles/s41467-019-11049-4]
- 6. SICOF - our offer [https://ki.se/en/research/research-infrastructure-and-environments/core-facilities-for-research/single-cell-core-facility-flemingsberg-sicof/sicof-our-offer]
- 7. Comparative transcriptomic analyses of thymocytes using 10x ... [https://bmcgenomics.biomedcentral.com/articles/10.1186/s12864-024-10976-x]
- 8. Benchmarking full-length transcript single cell mRNA ... [https://bmcgenomics.biomedcentral.com/articles/10.1186/s12864-022-09014-5]
- 9. Comparative Analysis of Single-Cell RNA Sequencing ... [https://pmc.ncbi.nlm.nih.gov/articles/PMC9258609/]
- 10. Droplet microfluidics: fundamentals and its advanced ... - PMC [https://pmc.ncbi.nlm.nih.gov/articles/PMC9055587/]
- 11. The Power of Droplet-Based Microfluidics Technology [https://elveflow.com/microfluidic-reviews/introduction-to-droplet-based-microfluidics/]
- 12. Direct Comparative Analyses of 10X Genomics Chromium ... [https://www.sciencedirect.com/science/article/pii/S1672022921000486]
- 13. A comprehensive human embryo reference tool using ... [https://www.nature.com/articles/s41592-024-02493-2]
- 14. Review on Droplet-based Microfluidics – A Complete Guide [https://www.fluigent.com/resources-support/expertise/white-papers/microfluidic-white-paper-droplet-based-microfluidics/]
- 15. UMI-count modeling and differential expression analysis ... [https://pmc.ncbi.nlm.nih.gov/articles/PMC5984373/]
- 16. Secondary Data Analysis of RNA-Seq data | RNA Lexicon [https://www.lexogen.com/blog/rna-lexicon-data-analysis-and-quality-control-secondary-analysis/]
- 17. The impact of amplification on differential expression ... [https://www.nature.com/articles/srep25533]
- 18. Quantile normalization of single-cell RNA-seq read counts ... [https://genomebiology.biomedcentral.com/articles/10.1186/s13059-020-02078-0]
- 19. Systematic comparison of single-cell and single-nucleus RNA ... [https://pmc.ncbi.nlm.nih.gov/articles/PMC7289686/]
- 20. Single-cell sequencing of full-length transcripts and T-cell ... [https://bmcgenomics.biomedcentral.com/articles/10.1186/s12864-024-11036-0]
- 21. Scalable single-cell RNA sequencing from full transcripts ... [https://www.nature.com/articles/s41587-022-01311-4]
- 22. High-resolution mapping of single cells in spatial context [https://www.nature.com/articles/s41467-025-61667-4]
- 23. Direct Comparative Analyses of 10X Genomics Chromium and Smart-seq2 - PubMed [https://pubmed.ncbi.nlm.nih.gov/33662621/]
- 24. Systematic comparison of high-throughput single-cell RNA ... [https://bmcgenomics.biomedcentral.com/articles/10.1186/s12864-020-07358-4]
- 25. Systematic comparison of high-throughput single-cell RNA ... [https://pmc.ncbi.nlm.nih.gov/articles/PMC7818754/]
- 26. GSF FY '24 -'25 Price Schedule - Greehey Children's Cancer [https://gccri.uthscsa.edu/services/gsf/gsf-pricing/]
- 27. Applications and techniques of single-cell RNA ... [https://pmc.ncbi.nlm.nih.gov/articles/PMC12284766/]
- 28. Rainbow-Seq: Combining Cell Lineage Tracing with Single ... [https://pmc.ncbi.nlm.nih.gov/articles/PMC6135740/]
- 29. Article Spatiotemporal and genetic cell lineage tracing of ... [https://www.sciencedirect.com/science/article/abs/pii/S0092867424014259]
- 30. Pricing | Pitt Center for Advanced Genomics [https://www.advancedgenomics.pitt.edu/pricing]
- 31. Single cell RNA-Seq - Core Bioinformatics group | [https://www.corebioinf.stemcells.cam.ac.uk/pipelines-tools/pipelines/single-cell-rna-seq]
- 32. Sequencing Requirements for Single Cell ATAC [https://www.10xgenomics.com/support/epi-atac/documentation/steps/sequencing/sequencing-requirements-for-single-cell-atac]
- 33. Integrative analyses of single-cell transcriptome and regulome ... [https://genomebiology.biomedcentral.com/articles/10.1186/s13059-020-02116-x]
- 34. Fast and flexible profiling of chromatin accessibility ... [https://www.nature.com/articles/s41421-023-00642-z]
- 35. Best Practices for Analysis of 10x Genomics Single Cell ... [https://www.10xgenomics.com/analysis-guides/best-practices-analysis-10x-single-cell-rnaseq-data]
- 36. Common Considerations for Quality Control Filters ... [https://www.10xgenomics.com/analysis-guides/common-considerations-for-quality-control-filters-for-single-cell-rna-seq-data]
- 37. QC Report HTML | Official 10x Genomics Support [https://www.10xgenomics.com/support/software/cell-ranger/latest/analysis/cr-outputs-qc-report]
- 38. Current best practices in single‐cell RNA‐seq analysis [https://pmc.ncbi.nlm.nih.gov/articles/PMC6582955/]
- 39. Detection and removal of barcode swapping in single-cell ... [https://pmc.ncbi.nlm.nih.gov/articles/PMC6039488/]
- 40. The neXt generation of single cell RNA-seq [https://www.10xgenomics.com/blog/the-next-generation-of-single-cell-rna-seq-an-introduction-to-gem-x-technology]
- 41. Comprehensive generation, visualization, and reporting of ... [https://www.nature.com/articles/s41467-022-29212-9]
- 42. High content of nuclei-free low-quality cells in reference single ... [https://bmcgenomics.biomedcentral.com/articles/10.1186/s12864-024-11015-5]
- 43. MERCURIUS™ FLASH-seq vs 10x Genomics Chromium [https://alitheagenomics.com/blog/mercurius-flash-seq-vs-10x-genomics-chromium-which-single-cell-rna-seq-approach-is-right-for-you]
- 44. Single-cell RNA-sequencing: The future of genome biology ... [https://pmc.ncbi.nlm.nih.gov/articles/PMC5449089/]
- 45. Direct Comparative Analysis of 10 Chromium and... X Genomics [https://ega-archive.org/studies/EGAS00001003973]
- 46. What is the difference between Smart-seq2, Smart-seq3 ... [https://alitheagenomics.com/blog/what-is-the-difference-between-smart-seq2-smart-seq3-and-flash-seq-for-full-length-single-cell-rna-seq]
- 47. Cell Ranger's Gene Expression Algorithm [https://www.10xgenomics.com/support/software/cell-ranger/latest/algorithms-overview/cr-gex-algorithm]
- 48. UMI-count modeling and differential expression analysis for ... [https://genomebiology.biomedcentral.com/articles/10.1186/s13059-018-1438-9]
- 49. 10X Genomics Single Cell Services [https://biotech.wisc.edu/gec/10x-genomics-single-cell-services/]
- 50. Single-Cell Sequencing - Center for Genetic Medicine [https://www.cgm.northwestern.edu/cores/nuseq/services/next-generation-sequencing/single-cell-seq.html]
- 51. Navigating single-cell RNA-sequencing: protocols, tools ... [https://pmc.ncbi.nlm.nih.gov/articles/PMC12085826/]
- 52. Comparative Analysis of Single-Cell RNA Sequencing ... [https://pmc.ncbi.nlm.nih.gov/articles/PMC11011421/]
- 53. The Smarter Single Cell Platform - Evercode vs ... [https://www.parsebiosciences.com/compare/]