Strategies for Reducing Autofluorescence in Whole-Mount Embryo Samples: From Foundational Principles to Advanced Imaging
This article provides a comprehensive guide for researchers and drug development professionals on mitigating autofluorescence in whole-mount embryo samples, a critical challenge in high-resolution 3D fluorescence imaging.
Strategies for Reducing Autofluorescence in Whole-Mount Embryo Samples: From Foundational Principles to Advanced Imaging
Abstract
This article provides a comprehensive guide for researchers and drug development professionals on mitigating autofluorescence in whole-mount embryo samples, a critical challenge in high-resolution 3D fluorescence imaging. It covers the foundational sources of autofluorescence, including lipofuscin and heme in myocardial tissue, and details practical methodological solutions such as chemical quenching with TrueBlack or Sudan Black B, and optical clearing techniques like CUBIC and LIMPID. The content further explores protocol optimization for improved signal-to-noise ratio, troubleshooting common issues like insufficient clearing, and validates methods through comparative analysis of imaging depth and signal quality across different tissues and model organisms. By synthesizing current methodologies, this resource aims to enhance the reliability and clarity of 3D embryonic imaging for advanced biomedical research.
Understanding Autofluorescence: Sources and Impact on Embryonic Imaging
Autofluorescence, the background fluorescence emitted naturally by biological tissues, is a significant challenge in fluorescence microscopy. In embryonic research, this inherent signal can obscure specific fluorescence from labels and probes, compromising data quality and interpretation. This technical guide defines common sources of autofluorescence in embryonic tissues and provides proven methodologies for its reduction, enabling clearer and more reliable imaging for whole mount embryo samples.
FAQ: Understanding Autofluorescence
1. What is autofluorescence and why is it a problem in embryonic imaging?
Autofluorescence is the natural emission of light by biological structures within a tissue when they absorb light. Unlike specific fluorescence from introduced labels or probes, this background signal is non-specific and can significantly reduce the signal-to-noise ratio in fluorescence images. In embryonic tissues, which are rich in lipids and various metabolites, autofluorescence can be particularly strong, masking the specific signal from fluorescent antibodies or RNA probes (FISH), and leading to inaccurate data interpretation [1] [2].
2. What are the most common sources of autofluorescence in embryonic tissues?
Several endogenous molecules are classic autofluorescence culprits. Their presence and intensity can vary based on embryonic stage, tissue type, and metabolic state.
Table 1: Common Autofluorophores in Embryonic Tissues
| Autofluorophore | Primary Function | Typical Excitation/Emission | Notes for Embryonic Tissues |
|---|---|---|---|
| NAD(P)H | Cellular metabolism (electron donor) | ~340-390 nm / ~420-500 nm [2] | Indicates metabolic activity; high in rapidly developing cells. |
| FAD | Cellular metabolism (electron acceptor) | ~450 nm / ~535 nm [2] | Ratio with NAD(P)H can indicate metabolic state. |
| Lipofuscin | Lysosomal waste product | Broad spectrum | Accumulates with age; may be less prominent in early embryos. |
| Collagens | Structural extracellular matrix protein | Broad spectrum, often green [2] | Becomes more prominent as connective tissue develops. |
| Elastin | Structural protein in blood vessels | Blue-green spectrum | Present in the developing vascular system. |
3. Can tissue preparation itself contribute to autofluorescence?
Yes, the chemical fixation process, especially with aldehydes like paraformaldehyde, can induce autofluorescence by creating fluorescent cross-links. Over-fixation can exacerbate this issue and also reduce immunoreactivity and endogenous protein fluorescence. Optimizing fixation time is crucial to balance tissue preservation with minimal autofluorescence generation [3].
Troubleshooting Guide: Reducing Autofluorescence
Problem: High background signal is obscuring specific fluorescence labels. Goal: Identify the source and apply an effective reduction strategy.
Table 2: Autofluorescence Reduction Strategies
| Methodology | Mechanism of Action | Recommended Use | Considerations |
|---|---|---|---|
| Chemical Bleaching | Oxidizes and bleaches pigmented and fluorescent molecules using reagents like hydrogen peroxide (H₂O₂) or Sudan Black. | A standard step in whole-mount protocols, particularly effective for lipofuscin and other broad-spectrum fluorophores [1] [4]. | Can be combined with light illumination (photobleaching). May require optimization of concentration and incubation time. |
| Optical Clearing (LIMPID) | Reduces light scattering by homogenizing the tissue's refractive index, improving signal-to-noise from specific labels deep in the tissue. | Ideal for 3D imaging of whole-mount embryos. Compatible with RNA FISH and immunohistochemistry [1]. | Aqueous solutions like LIMPID are mild and preserve lipids and tissue structure better than harsh organic solvents [1] [3]. |
| Spectral Unmixing & Image Processing | Computationally separates the spectral signature of autofluorescence from that of specific fluorophores during image analysis. | Essential when autofluorescence cannot be fully eliminated physically, or for re-analyzing existing image data [5]. | Requires specialized software and calibration. Most effective when the autofluorescence spectrum is well-characterized. |
| Probe Selection | Uses fluorophores with emissions in the red and near-infrared (NIR) spectrum, where tissue autofluorescence is naturally lower. | Critical for multiplexed imaging or when working with highly autofluorescent tissues. | Probes like Alexa Fluor 647 or IRDye800CW help minimize bleed-through from background signals [6] [7]. |
Detailed Protocol: Oxidation-Mediated Autofluorescence Reduction
The following workflow is adapted from a validated protocol for whole-mount RNA FISH in mouse embryos, focusing on the autofluorescence reduction module [4].
Title: Autofluorescence Reduction Workflow
Procedure:
- Sample Preparation: Begin with a fixed embryo sample. For whole-mount embryos, permeability the tissue appropriately for reagent access.
- Bleaching Solution: Prepare a bleaching solution. A common formulation is 3-5% hydrogen peroxide (H₂O₂) in phosphate-buffered saline (PBS) or a buffer containing formamide [4]. The choice of buffer can be optimized for compatibility with subsequent staining steps.
- Incubation: Submerge the sample in the bleaching solution and incubate in the dark or under strong light at room temperature. The incubation time (typically several hours) should be optimized for the embryo's size and stage. Monitor the sample for a visible reduction in inherent pigmentation and fluorescence.
- Washing: Thoroughly wash the sample with an appropriate buffer (e.g., PBS with Tween) to completely remove the bleaching reagent before proceeding to RNA FISH or antibody staining protocols.
- Optical Clearing: After staining, mount the sample in an optical clearing agent like LIMPID. This aqueous solution uses ingredients like iohexol, urea, and saline-sodium citrate to match the refractive index of the tissue, further enhancing the signal-to-noise ratio by allowing deeper, clearer imaging with minimal aberration [1].
The Scientist's Toolkit: Key Reagents for Autofluorescence Management
Table 3: Essential Research Reagents and Materials
| Reagent / Material | Function | Example Use Case |
|---|---|---|
| Hydrogen Peroxide (H₂O₂) | Chemical bleaching agent to oxidize and reduce autofluorescence. | Core component of oxidation-mediated autofluorescence reduction protocols for whole-mount embryos [4]. |
| LIMPID Clearing Solution | Aqueous optical clearing agent for refractive index matching. | Mounting medium for deep-tissue 3D imaging of cleared whole-mount embryos after FISH or immunohistochemistry [1]. |
| Anti-GD2-IRDye800CW | A near-infrared (NIR) fluorescently labeled antibody. | NIR dye minimizes interference from autofluorescence, which is lower in longer wavelengths. Used for targeted imaging in neuroblastoma models [6]. |
| Spectral Reference Standards | Cell-free slides with known fluorescence for calibration. | Enables accurate pixel-by-pixel autofluorescence correction in quantitative FRET and other spectral imaging techniques by providing spillover factors [5]. |
| PKH & CellVue Lipophilic Dyes | Fluorescent cell membrane labels for long-term tracking. | Provides stable, bright, and uniform labeling of live cells with minimal transfer, useful for fate-mapping studies in developing embryos with low background [8]. |
| Sodium Borohydride | Reducing agent that diminishes aldehyde-induced autofluorescence. | Treatment of fixed tissues to reduce fluorescence caused by fixative cross-links. |
Title: Autofluorescence Culprits and Solutions
Frequently Asked Questions (FAQs)
Q1: How does PFA fixation specifically cause autofluorescence? PFA (paraformaldehyde) works by creating protein-protein and protein-nucleic acid cross-links via methylene bridges (-CH₂-). These chemical cross-links themselves can fluoresce, generating a broad-spectrum background signal that occurs across the blue, green, and red spectral ranges [9].
Q2: My whole-mount embryo samples have high background after PFA fixation. What are my first steps? First, confirm the source of the background by performing control experiments with no primary antibody and with secondary antibody only [9] [10]. Then, ensure you are fixing for the minimum time required and consider a post-fixation bleaching step with H₂O₂, which is a common practice to reduce autofluorescence in whole-mount protocols [1].
Q3: Are there alternative fixatives to PFA that cause less autofluorescence? Yes, for cell surface markers, chilled organic solvents like ethanol or methanol are effective alternatives that produce less autofluorescence [9]. However, note that glutaraldehyde causes even stronger autofluorescence than PFA and should be avoided unless essential for ultrastructure preservation [9].
Q4: Can I still use PFA and just change my imaging settings to avoid the background? Yes, this is a valid strategy. Since PFA-induced autofluorescence has a broad emission spectrum, using fluorophores that emit in the far-red (e.g., Cy5, CoraLite 647) can help distinguish your specific signal from the background, which is often more pronounced in the blue/green spectra [9].
Troubleshooting Guide: Identifying and Resolving PFA-Induced Background
The following table summarizes common issues and proven solutions related to fixation-induced background noise.
| Problem & Symptom | Possible Cause | Recommended Solution | Applicable to Whole-Mount Embryos? |
|---|---|---|---|
| High General Background [11] [10] | Inadequate blocking of the tissue after fixation. | Increase blocking incubation time; use 10% normal serum or 1-5% BSA. | Yes, ensure blocking solution permeates entire sample. |
| Broad-Spectrum Signal:\ | |||
| Background visible in multiple channels [9] | Autofluorescence from PFA-induced methylene bridge cross-links. | Treat samples with sodium borohydride (NaBH₄); use far-red fluorophores. | Yes, but test NaBH₄ concentration on a test sample first. |
| Specific Granular Background [9] | Accumulation of autofluorescent pigments like lipofuscin, which can be present in tissues. | Treat samples with Sudan black B or Eriochrome black T to quench this signal. | Yes, this is highly recommended for whole-mount tissues. |
| High Background from Red Blood Cells [9] | Autofluorescence from the porphyrin ring in heme groups. | Perfuse tissue with PBS prior to fixation, if possible. | Challenging for whole embryos; consider alternative analysis. |
| Non-Specific Antibody Staining [11] [10] | Primary or secondary antibody concentration is too high. | Titrate antibodies to find the optimal concentration; incubate at 4°C. | Yes, crucial for deep penetration in whole-mounts. |
Experimental Protocol: Reducing Autofluorescence in Whole-Mount Embryos
The workflow below is adapted from a modern whole-mount RNA FISH protocol and is designed to be compatible with whole-mount embryo samples, incorporating key steps to mitigate PFA's effects [1].
Workflow: Autofluorescence Reduction in Whole-Mount Embryos
1. Sample Extraction and Fixation
- Tissue Collection: Dissect embryos in a cold, non-aqueous medium like PBS to preserve tissue integrity.
- Fixation: Immerse samples in 4% PFA. Crucially, fix for the minimum time required to adequately preserve your antigen of interest. Over-fixation exponentially increases cross-linking and autofluorescence [9] [1]. A few hours to overnight is typical, but duration should be optimized.
2. Bleaching (Autofluorescence Reduction)
- After fixation and washing, incubate the whole-mount embryos in a solution of 1-3% hydrogen peroxide (H₂O₂) in PBS. This chemical treatment helps to oxidize and reduce fluorescent compounds created during fixation [1].
- Incubation can be performed at room temperature or 4°C for several hours. Protect samples from light during this step.
3. Staining and Blocking
- Permeabilization and Blocking: Incubate embryos in a blocking buffer containing a permeabilizing agent (e.g., 0.1-0.5% Triton X-100) and a protein block (e.g., 10% normal serum or 1-5% BSA). This step is critical for reducing non-specific antibody binding and must be long enough to allow reagents to penetrate the entire sample [11] [10].
- Antibody Incubation: Incubate with primary and secondary antibodies that have been titrated for optimal concentration. Using secondary antibodies conjugated to far-red fluorophores (e.g., Alexa Fluor 647, CoraLite 647) can significantly improve the signal-to-noise ratio by moving away from the blue/green autofluorescence of PFA [9].
4. Optical Clearing (Optional but Recommended)
- To image deep into the whole-mount embryo, use an optical clearing method. The LIMPID method is recommended as it is aqueous-based, preserves lipids, and is compatible with FISH and antibody staining [1].
- Mount the stained embryo in the LIMPID clearing solution (a mixture of saline-sodium citrate, urea, and iohexol). This solution refractive index-matches the tissue, reducing light scattering and allowing for high-resolution 3D imaging with minimal aberration [1].
5. Imaging and Analysis
- Image the cleared samples using confocal or light-sheet microscopy.
- Always include unstained and secondary-antibody-only controls processed in parallel to accurately set background subtraction thresholds during image analysis [9] [10].
The Scientist's Toolkit: Essential Reagents for Background Reduction
| Reagent | Function & Rationale |
|---|---|
| Sodium Borohydride (NaBH₄) | A reducing agent that can break down some of the fluorescent cross-links formed by PFA fixation, thereby reducing baseline autofluorescence [9]. |
| Sudan Black B | A lipophilic dye that effectively quenches the autofluorescence from endogenous pigments like lipofuscin, which is common in tissues and fluoresces strongly [9]. |
| Hydrogen Peroxide (H₂O₂) | Used in a bleaching step to oxidize and reduce autofluorescent compounds in fixed tissues. A key step in whole-mount protocols [1]. |
| Far-Red Fluorophores(e.g., Alexa Fluor 647, CoraLite 647) | Emit light in a wavelength range further from the blue/green autofluorescence caused by PFA and other compounds like collagen and NADH, improving signal detection [9]. |
| LIMPID Clearing Solution | A hydrophilic, aqueous-based clearing medium that preserves fluorescence while making tissues transparent for deep imaging, ideal for whole-mount embryo work [1]. |
Autofluorescence, the background fluorescence emitted naturally by biological tissues and materials, presents a significant challenge in fluorescence microscopy. It obscures specific signals from labeled probes, reduces the signal-to-noise ratio, and ultimately limits the effective imaging depth, particularly in thick samples like whole-mount embryos. This technical guide details the sources of this interference and provides proven methodologies to overcome it.
What Is Autofluorescence and Why Is It a Problem?
Autofluorescence is the tissue-endogenous fluorescence caused by several different intrinsic fluorophores [12]. In a research context, it acts as a major source of background noise, compromising the clarity and reliability of experimental data.
The table below lists biological compounds that are common sources of autofluorescence [13] [12].
| Source Category | Key Examples | Notes / Characteristics |
|---|---|---|
| Metabolic Molecules | NAD(P)H, Flavin adenine dinucleotide (FAD, FMN) [12] | Found in mitochondria; related to cellular metabolic activity [12]. |
| Structural Proteins | Collagen, Elastin [12] | Prominent in connective tissue. |
| Lipopigments | Lipofuscins [13] [12] | Accumulate over time in lysosomes. |
| Aromatic Amino Acids | Tryptophan, Tyrosine [12] | Found in most proteins. |
Interference can also come from the laboratory environment and sample preparation materials [13].
| Source Category | Key Examples |
|---|---|
| Fixatives | Glutaraldehyde, Formalin [13] [14] |
| Culture Media | Phenol red, serum proteins [13] |
| Lab Materials | Certain plastics and imaging dishes [13] |
Troubleshooting Guide: Resolving Autofluorescence Issues
FAQ: Weak or No Specific Staining
Q: My specific fluorescent signal is very weak or absent, even though my protocol is correct. Could autofluorescence be the cause?
While autofluorescence more commonly causes a high background, it can sometimes mask a weak specific signal. To troubleshoot [14]:
- Confirm Antibody Specificity: Run a positive control to ensure the primary antibody is binding to the target.
- Check Microscope Settings: Ensure you are using the correct light source and filter sets for your chosen fluorophore. Increase the gain or exposure time to capture more signal [14].
- Optimize Antibody Concentration: Titrate your primary and secondary antibodies. A concentration that is too low will yield no signal, while one that is too high can increase background [14].
- Verify Sample Integrity: Ensure cells or tissues were not over-fixed, as this can mask epitopes. Also, confirm that permeabilization was performed if the target is intracellular [14].
FAQ: High Background Signal
Q: My image has a high background that obscures the specific signal. How can I confirm it's autofluorescence and what can I do?
- Run an Unstained Control: Image a section of your sample that has not been exposed to any fluorescent probes. If you detect signal, it is autofluorescence [13] [14].
- Spectral Scanning: Use a microscope with spectral detection capabilities (e.g., a white light laser with a spectral detector) to determine the full emission spectrum of the autofluorescence in your sample. This helps you choose fluorophores whose spectra do not overlap with the background [13].
- Reduce Antibody Concentration: High concentrations of primary or secondary antibodies are a common cause of non-specific background. Titrate to find the optimal, lowest possible concentration [14].
- Improve Washing: Insufficient washing between antibody incubation steps can leave unbound antibodies that contribute to background. Ensure thorough washing with an appropriate buffer [14].
Experimental Protocols for Autofluorescence Reduction
The following workflows provide detailed methodologies for mitigating autofluorescence, from simple chemical treatments to advanced imaging techniques.
Protocol 1: Chemical Reduction of Autofluorescence
This method uses chemical treatments to quench autofluorescence in fixed tissues [13].
Detailed Methodology [13]:
- Sample Fixation: After fixation, wash your tissue samples (e.g., whole-mount embryos) thoroughly with phosphate-buffered saline (PBS). Where possible, avoid fixatives like glutaraldehyde that induce autofluorescence.
- Chemical Treatment: Incubate the sample in a quenching solution.
- Washing: Wash the sample extensively with PBS to ensure all quenching chemicals are removed before proceeding with immunostaining or hybridization protocols.
Protocol 2: Optical Clearing for Depth-Enhanced Imaging
Optical clearing reduces light scattering, allowing deeper imaging and often reducing the relative contribution of autofluorescence. The LIMPID method is a lipid-preserving, aqueous clearing technique compatible with RNA FISH [1].
Quantitative Data on Clearing Efficacy The table below summarizes the performance of different mounting media in gastruloid imaging, as measured by intensity decay and information content (Fourier ring correlation quality estimate, FRC-QE) [15].
| Mounting Medium | Relative Intensity at 100 µm | Relative Intensity at 200 µm | Information Content (FRC-QE) | Key Characteristic |
|---|---|---|---|---|
| PBS (Control) | 1x | 1x | 1x | Baseline, no clearing |
| 80% Glycerol | 3x higher | 8x higher | 1.5-3x higher | Effective, common, and accessible [15] |
| Optiprep | - | - | - | Live-cell compatible [15] |
| LIMPID Solution | - | - | - | Aqueous, preserves lipids for imaging [1] |
Workflow for Optical Clearing and Deep Imaging [1] [15]:
The Scientist's Toolkit: Key Reagent Solutions
| Item | Function / Purpose | Example Use Case |
|---|---|---|
| Sodium Borohydride | Quenches autofluorescence caused by aldehyde fixatives [14]. | Treatment of formalin-fixed whole-mount embryos before staining. |
| Sudan Black B | Reduces autofluorescence from lipofuscin and other lipopigments [14]. | Quenching background in mature tissue samples or long-term cultures. |
| Ethyl Cinnamate (ECi) | A non-hazardous optical clearing agent that renders tissues transparent for deep imaging [16]. | Clearing whole organs or large embryos for light-sheet microscopy (LSFM). |
| Glycerol-based Mounting Medium | A simple and effective aqueous mounting medium that provides refractive index matching [15]. | Routine clearing of whole-mount gastruloids or embryos for confocal or two-photon imaging. |
| Phenol Red-Free Medium | Eliminates fluorescence from the pH indicator phenol red in live-cell imaging [13]. | Live imaging of embryo cultures to reduce background from the medium. |
| Far-Red Dyes (e.g., Cy5.5) | Fluorophores whose emission is in the far-red spectrum, where biological autofluorescence is minimal [13]. | Multiplex labeling to avoid the strong autofluorescence in the blue/green spectrum. |
Advanced Techniques for Signal Discrimination
When standard methods are insufficient, these advanced technologies can separate specific signals from autofluorescence based on properties other than color.
Fluorescence Lifetime Imaging (FLIM)
This technique discriminates fluorophores based on their fluorescence decay time (lifetime), which is typically different for autofluorescence and modern synthetic dyes [13] [12].
Application Example: A study successfully used FLIM to distinguish a Cy5.5-labeled antibody bound to a pancreatic tumor from autofluorescence in the gastrointestinal tract, allowing clear visualization of the specific signal [12].
Two-Photon Microscopy
This technique uses near-infrared (NIR) pulsed lasers for excitation. NIR light scatters less in biological tissues, enabling deeper imaging. More importantly, fluorescence is only generated at the focal point, virtually eliminating out-of-focus background fluorescence and dramatically improving image contrast at depth [17] [15].
Key Advantage: Two-photon microscopy has been shown to improve contrast at depth by approximately 2x and restore volumetric resolving power by more than 2x compared to one-photon linear excitation in multicellular specimens [17].
The Role of Lipids and Proteins in Light Scattering and Signal Interference
In the field of whole mount embryo imaging, light scattering caused by lipids and proteins presents a significant challenge for researchers seeking high-quality data. Biological tissues inherently scatter light due to the refractive index mismatches between their components, particularly lipids and proteins, and the surrounding aqueous environment. This scattering phenomenon severely limits imaging depth and resolution, while autofluorescence from endogenous biomolecules creates background signal that interferes with specific fluorescent labels. Understanding these fundamental principles is crucial for developing effective strategies to mitigate these issues in embryo research.
The composition and organization of lipids and proteins directly influence their light-scattering properties. Lipid membranes, lipid droplets, and protein aggregates all act as scattering centers within biological samples. Simultaneously, numerous cellular components, including certain proteins and metabolic cofactors, exhibit natural autofluorescence when excited by light, creating background noise that can obscure specific signals from fluorescent labels used in experiments. Recent advances in optical clearing techniques and label-free imaging methods have provided powerful tools to address these challenges, enabling researchers to obtain clearer data from deep within intact embryo samples.
Experimental Protocols for Reducing Autofluorescence and Scattering
3D-LIMPID-FISH Protocol for Whole-Mount Embryo Imaging
The 3D-LIMPID-FISH technique offers a streamlined approach for reducing light scattering and autofluorescence in whole-mount embryo samples while preserving RNA fluorescence in situ hybridization (FISH) signals. This method utilizes a hydrophilic clearing solution that matches the refractive index of the tissue, effectively reducing light scattering without removing lipids, thereby preserving tissue integrity and compatibility with lipophilic dyes [1].
Workflow Overview:
- Sample Extraction: Collect embryo specimens using standard dissection protocols
- Fixation: Immerse samples in appropriate fixative (e.g., 4% PFA) to preserve tissue architecture
- Bleaching: Treat with H₂O₂ to reduce intrinsic autofluorescence (optional, depending on signal requirements)
- Staining: Apply FISH probes and/or immunohistochemistry labels
- Clearing: Immerse samples in LIMPID solution for refractive index matching
The LIMPID clearing solution consists of saline-sodium citrate, urea, and iohexol, which can be adjusted to fine-tune the refractive index to match that of high numerical aperture objective lenses (typically 1.515) [1]. This adjustment minimizes spherical aberrations and significantly improves image quality throughout thick tissue samples. The protocol includes strategic stopping points after delipidation or amplification steps where tissues can be temporarily stored in cold conditions, though imaging within one week of amplification is recommended for optimal signal preservation [1].
Evanescent Light-Scattering Microscopy for Protein Binding Studies
For researchers investigating protein-nanoparticle interactions, evanescent waveguide microscopy provides a label-free method to temporally resolve specific protein binding to individual lipid vesicles, completely avoiding signal from nonspecific protein binding to the surrounding surface [18]. This approach is particularly valuable for studying protein corona formation on nanoparticles in biological environments.
Key Experimental Steps:
- Sample Preparation: Tether lipid vesicles (∼100 nm) to waveguide surface via cholesterol-modified DNA
- Live Monitoring: Observe binding of individual vesicles using scattering intensities
- Protein Exposure: Introduce target proteins while simultaneously recording scattering and fluorescence signals
- Signal Analysis: Translate protein-induced changes in light-scattering intensity into bound mass
The theoretical model for interpreting measurements calculates the protein layer thickness (Δd) from the ratio of scattering intensity increments, which can then be related to surface mass concentration (Γ) using de Feijter's formula [18]. This approach has demonstrated the ability to detect binding of approximately 800 streptavidin molecules and 350 antibiotin antibodies to individual lipid vesicles, providing quantitative information about binding kinetics without fluorescent labeling requirements [18].
Troubleshooting Guides and FAQs
Frequently Asked Questions
Q: What is the primary cause of background signal in whole mount embryo imaging? A: Background signal primarily stems from two sources: (1) light scattering due to refractive index mismatches between cellular components (especially lipids and proteins) and the aqueous environment, and (2) autofluorescence from endogenous biomolecules including certain proteins and metabolic cofactors [1] [19].
Q: How does the LIMPID method reduce scattering while preserving fluorescence signals? A: LIMPID uses a hydrophilic clearing solution containing iohexol to match the refractive index of the tissue to the imaging medium. This reduces scattering without removing lipids, thereby preserving tissue structure and maintaining the integrity of fluorescent labels including FISH probes and antibodies [1].
Q: Can I study protein-lipid interactions without fluorescent labels? A: Yes, evanescent light-scattering microscopy enables label-free investigation of protein binding to lipid vesicles by detecting changes in scattering intensity upon protein adsorption. This method translates scattering variations into quantitative bound mass measurements [18].
Q: What are the advantages of light-sheet microscopy for embryo imaging? A: Light-sheet microscopy illuminates only one plane of the sample at a time while recording fluorescence orthogonally, minimizing overall light exposure and reducing phototoxicity. This allows for longer imaging sessions of live embryos with reduced background signal [19].
Troubleshooting Common Experimental Issues
Table: Troubleshooting Guide for Autofluorescence and Scattering Problems
| Problem | Possible Cause | Solution |
|---|---|---|
| High background autofluorescence | Inherent tissue autofluorescence from proteins and metabolic cofactors | Apply chemical bleaching with H₂O₂ treatment during sample preparation [1] |
| Poor imaging depth | Light scattering from lipid membranes and protein structures | Use refractive index matching with LIMPID solution; adjust iohexol concentration for specific tissues [1] |
| Weak specific signal | Signal filtration effect in thick tissues; probe penetration issues | Use shorter oligonucleotide FISH probes (25-50 base pairs) for better tissue penetration [1] |
| Non-specific binding in protein studies | Protein adsorption to surfaces rather than target nanoparticles | Employ surface functionalization with PLL-g-PEG; use single-particle analysis to exclude background [18] |
| Photobleaching during time-lapse | Excessive light exposure during imaging | Implement light-sheet microscopy to reduce overall light dose; optimize exposure settings [19] |
Research Reagent Solutions
Table: Essential Reagents for Managing Scattering and Autofluorescence
| Reagent | Function | Application Notes |
|---|---|---|
| Iohexol | Refractive index matching agent | Adjust concentration (20-40%) to fine-tune RI (1.42-1.515) for specific tissues [1] |
| PLL-g-PEG | Surface passivation polymer | Reduces nonspecific protein binding in single-vesicle binding studies [18] |
| H₂O₂ | Chemical bleaching agent | Reduces autofluorescence; concentration and timing require optimization for different tissues [1] |
| Urea | Hydrophilic clearing component | Part of LIMPID solution; helps in refractive index matching [1] |
| Saline-sodium citrate | Buffer component | Maintains pH and ionic strength in LIMPID clearing solution [1] |
| Cholesterol-modified DNA | Vesicle tethering molecule | Anchors lipid vesicles to surfaces for single-particle binding studies [18] |
Table: Measurable Parameters in Light Scattering and Interference Studies
| Parameter | Typical Values | Experimental Significance |
|---|---|---|
| Protein layer thickness on vesicles | 1.57 ± 0.16 nm (streptavidin), 1.74 ± 0.6 nm (antibiotin) | Quantifies protein adsorption to lipid membranes [18] |
| Surface mass concentration | 225 ± 23 ng/cm² (streptavidin), 249 ± 86 ng/cm² (antibiotin) | Measures protein binding density [18] |
| Molecules per vesicle | 838 ± 86 (streptavidin), 346 ± 119 (antibiotin) | Relates scattering changes to molecular counts [18] |
| Light exposure dose | <50 J·cm⁻² (safe), 16 J·cm⁻² and 8 J·cm⁻² (optimal) | Maintains embryo viability during metabolic imaging [19] |
| Refractive index adjustment | 1.42 to 1.515 (via iohexol concentration) | Optimizes clarity for different objective lenses [1] |
Signaling Pathways and Experimental Workflows
Workflow for 3D-LIMPID-FISH Method
Mechanisms of Signal Interference and Solutions
Practical Techniques for Autofluorescence Reduction and Signal Preservation
In whole mount embryo research, autofluorescence (AF) poses a significant challenge for fluorescence-based techniques, as it can obscure specific signals from fluorescent labels, compromising data accuracy. AF arises from endogenous fluorophores present in biological samples and from fixatives like formaldehyde used in sample preparation. Chemical quenching agents suppress this unwanted background fluorescence by chemically modifying or masking these fluorescent compounds. For researchers working with delicate embryo samples, selecting the appropriate quenching agent is crucial for achieving optimal signal-to-noise ratios without compromising sample integrity or antigenicity. This guide provides a comprehensive comparison of four chemical quenching agents—TrueBlack, Sudan Black B, TrueVIEW, and Glycine—to help you select and optimize the best agent for your embryonic research applications.
Research Reagent Solutions: Key Materials and Their Functions
The following table details essential reagents used for autofluorescence quenching in fluorescent imaging workflows.
Table 1: Key Research Reagents for Autofluorescence Quenching
| Reagent Name | Function/Application | Key Characteristics |
|---|---|---|
| TrueBlack | Lipofuscin autofluorescence quencher; used for fixed tissues and whole mounts [20]. | Commercial formulation; effective on aldehyde-fixed samples; often used in cardiac and neural tissues [20]. |
| Sudan Black B (SBB) | Histochemical dye used to suppress broad-spectrum autofluorescence in fixed tissues [20]. | Requires solution in 70% ethanol [20]; effective on various tissues, including myocardium and bone marrow [20]. |
| TrueVIEW | Commercial autofluorescence quenching solution [20]. | Ready-to-use solution; quenching mechanism similar to SBB [20]. |
| Glycine | Quenches reactions of free or protein-conjugated aldehydes from formaldehyde fixation [20]. | Simple amino acid solution; commonly used in buffer-based protocols to reduce fixative-induced fluorescence [20]. |
| Sodium Borohydride (NaBH₄) | Reduces Schiff bases formed during aldehyde fixation [20]. | Can increase AF in some myocardial structures, potentially acting as an AF enhancer [20]. |
| Paraformaldehyde (PFA) | Common fixative for tissue and embryo preservation. | Causes fluorescent cross-links, contributing to background autofluorescence [21] [20]. |
| Tomato Lectin | Lectin used for immersion-based labeling of microvasculature in tissue imaging [21]. | Used as a fluorescent vascular label in conjunction with clearing and potential quenching protocols [21]. |
| CUBIC Reagents | Tissue clearing cocktails for improving light penetration in 3D imaging [21]. | Used to clear whole organs and tissues; protocol optimization includes delipidation and quenching steps [21]. |
Comparative Performance Data of Quenching Agents
Selecting the right agent requires a clear understanding of their relative performance. The following data, synthesized from comparative studies, provides a foundation for this decision.
Table 2: Quantitative Comparison of Quenching Agent Performance in Formaldehyde-Fixed Samples
| Quenching Agent | Reported Concentration | Relative Effectiveness | Key Findings and Considerations |
|---|---|---|---|
| TrueBlack | As per mfgr. protocol (Biotium) [20]. | High | Excellent at preserving immunofluorescence (IF) labeling signal while suppressing AF [20]. May show trends of reduced imaging depth in some cleared tissues [21]. |
| Sudan Black B (SBB) | 0.3% in 70% ethanol [20]. | High | Outperforms other reagents, including TrueBlack, in quenching major autofluorescent structures in myocardial tissue [20]. A trend of reduced imaging depth was noted in cleared myocardial tissue [21]. |
| TrueVIEW | As per mfgr. protocol (Vector Labs) [20]. | Moderate | Does not significantly impact Signal-to-Noise Ratio (SNR) in some models; showed potential for improved SNR and imaging depth in immersion-based protocols [21]. |
| Glycine | 0.3 M in aqueous solution [20]. | Lower | Does not significantly impact SNR [21]; its performance is generally lower compared to SBB and TrueBlack in quantitative evaluations [20]. |
Experimental Protocols for Agent Application
Standard Post-Staining Quenching Protocol for Fixed Whole Mount Embryos
This protocol is adapted for whole mount embryo samples after immunofluorescence (IF) or fluorescence in situ hybridization (FISH) staining is complete and uses detergent-containing buffers.
- Preparation: Freshly prepare the chosen quenching solution. For SBB, prepare a 0.3% (w/v) solution in 70% ethanol. For TrueBlack or TrueVIEW, follow the manufacturer's dilution instructions.
- Quenching Incubation: Apply the quenching solution to your stained and washed whole mount embryo samples. Ensure the sample is fully immersed.
- Incubation: Incubate the samples in the dark at room temperature. A typical incubation time is 20-30 minutes. Optimization may be required for different embryo stages or fixation levels.
- Washing: Thoroughly wash the samples multiple times with a wash buffer containing a detergent like Triton X-100 (e.g., PBS with 0.1% Triton X-100) to remove all residual quenching agent.
- Mounting: Mount the samples in an appropriate mounting medium for imaging [20].
Alternative Pre-Treatment Quenching Protocol
This protocol applies the quenching agent before any immunostaining steps and uses detergent-free buffers.
- Sample Preparation: Start with fixed and permeabilized whole mount embryos.
- Quenching: Treat the samples with the quenching agent (e.g., Glycine, TrueVIEW) as described in the protocol above.
- Washing: Wash the samples thoroughly with a detergent-free buffer, such as PBS.
- Staining: Proceed with your standard IF or FISH staining protocol, ensuring all subsequent buffers (blocking, antibody dilution, washing) do not contain detergents [20].
Integrated Photochemical and Chemical Quenching for Embryos (OMAR Protocol)
For challenging embryonic samples, combining photobleaching with chemical quenching can yield superior results. The following workflow, based on the OMAR (Oxidation-Mediated Autofluorescence Reduction) method, outlines this integrated approach.
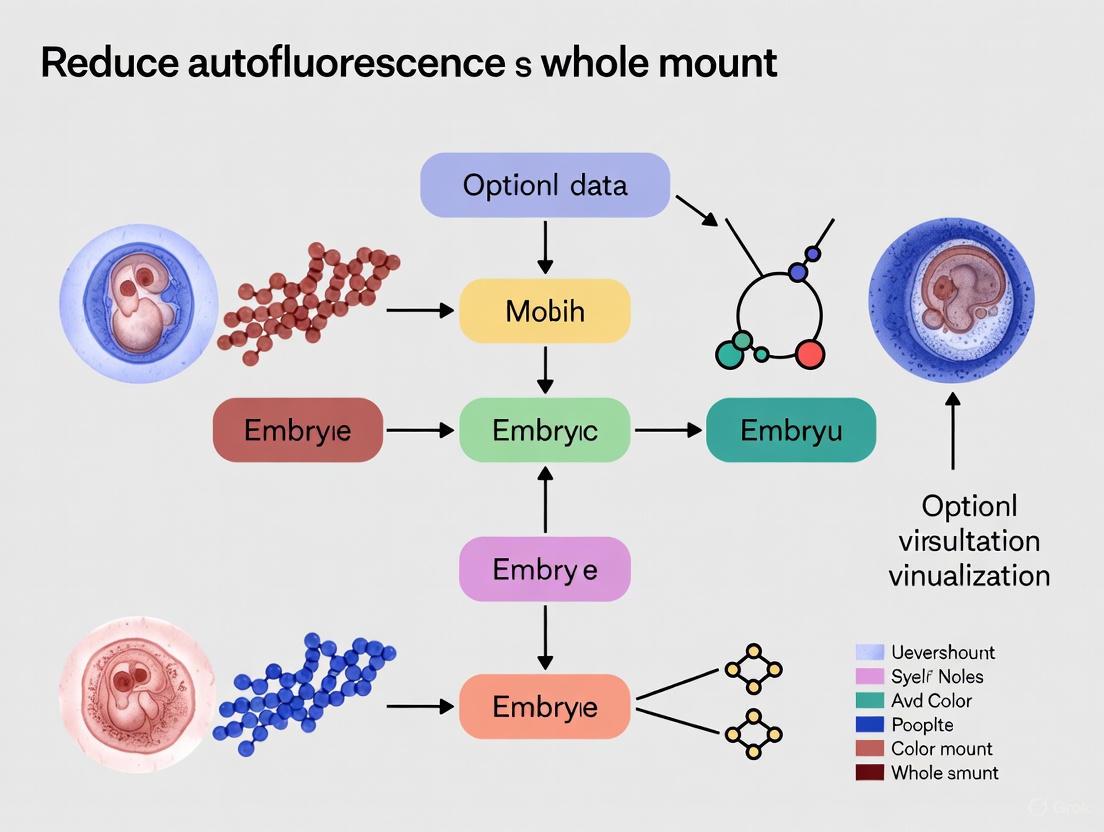
Diagram Title: Whole Mount Embryo Autofluorescence Reduction Workflow
Protocol Steps:
- Embryo Collection and Fixation: Collect embryos at the desired developmental stage and fix them immediately using standard methods (e.g., with 4% PFA) [22].
- OMAR Photobleaching: Subject the fixed embryos to a high-intensity cold white light source (e.g., high-power LED spotlights or 20,000 lumen LED panels) while immersed in a hydrogen peroxide solution. Successful oxidation is indicated by the appearance of bubbles in the solution. This step significantly reduces tissue and blood vessel autofluorescence prior to any labeling [22].
- Detergent-based Permeabilization: Permeabilize the embryos using a detergent like Tween 20 or Triton X-100 to facilitate probe penetration [22].
- Optional Chemical Quenching: For samples with persistent AF, apply a chemical quenching agent like TrueBlack or Sudan Black B using the standard protocol above. This step can be performed after permeabilization and before FISH/IF, or after staining [22] [20].
- RNA-FISH or Immunofluorescence: Perform your fluorescent labeling, such as Whole-mount Hybridization Chain Reaction (HCR) RNA-FISH or standard IF [22].
- Optical Clearing (Optional): For deep-tissue imaging, clear the embryos using optical clearing techniques like CUBIC to improve light penetration and enable 3D reconstruction [21] [22].
- Image Acquisition and Analysis: Proceed with 2D or 3D image analysis. The combined treatments alleviate the need for extensive digital post-processing to remove autofluorescence [22].
Troubleshooting FAQs
Q1: I am working with formaldehyde-fixed whole mount embryos. Which quenching agent should I choose for the best signal-to-noise ratio?
For the strongest suppression of general autofluorescence in fixed samples, Sudan Black B (SBB) is often the most effective agent, as it has been shown to outperform other reagents in quenching major autofluorescent structures [20]. However, if preserving the maximum intensity of your specific immunofluorescence (IF) signal is the highest priority, TrueBlack may be a better choice, as it excels in this area while still providing good AF reduction [20]. It is critical to test both agents on a subset of your specific embryo type.
Q2: After applying a quenching agent, my specific fluorescent signal has decreased significantly. What went wrong?
This is typically caused by over-quenching. To resolve this:
- Titrate the agent: Reduce the concentration of the quenching agent or shorten the incubation time.
- Re-optimize staining: You may need to increase the concentration of your primary or secondary antibodies to compensate for the quenching step.
- Confirm protocol order: If using SBB or TrueBlack post-staining, ensure you are not using detergents in your wash buffers after the quenching step, as detergents can wash away the agent and reduce its efficacy [20].
Q3: Can I use these quenching agents for live-cell imaging of embryos?
No. Chemical quenching agents like TrueBlack, SBB, TrueVIEW, and Glycine are intended for use in fixed (non-viable) samples. Applying these chemicals to live embryos will likely be cytotoxic and compromise their viability and development.
Q4: Does chemical quenching affect the structural integrity or mechanical properties of my samples?
A study on decellularized plant scaffolds showed that treatment with quenching agents like copper sulfate did not significantly change the tensile strength or elastic modulus of the scaffolds [23]. While direct data for embryonic tissues is limited, these findings suggest that properly applied chemical quenching does not typically alter mechanical integrity. However, agent-specific effects on viability for subsequently seeded cells have been noted in other models, reinforcing that these are for fixed samples [23].
Q5: What are the advanced, non-chemical methods for reducing autofluorescence?
If chemical methods are insufficient, consider these advanced strategies:
- Photobleaching: Using high-intensity light (like the OMAR protocol) to oxidize and bleach fluorophores prior to staining [22] [24].
- Spectral Unmixing: Using a microscope with spectral detection to separate the distinct emission spectrum of your fluorophore from the background autofluorescence [13].
- Time-Gated Imaging (FLIM): Using long-lifetime fluorescent probes (e.g., azadioxatriangulenium dyes) and delaying detection to exclude the shorter-lived autofluorescence signal [25] [13]. This is highly effective but requires specialized equipment and reagents.
- Using Far-Red Dyes: Choosing fluorophores that emit in the far-red spectrum, where biological autofluorescence is naturally minimal [13].
Tissue clearing techniques are indispensable for modern biomedical research, enabling high-resolution three-dimensional imaging of intact biological specimens. By rendering tissues transparent, these methods allow scientists to visualize structures deep within samples without physical sectioning, preserving critical spatial context. For research focused on reducing autofluorescence in whole mount embryo samples, selecting and properly implementing an appropriate clearing protocol is a critical step. This technical support center focuses on two prominent methods—CUBIC and LIMPID—providing detailed troubleshooting guides, frequently asked questions, and experimental protocols to support your research objectives.
Frequently Asked Questions (FAQs)
What are the fundamental differences between CUBIC and LIMPID clearing methods? CUBIC (Clear, Unobstructed Brain/Body Imaging Cocktails) is a hydrophilic, aqueous-based method that actively removes both lipids and light-absorbing chromophores before refractive index (RI) matching [26]. This process often leads to tissue expansion. In contrast, LIMPID (Lipid-preserving refractive index matching for prolonged imaging depth) is a single-step aqueous clearing technique that preserves most lipids while matching RI through immersion in a solution containing saline-sodium citrate, urea, and iohexol, minimizing tissue swelling and shrinking [1].
Which method is more compatible with RNA fluorescence in situ hybridization (FISH)? LIMPID has demonstrated excellent compatibility with RNA FISH imaging, including when using hybridization chain reaction (HCR) probes for high-sensitivity RNA detection [1]. Its mild aqueous conditions help preserve RNA integrity and probe binding capability, making it particularly suitable for gene expression mapping in whole-mount samples.
How do I choose between CUBIC and LIMPID for whole mount embryo samples? The choice depends on your experimental goals. If your research requires lipid removal or you're working with tissues high in light-absorbing pigments like heme, CUBIC may be more effective [26] [21]. If you need to preserve lipids for studies with lipophilic dyes, maintain native tissue architecture with minimal swelling/shrinking, or perform RNA FISH, LIMPID is likely the better option [1]. For embryo samples specifically, CUBIC has been successfully applied to whole mouse embryos [26].
Can these methods be combined with immunostaining? Both methods are compatible with immunostaining, though with different considerations. CUBIC protocols support immunostaining, with the delipidation step potentially enhancing antibody penetration [26]. LIMPID also works well with immunostaining while preserving lipid structures, allowing for simultaneous protein and RNA visualization [1].
Troubleshooting Guides
Common Issues with CUBIC Protocol
Problem: Incomplete Clearing
- Potential Cause: Insufficient delipidation or inadequate refractive index matching.
- Solution: Extend incubation time in CUBIC reagent R1 (delipidation solution). For dense tissues, consider increasing solution volume to tissue ratio or agitating samples during incubation. Verify that the CUBIC R2 (refractive index matching solution) is fresh and properly prepared [26].
Problem: Excessive Tissue Expansion
- Potential Cause: Natural property of hyper-hydrating aqueous clearing methods.
- Solution: Account for expansion during experimental planning and imaging. For fragile samples, consider the CUBIC-f variant, which was specifically optimized for fragile tissues like embryonic brains and reduces deformation [27].
Problem: High Autofluorescence Background
- Potential Cause: Native tissue fluorophores or aldehyde-induced fluorescence from fixation.
- Solution: Incorporate bleaching steps with hydrogen peroxide or use autofluorescence quenchers. TrueBlack and Sudan Black B may reduce imaging depth, while TrueVIEW and Glycine show potential for improved signal-to-noise ratio without significantly compromising depth [21].
Common Issues with LIMPID Protocol
Problem: Slow Clearing Speed
- Potential Cause: Passive diffusion-based nature of the protocol.
- Solution: Ensure tissue size is appropriate (<500μm for optimal results). Agitate samples gently during incubation. The protocol can be stopped after delipidation or amplification steps by storing tissues in cold storage [1].
Problem: Bubbles in Cleared Tissue
- Potential Cause: Air introduced during solution changes or from chemical degradation.
- Solution: Degas solutions before use or allow them to settle. Handle tissues gently during solution transfers to minimize bubble formation [1].
Problem: Suboptimal Resolution at Depth
- Potential Cause: Refractive index mismatch with microscope objective.
- Solution: Fine-tune the refractive index of LIMPID solution by adjusting the iohexol concentration to match your objective lens (typically RI ~1.515 for high-NA oil immersion objectives) [1].
Quantitative Comparison of Tissue Clearing Performance
Table 1: Performance Characteristics of CUBIC and LIMPID Clearing Methods
| Parameter | CUBIC | LIMPID |
|---|---|---|
| Clearing Mechanism | Lipid & chromophore removal + RI matching [26] | Lipid-preserving RI matching [1] |
| Protocol Duration | Days [28] | Single-step, relatively fast [1] |
| Tissue Morphology | Expansion [28] | Minimal swelling/shrinking [1] |
| Lipid Compatibility | Removes lipids | Preserves lipids |
| Immunostaining | Compatible [26] | Compatible [1] |
| RNA FISH | Limited data | Highly compatible [1] |
| Refractive Index | ~1.47 [28] | Adjustable (~1.515) [1] |
| Best For | Tissues requiring delipidation; heme-rich tissues [26] [21] | Lipid studies; RNA FISH; maintaining native structure [1] |
Table 2: Autofluorescence Quenching Agents and Performance in Cleared Tissues
| Quenching Agent | Impact on SNR | Effect on Imaging Depth | Compatibility with CUBIC/LIMPID |
|---|---|---|---|
| TrueBlack | Improves surface SNR [21] | Reduces depth [21] | Test empirically |
| Sudan Black B | Improves surface SNR [21] | Reduces depth [21] | Test empirically |
| TrueVIEW | No significant negative impact [21] | Minimal negative impact [21] | Likely compatible |
| Glycine | No significant negative impact [21] | Minimal negative impact [21] | Likely compatible |
| Hydrogen Peroxide | Reduces heme-based autofluorescence [21] | Protocol-dependent | Compatible with both |
| Sodium Borohydride | Reduces aldehyde-induced fluorescence [29] | Minimal impact | Compatible with both |
Experimental Protocols
CUBIC Protocol for Whole Mount Embryo Samples
Materials Needed:
- CUBIC Reagent 1 (contains urea and detergents for delipidation)
- CUBIC Reagent 2 (contains urea and amines for refractive index matching)
- PBS with 0.1% Sodium Azide
- 4% Paraformaldehyde (PFA)
- Hydrogel (optional for fragile samples)
Procedure:
- Fixation: Immerse embryo samples in three volumes of 4% PFA and store at 4°C for 24 hours [26].
- Optional Hydrogel Embedding: For fragile embryos, immerse in hydrogel solution overnight at 4°C, then polymerize at 37°C for 4-6 hours [26].
- Delipidation: Incubate samples in CUBIC Reagent 1 at 37°C with gentle agitation. For embryo samples, 24-hour incubation is typically sufficient [26] [21].
- Washing: Rinse samples in PBS with 0.1% sodium azide to remove residual delipidation solution.
- Refractive Index Matching: Transfer samples to CUBIC Reagent 2 and incubate at 37°C until transparent (typically 1-2 days) [26].
- Imaging: Mount samples in CUBIC Reagent 2 for imaging with appropriate microscopy techniques.
LIMPID Protocol for Whole Mount Embryo Samples
Materials Needed:
- LIMPID solution (containing saline-sodium citrate, urea, and iohexol)
- Phosphate-buffered saline (PBS)
- 4% Paraformaldehyde (PFA)
- Hydrogen peroxide (optional, for bleaching)
Procedure:
- Fixation: Fix embryo samples in 4% PFA at 4°C for 24 hours [1].
- Optional Bleaching: If autofluorescence is problematic, bleach tissues in hydrogen peroxide to reduce background [1].
- Staining: Perform immunostaining or FISH probe hybridization according to standard protocols.
- Clearing: Transfer samples directly to LIMPID solution. The clearing occurs in a single step through passive diffusion [1].
- RI Adjustment: Fine-tune the refractive index by adjusting iohexol concentration based on the calibration curve to match your microscope objective (target RI ~1.515 for oil objectives) [1].
- Imaging: Image samples within one week of amplification for optimal signal preservation [1].
Workflow Diagrams
CUBIC Method Workflow
LIMPID Method Workflow
Research Reagent Solutions
Table 3: Essential Reagents for Tissue Clearing Protocols
| Reagent | Function | Protocol Compatibility |
|---|---|---|
| Paraformaldehyde (PFA) | Tissue fixation | CUBIC & LIMPID [26] [1] |
| Urea-based Solutions | Hyper-hydration and delipidation | CUBIC [26] |
| Amino Alcohols | Refractive index matching and heme removal | CUBIC [26] |
| Iohexol | Refractive index matching | LIMPID [1] |
| Saline-Sodium Citrate (SSC) | Buffer component | LIMPID [1] |
| Hydrogel Monomers | Tissue scaffolding for fragile samples | CUBIC (optional) [26] |
| SDS Detergents | Lipid removal | CUBIC [26] |
| Hydrogen Peroxide | Bleaching for autofluorescence reduction | CUBIC & LIMPID [1] [21] |
What is the core principle behind integrating quenching with clearing in a single workflow? This integrated protocol is designed to maximize signal-to-noise ratio (SNR) and imaging depth in whole-mount embryo samples by sequentially addressing the two major barriers to quality 3D imaging: natural tissue autofluorescence and light scattering. The workflow first quench autofluorescent pigments inherent in embryonic tissues, particularly heme and lipofuscin, then clear the tissue to homogenize its refractive index. This systematic approach preserves the integrity of fluorescent labels while enabling high-resolution visualization of deep structures. Research demonstrates that improper sequencing of these steps—particularly applying quenching agents after clearing—can significantly diminish imaging depth due to interaction with clearing reagents [21].
Below is a logical flow diagram of the key decision points in the integrated workflow:
Detailed Experimental Protocols
Protocol 1: Oxidation-Mediated Autofluorescence Quenching for Embryos
This protocol is optimized for whole-mount mouse embryos and adapts approaches from successful oxidation-mediated reduction techniques [4].
Step 1: Sample Preparation
- Harvest embryos at desired developmental stages and fix immediately in 4% paraformaldehyde (PFA) for 24 hours at 4°C.
- Note: Over-fixation can increase autofluorescence; 24 hours is optimal for E10.5-E14.5 mouse embryos.
- Wash samples 3× in phosphate-buffered saline (PBS) for 15 minutes each to remove residual PFA.
Step 2: Quenching Solution Application
- Prepare quenching solution: 0.3% hydrogen peroxide (H₂O₂) in PBS.
- Submerge embryos completely in quenching solution and incubate for 48-72 hours at 4°C in the dark.
- For heavily pigmented tissues, consider increasing H₂O₂ concentration to 0.5% but monitor for potential epitope damage.
Step 3: Post-Quenching Processing
- Rinse embryos 3× in PBS for 20 minutes each.
- Proceed immediately to clearing or store in PBS at 4°C for up to 1 week.
Protocol 2: Integrated Immersion-Based Clearing with CUBIC
This protocol combines quenching with the CUBIC (Clear, Unobstructed Brain/Body Imaging Cocktails and Computational analysis) method, optimized for myocardial tissues [21].
Step 1: Pre-Clearing Preparation
- Following quenching, transfer embryos to CUBIC Reagent 1.
- Incubate with gentle agitation at room temperature for 12-24 hours.
- Optimal delipidation is achieved at 24 hours for embryonic cardiac tissues.
Step 2: Refractive Index Matching
- Prepare CUBIC Reagent 2 according to standard formulations.
- Transfer samples to Reagent 2 and incubate for 24-48 hours until transparent.
- For embryonic tissues beyond E12.5, extended incubation up to 72 hours may be necessary.
Step 3: Mounting for Imaging
- Mount cleared embryos in fresh CUBIC Reagent 2 for imaging.
- For long-term storage, seal samples and store at 4°C in the dark.
Troubleshooting Guide: Frequently Asked Questions
FAQ 1: Why did my imaging depth decrease after using TrueBlack or Sudan Black B quenching agents? Some lipofuscin-targeting quenching agents, including TrueBlack and Sudan Black B, have demonstrated trends of reduced imaging depth in cleared tissues despite improving SNR at superficial layers [21]. This occurs because these compounds may interact with clearing reagents or slightly alter the tissue's refractive index properties. For deep imaging applications, consider alternative quenchers like TrueVIEW or Glycine, which showed better compatibility with depth penetration in myocardial studies [21].
FAQ 2: How do I determine the optimal quenching duration for my specific embryo stage? The optimal quenching duration depends on embryo age, fixation time, and endogenous pigment content. The provided protocol offers a baseline of 48-72 hours for mouse embryos [4]. Conduct test samples with varying quenching times (24, 48, 72 hours) and quantify background fluorescence versus specific signal retention. For later-stage embryos with increased hemoglobin, extended quenching may be necessary.
FAQ 3: My tissue isn't clearing properly after quenching. What could be wrong? Incomplete clearing after quenching typically indicates one of three issues:
- Insufficient delipidation - Extend CUBIC Reagent 1 incubation time by 12-hour increments.
- Residual quenching reagents - Ensure thorough washing (3×20 minutes) between quenching and clearing steps.
- Tissue over-fixation - Limit PFA fixation to 24 hours maximum for embryos.
FAQ 4: Can I use this workflow with RNA fluorescence in situ hybridization (FISH)? Yes, the principles are compatible with FISH imaging. The 3D-LIMPID-FISH protocol demonstrates that aqueous clearing methods preserve RNA integrity and FISH probe binding [1]. However, test quenching conditions carefully, as strong oxidative treatments might damage RNA targets. For FISH applications, consider milder quenching agents like Glycine.
FAQ 5: What is the expected signal-to-noise ratio improvement with this integrated approach? Quantitative assessments show that optimized quenching and clearing can achieve SNR values sufficient for microvascular network analysis at depths up to 150μm [21]. The exact improvement is tissue-specific, with rat myocardial tissues typically showing higher SNRs than pig tissues in comparative studies [21].
Quantitative Data Comparison
Table 1: Performance Metrics of Different Quenching Agents in Cleared Myocardial Tissues
| Quenching Agent | Signal-to-Noise Ratio (SNR) | Relative Imaging Depth | Tissue Compatibility | Key Considerations |
|---|---|---|---|---|
| TrueBlack | High at surface, decreases with depth | Reduced vs. control | High autofluorescence tissues | Avoid for deep imaging; may limit penetration |
| Sudan Black B | High at surface, decreases with depth | Reduced vs. control | Lipofuscin-rich tissues | Similar limitations to TrueBlack |
| TrueVIEW | Moderate improvement | Maintained or slightly improved | General purpose | Good balance for most applications |
| Glycine | Moderate improvement | Maintained | Embryonic tissues | Suitable for FISH-compatible workflows |
| Hydrogen Peroxide | Significant improvement | Maintained | Whole-mount embryos | Oxidation-based; optimal for pre-clearing |
| No Quencher (Control) | Baseline | Reference level | All tissues | Control for comparison studies |
Table 2: CUBIC Clearing Optimization Parameters for Different Tissue Types
| Tissue Type | Optimal CUBIC Reagent 1 Time | Optimal CUBIC Reagent 2 Time | Achievable Imaging Depth | Special Notes |
|---|---|---|---|---|
| Mouse Embryo (E10.5-E12.5) | 12-18 hours | 24-36 hours | Up to 200μm | Thinner tissues require less clearing |
| Mouse Embryo (E13.5-E15.5) | 18-24 hours | 36-48 hours | 150-180μm | Increased pigment may require longer quenching |
| Rat Myocardial | 24 hours | 48 hours | Up to 150μm | Higher inherent SNR than pig tissues |
| Pig Myocardial | 24 hours | 48-72 hours | Up to 150μm | Larger animal models may need extended clearing |
Research Reagent Solutions
Table 3: Essential Materials for Integrated Quenching and Clearing Workflows
| Reagent/Category | Specific Examples | Function | Protocol Compatibility |
|---|---|---|---|
| Autofluorescence Quenchers | TrueBlack, Sudan Black B, TrueVIEW, Glycine, Hydrogen Peroxide | Reduce tissue intrinsic fluorescence | All protocols; agent selection depends on application |
| Aqueous Clearing Reagents | CUBIC, LIMPID | Homogenize refractive index, reduce light scattering | Whole-mount embryo and tissue sections |
| Hydrophobic Clearing Reagents | uDISCO, iDISCO | Organic solvent-based clearing | Compatible with some quenching agents |
| Vascular Labels | Tomato Lectin, FITC Dextran | Highlight endothelial and vascular networks | Immersion-based labeling for non-perfused samples |
| Molecular Labeling | HCR FISH Probes, Immunohistochemistry Antibodies | Target-specific RNA or protein detection | Maintains epitope/RNA integrity in cleared tissues |
| Refractive Index Matching | Iohexol, Urea, Sucrose | Adjust final RI for objective lens compatibility | Critical for high-NA objective performance |
Workflow Integration and Pathway
The following diagram illustrates the quenching mechanism at the molecular level:
Frequently Asked Questions (FAQs)
Q1: What are the main advantages of using label-free multispectral SPIM over traditional fluorescent staining?
Label-free multispectral SPIM offers several key advantages. It eliminates the need for fluorescent dyes, which are expensive and can induce alterations in natural metabolism. The technique is non-invasive, causes minimal phototoxicity, and allows for long-term monitoring of living samples. Furthermore, it enables the study of samples where genetic manipulation or staining is difficult or impossible, providing information from the sample's native state [30] [31].
Q2: My tissue samples have strong, confounding autofluorescence. What pre-treatment methods can reduce this?
For whole-mount samples like embryos, a highly effective method is Oxidation-Mediated Autofluorescence Reduction (OMAR). This protocol uses a high-intensity cold white light source (e.g., high-power LED spotlights or 20,000 lumen LED panels) in the presence of reagents to chemically reduce autofluorescence. Successful treatment is often indicated by the appearance of bubbles in the solution. This method significantly improves the signal-to-noise ratio for subsequent analysis without the need for digital post-processing [22].
Q3: Why is Principal Component Analysis (PCA) used in this context, and what does it achieve?
PCA is a mathematical tool used for spectral unmixing when no prior knowledge of fluorescence spectra is available, which is the case in label-free imaging. It analyzes the spectral data cube acquired from the sample and identifies new, orthogonal axes (Principal Components) that represent the highest variance in the data. Pixels with similar spectral signatures are projected onto the same axes, allowing for the effective separation and segmentation of different tissue types based solely on their unique autofluorescence fingerprints [30].
Q4: Can I identify specific cell types using autofluorescence alone?
Yes, advanced autofluorescence imaging can distinguish specific cell types by capitalizing on the endogenous signatures of metabolic cofactors like NAD(P)H and FAD. By marrying morphological characteristics with autofluorescence signatures, studies have successfully distinguished all seven epithelial cell types in mouse tracheal explants simultaneously and in real-time. This approach can sometimes be more reliable than cell type-specific markers, whose expression can be altered by injury or disease [32].
Troubleshooting Guides
Problem 1: Poor Signal-to-Noise Ratio or Weak Autofluorescence Signal
| Possible Cause | Solution | Related Reagents/Protocols |
|---|---|---|
| Suboptimal excitation wavelength | Test multiple laser lines (e.g., 402 nm, 490 nm, 532 nm) to find the one that best excites your sample's intrinsic fluorophores. | Laser lines (402 nm, 490 nm, 532 nm, 632 nm) [30] |
| Insufficient exposure time | Increase camera exposure time incrementally. For a mouse embryo sample, exposure times may be ~1 second per plane [30]. | |
| Photobleaching | Reduce laser power or exposure time. Ensure the system is calibrated to minimize unnecessary light exposure [33]. |
Problem 2: Spectral Overlap and Unclear Tissue Separation
| Possible Cause | Solution | Related Reagents/Protocols |
|---|---|---|
| Insufficient spectral bands | Increase the number of spectral bands acquired. Acquire images from a wider range of emission wavelengths (e.g., 425-730 nm in 5 nm steps) [30]. | Liquid Crystal Tunable Filter [30] |
| Background autofluorescence | Apply pre-imaging treatments like OMAR [22] or use analysis software with deep learning classifiers to identify and subtract background signal [34]. | Hydrogen Peroxide, SDS, Triton X-100 (for OMAR) [22] |
| Ineffective PCA separation | Verify that the number of principal components analyzed is appropriate for the true number of tissues present. Validate PCA results with known tissue landmarks [30] [31]. |
Problem 3: Challenges with 3D Imaging and Sample Penetration
| Possible Cause | Solution | Related Reagents/Protocols |
|---|---|---|
| Sample scattering | Use optical clearing agents to reduce light scattering. 2,2'-thiodiethanol (TDE) is an aqueous solution that preserves morphology and is low-cost and low-hazard [35]. | 2,2'-thiodiethanol (TDE) [35] |
| Fixed sample autofluorescence | If using fixed tissue, consider a different fixation method. Ethanol/methanol fixation decreases autofluorescence, whereas formalin fixation increases it [34]. | Ethanol, Methanol [34] |
The Scientist's Toolkit: Essential Research Reagents & Materials
The following table details key reagents and materials essential for implementing label-free multispectral SPIM with PCA.
| Item | Function/Application in the Protocol |
|---|---|
| Custom SPIM Setup | A microscope with multiple excitation lasers, a light-sheet generating system, and a detection path with a tunable filter for multispectral acquisition [30]. |
| Liquid Crystal Tunable Filter | Placed in the detection axis, this allows for precise, sequential filtering of specific emission wavelengths to build the spectral data cube [30]. |
| Motorized Translation & Rotation Stages | Enable precise 3D positioning and scanning of the sample for comprehensive volume imaging [30]. |
| 2,2'-Thiodiethanol (TDE) | An aqueous optical clearing agent that matches refractive indices within the tissue, increasing transparency and imaging depth while preserving native structure [35]. |
| OMAR Reagents | A suite of reagents including hydrogen peroxide used in a photochemical bleaching protocol to suppress inherent tissue autofluorescence prior to imaging [22]. |
| Principal Component Analysis (PCA) Software | Mathematical software (e.g., MATLAB) equipped with PCA tools for performing spectral unmixing and identifying distinct tissue types from the multispectral data [30]. |
Experimental Protocols & Workflows
Detailed Protocol: Multispectral Data Acquisition with SPIM
This protocol describes the key steps for acquiring multispectral autofluorescence data from a whole-mount mouse embryo sample, as detailed in the search results [30].
- Sample Preparation: Fix the E14.5 mouse embryo. For live samples, mount the specimen appropriately in a physiologic chamber.
- System Calibration: Calibrate the SPIM system, including the excitation lasers, galvanometer mirrors for light-sheet positioning, and the electrically tunable lens for optimal focus.
- Wavelength Selection: Manually select the excitation laser wavelength (e.g., 405 nm). Set the tunable filter to the starting emission wavelength (e.g., 425 nm), maintaining a 20 nm gap from the laser line to avoid excitation light.
- Spectral Scanning: Acquire a 2D image at the first emission wavelength. Sequentially step the tunable filter (e.g., in 5 nm increments) and acquire an image at each band until the final wavelength (e.g., 730 nm) is reached. This creates a stack of images for a single optical plane.
- 3D Volume Acquisition: Use the motorized stages or galvo mirrors to move the sample or light sheet to the next plane and repeat the spectral scanning process until the entire volume is captured.
- Data Pre-processing: Process the acquired images to correct for wavelength-dependent system response (e.g., filter transmission, camera efficiency) and remove background noise.
Workflow Diagram: From Sample to Segmentation
The following diagram illustrates the complete experimental and computational workflow for label-free tissue characterization using multispectral SPIM and PCA.
Workflow Diagram: OMAR Autofluorescence Reduction
This diagram outlines the steps for the OMAR protocol, a key method for reducing autofluorescence in whole-mount samples like embryos prior to imaging.
Optimizing Protocols and Troubleshooting Common Pitfalls for Superior SNR
This technical support guide addresses a critical and frequently encountered challenge in the use of CUBIC (Clear, Unobstructed Brain Imaging Cocktails and Computational Analysis) protocols for whole-mount embryo samples. Achieving optimal transparency is a cornerstone for high-quality three-dimensional imaging, and the incubation time in CUBIC Reagent I is a pivotal variable in this process. Framed within the context of research aimed at reducing autofluorescence, this document provides detailed troubleshooting guides and FAQs to help researchers, scientists, and drug development professionals navigate the optimization of their CUBIC Reagent I incubation for maximum clarity and minimal background signal.
Troubleshooting Guide: CUBIC Reagent I Incubation
Problem: Incomplete Tissue Clearing
- Question: My embryo sample remains opaque after the standard incubation period in CUBIC Reagent I. What factors should I investigate?
- Answer: Incomplete clearing often results from insufficient incubation time or reagent penetration. The "standard" time is tissue-dependent.
- Action 1: Extend Incubation Time Systematically. Do not rely on a single timepoint. The optimal clearing time varies significantly between different organs and sample sizes [36]. Monitor transparency every 24-48 hours. Agitate the sample gently on a shaker to ensure even reagent exposure.
- Action 2: Consider Physical Assistance. For larger or denser samples, research has shown that introducing ultrasound assistance can dramatically accelerate the clearing process. This method introduces high-frequency oscillations that enhance substance exchange between the tissue and the clearing reagent [36].
- Action 3: Verify Reagent Composition and Temperature. Ensure CUBIC Reagent I (typically containing urea, Quadrol, and Triton X-100) is freshly prepared and properly mixed. Incubation at 37°C, as used in established protocols, enhances clearing efficiency compared to room temperature [37].
Problem: Excessive Tissue Swelling or Deformation
- Question: After incubation in CUBIC Reagent I, my embryo sample is overly swollen and has lost its structural integrity. How can this be prevented?
- Answer: This issue arises from the hyper-hydrating and chaotropic properties of the reagents. Fixed and delipidated tissue behaves as an electrolyte gel, which swells under certain chemical conditions [38].
- Action 1: Optimize Incubation Time. Over-incubation is a common cause. Follow a time-course experiment to find the minimum time required for sufficient clarity, as prolonged exposure can exacerbate swelling.
- Action 2: Consider Alternative Formulations. For fragile samples such as embryos, a modified protocol like CUBIC-f has been developed. This method incorporates Omnipaque 350 for refractive index matching and is specifically optimized to conserve tissue integrity in delicate samples, resulting in less deformation than traditional CUBIC [27].
Problem: High Autofluorescence Persists After Clearing
- Question: My sample is clear, but high background autofluorescence is obscuring my target signal, which undermines my research goal. What can I do?
- Answer: While CUBIC Reagent I itself does not directly target pigments, its delipidation action can help. A dedicated decolorization step is often required.
- Action: Incorporate a Decolorization Cocktail. An optimized method known as CUBIC-Plus introduces a decolorizing reagent cocktail to remove pigments like heme. This step can be integrated into your workflow to achieve whole-organ 3D imaging with a high signal-to-noise ratio, which is crucial for reducing autofluorescence [36].
Frequently Asked Questions (FAQs)
FAQ 1: Is there a definitive incubation time for CUBIC Reagent I?
No. The optimal incubation time is highly dependent on the tissue type, size, age, and lipid content. Research has quantified the optimal clearing times for various mouse organs, demonstrating that a one-size-fits-all approach is not effective. The table below summarizes findings from a systematic study. Embryo samples, being smaller, may require less time, but the principle of empirical optimization remains the same.
Table 1: Organ-Specific Optimal Clearing Times with Advanced CUBIC
| Organ/Tissue | Optimal Clearing Time (Days) | Key Consideration |
|---|---|---|
| Lung, Ovary, Pancreas | 6 days | [36] |
| Mammary Gland, Stomach | 4 days | [36] |
| Liver, Spleen | 3 days | Heme-rich; benefits from decolorization [36] |
| Fragile Samples (e.g., Embryos) | Requires optimization | Use CUBIC-f protocol to minimize deformation [27] |
FAQ 2: How can I quantitatively track the clearing progress of my samples?
You can use the BTCi (Boxed Transparency Change index) to quantify tissue transparency. This method involves measuring transparency changes over time to identify the turning point in the time-profile, which represents the optimal clearing time for that specific sample [36].
FAQ 3: Can I combine immunofluorescence or FISH with the CUBIC protocol?
Yes. CUBIC has been successfully combined with immunofluorescence staining (IFS) and fluorescent in situ hybridization (FISH). The key is to perform the staining after the Reagent I clearing and washing steps, but before moving to the final refractive index matching with Reagent II. Long antibody incubation times (e.g., 24 hours) with shaking are often necessary for deep and uniform penetration into the cleared tissue [37] [1].
Experimental Optimization Workflow
The following diagram illustrates a systematic workflow for optimizing CUBIC Reagent I incubation, integrating the troubleshooting advice and FAQs above.
Diagram Title: Workflow for Optimizing CUBIC Reagent I Incubation
The Scientist's Toolkit: Key Research Reagent Solutions
Table 2: Essential Reagents and Materials for CUBIC Optimization
| Reagent/Material | Function in Protocol | Key Considerations |
|---|---|---|
| CUBIC Reagent I | Primary delipidation and initial clearing agent. Contains urea, Quadrol, and Triton X-100. | Fresh preparation is critical for efficacy. Incubation temperature and duration are key variables. |
| CUBIC Reagent II | Final refractive index matching solution for rendering tissue transparent. Contains urea, sucrose, and triethanolamine. | Required after Reagent I treatment and thorough washing. |
| Decolorization Cocktail (CUBIC-Plus) | Removes light-absorbing pigments (e.g., heme) to reduce autofluorescence. | Essential for pigment-rich tissues (liver, spleen) or when background signal is high. |
| Ultrasound Bath | Physical method to accelerate reagent penetration and clearing kinetics. | Can significantly shorten processing time for larger samples. |
| Shaker/Orbital Mixer | Provides consistent agitation during incubation. | Ensures even reagent exposure and prevents formation of concentration gradients. |
Troubleshooting Guides and FAQs
Troubleshooting Common Quenching Issues
Problem: Significant reduction in overall imaging depth after using a quenching agent.
- Potential Cause: The chemical properties of certain quenching agents, particularly lipophilic dyes like TrueBlack (TB) and Sudan Black B (SBB), may hinder the penetration of light or the clearing reagents themselves into the deeper layers of the tissue [21].
- Solution:
- Validate agent selection: Consider switching to alternative quenchers like TrueVIEW or Glycine, which, in some studies, showed trends of not significantly reducing imaging depth compared to controls [21].
- Optimize concentration and incubation time: High concentrations or prolonged incubation can exacerbate depth reduction. Titrate the agent to the minimum required concentration and time that still provides sufficient surface SNR improvement.
- Re-evaluate the need for quenching: If your signal of interest is strong enough, consider acquiring data without quenching and using digital background subtraction methods during image processing [39].
Problem: The desired immunofluorescence signal decreases along with the autofluorescence after quenching.
- Potential Cause: Quenching agents are often not perfectly specific to autofluorophores and can also quench the signal from your fluorophore-conjugated antibodies [39] [40].
- Solution:
- Antibody signal compensation: Plan to increase the concentration of your primary antibody or the camera exposure time during image acquisition to compensate for the expected signal loss [40].
- Agent compatibility check: Verify the compatibility of your specific fluorophores (e.g., Alexa Fluors, DyLight fluors) with the chosen quenching kit [40].
Problem: High background autofluorescence persists even after applying a quenching agent.
- Potential Cause 1: The type of autofluorescence in your sample (e.g., from lipofuscin, heme, or formalin-induced crosslinks) may be resistant to the specific quenching chemistry you are using [21] [40].
- Solution: Identify the source of autofluorescence. For heme-rich tissues like myocardium, some quenchers may be less effective. A method like fluorescence lifetime imaging microscopy (FLIM) can digitally separate stubborn autofluorescence from your specific signal [39].
- Potential Cause 2: Incomplete penetration of the quenching reagent into a thick whole-mount sample.
- Solution: Ensure adequate incubation time and consider mild agitation during the quenching step to improve reagent distribution.
Frequently Asked Questions (FAQs)
Q1: What is the fundamental trade-off when using chemical autofluorescence quenchers? The primary trade-off lies between achieving a high signal-to-noise ratio (SNR) at the tissue surface and preserving the ability to image deep into a specimen. While quenchers effectively reduce background noise, some can chemically limit the effective imaging depth, as they may attenuate the signal path or interfere with tissue clearing [21].
Q2: Are there quenching agents that do not reduce imaging depth? Research indicates that the impact on imaging depth varies by agent. In one study on myocardial tissue, TrueVIEW and Glycine did not show a significant negative impact on SNR values at depth compared to untreated controls, whereas TrueBlack and Sudan Black B showed a trend of reduced imaging depth [21]. The optimal agent depends on your specific tissue and experimental setup.
Q3: What are the alternatives to chemical quenching? A powerful digital alternative is Fluorescence Lifetime Imaging Microscopy (FLIM). This technique distinguishes specific fluorescence from autofluorescence based on the distinct lifetime decay profiles of the fluorophores, allowing for non-invasive, digital suppression of autofluorescence without the use of chemicals that can compromise depth [39].
Q4: How can I plan my experiment to account for this trade-off?
- If your analysis is primarily focused on surface or near-surface features, chemical quenching can significantly improve data quality.
- If imaging deep tissue structures is critical, prioritize depth-preserving agents like TrueVIEW or explore digital methods like FLIM.
- Always include a non-quenched control in your experimental design to directly assess the impact of quenching on your specific samples.
The table below summarizes experimental data from a study investigating various quenching agents in cleared myocardial tissue, highlighting the trade-off between signal-to-noise ratio and imaging depth [21].
Table 1: Comparison of Autofluorescence Quenching Agents in Cleared Myocardial Tissue
| Quenching Agent | Impact on Surface SNR | Impact on Imaging Depth | Key Findings & Considerations |
|---|---|---|---|
| TrueBlack | Improves surface SNR | Reduces imaging depth | Shows a clear trend of diminished depth penetration compared to control samples. |
| Sudan Black B | Improves surface SNR | Reduces imaging depth | Similar to TrueBlack, trends towards reduced imaging depth. |
| TrueVIEW | Can improve SNR | No significant reduction | A potential candidate when depth preservation is a priority [21]. |
| Glycine | Can improve SNR | No significant reduction | Similar to TrueVIEW, did not significantly hinder depth in the studied context [21]. |
| Trypan Blue | Not significant | Not significant | Did not show a statistically significant impact on SNR in the tested protocol [21]. |
Detailed Experimental Protocol: Evaluating Quenching Agents
This protocol is adapted from immersion-based studies on myocardial tissue and can be generalized for evaluating quenchers in other whole-mount samples [21].
Objective: To systematically test and compare the efficacy of different autofluorescence quenching agents and their impact on imaging depth and signal-to-noise ratio.
Materials:
- Tissue samples (e.g., whole-mount embryos)
- Quenching agents: TrueBlack, Sudan Black B, TrueVIEW, Glycine, etc.
- Phosphate-buffered saline (PBS)
- CUBIC Reagent-1 (or other suitable clearing agent) [21]
- Confocal or light-sheet microscope
Methodology:
- Sample Preparation & Labeling:
- Fix tissues following standard protocols for your sample (e.g., with paraformaldehyde).
- Divide samples into groups for each quenching agent to be tested, plus an untreated control group.
- Perform immunostaining or fluorescent labeling as required by your experiment.
Tissue Clearing:
- Incubate all samples in a clearing reagent (e.g., CUBIC Reagent-1 for 24 hours) to render the tissue transparent and allow deep imaging [21].
Autofluorescence Quenching:
- Prepare working solutions of each quenching agent according to manufacturer specifications or published recipes.
- Treat each experimental group with its respective quenching agent. The untreated control group should be incubated in PBS or the quenching agent's buffer alone.
- Critical Optimization Step: Systemically vary the incubation time (e.g., 30 minutes, 1 hour, 2 hours) and concentration for each agent to find the optimal conditions.
Image Acquisition & Analysis:
- Image all samples under identical microscope settings (laser power, gain, exposure).
- Acquire z-stacks from the tissue surface to the maximum depth where signal is detectable.
- Quantitative Analysis:
- Signal-to-Noise Ratio (SNR): Measure the mean fluorescence intensity of your specific signal and the background (autofluorescence) in a region without specific labeling. Calculate SNR as
Signal_Mean / Background_StdDev. - Imaging Depth: Determine the maximum depth (in microns) at which your specific signal can be reliably distinguished from background noise in the z-stack.
- Signal-to-Noise Ratio (SNR): Measure the mean fluorescence intensity of your specific signal and the background (autofluorescence) in a region without specific labeling. Calculate SNR as
The Scientist's Toolkit: Key Research Reagent Solutions
Table 2: Essential Materials for Autofluorescence Management Experiments
| Reagent / Material | Function / Application | Example Use in Context |
|---|---|---|
| TrueVIEW Autofluorescence Quenching Kit | Reduces background fluorescence from tissue components like collagen and RBCs through electrostatic binding and quenching [40]. | A simple, 2-minute post-staining treatment to improve SNR, especially in formalin-fixed tissues [40]. |
| Sudan Black B | A lipophilic dye that quenches autofluorescence by binding to lipids and lipofuscin [39]. | A traditional chemical quencher; requires careful optimization as it can reduce imaging depth [21]. |
| CUBIC (Clear, Unobstructed Brain/Body Imaging Cocktails) | A tissue-clearing protocol that delipidates and refractive-index-matches tissues to enable deep light penetration [21]. | Used to prepare whole-mount samples for 3D imaging, prior to applying and testing quenching agents [21]. |
| OPAL Dyes (e.g., OPAL-480, 570, 690) | Fluorophores used in multiplexed imaging techniques like RNAscope for high-sensitivity mRNA detection [41]. | The target signals in an experiment where autofluorescence must be quenched or separated digitally. |
| RNAscope Multiplex Fluorescent Reagent Kit | Enables high-sensitivity, high-resolution detection of mRNA in situ (spatial transcriptomics) in whole-mount samples like zebrafish embryos [41]. | Used to label the target of interest; its signal must be protected from nonspecific quenching. |
Workflow Visualization: Managing Autofluorescence
Quenching Agent Evaluation Workflow
The diagram below outlines the logical process for evaluating the trade-offs of different quenching agents in an experimental setting.
Digital vs. Chemical Suppression Pathways
This diagram contrasts the fundamental pathways for reducing autofluorescence using chemical versus digital methods.
Frequently Asked Questions
Q1: Why is there a significant difference in background autofluorescence when imaging pig myocardial tissue compared to rat tissue? The intrinsic biological properties of pig myocardial tissue result in higher autofluorescence. Pig tissues contain high levels of inherent autofluorescent pigments, such as lipofuscin and heme, which contribute to a higher background signal. Furthermore, the structural density of pig myocardium can reduce the efficacy of clearing agents, leading to greater light scattering and autofluorescence retention compared to the less dense rat myocardial tissue [21].
Q2: What are the best quenching agents to use for pig myocardial tissues to improve signal-to-noise ratio? The optimal quenching agent depends on the desired balance between signal-to-noise ratio (SNR) and imaging depth. For pig myocardium, TrueVIEW and Glycine have shown potential for improving SNR without significantly compromising imaging depth. In contrast, lipofuscin-targeting quenchers like TrueBlack and Sudan Black B tend to reduce imaging depth, despite improving surface-level SNR [21].
Q3: How does the CUBIC tissue-clearing protocol need to be modified for thicker pig myocardial samples? The delipidation step is critical. For pig myocardium, a 24-hour incubation in CUBIC Reagent I is optimal. Due to the tissue's density and lipid content, ensuring complete delipidation is necessary for effective clearing. For rat myocardium, this step may be shorter. Always monitor the clearing progress, as over-incubation can damage tissue microstructure [21].
Q4: Our immersion-based labeling is ineffective beyond 100 µm in pig tissues. What strategies can improve dye penetration? This is a common issue due to the dense ECM in pig hearts. Consider the following:
- Increasing incubation time: Allow more time for the label (e.g., tomato lectin) to diffuse.
- Optimizing label concentration: A higher concentration of the vascular label may be needed for pig tissues compared to rat tissues.
- Agitation: Gentle agitation during the incubation step can promote more uniform label distribution [21].
Q5: Why do we observe different optimal incubation times for the same protocol in pig versus rat myocardial tissues? This variability stems from fundamental anatomical and compositional differences. Pig myocardium is generally more fibrous and has a denser extracellular matrix (ECM) than rat myocardium. This structural disparity impedes the diffusion of chemicals, antibodies, and clearing reagents, necessitating longer incubation times for pig tissues to achieve results comparable to those in rat tissues [21] [42].
Troubleshooting Guides
Issue 1: Poor Tissue Clearing in Pig Myocardium
- Problem: Incomplete clearing, resulting in cloudy samples and poor light penetration.
- Solution: Optimize the delipidation step. For pig tissues, ensure a full 24-hour incubation in CUBIC Reagent I with gentle agitation. Verify that the reagent is fresh and the tissue sample is not excessively thick (300 µm is a common starting point) [21].
- Prevention: Always perform a preliminary test with a small tissue section to determine the ideal clearing time for your specific sample.
Issue 2: High Autofluorescence Obscures Signal in Pig Tissues
- Problem: Intense background noise masks the specific fluorescent signal from labels.
- Solution: Incorporate an autofluorescence quenching step into your protocol. A comparison of common quenchers is provided in Table 2. Based on recent findings, TrueVIEW or Glycine are recommended as initial choices for pig myocardium [21].
- Prevention: Limit the use of aldehyde-based fixatives like PFA where possible, as they can induce autofluorescent cross-links [21].
Issue 3: Inconsistent Vascular Labeling with Immersion in Pig Tissues
- Problem: Weak, uneven, or superficial labeling of microvasculature.
- Solution:
- Confirm the viability of your label. Tomato lectin (LYCOPERSICON ESCULENTUM LECTIN) is validated for immersion labeling in myocardial tissue [21].
- Increase the concentration of the labeling solution specifically for pig samples.
- Extend the incubation period and perform it at 4°C to slow degradation and promote deeper diffusion.
Data Presentation
Table 1: Comparative Baseline Characteristics of Pig and Rat Myocardial Tissues
| Characteristic | Pig Myocardium | Rat Myocardium | Notes |
|---|---|---|---|
| Relative Autofluorescence | High [21] | Lower [21] | Due to lipofuscin and heme content [43] |
| Tissue Density / ECM | Denser, more fibrous [42] | Less dense [21] | Affects reagent diffusion |
| Sample Size Availability | Often biopsies/sections [21] | Often whole organ [21] | Dictates use of immersion vs. perfusion methods |
| Typical Section Thickness | ~300 µm [42] | ~300 µm [21] | Standard for imaging studies |
Table 2: Performance of Autofluorescence Quenchers in Myocardial Tissue
| Quenching Agent | Impact on SNR | Impact on Imaging Depth | Recommended Use Case |
|---|---|---|---|
| TrueVIEW | Potential improvement [21] | Minimal negative impact [21] | General use for pig myocardium |
| Glycine | Potential improvement [21] | Minimal negative impact [21] | General use for pig myocardium |
| TrueBlack | Improves surface SNR [21] | Reduces depth [21] | Surface-level imaging only |
| Sudan Black B | Improves surface SNR [21] | Reduces depth [21] | Surface-level imaging only |
| Trypan Blue | No significant impact [21] | No significant impact [21] | Not recommended for primary quenching |
Experimental Protocols
Detailed Methodology: Immersion-Based Labeling and CUBIC Clearing
This protocol is optimized for 300 µm thick sections of left ventricular free wall tissue [21].
Reagents:
- Phosphate-buffered saline (PBS)
- Paraformaldehyde (PFA) 4%
- Tomato Lectin, fluorescently conjugated
- CUBIC Reagent I
- CUBIC Reagent II
- Optional: Autofluorescence quenching agent (e.g., TrueVIEW)
Procedure:
- Fixation: Immerse fresh tissue samples in 4% PFA for 24 hours at 4°C.
- Washing: Rinse fixed tissues with PBS 3 times, 1 hour each, to remove residual PFA.
- Optional Quenching: Incubate tissue in selected quenching agent according to the manufacturer's protocol.
- Vascular Labeling: Immerse tissue in a solution of tomato lectin in PBS. Incubate for 24-48 hours at 4°C with gentle agitation.
- Washing: Rise tissues with PBS to remove unbound lectin.
- Delipidation (Clearing Stage 1): Incubate tissue in CUBIC Reagent I.
- Washing: Briefly rinse in PBS to remove Reagent I.
- Refractive Index Matching (Clearing Stage 2): Incubate tissue in CUBIC Reagent II until the tissue is transparent (typically 12-24 hours).
- Imaging: Mount the cleared tissue and image using confocal microscopy.
Workflow Visualization
The Scientist's Toolkit
Table 3: Essential Reagents for Myocardial Tissue Processing and Imaging
| Item | Function | Example Use Case |
|---|---|---|
| Tomato Lectin (LEL) | Binds to glycans on vascular endothelium for immersion-based labeling of microvasculature [21]. | 3D visualization of capillary networks in fixed tissue. |
| CUBIC Reagents | A hydrophilic tissue-clearing kit that removes lipids (Reagent I) and matches refractive index (Reagent II) [21]. | Rendering pig and rat myocardial tissues transparent for deep imaging. |
| TrueVIEW Autofluorescence Quencher | Reduces broad-spectrum background fluorescence from aldehyde fixation and endogenous pigments [21]. | Improving SNR in pig myocardium without sacrificing imaging depth. |
| Probe Sonicator | Applies high-frequency sound energy to disrupt tissue structure for efficient protein or molecular extraction [44]. | Homogenizing dense pig myocardial samples for proteomic analysis. |
| Decellularized Porcine Myocardial Slice (dPMS) | A thin (~300 µm), biomimetic scaffold derived from pig heart ECM [42]. | Studying cell-ECM interactions and as a platform for cardiac patch development. |
Why are Protocol Stop Points Critical in Whole Mount Embryo Research?
In whole mount embryo samples, improper pausing of protocols can exacerbate tissue autofluorescence, a significant challenge in fluorescence-based techniques. Unplanned sample degradation during storage can increase background noise, masking the specific signal you're trying to detect. Carefully chosen stop points allow you to schedule complex experiments effectively while ensuring that the integrity of your sample and the clarity of your final data are maintained.
FAQ: Managing Protocol Stops and Sample Preservation
Q: At what points can I safely pause my whole mount immunofluorescence or RNA-FISH protocol?
A: You can safely pause your protocol at the following stages, provided you use the correct preservation conditions:
- After Fixation: Once samples are fixed and washed, they can be stored in a suitable buffer. For iDISCO protocols, samples can be stored in 100% methanol for extended periods [45].
- During Blocking or Washes: The time in blocking buffer can often be extended by a couple of days to fit your schedule. Similarly, wash steps after antibody incubation can sometimes be extended for a day without deleterious effects [45].
- After Clearing: Cleared samples are generally stable. One resource notes that samples stored in DBE (dibenzyl ether) with the tube filled to the top and protected from light can last for over a year without issues [45].
Q: How does improper storage contribute to autofluorescence?
A: Autofluorescence can arise from multiple sources, and storage conditions can make it worse.
- Aldehyde Fixatives: Fixation with formalin or paraformaldehyde can create fluorescent Schiff bases. While necessary, over-fixation or poor storage after fixation can intensify this [46] [47].
- Oxidation: Exposure to air during storage can cause oxidation, leading to an amber color in tissues and increased autofluorescence. This is why it's critical to store samples in fully filled containers [45].
- Endogenous Pigments: Storage does not create these, but failing to address pigments like lipofuscin or heme from red blood cells before pausing a protocol will allow their autofluorescence to persist [46] [47].
Q: What are the best practices for storing samples to minimize autofluorescence?
A:
- Use Airtight Containers: Fill containers to the top to minimize air exposure, especially when using organic clearing agents like DBE [45].
- Protect from Light: Store samples in the dark to prevent photobleaching of fluorophores and reduce oxidative stress [45] [47].
- Choose the Right Medium: Store fixed samples in 100% methanol instead of aqueous buffers if the protocol allows, as this can help reduce background and preserve tissue [45].
- Avoid Over-fixation: Fix for the minimum time required to preserve tissue architecture, as over-fixation with aldehydes is a major cause of autofluorescence [46].
Methodologies: Sample Preservation at Stop Points
The table below summarizes detailed methodologies for pausing and preserving your samples at key protocol stages.
| Protocol Stage | Preservation Method | Detailed Procedure | Considerations for Autofluorescence |
|---|---|---|---|
| Post-Fixation | Storage in Methanol | After fixation and washing, dehydrate samples in a graded methanol series (e.g., 50%, 80%, 100%) and store in 100% methanol at -20°C [45]. | Methanol fixation is an alternative to aldehydes and can help reduce fixation-induced autofluorescence [47]. |
| Post-Blocking / During Washes | Extended Incubation in Blocking or Wash Buffer | Add sodium azide (0.01-0.02%) to your blocking or wash buffer to prevent microbial growth. Store samples at 4°C for several days [48]. | The blocking buffer itself, often containing serum or BSA, can help shield the tissue and minimize non-specific binding that leads to background. |
| Post-Clearing | Long-term Storage in DBE | Transfer the cleared sample to a glass vial, fill it completely to the top with DBE, cap it tightly, and wrap it in foil to protect from light. Store at room temperature [45]. | Prevents oxidation, which can cause yellowing and increased autofluorescence. Ensuring the sample is fully immersed is critical. |
Experimental Workflow for Sample Preservation
The following diagram outlines the decision-making workflow for preserving your whole mount embryo samples at various stop points, integrating key steps to manage autofluorescence.
The Scientist's Toolkit: Key Reagents for Sample Preservation
This table lists essential reagents used to safely preserve samples at protocol stop points while mitigating autofluorescence.
| Reagent | Function in Preservation | Key Consideration |
|---|---|---|
| Methanol | An organic solvent used for dehydration and long-term storage of fixed tissues. Helps preserve tissue structure and reduce background [45] [47]. | A preferred alternative to aldehyde-only fixation for reducing fixation-induced autofluorescence. |
| DBE (Dibenzyl Ether) | A high-refractive index mounting and storage medium for cleared samples. Provides optical clarity and sample stability [45]. | Must fill container to the top to prevent oxidation, which increases autofluorescence and causes yellowing. |
| Sodium Azide | An antimicrobial agent added to aqueous buffers (e.g., blocking, wash) to prevent microbial growth during short-term cold storage [48]. | Highly toxic. Handle with care and follow institutional safety guidelines. Incompatible with HRP-based detection. |
| Heparin | A glycosaminoglycan used in blocking buffers to reduce non-specific background staining by binding to cell-surface glycoproteins [45]. | Particularly useful in complex tissues to improve signal-to-noise ratio before pausing a staining protocol. |
| Sudan Black B | A lipophilic dye that quenches autofluorescence from endogenous pigments like lipofuscin and myelin [46] [47]. | Apply before the final washing and storage steps. Note that it fluoresces in the far-red channel. |
Troubleshooting Guide: Storage-Related Issues
Problem: Sample exhibits strong surface background or ring-like staining after storage.
- Potential Cause: The primary antibody concentration was too high, and the issue became apparent after prolonged incubation or storage [45].
- Solution: Titrate the primary antibody to find the optimal concentration and ensure thorough washing after antibody incubation, even before a pause.
Problem: Cleared sample turns opaque or develops an amber color during storage.
- Potential Cause: Oxidation due to air exposure in the storage vial or the use of unstabilized tetrahydrofuran (THF) during the clearing process [45].
- Solution: Always use THF with the antioxidant BHT. For storage, fill DBE vials completely to eliminate air and protect from light [45].
Problem: High general autofluorescence persists in stored samples.
- Potential Cause: Fixation-induced autofluorescence from aldehydes or the presence of endogenous pigments like red blood cells or lipofuscin [46] [47].
- Solution: For aldehyde-fixed samples, consider a post-fixation treatment with ice-cold sodium borohydride (e.g., 1 mg/mL in PBS) to reduce fluorescence [49] [47]. For pigments, treat samples with autofluorescence quenchers like Sudan Black B or Trypan Blue before the final storage step [49] [47].
Validating Efficacy: Comparative Analysis of Techniques Across Models and Tissues
Frequently Asked Questions
What are the primary sources of autofluorescence in biological samples? Autofluorescence originates from endogenous biomolecules such as lipofuscin, collagen, elastin, riboflavin (vitamin B2), NADH, and heme [50]. In whole mount embryo samples, this can significantly obscure specific signals from fluorescently labeled probes or antibodies.
Why is quantifying Signal-to-Noise Ratio (SNR) and imaging depth important? Accurate quantification of SNR is crucial for determining the reliability and detection limits of your imaging data. It allows researchers to objectively compare system performance, monitor disease progression, and assess the efficacy of treatments or autofluorescence-reduction protocols [51] [52] [53]. Understanding imaging depth ensures that the signal being analyzed originates from the correct focal plane within a thick sample.
My fluorescence signal is weak. How can I improve the SNR without post-processing? You can improve the SNR by addressing autofluorescence at the source. Pre-treatment of samples with photochemical methods like OMAR (Oxidation-Mediated Autofluorescence Reduction) can effectively suppress background before labeling and imaging [22]. Furthermore, selecting fluorophores that emit in spectral ranges distinct from the sample's autofluorescence, such as near-infrared (NIR) dyes, can also yield significant improvements [50].
I have applied an autofluorescence reduction technique. How can I quantitatively validate its success? You can validate the success by calculating and comparing the SNR before and after treatment. A successful reduction in autofluorescence will manifest as a higher SNR value. Using a standardized protocol with an internal fluorescent reference in your instrument can also provide a calibrated, quantitative measure of the remaining autofluorescence, allowing for robust longitudinal comparisons [51] [53].
There are many formulas for SNR. Which one should I use? The lack of a universal standard for calculating SNR is a known challenge in fluorescence imaging [52]. It is critical to clearly report the specific formula and the method used for defining the background region of interest (ROI) in your publications. Consistency in your chosen metric across experiments is more important than the specific formula, as it allows for valid internal comparisons [52].
Troubleshooting Guides
Problem: High Background Noise Obscures Signal
A high background level, often from tissue autofluorescence, reduces contrast and can mask specific, low-abundance targets.
Diagnosis and Solutions:
- Confirm Autofluorescence: Always run an unstained control sample (processed identically but without the fluorescently-labeled reagent) and image it with your standard filter sets. This will reveal the level and spectral characteristics of the inherent background [50].
- Apply a Pre-treatment Method: Consider photochemical bleaching. The OMAR protocol, for instance, uses high-intensity light in the presence of hydrogen peroxide to chemically oxidize and bleach autofluorophores prior to hybridization or immunostaining [22].
- Typical Reagents: 1-4% hydrogen peroxide in Tris-EDTA buffer [22].
- Workflow: Fix embryos -> Permeabilize -> Incubate in OMAR solution under high-intensity white light (e.g., 20,000 lumen LED panels) -> Proceed with RNA-FISH or immunofluorescence.
- Use Chemical Quenchers: Incubating samples with compounds like Sudan Black B can suppress autofluorescence. However, be aware that some quenchers may also partially diminish your desired fluorescence signal [39] [50].
- Employ Advanced Imaging Modalities: If available, techniques like Fluorescence Lifetime Imaging Microscopy (FLIM) can separate specific fluorescence from autofluorescence based on the distinct lifetime decay profiles of the fluorophores, rather than just their emission spectra [39] [50].
Problem: Inconsistent SNR Measurements
Differences in how the background is defined or which formula is applied can lead to inconsistent and non-comparable SNR values.
Diagnosis and Solutions:
- Standardize Your Background ROI: Manually selecting different background regions for each measurement introduces significant variability. Define a consistent, logical background area (e.g., a region devoid of specific staining or a non-embryonic area) and keep its size and location constant for a given set of experiments [52].
- Adopt a Consistent SNR Formula: The definition of SNR can vary. A common approach is the ratio of the mean signal intensity in your target region to the standard deviation of the background region. Pre-define and document the formula used in your lab's standard operating procedures.
- Use an Internal Reference for Calibration: For precise quantitative comparisons over time or between instruments, implement an internal fluorescent reference. This reference, mounted within the imaging path, allows you to calibrate grey levels in your images to a known standard, compensating for day-to-day variations in laser power and detector sensitivity [51] [53].
Quantitative Data and Metrics
The table below summarizes key quantitative metrics and performance data from various autofluorescence management techniques.
Table 1: Performance Metrics of Autofluorescence Management Techniques
| Technique | Key Metric | Reported Performance / Value | Key Considerations |
|---|---|---|---|
| Quantitative AF (qAF) with Internal Reference [51] [53] | Repeatability (95% CI) | ±6% to ±14% (same day); <11% agreement between instruments | Requires confocal SLO with internal fluorescent standard; corrects for laser power and detector gain. |
| FLIM with Phasor Analysis [39] | Photon Acquisition Rate | >125 MHz; ~500 photons/pixel/second | Effectively separates IF from AF based on lifetime differences; requires specialized FLIM instrumentation. |
| OMAR Photobleaching [22] | Signal-to-Noise Ratio | Qualitative "low or absent" autofluorescence in all channels | Effective for whole-mount samples like embryos; requires high-intensity light source (e.g., 20,000 lumen LEDs). |
| General SNR Guidelines [52] | Inter-system BM Score Variation | Up to ~0.67 a.u. due to metric definition | Highlights critical need for standardized SNR and contrast calculation methods across studies. |
Table 2: Common SNR and Contrast Formulas
| Metric | Formula | Variables and Application Notes | ||
|---|---|---|---|---|
| Signal-to-Noise Ratio (SNR) | ( \text{SNR} = \frac{\mu{\text{signal}}}{\sigma{\text{background}}} ) | ( \mu{\text{signal}} ): Mean intensity of target ROI.( \sigma{\text{background}} ): Standard deviation of background ROI. A higher ratio indicates a stronger, more detectable signal [52]. | ||
| Contrast | ( \text{Contrast} = \frac{ | \mu{\text{signal}} - \mu{\text{background}} | }{\mu_{\text{background}}} ) | ( \mu_{\text{background}} ): Mean intensity of background ROI. Measures the relative difference between signal and background [52]. |
| Peak Signal-to-Noise Ratio (PSNR) | ( \text{PSNR} = 10 \cdot \log{10}\left(\frac{\text{MAX}I^2}{\text{MSE}}\right) ) | Often used for image quality assessment after processing (e.g., compression). MAX_I is the maximum possible pixel value, and MSE is the mean squared error between two images [54]. |
Detailed Experimental Protocols
Protocol 1: OMAR Pre-treatment for Whole Mount Embryo Samples
This protocol is adapted from a 2023 study for reducing autofluorescence in mouse embryonic limb buds prior to RNA-FISH, and is applicable to other whole mount tissues [22].
Key Resources:
- Fixed whole mount embryo samples
- OMAR Solution: 1-4% hydrogen peroxide in Tris-EDTA buffer (pH 7.5)
- High-Intensity Light Source: Flexible arm LED spotlights or LED daylight panels (≥20,000 lumen)
- Nutator or rocker
Methodology:
- Fixation and Permeabilization: Collect and fix embryos following standard laboratory protocols for your application (e.g., using 4% Paraformaldehyde). Perform adequate permeabilization using detergents like Tween 20 or Triton X-100.
- OMAR Incubation: Transfer the fixed and permeabilized embryos to a glass vial containing the pre-chilled OMAR solution. The solution should fully cover the samples.
- Photochemical Bleaching: Place the vial on a nutator to ensure agitation and position it under the high-intensity LED light source. The treatment typically requires several hours. Efficacy can be monitored by the appearance of small bubbles in the solution.
- Washing: After treatment, thoroughly wash the embryos with Phosphate Buffered Saline (PBS) containing a mild detergent (e.g., 0.1% Tween 20) to remove all traces of the OMAR solution.
- Proceed with Staining: The samples are now ready for downstream applications such as RNA-FISH or immunofluorescence. The protocol alleviates the need for extensive digital post-processing to remove autofluorescence [22].
Protocol 2: Quantitative AF (qAF) Imaging with Internal Calibration
This protocol, based on confocal scanning laser ophthalmoscopy (cSLO) studies, outlines principles for obtaining quantitative, calibrated fluorescence measurements that can be adapted to other imaging systems [51] [53].
Key Principles and Workflow:
- Instrument Setup: Use a confocal imaging system. A fluorescent reference standard must be installed within the instrument at an intermediate image plane to account for variations in laser power and detector sensitivity.
- Image Acquisition: Save images in a non-normalized mode (i.e., without automatic histogram stretching applied by the instrument software). Adjust the detector gain to ensure the signal is within the linear detection range of the instrument to avoid saturation.
- Image Calibration: For each acquired image, calibrate the grey levels (GL) of the fundus (or your sample) using the formula:
qAF = [GL_{sample} - GL_{zero}] / [GL_{reference} - GL_{zero}] * [Correction_Factor]whereGL_{zero}is the signal from a zero-light reference, and theCorrection_Factoraccounts for variables like magnification and media absorption [51]. - Analysis: The resulting qAF values are quantitative and can be compared between different imaging sessions, different samples, and even different instruments equipped with the same internal reference [51] [53].
Experimental Workflow and Pathways
The following diagram illustrates the key decision points and methodologies in a workflow designed to quantify SNR and manage autofluorescence in embryo imaging.
Workflow for Quantifying SNR in Embryo Imaging
The Scientist's Toolkit
Table 3: Essential Research Reagents and Materials
| Item | Function / Purpose | Example in Context |
|---|---|---|
| Hydrogen Peroxide | A key component in photochemical bleaching (OMAR) to oxidize and reduce autofluorophores [22]. | Used at 1-4% in Tris-EDTA buffer for the OMAR protocol on whole mount embryos [22]. |
| High-Intensity LED Light | Provides the light energy required to drive the photochemical oxidation reaction in OMAR treatment [22]. | LED spotlights or panels with outputs of 20,000 lumens or more [22]. |
| Internal Fluorescent Reference | A calibrated, stable fluorophore mounted inside the imaging device to enable quantitative intensity measurements [51]. | A Texas Red-embedded plastic slide with a neutral-density filter, used in cSLOs for qAF [51]. |
| Sodium Borohydride (NaBH₄) | A chemical reducing agent that can quench autofluorescence caused by aldehyde fixatives by reducing Schiff's bases [39] [50]. | Treatment of aldehyde-fixed samples to reduce fixation-induced autofluorescence. |
| Sudan Black B | A chemical quencher that non-specifically reduces autofluorescence across multiple channels by absorbing light [50]. | Incubation of tissue sections before antibody staining to suppress background. |
| NIR Fluorophores | Fluorophores emitting in the near-infrared spectrum, which is typically less affected by tissue autofluorescence [50]. | Alexa Fluor 647 or similar dyes to shift detection away from the green autofluorescence channel. |
Troubleshooting Guides and FAQs
Frequently Asked Questions
Q1: What are the main causes of autofluorescence in biological tissues like myocardium, and how can I mitigate them? Autofluorescence in myocardial tissues primarily stems from endogenous biomolecules and sample handling. Key sources include lipofuscin, elastin, and heme groups from red blood cells, all of which are strongly autofluorescent [21]. Furthermore, the use of aldehyde fixatives like paraformaldehyde (PFA) can generate fluorescent products through crosslinking [21] [47]. To mitigate this:
- Use autofluorescence quenching agents such as TrueBlack, Sudan Black B, TrueVIEW, or Glycine [21].
- Perfuse tissue samples with PBS prior to fixation to remove red blood cells [47].
- Consider alternative fixation methods, such as ice-cold ethanol or methanol, or minimize PFA fixation time [47].
- Choose fluorophores carefully. Far-red dyes (e.g., Alexa Fluor 647) are often a good choice as autofluorescence is less common at these wavelengths [47].
Q2: My imaging depth is unsatisfactory. Which steps in the protocol are most critical for improving depth? Imaging depth is hindered by light scattering and absorption. The delipidation step during tissue clearing is paramount.
- Optimize delipidation duration. The cited study found that a 24-hour incubation in CUBIC Reagent I provided optimal image quality for myocardial tissue [21].
- Be mindful of quenching agent selection. While some quenchers improve signal-to-noise ratio (SNR) at the surface, agents like TrueBlack and Sudan Black B have been observed to reduce overall imaging depth compared to controls. TrueVIEW and Glycine may be better options if depth is a priority [21].
Q3: Why would I choose an immersion-based labeling method over a perfusion-based one? The choice depends on your experimental model and tissue availability.
- Use perfusion-based methods when working with whole organs and when cannulation of a large vessel is feasible. This method provides more direct staining and is less limited by diffusion [21].
- Choose immersion-based methods when working with small tissue sections or biopsies, which is common in large-animal studies or with precious donor tissue samples where only small sections are available [21].
Q4: How do I calculate and interpret the Signal-to-Noise Ratio (SNR) for my images? A high SNR indicates a strong, specific signal over random background noise. The protocol in the case study used automated analysis to calculate SNR [21].
- Interpretation: A positive staining result should show a clear shift in intensity (and thus a higher SNR) compared to a negative control where no primary labeled antibody is applied [47] [55].
- Troubleshooting a low SNR: If your SNR is low, consider using a higher-titer antibody, re-optimizing the quenching step, or switching to a brighter fluorophore [47].
Troubleshooting Common Experimental Issues
| Problem | Possible Cause | Recommended Solution |
|---|---|---|
| High background autofluorescence | Presence of red blood cells, lipofuscin, or aldehyde fixative cross-linking [21] [47] | Implement a quenching step with TrueVIEW or Glycine; Perfuse tissue with PBS before fixation [21] [47]. |
| Poor imaging depth beyond 50-70 μm | Incomplete delipidation; Use of depth-limiting quenching agents [21] | Extend incubation time in CUBIC Reagent I to 24 hours; Avoid Sudan Black B if depth is critical [21]. |
| Weak or absent vascular signal | Inefficient diffusion of tomato lectin; Lectin degradation [21] | Ensure adequate incubation time for the lectin; Prepare fresh labeling solutions and check their activity on control tissue. |
| Low Signal-to-Noise Ratio (SNR) | Inadequate quenching; Fluorophore too dim; Antibody concentration too low [21] [47] | Titrate antibodies and fluorophores for optimal concentration; Use far-red dyes; Optimize quenching step [47]. |
| Tissue degradation during clearing | Over-exposure to clearing reagents; Inadequate fixation [21] | Ensure tissue is properly fixed; Follow recommended incubation times for CUBIC reagents and monitor tissue integrity. |
Table 1: Performance of Autofluorescence Quenching Agents in Cleared Myocardial Tissue
This table summarizes the effects of different quenching agents on signal quality and imaging depth, based on data from the case study [21].
| Quenching Agent | Impact on Signal-to-Noise Ratio (SNR) | Impact on Imaging Depth | Recommended Use Case |
|---|---|---|---|
| TrueBlack | Improves SNR at tissue surface | Shows trend of reduced depth | For surface-level imaging where highest SNR is critical. |
| Sudan Black B | Improves SNR at tissue surface | Shows trend of reduced depth | For surface-level imaging where highest SNR is critical. |
| TrueVIEW | No significant negative impact; potential for improvement | No significant negative impact; potential for improvement | A balanced choice for general use. |
| Glycine | No significant negative impact; potential for improvement | No significant negative impact; potential for improvement | A balanced choice for general use. |
| Trypan Blue | No significant impact | Not specified | May be useful in specific contexts, but not primary choice. |
| No Quencher (Control) | Baseline SNR | Greatest imaging depth | When maximizing depth is the sole priority. |
Table 2: Protocol Optimization for CUBIC Reagent I Incubation
This table outlines the findings from optimizing the delipidation step, which is crucial for tissue clearing [21].
| Incubation Time (Hours) | Resulting Image Quality | Recommended Application |
|---|---|---|
| 12 | Good | A shorter alternative with acceptable results. |
| 24 | Optimal | Provides the best image quality for myocardial tissues. |
| > 24 (e.g., 48) | Not specified; risk of tissue degradation | Not recommended without testing tissue integrity. |
Experimental Protocols
Detailed Methodology: Immersion-Based Labeling and Clearing
This protocol is optimized for 300-μm sections from the left ventricular free wall of rat and pig hearts [21].
I. Tissue Preparation and Fixation
- Tissue Collection: Harvest myocardial tissue and perfuse with PBS to remove blood. For immersion-based processing, cut into 300-μm sections.
- Fixation: Fix tissues with Paraformaldehyde (PFA). To minimize fixative-induced autofluorescence, keep fixation times to a minimum [47].
II. Autofluorescence Quenching (Optional)
- Agent Selection: Based on your needs (see Table 1), select a quenching agent (e.g., TrueVIEW, Glycine, etc.).
- Incubation: Incubate tissue sections with the chosen quenching solution according to the manufacturer's protocol.
- Washing: Rinse tissues thoroughly with PBS or DI water to remove excess quencher.
III. Vascular Labeling via Immersion
- Prepare Labeling Solution: Dilute tomato lectin (Lycopersicon esculentum lectin) in an appropriate buffer.
- Incubate Tissues: Immerse the fixed and quenched tissue sections in the lectin solution. The incubation time must be optimized for the specific tissue size to allow for adequate diffusion of the label [21].
IV. Tissue Clearing with CUBIC Protocol
- Delipidation: Immerse the labeled tissues in CUBIC Reagent I for 24 hours at room temperature under gentle agitation. This step is critical for removing lipids and reducing light scattering [21].
- Rinsing: Wash the tissues in PBS to remove the clearing reagent.
- Refractive Index Matching: Immerse the tissues in CUBIC Reagent 2 for a similar duration to render the tissue transparent by matching refractive indices [21].
V. Imaging and Analysis
- Mounting: Mount the cleared tissue samples in CUBIC Reagent 2 for imaging.
- Image Acquisition: Image using a confocal microscope. The protocol has been validated for imaging depths of up to 150 μm.
- Image Analysis: Use automated image analysis software (e.g., ImageJ/Fiji) to quantify Signal-to-Noise Ratios (SNR) and average z-slice intensities [21].
Experimental Workflow and Signaling Pathways
Diagram 1: Experimental Workflow for Immersion-Based Imaging
The Scientist's Toolkit
Research Reagent Solutions
| Item | Function/Application in the Protocol |
|---|---|
| Tomato Lectin (LEL) | A vascular label that binds selectively to glycans on the endothelial lining of blood vessels, allowing for visualization of microvascular networks [21]. |
| CUBIC Reagents | A tissue-clearing kit used to render tissues transparent. Reagent-1 primarily delipidates, while Reagent-2 matches refractive indices for deeper light penetration [21]. |
| TrueVIEW Autofluorescence Quenching Kit | A commercial reagent used to reduce tissue autofluorescence, potentially without compromising imaging depth [21]. |
| Sudan Black B | A lipophilic dye that quenches autofluorescence by binding to lipids, but may reduce imaging depth in cleared tissues [21] [47]. |
| Paraformaldehyde (PFA) | A cross-linking fixative used to preserve tissue structure. Fixation time should be minimized to reduce induced autofluorescence [21] [47]. |
| Sodium Borohydride | A chemical treatment that can reduce aldehyde-induced autofluorescence in fixed tissues [47]. |
| Alexa Fluor 647 | An example of a far-red fluorescent dye. Emitting in a spectrum where tissue autofluorescence is low, it can improve the signal-to-noise ratio [47]. |
FAQs: Clearing Solutions and FISH
Q1: What is the fundamental difference between hydrophobic and hydrophilic clearing solutions, and why does it matter for FISH?
The core difference lies in their interaction with water and lipids, which directly impacts the type of tissue components they are best suited to clear.
- Hydrophobic Solutions: These are non-polar and immiscible with water. They are highly effective at dissolving and clearing lipids from tissues. This makes them ideal for clearing large, lipid-rich samples, as they significantly reduce light scattering.
- Hydrophilic Solutions: These are polar and miscible with water. They work by replacing water within the tissue but are not effective at removing lipids. They are better suited for preserving the integrity of fluorescent proteins and are often simpler to use.
For FISH compatibility, the choice is critical. Hydrophobic solutions can be harsh and may damage the delicate RNA targets or the fluorescent signals from the hybridized probes if not carefully controlled. Hydrophilic solutions are generally gentler and more compatible with aqueous-based FISH protocols, but may not clear tissues with high lipid content as effectively [56] [57].
Q2: How does the choice of clearing method impact autofluorescence in whole-mount embryo samples?
The clearing method can significantly influence autofluorescence, a major challenge in fluorescence imaging. Autofluorescence often stems from endogenous molecules like lipofuscins and advanced glycation end products.
- Chemical Bleaching with Hydrophilic Solutions: Some protocols integrate a bleaching step directly into the clearing process. The OMAR (Oxidation-Mediated Autofluorescence Reduction) protocol uses a photochemical bleaching method in an aqueous environment (hydrogen peroxide) under strong light to oxidize and reduce autofluorescent compounds. This method is highly effective for whole-mount FISH on mouse embryonic limb buds and is compatible with subsequent hydrophilic clearing [22].
- Lipid Removal with Hydrophobic Solutions: By thoroughly removing lipids, which can be autofluorescent, hydrophobic clearing can also reduce background noise. However, the process itself does not chemically degrade other autofluorescent compounds like OMAR does.
The table below summarizes a key protocol that directly addresses autofluorescence.
| Protocol | Solution Type | Mechanism for Autofluorescence Reduction | Compatibility |
|---|---|---|---|
| OMAR (Oxidation-Mediated Autofluorescence Reduction) [22] | Hydrophilic (Aqueous-based) | Photochemical oxidation using hydrogen peroxide and high-intensity light to degrade autofluorescent compounds. | Whole-mount RNA-FISH and immunofluorescence on embryos; followed by optical clearing. |
Q3: I am working with delicate embryonic tissues for RNA-FISH. Which type of clearing solution is generally recommended?
For delicate samples like embryos where preserving RNA integrity is paramount, hydrophilic clearing solutions are often the preferred starting point. Their aqueous nature is gentler and poses less risk of denaturing the RNA targets or damaging the tissue morphology. The successful application of whole-mount RNA-FISH on mouse embryos and plant tissues often involves clearing with hydrophilic solutions like ClearSee or simple fructose/glycerol-based systems [22] [58]. These methods maintain a hydrating environment for the RNA-protein complexes while providing sufficient transparency for imaging.
Q4: What are the key trade-offs between using hydrophobic and hydrophilic clearing agents for FISH experiments?
The decision involves balancing clearing efficiency, signal preservation, and protocol simplicity.
| Factor | Hydrophobic Solutions | Hydrophilic Solutions |
|---|---|---|
| Clearing Efficiency (Lipid-rich samples) | High | Low to Moderate |
| Compatibility with FISH | Potentially lower due to harsher chemistry | Generally higher and gentler |
| Signal Preservation | May quench or damage some fluorophores | Better preservation of fluorescent proteins and probes |
| Protocol Simplicity | Often more complex, requiring dehydration and rehydration | Often simpler, can be used with aqueous buffers |
| Autofluorescence Reduction | Via lipid removal | Can be combined with chemical bleaching (e.g., OMAR) [22] |
| Sample Compatibility | Best for large, lipid-rich tissues | Best for delicate tissues, embryos, and whole-mount FISH [22] [58] |
Troubleshooting Guides
Issue 1: High Background After Clearing and FISH
High background after a combined clearing and FISH procedure can stem from insufficient clearing, residual probes, or autofluorescence.
- Assess Autofluorescence: Image an uncleared, unhybridized but fixed sample. If background is high, consider integrating a bleaching step like OMAR into your sample preparation before hybridization and clearing [22].
- Optimize Wash Stringency: If autofluorescence is low, the background is likely from non-specifically bound probes. Increase the stringency of your post-hybridization washes. This can be done by:
- Verify Clearing Efficacy: If the sample is not transparent, the background may be due to light scattering. Re-optimize clearing time or consider if the solution type (hydrophilic vs. hydrophobic) is appropriate for your tissue's lipid content.
Issue 2: Weak or Lost FISH Signal After Clearing
A weak signal after clearing usually indicates that the harsh conditions of the clearing process have damaged the RNA targets or the fluorescent probes.
- Switch Clearing Agent Type: If using a hydrophobic solution, try a gentler hydrophilic solution like Scale or fructose/glycerol-based mounts [61] [58].
- Shorten Clearing Duration: Reduce the time the sample is exposed to the clearing agent.
- Check Probe Integrity: Ensure your FISH probes are designed for the cleared tissue volume. For thick samples, ensure probes can penetrate fully by optimizing permeabilization (e.g., with detergents like Triton X-100 or Tween-20) [22] [62].
- Review Fixation: Over-fixation can mask target sequences. Ensure fixation times are optimized for your embryo stage and that you are using freshly prepared paraformaldehyde [63].
Issue 3: Poor Probe Penetration in Cleared Whole-Mount Embryos
Even after clearing, large macromolecules like FISH probes may not penetrate the entire sample.
- Enhance Permeabilization: Combine your clearing protocol with a strong permeabilization step. The OMAR protocol, for example, uses a detergent-based permeabilization (Tween 20) after the bleaching step to facilitate probe access [22].
- Use Shorter Probes: Consider using oligonucleotide-based probe sets (e.g., 20-50mer) like those in smFISH or HCR, which diffuse more easily than long RNA probes (riboprobes) [60] [64].
- Extend Hybridization Time: Allow more time for the probes to diffuse into the dense tissue matrix during the hybridization step.
Experimental Protocols
Protocol 1: OMAR for Autofluorescence Reduction in Whole-Mount Embryos
This protocol is optimized for reducing autofluorescence prior to FISH, making it highly relevant for the thesis context [22].
Title: Combining OMAR Autofluorescence Reduction with Whole-mount RNA-FISH.
Application: Whole-mount RNA-FISH on mouse embryonic limb buds and other vertebrate embryos.
Key Materials:
- Fixed embryo samples
- Hydrogen peroxide (1% w/v in 1x PBS)
- High-intensity cold white light source (e.g., 20,000 lumen LED panels)
- Permeabilization buffer (e.g., with Tween 20)
- HCR v3.0 RNA-FISH probes and amplifiers (Molecular Instruments)
- Optical clearing solution (e.g., fructose/glycerol-based)
Methodology:
- Fixation: Collect and fix embryos in 4% paraformaldehyde (PFA).
- OMAR Treatment:
- Incubate fixed samples in 1% hydrogen peroxide in PBS.
- Expose the samples to high-intensity light for several hours. The appearance of bubbles indicates a successful reaction.
- Wash samples to remove the hydrogen peroxide.
- Permeabilization: Treat samples with a detergent-based permeabilization buffer (e.g., containing Tween 20) to allow probe entry.
- RNA-FISH: Perform standard whole-mount RNA-FISH, such as the Hybridization Chain Reaction (HCR) v3.0 protocol.
- Clearing: Clear the samples using an aqueous-based optical clearing method (e.g., incubating in a fructose/glycerol solution) to enable deep-tissue imaging.
Protocol 2: Whole-mount smFISH with Hydrophilic Clearing for Plant Tissues
This protocol demonstrates the successful use of hydrophilic clearing for FISH in challenging, autofluorescent tissues [58].
Title: Whole-mount smFISH with ClearSee Treatment.
Application: Absolute mRNA quantification in intact plant tissues (e.g., Arabidopsis roots, shoots).
Key Materials:
- Fixed plant tissue samples
- smFISH probes (e.g., against PP2A or GAPDH mRNA)
- ClearSee solution (a hydrophilic clearing agent)
- Renaissance 2200 (SR2200) cell wall stain
- Methanol (for additional clearing)
Methodology:
- Fixation and Embedding: Fix tissues in 4% PFA and embed in a hydrogel to preserve 3D structure.
- Additional Clearing: Treat samples with methanol and/or ClearSee solution for several days to reduce autofluorescence and light scattering.
- Cell Wall Staining: Stain with SR2200 to outline cells for single-cell analysis.
- smFISH Hybridization: Hybridize with singly-labeled oligonucleotide probes targeting the mRNA of interest.
- Imaging: Image using confocal microscopy to collect optical sections of the thick, cleared specimens.
Research Reagent Solutions
The following table lists key reagents and their functions in combined FISH and clearing workflows.
| Reagent / Material | Function in FISH & Clearing |
|---|---|
| Hydrophilic Membranes (e.g., Cellulose acetate, PES) [57] | Filtration of aqueous solutions, including biological buffers and staining solutions used in FISH protocols. |
| Hydrogen Peroxide [22] | Key component in oxidative bleaching protocols (e.g., OMAR) to reduce tissue autofluorescence prior to FISH. |
| ClearSee [58] | A hydrophilic clearing solution specifically noted for reducing autofluorescence in plant tissues for WM-smFISH. |
| Tween 20 & Triton X-100 [22] [62] | Detergents used for tissue permeabilization to enable probe penetration in whole-mount samples. |
| Formamide [60] [64] | A chemical denaturant used in hybridization buffers to control stringency and improve specificity of probe binding. |
| DAPI [22] | A DNA-binding fluorescent dye used for nuclear counterstaining to visualize tissue architecture. |
Workflow Visualization
The following diagram illustrates the decision pathway for selecting and integrating a clearing method with a FISH protocol, based on the discussed principles.
Technical Support Center: Troubleshooting Autofluorescence in Whole Mount Embryo Samples
Frequently Asked Questions
1. What is autofluorescence and why is it a major problem in embryo imaging? Autofluorescence is background fluorescence emitted by the sample itself, not from your experimental labels. It interferes with signal detection, reduces the signal-to-noise ratio, and can obscure specific signals from fluorescent antibodies or RNA probes, complicating data analysis and quantification [22] [65] [66]. In embryos, common sources include red blood cells, lipids, lipofuscin pigments, and molecules like collagen and NADH [67] [66].
2. Which methods most effectively quench autofluorescence in fixed mouse embryos? Chemical treatments are highly effective. Based on quantitative analysis, TrueBlack Lipofuscin Autofluorescence Quencher and MaxBlock Autofluorescence Reducing Reagent Kit are top performers, reducing autofluorescence intensity by 89–95% across various wavelengths [65]. The OMAR (Oxidation-mediated Autofluorescence Reduction) photochemical bleaching protocol is also a powerful method for whole-mount samples, often eliminating the need for digital post-processing [22].
3. How can I improve signal detection in zebrafish embryo xenograft studies? Optimizing the incubation temperature is critical. While zebrafish are typically maintained at 28.5°C, human cancer cells in xenograft assays show better proliferation at 36°C. Using analysis software like ZFtool to automatically quantify cell proliferation and account for embryo autofluorescence can also standardize and improve accuracy [68].
4. Can I image samples without any fluorescent labels? Yes, through multispectral imaging of autofluorescence. By using techniques like Principal Component Analysis (PCA) on spectral data acquired via light-sheet microscopy, you can characterize and distinguish different tissue types based solely on their unique innate autofluorescence signatures, in both fixed and living samples [30].
Comparison of Autofluorescence Reduction Methods
The table below summarizes the efficacy of various chemical treatments for reducing autofluorescence in fixed tissue sections, as demonstrated in mouse adrenal cortex tissue.
| Treatment Method | Reduction at 405 nm Excitation | Reduction at 488 nm Excitation | Key Characteristics and Notes |
|---|---|---|---|
| TrueBlack Lipofuscin Autofluorescence Quencher | 93% ± 0.1% | 89% ± 0.04% | Preserves specific fluorescence signals; effective on lipofuscin and red blood cells [65] [66]. |
| MaxBlock Autofluorescence Reducing Reagent Kit | 95% ± 0.03% | 90% ± 0.07% | Highly effective; produces a homogeneous background [65]. |
| Sudan Black B (SBB) | 88% ± 0.3% | 82% ± 0.7% | Lipophilic dye; can be less homogeneous and may introduce background in far-red channels [65] [66]. |
| TrueVIEW Autofluorescence Quenching Kit | 70% ± 3% | 62% ± 2% | Commercial kit designed to reduce autofluorescence from multiple causes [65] [67]. |
| Ammonia/Ethanol (NH3) | 70% ± 2% | 65% ± 2% | Reduces background but may not eliminate all autofluorescent granules [65]. |
| Copper Sulfate (CuSO4) | 68% ± 0.8% | 52% ± 1% | A traditional chemical treatment with moderate efficacy [65]. |
| Trypan Blue (TRB) | 12% ± 2% | Shifted emission (no reduction) | Does not reduce intensity at 488 nm but shifts emission spectrum [65]. |
Detailed Experimental Protocols
Protocol 1: OMAR for Whole-Mount RNA-FISH in Mouse Embryonic Limb Buds
This protocol combines photochemical bleaching with detergent-based permeabilization to suppress autofluorescence at the source [22].
- Sample Preparation: Collect and fix mouse embryonic limb buds (E11.5-E12.5) in 4% paraformaldehyde (PFA).
- OMAR Photochemical Bleaching:
- Incubate samples in a freshly prepared OMAR solution (e.g., hydrogen peroxide in a buffered solution).
- Expose the samples to a high-intensity cold white light source (e.g., high-power LED spotlights or panels) for a defined period. The appearance of bubbles indicates a successful reaction.
- Wash samples thoroughly.
- Permeabilization and Hybridization: Treat the bleached samples with a detergent-based permeabilization buffer. Perform whole-mount RNA-FISH using HCR v3.0 probes.
- Clearing and Imaging: Optically clear the samples before imaging with a confocal microscope.
Protocol 2: TrueBlack for Quenching Autofluorescence in Fixed Embryonic Tissue
This protocol is optimized for quenching lipofuscin and red blood cell autofluorescence in non-perfused embryonic mouse tissue [66].
- Tissue Preparation: Fix embryos (e.g., E12.5) in 4% formaldehyde, cryoprotect in 30% sucrose, and embed in O.C.T. compound. Section tissues using a cryostat.
- Immunostaining: Perform standard immunofluorescence staining on tissue sections with your primary and fluorescently-labeled secondary antibodies.
- TrueBlack Quenching:
- Prepare a working dilution of 1X TrueBlack Lipofuscin Autofluorescence Quencher in 70% ethanol. Note: The stock is 20X in DMF.
- Incubate the stained tissue sections in the TrueBlack solution for 30 seconds to 2 minutes. Optimize the time for your specific tissue.
- Rinse sections thoroughly with phosphate-buffered saline (PBS).
- Mounting and Imaging: Mount sections with an antifade mounting medium containing DAPI and image.
Protocol 3: Zebrafish Xenograft and Proliferation Analysis at 36°C
This protocol improves human tumor cell proliferation in zebrafish embryos by optimizing the incubation temperature [68].
- Zebrafish and Cell Preparation: Maintain adult wild-type zebrafish at 28.5°C. Culture and label human cancer cells (e.g., HCT116) with GFP.
- Microinjection: At 2 days post-fertilization (dpf), anesthetize and dechorionate embryos. Microinject approximately 10,000-20,000 cells/µL into the yolk of the embryo.
- Incubation: Incubate correctly injected embryos at 36°C in 24-well plates. Monitor embryo mortality.
- Imaging and Quantification: Image embryos at desired time points. Use automated software like ZFtool to establish a threshold that eliminates embryo autofluorescence and calculates a 'proliferation index' based on the area and intensity of GFP+ cells.
Workflow and Pathway Diagrams
Diagram 1: Autofluorescence Troubleshooting Workflow. This diagram outlines the decision-making process for addressing autofluorescence based on experimental goals, leading to either staining-based or label-free analysis.
Diagram 2: Zebrafish Xenograft Quantification Workflow. This workflow shows the key steps for standardizing xenotransplantation assays, highlighting the critical role of temperature optimization and automated image analysis.
The Scientist's Toolkit: Key Research Reagents
This table lists essential reagents for tackling autofluorescence, as featured in the cited research.
| Reagent / Kit | Primary Function | Key Application Notes |
|---|---|---|
| TrueBlack Lipofuscin Autofluorescence Quencher | Quenches lipofuscin and red blood cell autofluorescence. | Highly effective, preserves specific signal, does not introduce background fluorescence. Used after immunostaining [65] [66]. |
| MaxBlock Autofluorescence Reducing Reagent Kit | Reduces broad-spectrum tissue autofluorescence. | One of the most effective treatments, creating a homogeneous background [65]. |
| Sudan Black B (SBB) | Lipophilic dye that binds to and quenches lipofuscin. | Can be effective but may produce uneven staining and fluoresce in the far-red channel, complicating multiplexing [65] [66]. |
| OMAR Reagents (H₂O₂, Buffers) | Enables photochemical oxidation to reduce autofluorescence. | Core component of the whole-mount OMAR protocol. Requires a high-intensity LED light source for the reaction [22]. |
| HCR RNA-FISH v3.0 Probe Sets & Amplifiers | For highly sensitive RNA detection in whole-mount samples. | From Molecular Instruments. Used in combination with OMAR for high signal-to-noise RNA localization [22]. |
| TrueVIEW Autofluorescence Quenching Kit | Reduces autofluorescence from various causes. | A commercial alternative to in-house chemical preparations [65] [67]. |
| Sodium Borohydride | Reduces aldehyde-induced fluorescence from fixation. | Can have variable effects on tissue and specific signals; use with caution [67] [66]. |
Conclusion
Effective reduction of autofluorescence in whole-mount embryos is not achieved by a single method, but through a synergistic combination of chemical quenching, optimized tissue clearing, and advanced imaging techniques. The choice between quenching agents and clearing protocols must be carefully balanced, considering specific tissue properties and the trade-off between superior surface SNR and preserved imaging depth. The successful application of these integrated approaches, as validated in diverse model organisms from mice to zebrafish, unlocks robust, high-resolution 3D imaging. This capability is pivotal for advancing future research in developmental biology, spatial transcriptomics, and drug discovery, enabling precise visualization of gene expression, microvascular networks, and cellular dynamics in their native 3D context.
References
- 1. A simple and fast optical clearing method for whole-mount ... [https://pmc.ncbi.nlm.nih.gov/articles/PMC12342960/]
- 2. A Systematic Review of Immune Cell Autofluorescence - PMC [https://pmc.ncbi.nlm.nih.gov/articles/PMC12162169/]
- 3. Tissue clearing and 3D imaging in developmental biology - PMC [https://pmc.ncbi.nlm.nih.gov/articles/PMC8497915/]
- 4. Optimized protocol for whole-mount RNA fluorescent in situ ... [https://www.sciencedirect.com/science/article/pii/S2666166723005701]
- 5. Pixel-by-pixel autofluorescence corrected FRET in ... [https://www.nature.com/articles/s41598-023-30098-w]
- 6. Anti-GD2-IRDye800CW as a targeted probe for ... [https://www.nature.com/articles/s41598-020-74464-4]
- 7. Spectral Bleed-Through Artifacts in Confocal Microscopy [https://evidentscientific.com/en/microscope-resource/knowledge-hub/techniques/confocal/bleedthrough]
- 8. Live Cell Imaging Reagents [https://www.sigmaaldrich.com/US/en/products/cell-culture-and-analysis/cell-analysis/live-cell-imaging-reagents?srsltid=AfmBOop7i25ea6XGUHxnezgIi-v731jIjZZHLVr_Gv47oUecNyOE13IJ]
- 9. How to Reduce Autofluorescence [https://www.labcompare.com/10-Featured-Articles/577255-How-to-Reduce-Autofluorescence/]
- 10. Troubleshooting Immunofluorescence [https://www.hycultbiotech.com/immuno-fluorescence/troubleshooting/]
- 11. IHC Troubleshooting Guide | Common Issues & Fixes [https://www.bosterbio.com/protocol-and-troubleshooting/ihc-troubleshooting?srsltid=AfmBOoqBdzUD5dtJJxN_DMhHNH8ue5AwvkzDej0UaaXYkr_KkP1JhG4w]
- 12. Autofluorescence - an overview [https://www.sciencedirect.com/topics/immunology-and-microbiology/autofluorescence]
- 13. Learn how to Remove Autofluorescence from your ... [https://www.leica-microsystems.com/science-lab/life-science/learn-how-to-remove-autofluorescence-from-your-confocal-images/]
- 14. Immunofluorescence Troubleshooting | Tips & Tricks [https://www.stressmarq.com/support/technical-support/troubleshooting/immunofluorescence-troubleshooting/?srsltid=AfmBOoq-k8Q7rG-nba8wEpIDajXHAqBeWbFFC_AW2A_kMphddbxMy_Wz]
- 15. A quantitative pipeline for whole-mount deep imaging and ... [https://elifesciences.org/reviewed-preprints/107154]
- 16. Autofluorescence-based tissue characterization enhances ... [https://www.nature.com/articles/s41598-024-67366-2]
- 17. Depth-enhanced molecular imaging with two-photon ... [https://arxiv.org/html/2511.09462v1]
- 18. Time-Resolved and Label-Free Evanescent Light ... [https://pmc.ncbi.nlm.nih.gov/articles/PMC8289281/]
- 19. Novel application of metabolic imaging of early embryos ... [https://pmc.ncbi.nlm.nih.gov/articles/PMC11700888/]
- 20. Management of autofluorescence in formaldehyde-fixed ... [https://pmc.ncbi.nlm.nih.gov/articles/PMC10614721/]
- 21. Immersion‐Based Clearing and Autofluorescence ... [https://pmc.ncbi.nlm.nih.gov/articles/PMC12589860/]
- 22. Optimized protocol for whole-mount RNA fluorescent in situ ... [https://pmc.ncbi.nlm.nih.gov/articles/PMC10522992/]
- 23. Autofluorescence Quenching in Decellularized Plant ... [https://link.springer.com/article/10.1007/s10439-025-03829-5]
- 24. Efficient removal of naturally-occurring lipofuscin ... [https://www.sciencedirect.com/science/article/pii/S1526590025005863]
- 25. Elimination of autofluorescence background from ... [https://pmc.ncbi.nlm.nih.gov/articles/PMC3566262/]
- 26. Clearing for Deep Tissue Imaging - PMC [https://pmc.ncbi.nlm.nih.gov/articles/PMC6168389/]
- 27. CUBIC-f: An optimized clearing method for cell tracing and ... [https://www.sciencedirect.com/science/article/pii/S0165027020304258]
- 28. Overview of Tissue Clearing Methods and Applications [https://andor.oxinst.com/learning/view/article/overview-of-tissue-clearing-methods-and-applications]
- 29. Clarifying Tissue Clearing - PMC [https://pmc.ncbi.nlm.nih.gov/articles/PMC4537058/]
- 30. Multispectral imaging for characterizing autofluorescent ... [https://www.nature.com/articles/s41598-024-61020-7]
- 31. To label or not: the need for validation in label-free imaging [https://pmc.ncbi.nlm.nih.gov/articles/PMC11660684/]
- 32. Autofluorescence imaging permits label-free cell type ... [https://elifesciences.org/articles/84375]
- 33. Perspectives on label-free microscopy of heterogeneous and ... [https://pmc.ncbi.nlm.nih.gov/articles/PMC10903072/]
- 34. Combating Autofluorescence in Multiplex IF Image Analysis [https://oraclebio.com/overcoming-autofluorescence-variability-innovative-strategies-for-accurate-data/]
- 35. An advanced optical clearing protocol allows label-free ... [https://pmc.ncbi.nlm.nih.gov/articles/PMC7806485/]
- 36. CUBIC-plus: An optimized method for rapid tissue clearing ... [https://www.sciencedirect.com/science/article/abs/pii/S0006291X21009979]
- 37. Imaging the brain in 3D using a combination of CUBIC and ... [https://pmc.ncbi.nlm.nih.gov/articles/PMC6484979/]
- 38. Versatile whole-organ/body staining and imaging based on ... [https://www.nature.com/articles/s41467-020-15906-5]
- 39. A robust method for autofluorescence-free ... [https://www.nature.com/articles/s41598-025-89142-6]
- 40. How Quenching Tissue Autofluorescence Works [https://www.labmanager.com/how-quenching-tissue-autofluorescence-works-2094]
- 41. Single Molecule Fluorescence In Situ Hybridization Using ... [https://pmc.ncbi.nlm.nih.gov/articles/PMC11986847/]
- 42. A Thin Layer of Decellularized Porcine Myocardium for Cell ... [https://www.nature.com/articles/s41598-018-33946-2]
- 43. Key factors behind autofluorescence changes caused by ... [https://www.nature.com/articles/s41598-020-72351-6]
- 44. Bilateral Comparisons in Guinea Pigs and Rats - PMC [https://pmc.ncbi.nlm.nih.gov/articles/PMC12246767/]
- 45. FAQ and Troubleshooting - iDISCO method [https://idisco.info/faq-and-troubleshooting/]
- 46. How to reduce autofluorescence [https://www.ptglab.com/news/blog/how-to-reduce-autofluorescence/?srsltid=AfmBOorzDh4g6bW1DcByeXPYcG_nrNLFbuXG5NwQjkpxkMZVUlkDhiIO]
- 47. How to Reduce Autofluorescence [https://www.southernbiotech.com/how-to-reduce-autofluorescence/]
- 48. Optimization of the Blocking and Signal Preservation ... [https://pmc.ncbi.nlm.nih.gov/articles/PMC12462741/]
- 49. IHC Troubleshooting Guide [https://www.thermofisher.com/us/en/home/life-science/protein-biology/protein-biology-learning-center/protein-biology-resource-library/pierce-protein-methods/ihc-troubleshooting-guide.html]
- 50. Autofluorescence [https://www.jacksonimmuno.com/secondary-antibody-resource/immuno-techniques/autofluorescence/]
- 51. Quantitative Measurements of Autofluorescence with the ... [https://pmc.ncbi.nlm.nih.gov/articles/PMC3250263/]
- 52. Impact of signal-to-noise ratio and contrast definition on the ... [https://pmc.ncbi.nlm.nih.gov/articles/PMC11256003/]
- 53. Lessons learned from quantitative fundus autofluorescence [https://pmc.ncbi.nlm.nih.gov/articles/PMC7561015/]
- 54. Peak signal-to-noise ratio [https://en.wikipedia.org/wiki/Peak_signal-to-noise_ratio]
- 55. Data analysis in flow cytometry [https://www.abcam.com/en-us/technical-resources/guides/flow-cytometry-guide/data-analysis-in-flow-cytometry]
- 56. Difference between hydrophilic and hydrophobic filters - Membrane Solutions [https://www.membrane-solutions.com/News_1336.htm]
- 57. Different Forms of PVDF Membrane Filter - Hawach [https://www.hawachmembrane.com/different-forms-of-pvdf-membrane-filter/]
- 58. Whole-mount smFISH allows combining RNA and protein ... [https://www.nature.com/articles/s41477-023-01442-9]
- 59. In Situ Hybridization Support—Troubleshooting [https://www.thermofisher.com/us/en/home/technical-resources/technical-reference-library/gene-expression-analysis-genotyping-support-center/in-situ-hybridization-support/ish-support-troubleshooting.html]
- 60. A technical review and guide to RNA fluorescence in situ ... [https://pmc.ncbi.nlm.nih.gov/articles/PMC7085896/]
- 61. Protocol for whole-mount preparation, clearing, and ... [https://www.sciencedirect.com/science/article/pii/S2666166724006567]
- 62. FISH Tips and Troubleshooting [https://www.creative-bioarray.com/support/fish-tips-and-troubleshooting.htm]
- 63. How do I reduce high background in my FISH assay? [https://www.ogt.com/ca/resources/fish-resources-and-support/fish-resources/optimize-your-fish-assay-simple-fixes-for-reducing-high-background-signal/]
- 64. Protocol optimization improves the performance of ... [https://www.nature.com/articles/s41598-025-17477-1]
- 65. Characterizing and Quenching Autofluorescence in Fixed ... [https://www.mdpi.com/1422-0067/24/4/3432]
- 66. Suppression of Red Blood Cell Autofluorescence for ... [https://pmc.ncbi.nlm.nih.gov/articles/PMC5657453/]
- 67. How to reduce autofluorescence [https://www.ptglab.com/news/blog/how-to-reduce-autofluorescence/?srsltid=AfmBOop8VCBBcSxqGKibpkEl3NbXD8noHpAsJb-TtWcHPybcNTZR5_NC]
- 68. Improving zebrafish embryo xenotransplantation conditions ... [https://pmc.ncbi.nlm.nih.gov/articles/PMC5748948/]