Unraveling Human Embryogenesis: A Comprehensive Guide to High-Throughput scRNA-seq for Embryo Cell Profiling
High-throughput single-cell RNA sequencing (scRNA-seq) has revolutionized our understanding of human embryonic development by enabling the unbiased transcriptional profiling of thousands of individual cells.
Unraveling Human Embryogenesis: A Comprehensive Guide to High-Throughput scRNA-seq for Embryo Cell Profiling
Abstract
High-throughput single-cell RNA sequencing (scRNA-seq) has revolutionized our understanding of human embryonic development by enabling the unbiased transcriptional profiling of thousands of individual cells. This article provides a comprehensive resource for researchers and drug development professionals, covering the foundational principles of embryogenesis, key methodological approaches and their applications in creating essential reference atlases, critical troubleshooting and optimization strategies for robust experimental design, and finally, rigorous validation and comparative frameworks for benchmarking embryo models and technologies. By synthesizing current methodologies and applications, this guide aims to empower precise dissection of cellular heterogeneity, lineage specification, and transcriptional dynamics during early human development.
Decoding Life's Blueprint: The Fundamentals of Embryo Development and scRNA-seq
Human embryogenesis represents a critical period of development during which a single-cell zygote undergoes a series of precisely orchestrated events to form a multilayered gastrula. This process lays the foundational blueprint for all subsequent tissue and organ formation. Recent advances in single-cell RNA sequencing (scRNA-seq) have revolutionized our understanding of these early developmental stages by enabling unprecedented resolution in profiling transcriptional dynamics and cellular heterogeneity [1] [2]. This Application Note details the key developmental stages from zygote to gastrula and provides experimental frameworks for implementing scRNA-seq technologies to investigate these processes, with specific consideration for drug discovery and developmental disease modeling.
Key Developmental Stages: From Zygote to Gastrula
The journey from a zygote to a gastrula encompasses several distinct morphological stages, each characterized by specific cellular events and genetic programs. Table 1 summarizes the major developmental milestones, timelines, and key transcriptional features relevant for scRNA-seq investigation.
Table 1: Key Stages of Human Embryogenesis from Zygote to Gastrula
| Developmental Stage | Approximate Timeline | Key Morphological Events | Notable Transcriptional Features |
|---|---|---|---|
| Germinal Stage | Day 1-7 | Fertilization, cleavage, blastocyst formation, implantation [3] [4]. | Maternal-to-zygotic transition (MZT); minor and major waves of zygotic genome activation (ZGA) [1]. |
| Embryonic Stage & Gastrulation | Week 3 (Day 14-16) | Formation of primitive streak, bilaminar to trilaminar disc transition, emergence of three germ layers (ectoderm, mesoderm, endoderm) [5] [6]. | Epiblast maturation; expression of lineage-specific transcription factors (e.g., TBXT in primitive streak, SOX17 in endoderm, MSX1 in ectoderm) [7]. |
| Early Organogenesis | Week 4-8 | Neurulation, somite formation, early patterning of major organ systems [3] [5]. | Tissue-restricted gene expression patterns; activation of signaling pathways (e.g., Wnt, BMP, FGF) for morphogenesis [8]. |
The Germinal Stage and Pre-Implantation Development
The germinal stage begins with fertilization, forming a totipotent zygote [4]. The zygote undergoes a series of cleavage divisions, forming a morula by approximately day 3-4. Subsequent compaction and cavitation lead to the formation of the blastocyst, which consists of an outer trophectoderm (TE) destined to form placental structures, and an inner cell mass (ICM) that gives rise to the embryo proper [3] [6]. The ICM further differentiates into the epiblast and hypoblast, forming a bilaminar disc just prior to implantation [4] [6]. scRNA-seq has been pivotal in revealing the transcriptional landscape of this phase, characterized by the maternal-to-zygotic transition (MZT) and the subsequent differentiation into the three foundational lineages (TE, EPI, Hypoblast) [1].
Gastrulation: Establishing the Body Plan
Gastrulation is a transformative period in the third week of development where the bilaminar embryo is converted into a trilaminar structure with the three primary germ layers [5] [6]. This process is orchestrated by the primitive streak, a structure that appears on the epiblast surface. Cells migrating through the primitive streak give rise to the definitive endoderm and mesoderm, while the remaining epiblast cells form the ectoderm [6]. The primitive streak establishes the body's craniocaudal and left-right axes. scRNA-seq analyses during gastrulation have identified distinct cellular populations corresponding to the primitive streak, definitive endoderm, and emerging mesodermal subtypes, revealing key regulators like TBXT (Brachyury) and EOMES [7] [1].
Experimental Protocols for scRNA-seq in Embryo Research
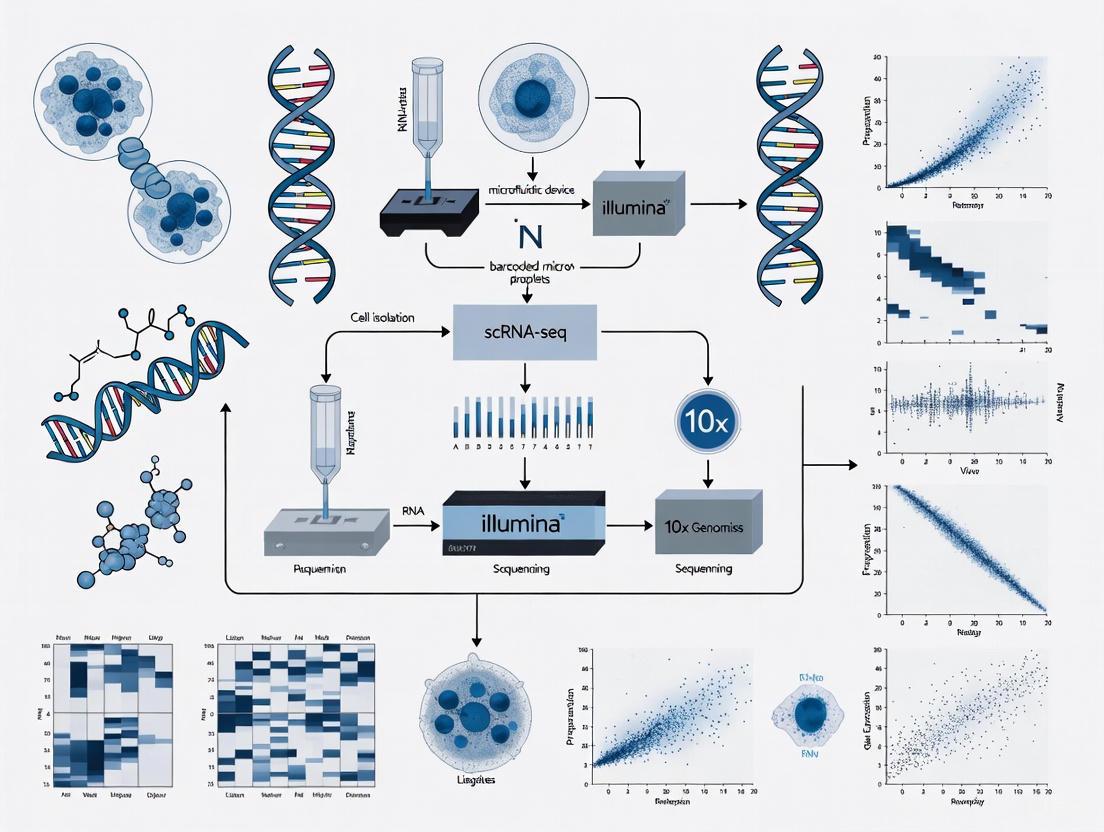
Leveraging scRNA-seq to study human embryogenesis requires specialized protocols to handle the scarcity and sensitivity of embryonic material. The workflow, summarized in Figure 1 below, involves several critical phases from sample preparation to data analysis.
Figure 1: End-to-end scRNA-seq workflow for embryonic research.
Sample Preparation and Single-Cell Isolation
The initial and most critical step is the isolation of viable, high-quality single cells or nuclei from embryonic tissues.
- Sample Source: Human pre-implantation embryos from IVF programs (with ethical approval) or validated in vitro models like stem cell-derived blastoids and gastruloids [7] [1].
- Tissue Dissociation: Gentle enzymatic digestion (e.g., with Accutase or Liberase) combined with minimal mechanical trituration is crucial to preserve cell viability and RNA integrity [9]. For frozen samples or tissues difficult to dissociate (e.g., post-implantation embryos), single-nucleus RNA-seq (snRNA-seq) is a robust alternative [9].
- Single-Cell Isolation:
- Droplet-Based Methods (10X Genomics Chromium): Recommended for high-throughput profiling of thousands of cells. This method captures the 3' ends of transcripts and incorporates Unique Molecular Identifiers (UMIs) to account for amplification bias [7] [9].
- Plate-Based Methods (Smart-Seq2): Preferred for applications requiring full-length transcript coverage, such as isoform analysis or detection of low-abundance genes, albeit at a lower throughput and higher cost per cell [9].
- Quality Control: Assess cell viability and integrity using trypan blue staining or automated cell counters before proceeding to library preparation.
Library Preparation and Sequencing
This phase converts the captured RNA from single cells into a sequenced library.
- Reverse Transcription and Amplification: The isolated RNA is reverse-transcribed into cDNA. Droplet-based methods like 10X Genomics use PCR amplification, while other protocols like CEL-Seq2 rely on in vitro transcription (IVT) [9].
- Library Construction: Following amplification, cDNA libraries are constructed with the addition of platform-specific adapter sequences and sample indices for multiplexing.
- Sequencing: Libraries are typically sequenced on Illumina platforms (e.g., NovaSeq). For 10X 3' gene expression libraries, a sequencing depth of 50,000 reads per cell is generally sufficient to saturate gene detection [9]. The choice between full-length and 3'/5' end sequencing depends on the research question and resources.
Computational Data Analysis
The raw sequencing data undergoes a multi-step computational process to extract biological insights.
- Pre-processing and Alignment: Raw sequencing reads (BCL files) are demultiplexed and aligned to a reference genome (e.g., GRCh38) using dedicated tools like
Cell Ranger(10X Genomics),STARsolo, orKallisto-BUStools[10] [9]. - Quality Control and Filtering: Cells are filtered based on metrics like the number of genes detected, total UMI counts, and the percentage of mitochondrial reads to remove low-quality cells, doublets, and empty droplets [9].
- Normalization and Integration: Data is normalized to account for technical variations in sequencing depth. If multiple samples or batches are involved, integration tools like
fastMNNare used to correct for batch effects while preserving biological variation [7]. - Dimensionality Reduction and Clustering: Highly variable genes are used for dimensionality reduction (PCA) followed by graph-based clustering. Cells are visualized in 2D using UMAP or t-SNE [7] [9].
- Cell Annotation and Trajectory Inference: Clusters are annotated using known marker genes from reference databases [7]. Pseudotime analysis tools (e.g.,
Slingshot) are applied to reconstruct developmental trajectories and infer the sequence of gene expression changes driving cell fate decisions [7].
Successful execution of scRNA-seq in embryogenesis research relies on a suite of specialized reagents and computational tools. Table 2 details the essential components of the research toolkit.
Table 2: Key Research Reagent Solutions for scRNA-seq in Embryogenesis Studies
| Category / Item | Specific Example | Function / Application |
|---|---|---|
| Dissociation Reagents | Accutase, Liberase | Gentle enzymatic dissociation of embryonic tissues into single-cell suspensions. |
| Viability Stain | Trypan Blue, Propidium Iodide (PI) | Distinguishing live cells from dead cells for quality control prior to sequencing. |
| scRNA-seq Kits | 10X Genomics Chromium Single Cell 3' Reagent Kit | A comprehensive, widely used kit for droplet-based single-cell encapsulation, barcoding, and library prep. |
| Solid Reference Atlas | Integrated Human Embryo scRNA-seq Atlas [7] | A universal reference for benchmarking and authenticating cell identities in embryo models. |
| Critical Software | Cell Ranger, Seurat, Scanpy | Standard software pipelines for processing, analyzing, and visualizing scRNA-seq data. |
The journey from a zygote to a gastrula involves a meticulously coordinated series of cell divisions, differentiation events, and morphological transformations. The application of scRNA-seq provides a powerful, high-resolution lens through which to observe and quantify the molecular underpinnings of these processes. The protocols and resources outlined in this Application Note provide a framework for researchers to design robust studies, whether for fundamental biological discovery or for applied research in drug development and disease modeling. As single-cell technologies continue to evolve, integrating transcriptomics with spatial data and other omics layers will further illuminate the complex blueprint of human life.
The field of transcriptomics has undergone a revolutionary transformation, moving from bulk RNA sequencing (RNA-seq) that profiles the average gene expression of cell populations to high-throughput single-cell RNA sequencing (scRNA-seq) that reveals the intricate tapestry of cellular heterogeneity at unprecedented resolution. This technological shift is particularly transformative for complex biological systems like early human embryogenesis, where understanding cell lineage specification, rare cell populations, and developmental trajectories is paramount. While bulk RNA-seq provided foundational knowledge of global gene expression patterns, it fundamentally masked the cellular diversity inherent in developing embryos [11] [12]. The advent of scRNA-seq has empowered researchers to dissect this complexity, enabling the systematic identification and characterization of every cell type present from the zygote to gastrula stages [7] [9]. This Application Note details the critical technological comparisons, experimental protocols, and analytical frameworks for leveraging high-throughput scRNA-seq in embryo cell profiling research, providing a structured guide for scientists and drug development professionals navigating this advanced landscape.
Technological Comparison: Bulk RNA-seq versus Single-Cell RNA-seq
The choice between bulk and single-cell RNA sequencing technologies is strategic, hinging on the specific research questions, sample availability, and budgetary considerations. The table below provides a quantitative comparison of these methodologies.
Table 1: Key Feature Comparison between Bulk RNA-seq and Single-Cell RNA-seq
| Feature | Bulk RNA Sequencing | Single-Cell RNA Sequencing |
|---|---|---|
| Resolution | Average of a cell population [11] | Individual cell level [11] |
| Cost per Sample | Lower (~1/10th of scRNA-seq) [11] | Higher [11] |
| Data Complexity | Lower, simpler to process [11] | Higher, requires specialized computational methods [11] [9] |
| Cell Heterogeneity Detection | Limited, masks underlying diversity [11] [12] | High, reveals distinct subpopulations and states [11] [12] |
| Rare Cell Type Detection | Limited, signals are diluted [11] | Possible, identifies rare and novel cell types [11] [12] |
| Gene Detection Sensitivity | Higher, detects more genes per sample [11] | Lower per cell, but provides cell-to-cell variation data [11] |
| Ideal Application | Homogeneous samples, differential expression in cell populations [11] | Complex tissues, developmental biology, tumor heterogeneity [11] [12] |
The limitations of bulk RNA-seq become particularly pronounced in embryogenesis research. For instance, studying a developing blastocyst with bulk methods would yield an averaged transcriptome, obscuring the critical molecular differences between the emerging epiblast, hypoblast, and trophectoderm lineages [7]. In contrast, scRNA-seq can precisely delineate these lineages and uncover rare transitional cell states, providing a dynamic map of early human development [7] [13].
Experimental Protocols for High-Throughput scRNA-seq
A successful scRNA-seq experiment requires meticulous planning and execution, from cell isolation to library preparation. The following section outlines the core methodologies and workflows.
Single-Cell Isolation Strategies
The initial step of isolating single cells is critical and can be achieved through several methods, each with distinct advantages and limitations suited to different experimental needs, such as working with precious embryo samples.
Table 2: Common Single-Cell Isolation Methods for scRNA-seq
| Method | Principle | Advantages | Limitations | Suitability for Embryo Profiling |
|---|---|---|---|---|
| FACS (Fluorescence-Activated Cell Sorting) | Uses lasers and droplet deflection to sort single cells into plates based on fluorescence and size [9] [14]. | High accuracy, pre-selection of cells based on markers, compatible with well-based protocols [14]. | Lower throughput, potential for mechanical stress on cells [14]. | Ideal for pre-implantation embryos where cell numbers are low and specific lineages are targeted. |
| Droplet-Based Microfluidics (e.g., 10x Genomics) | Cells are encapsulated into nanoliter droplets with barcoded beads in a microfluidic chip [9] [12]. | High throughput (thousands to millions of cells), cost-effective per cell, automated [9] [12]. | Lower capture efficiency, limited imaging capability, higher doublet rate [14]. | Excellent for post-implantation stages or embryo models generating larger, heterogeneous cell numbers. |
| Microwell-based (e.g., Seq-Well) | Cells are captured in tiny wells on a patterned surface [9]. | Portable, lower cost, no complex equipment needed [9]. | Lower throughput than droplet-based methods. | Useful for resource-limited settings or specific sample types. |
| Laser Capture Microdissection | Cells are isolated directly from tissue sections using a laser [14]. | Preserves spatial context, precise selection. | Very low throughput, technically challenging, may affect RNA integrity [14]. | Potentially useful for isolating specific regions from sectioned embryo samples. |
Core Workflow and Library Preparation
After isolation, single cells are processed to create sequencing libraries. The workflow for a high-throughput platform like the 10x Genomics Chromium system is a representative example [12]:
- Cell Partitioning: A suspension of single cells is loaded onto a microfluidic chip, where each cell is encapsulated in a droplet (Gel Bead-in-emulsion, or GEM) together with a gel bead.
- Cell Lysis and Barcoding: The cell is lysed within the droplet. The gel bead dissolves, releasing oligo sequences containing several key elements: a cell-specific barcode (identical for all transcripts from the same cell), a unique molecular identifier (UMI) to label individual mRNA molecules and correct for amplification bias, and a poly(dT) primer to bind mRNA [12] [15].
- Reverse Transcription: The mRNA is reverse-transcribed into barcoded cDNA.
- cDNA Amplification and Library Construction: The cDNA is amplified via PCR and then used to construct a sequencing library.
Protocols can be broadly categorized by transcript coverage. Full-length protocols (e.g., Smart-Seq2) sequence the entire transcript, which is advantageous for detecting isoform usage and mutations [9]. 3'- or 5'-end counting protocols (e.g., droplet-based methods like 10x Genomics) focus on one end of the transcript, using UMIs for digital gene expression counting, and are optimized for high-throughput cell throughput and cost-effectiveness [9].
The Scientist's Toolkit: Essential Reagents and Materials
The following table catalogs key reagents and solutions critical for executing a successful high-throughput scRNA-seq experiment in embryo profiling.
Table 3: Essential Research Reagent Solutions for scRNA-seq
| Item | Function | Application Notes |
|---|---|---|
| Barcoded Gel Beads | Contains oligos with cell barcode, UMI, and poly(dT) for mRNA capture and labeling within droplets [12]. | Core component of 10x Genomics and similar droplet-based platforms. Barcode quality is paramount for data integrity. |
| Partitioning Oil & Microfluidic Chips | Creates stable, water-in-oil emulsions (droplets) for single-cell encapsulation and reactions [12]. | Chip design determines throughput and partition efficiency. |
| Reverse Transcription (RT) Mix | Enzyme and reagents to convert captured mRNA into stable, barcoded cDNA [9] [14]. | High-efficiency RT is crucial for transcript capture sensitivity, especially for low-abundance mRNAs in embryo cells. |
| Unique Molecular Identifiers (UMIs) | Short random nucleotide sequences that uniquely tag each mRNA molecule prior to amplification [15]. | Allows for accurate digital counting of transcripts, correcting for PCR amplification bias. |
| Poly(dT) Primers | Primers that bind to the poly-A tail of mRNA molecules, enabling selective capture of polyadenylated RNA [9]. | Reduces ribosomal RNA (rRNA) contamination in the final library. |
| Cell Lysis Buffer | A solution that disrupts the cell membrane to release intracellular RNA, while inhibiting RNases [14]. | Must be compatible with downstream enzymatic steps and not interfere with droplet stability. |
Application in Embryo Cell Profiling: A Case Study
The power of high-throughput scRNA-seq is exemplified by its application in creating a comprehensive reference map of human embryogenesis. A landmark study integrated six published human scRNA-seq datasets to build a universal reference covering development from the zygote to the gastrula stage [7] [13].
Workflow and Analysis:
- Data Integration: The datasets were reprocessed using a standardized pipeline to minimize batch effects and integrated using fast mutual nearest neighbor (fastMNN) methods [7].
- Dimensionality Reduction and Visualization: The integrated data was visualized using Uniform Manifold Approximation and Projection (UMAP), revealing a continuous developmental landscape and the branching points of major lineages (ICM/TE, epiblast/hypoblast) [7].
- Cell Annotation and Validation: Lineage identities were annotated and validated against known human and non-human primate datasets. The reference was also used to identify unique marker genes for distinct cell clusters (e.g.,
POU5F1in epiblast,TBXTin primitive streak) [7]. - Trajectory Inference: Tools like Slingshot were used to infer developmental trajectories (pseudotime) for the epiblast, hypoblast, and TE lineages, identifying key transcription factors driving each lineage's development [7].
- Benchmarking Tool: The reference was deployed as a public prediction tool where new datasets, such as those from stem cell-based embryo models, can be projected to authenticate their cellular identities and assess fidelity to in vivo development [7] [13].
This case study underscores a critical application: the reference tool highlighted the risk of misannotating cell lineages in human embryo models when they are not benchmarked against a relevant, integrated human embryo reference [7]. This ensures the validity of models used for fundamental research into human development, infertility, and congenital diseases.
The transition from bulk RNA-seq to high-throughput scRNA-seq represents a paradigm shift in transcriptomics, moving from population-level averages to a fine-grained, single-cell resolution view of biological systems. For embryo cell profiling, this technology is indispensable. It enables the deconstruction of developmental processes with unparalleled detail, mapping the precise molecular events that guide a single zygote through lineage specification into a complex gastrula. By providing detailed protocols, analytical frameworks, and a catalog of essential tools, this Application Note equips researchers to leverage this powerful technology, driving forward our understanding of life's earliest stages and accelerating discoveries in developmental biology and regenerative medicine.
Single-cell RNA sequencing (scRNA-seq) has revolutionized biological research by enabling the examination of gene expression at the resolution of individual cells. This capability is crucial for uncovering cellular heterogeneity, identifying rare cell populations, and understanding complex biological systems such as embryonic development. Unlike traditional bulk RNA-seq, which provides an averaged expression profile from thousands of cells, scRNA-seq reveals the unique transcriptional landscape of each cell, offering unprecedented insights into developmental biology, disease mechanisms, and cellular responses to therapeutics [16] [17].
The field of scRNA-seq is dominated by several key technological platforms, each with distinct methodologies and applications. The Chromium platform from 10x Genomics utilizes microfluidic partitioning and gel bead-in-emulsion (GEM) technology to barcode transcripts from thousands of individual cells [16]. In contrast, Parse Biosciences employs a split-pool combinatorial barcoding approach that requires no specialized instrumentation, allowing for unprecedented scaling to millions of cells [18] [19]. Additionally, full-length transcript sequencing methods such as Smart-seq2 provide isoform-level resolution, enabling the study of alternative splicing dynamics during development [20].
For embryo cell profiling research, the choice of scRNA-seq platform is particularly critical. The unique challenges of working with precious, limited embryonic material demand technologies with high sensitivity, accuracy, and compatibility with various sample preservation methods. This article provides a comprehensive comparison of major scRNA-seq platforms, detailed experimental protocols, and their specific applications in embryonic development research to guide researchers in selecting the most appropriate technology for their investigative needs.
Platform Comparison and Technical Specifications
The landscape of scRNA-seq technologies is characterized by diverse approaches to cell partitioning, barcoding, and library preparation. 10x Genomics employs a droplet-based microfluidics system where single cells are encapsulated in GEMs (Gel Beads-in-emulsion) along with barcoded gel beads. Within these nanoliter-scale reactions, mRNA transcripts are reverse-transcribed into cDNA molecules that incorporate cell-specific barcodes and unique molecular identifiers (UMIs) [16] [17]. This approach enables high-throughput profiling of thousands to hundreds of thousands of cells across their Universal (3' and 5') and Flex assay systems.
Parse Biosciences utilizes a fundamentally different technology based on split-pool combinatorial barcoding. Their Evercode technology involves fixing cells or nuclei followed by sequential rounds of barcoding through splitting and pooling procedures. This method eliminates the need for specialized partitioning instrumentation and enables exceptional scaling capabilities—from thousands to millions of cells per experiment [18] [19]. A significant advancement from Parse is their recently developed FFPE-compatible barcoding technology, which enables whole-transcriptome analysis from formalin-fixed, paraffin-embedded samples, dramatically expanding access to archival clinical specimens [18].
Full-length scRNA-seq methods such as Smart-seq2 offer distinct advantages for embryonic development studies by capturing complete transcript sequences. Unlike 3'-end counting methods that primarily quantify gene expression levels, full-length transcript sequencing enables the investigation of alternative splicing, isoform switching, and allele-specific expression—critical regulatory layers during embryogenesis [20].
Table 1: Comprehensive Comparison of Major scRNA-seq Platforms
| Platform Feature | 10x Genomics Chromium | Parse Biosciences Evercode | Full-Length Methods (e.g., Smart-seq2) |
|---|---|---|---|
| Core Technology | Microfluidic droplet partitioning | Split-pool combinatorial barcoding | Plate-based or tube-based single-cell isolation |
| Barcoding Strategy | Cell barcode + UMI incorporated during RT in GEMs | Sequential barcoding through fixation and permeabilization | Typically no cell barcoding; full-length cDNA amplification |
| Throughput Range | 80K - 960K cells (Universal); up to 5.12M cells (Flex) [16] | 10K - 5M cells (across Mini, WT, Mega, Penta variants) [19] | 96 - 1,536 cells per run |
| Transcript Coverage | 3' or 5' end counting (Universal); targeted whole transcriptome (Flex) [16] [17] | Whole transcriptome | Full-length transcript coverage |
| Sample Compatibility | Fresh, frozen, fixed cells (Flex); fresh/frozen (Universal) [16] | Fresh, frozen, fixed cells; FFPE-compatible technology [18] | Primarily fresh or frozen cells |
| Instrument Requirement | Chromium X Series instrument | No specialized instrument required | Standard laboratory equipment |
| Key Applications in Embryology | Large-scale atlas building, cellular heterogeneity assessment | Longitudinal studies, archival tissue analysis, massive scaling | Alternative splicing analysis, isoform switching, regulatory network inference [20] |
| Multiplexing Capacity | Limited by sample index combinations | Up to 384 samples simultaneously (WT Mega) [19] | Limited by well number |
Performance Metrics and Data Quality Considerations
When selecting a scRNA-seq platform for embryo research, performance characteristics must be carefully evaluated against experimental requirements. Sensitivity—the ability to detect lowly expressed genes—is particularly important for identifying rare transcriptional events during development. The 10x Genomics Chromium platform typically recovers 1,000-5,000 genes per cell depending on cell type, with their GEM-X technology demonstrating improved cell recovery efficiency of up to 80% and reduced multiplet rates [16]. Parse Biosciences' Evercode technology provides comprehensive transcript detection across multiple tissues, with consistent performance even at high cell numbers [21].
For embryonic studies where sample availability is often limited, the ability to work with fixed and preserved materials is invaluable. The 10x Genomics Flex assay enables profiling of fresh, frozen, and fixed samples, including FFPE tissues and fixed whole blood, with particular utility for precious clinical samples [16]. Similarly, Parse's FFPE-compatible barcoding technology unlocks archival specimens for single-cell analysis, enabling retrospective studies of developmental processes [18].
Cell throughput and cost efficiency are additional practical considerations. While 10x Genomics provides robust, standardized workflows with high cell recovery rates, Parse Biosciences offers exceptional scaling capabilities without instrument investment, potentially providing greater flexibility for large-scale embryo mapping projects [19].
Table 2: Technical Specifications and Performance Metrics
| Performance Parameter | 10x Genomics Chromium | Parse Biosciences Evercode | Considerations for Embryo Research |
|---|---|---|---|
| Cells Recovered per Run | 80K-960K (Universal); 80K-5.12M (Flex) [16] | Up to 5M cells (WT Penta) [19] | Sufficient cell numbers for rare population identification |
| Gene Detection Sensitivity | 1,000-5,000 genes/cell (cell type dependent) | Comprehensive transcript detection across tissues [21] | Critical for identifying low-abundance developmental regulators |
| Cell Recovery Efficiency | Up to 80% with GEM-X technology [16] | High recovery across cell types | Important for limited embryonic material |
| Multiplet Rate | Reduced two-fold with GEM-X [16] | Controlled through barcoding strategy | Crucial for accurate cell type identification |
| Sequencing Depth Requirements | 20,000-50,000 reads/cell (standard) | Varies by product scale | Impacts detection of rare transcripts |
| Compatibility with Low-Quality RNA | Yes (Flex assay) [16] | Yes, with fixation capability | Essential for processed embryonic samples |
| Data Analysis Support | Cell Ranger pipeline, Loupe Browser [22] | Trailmaker analysis solution [19] | Streamlines interpretation of complex developmental data |
Experimental Protocols for Embryo Cell Profiling
Sample Preparation and Quality Control
Successful scRNA-seq experiments with embryonic material begin with optimal sample preparation. For preimplantation embryos, careful dissociation into single cells or nuclei is required, preserving cell viability while minimizing stress-induced transcriptional changes. The specific dissociation protocol varies significantly based on embryonic stage—cleavage-stage embryos require gentle zona pellucida removal and blastomeres separation, while postimplantation embryos and gastrulae need more extensive tissue dissociation [7].
A critical consideration for embryonic samples is the rapid stabilization of transcriptional states. Both 10x Genomics Flex and Parse Evercode technologies support sample fixation, enabling temporal synchronization of multiple samples and pausing biological processes until processing. For 10x Genomics Flex assays, fixation involves generating a single cell or nuclei suspension followed by permeabilization and hybridization with probe sets [16]. Parse's methodology similarly uses fixed samples, with their FFPE-compatible technology specifically designed to handle cross-linked, archived materials [18].
Quality control metrics are particularly crucial when working with precious embryonic samples. The 10x Genomics Cell Ranger pipeline provides a web_summary.html file that includes essential QC metrics such as cells recovered, median genes per cell, confidently mapped reads in cells, and mitochondrial read percentage [22]. For embryo samples, the percentage of mitochondrial reads should be interpreted in context—unlike PBMCs where high mitochondrial content may indicate poor cell quality, some embryonic cell types may naturally exhibit elevated mitochondrial activity [22].
Library Preparation and Sequencing
Library preparation workflows differ substantially between platforms but share the common goal of attaching sequencing adapters and sample indices while preserving the cell-specific barcode information.
For 10x Genomics Chromium platforms, the process begins with loading a single-cell suspension and reagents onto a microfluidic chip. Within the Chromium instrument, cells are partitioned into GEMs where reverse transcription occurs, adding cell barcodes and UMIs to cDNA molecules [16] [17]. The specific barcoding mechanism varies by assay type:
- Universal 3' Assay: Gel Bead primers contain poly(dT) sequences that bind to mRNA poly(A) tails, followed by reverse transcription to produce barcoded cDNA [17].
- Universal 5' Assay: Incorporates a template switch oligo mechanism to capture the 5' end of transcripts, enabling V(D)J and CRISPR screening applications [17].
- Flex Assay: Utilizes probe hybridization to protein-coding mRNA targets in fixed, permeabilized cells, followed by ligation and extension to incorporate barcodes [16].
Following GEM generation and barcoding, amplification steps increase material for sequencing library construction. For 10x workflows, this involves breaking emulsions, purifying cDNA, and performing PCR amplification. Sample indices are then added through a second PCR step, which also incorporates complete sequencing adapters [17].
Parse Biosciences employs a substantially different approach that occurs entirely in plate format without specialized instrumentation. After fixation and permeabilization, cells undergo sequential rounds of barcoding through splitting and pooling operations. This combinatorial barcoding strategy assigns each cell a unique combination of barcodes across multiple rounds, enabling massive parallelization [19]. Their recently announced FFPE-compatible workflow adapts this process for challenging archived samples through a novel RNA capture chemistry that addresses RNA degradation and fragmentation issues common in FFPE material [18].
Sequencing requirements vary by platform and experimental goals. 10x Genomics recommends different read depths depending on the application—typically 20,000-50,000 reads per cell for standard gene expression analysis. Their technology is compatible with various sequencing platforms including Illumina, PacBio, Ultima Genomics, and Oxford Nanopore [16]. Parse Biosciences' solutions similarly support standard sequencing technologies, with their Gene Select panels offering targeted sequencing options that dramatically reduce sequencing requirements by focusing on genes of interest [19].
Workflow Selection for Embryo scRNA-seq
Data Analysis and Computational Approaches
Primary Data Processing and Quality Control
The computational analysis of scRNA-seq data begins with processing raw sequencing reads to generate gene expression matrices. For 10x Genomics data, the Cell Ranger pipeline performs alignment, barcode processing, UMI counting, and cell calling [22]. The pipeline outputs filtered feature-barcode matrices, which form the basis for all downstream analyses. Key quality metrics include the number of genes detected per cell, total UMIs per cell, and percentage of mitochondrial reads—all of which help identify low-quality cells [22].
Parse Biosciences provides their Trailmaker analysis solution, which transforms sequencing output into analyzable formats compatible with popular tools like Seurat and Scanpy [19]. Regardless of platform, similar QC principles apply: filtering out cells with anomalously high or low gene counts (potential multiplets or empty droplets), and removing cells with elevated mitochondrial reads (indicating poor cell quality) [22].
For embryonic development studies, additional QC considerations include sex determination of embryos through expression of Y-chromosome genes (DDX3Y, EIF1AY, KDM5D, etc.), and stage-specific quality thresholds that account for changing transcriptional activity during development [20].
Advanced Analytical Frameworks for Developmental Biology
Beyond basic processing, specialized analytical approaches are required to extract biological insights from embryonic scRNA-seq data. Dimensionality reduction techniques such as UMAP (Uniform Manifold Approximation and Projection) and t-SNE enable visualization of cellular heterogeneity, while clustering algorithms identify distinct cell populations [7]. For developmental timecourses, trajectory inference methods (e.g., Slingshot) reconstruct cellular differentiation pathways, ordering cells along pseudotemporal axes to model developmental processes [7].
The integration of multiple datasets is particularly important for building comprehensive embryonic atlases. Computational integration methods like fastMNN (mutual nearest neighbors) enable the combination of data from different studies, technologies, and developmental stages while removing batch effects [7]. These approaches have been instrumental in creating universal reference atlases for human embryogenesis, covering developmental stages from zygote to gastrula [7].
Advanced analytical frameworks can leverage scRNA-seq data to reconstruct gene regulatory networks underlying development. The SCENIC (Single-Cell Regulatory Network Inference and Clustering) pipeline identifies regulons—transcription factors and their target genes—revealing stage-specific regulatory programs [20] [7]. For example, transcription factors such as DUXA are associated with morula stages, VENTX with epiblast, and OVOL2 with trophectoderm development [7].
Machine learning approaches are increasingly important for scRNA-seq analysis, with applications ranging from automated cell type annotation to developmental trajectory inference. Recent bibliometric analysis indicates that China and the United States dominate this research output, with hotspots including random forest and deep learning models [23]. Emerging approaches integrate natural language processing and large language models to enhance the accuracy and scalability of cell type annotation, particularly as single-cell isoform sequencing technologies provide higher resolution for defining cell states [24].
scRNA-seq Data Analysis Workflow
The Scientist's Toolkit: Essential Research Reagent Solutions
Successful embryo scRNA-seq research requires careful selection of reagents and materials tailored to the unique challenges of embryonic material. The following essential solutions form the foundation of robust experimental workflows:
Table 3: Essential Research Reagent Solutions for Embryo scRNA-seq
| Reagent/Material | Function | Platform Compatibility | Embryo-Specific Considerations |
|---|---|---|---|
| Cell Dissociation Reagents | Tissue disruption and single-cell suspension generation | All platforms | Stage-specific protocols; gentle enzymes for fragile embryonic cells |
| Fixation Reagents | Biomolecular stabilization for sample preservation | Parse Evercode; 10x Genomics Flex | Rapid fixation to capture transient developmental states |
| Permeabilization Agents | Cell membrane treatment for barcode access | Parse Evercode; 10x Genomics Flex | Optimization required for different embryonic cell types |
| Barcoded Oligonucleotides | Cell and transcript labeling | Platform-specific | Barcode design impacts multiplexing capacity and detection sensitivity |
| Reverse Transcription Enzymes | cDNA synthesis from RNA templates | 10x Genomics; full-length methods | High efficiency crucial for limited RNA from single embryonic cells |
| PCR Amplification Reagents | Library amplification for sequencing | All platforms | Minimized bias important for accurate quantitative representation |
| Sequence-Specific Probes | Targeted RNA capture | 10x Genomics Flex; Parse Gene Select | Custom panels for developmental marker genes |
| Sample Index Oligos | Sample multiplexing | All platforms | Enable pooling of multiple embryos/conditions reducing costs |
| Quality Control Reagents | Assessment of RNA and cell quality | All platforms | Adapted thresholds for embryonic cells with naturally varying RNA content |
| Bioinformatic Tools | Data processing and interpretation | Platform-specific | Specialized packages for developmental trajectory analysis |
Application in Embryo Research: Signaling Pathways and Developmental Trajectories
Lineage Specification and Regulatory Dynamics
scRNA-seq technologies have dramatically advanced our understanding of human embryonic development by enabling high-resolution mapping of lineage specification events. Integrated analysis of multiple datasets has revealed the continuous progression from zygote to gastrula, with the first lineage branch point occurring as inner cell mass (ICM) and trophectoderm (TE) cells diverge during E5, followed by ICM bifurcation into epiblast and hypoblast [7]. These analyses have identified key transcription factors driving each lineage, including DUXA in morula stages, VENTX in epiblast, OVOL2 in TE, and GATA4 in hypoblast [7].
Trajectory inference analyses have reconstructed the pseudotemporal ordering of cells along developmental pathways, identifying hundreds of transcription factors with modulated expression during epiblast, hypoblast, and TE development [7]. For example, pluripotency markers such as NANOG and POU5F1 are expressed in preimplantation epiblast but decrease following implantation, while HMGN3 shows upregulated expression at postimplantation stages across all three lineages [7].
Sex Differences and Isoform Dynamics
A particularly powerful application of scRNA-seq in embryo research is the identification of molecular differences between male and female embryos. Analysis of human preimplantation embryos has revealed that only a small number of genes exhibit prominent expression level changes between male and female embryos at the E3 stage, whereas many more genes show variations in alternative splicing and major isoform switching [20]. This finding highlights the complementary nature of different regulatory layers—gene expression, alternative splicing, and isoform switching—in shaping embryonic development and sexual dimorphism.
Full-length scRNA-seq technologies are especially valuable for investigating these splicing dynamics during embryogenesis. Studies comparing these three regulatory layers have found that the genes involved in significant changes gradually decrease along embryonic development from E3 to E7 stages, with each regulatory layer providing complementary information about gene expression dynamics [20]. These analyses have functionally important implications for identifying stage-specific gene regulatory modules and revealing dynamic usage of transcription factor binding motifs during development [20].
Key Lineage Transitions in Early Human Development
The evolving landscape of scRNA-seq technologies offers embryonic researchers an expanding toolkit for investigating development with unprecedented resolution. 10x Genomics provides robust, standardized workflows with high cell throughput and compatibility across sample types, while Parse Biosciences enables exceptional scaling without instrumentation and specialized applications including FFPE compatibility. Full-length transcript methods complement these approaches by enabling isoform-level analysis of splicing dynamics and regulatory networks.
Future directions in embryo scRNA-seq will likely see increased integration of multi-omic approaches, combining transcriptomic with epigenetic, proteomic, and spatial information to build comprehensive models of development. Computational advances, particularly in machine learning and large language models, will enhance automated cell type annotation and pattern recognition in high-dimensional data [23] [24]. The development of universal reference atlases for human embryogenesis will provide essential benchmarks for stem cell-based embryo models and disease studies [7].
As these technologies continue to mature, they will undoubtedly yield deeper insights into the fundamental processes of human development, with significant implications for understanding developmental disorders, improving regenerative medicine approaches, and unraveling the complexities of cellular decision-making during embryogenesis.
Embryonic development is characterized by unparalleled cellular diversity, originating from a single fertilized egg. Traditional bulk RNA sequencing methods, which analyze the average gene expression across thousands of cells, obscure the unique transcriptional profiles of individual cells and the dynamic transitions between them [25] [26]. The advent of high-throughput single-cell RNA sequencing (scRNA-seq) has therefore revolutionized embryology by enabling the unbiased dissection of this complexity, revealing novel cell types, delineating lineage trajectories, and uncovering the regulatory mechanisms that govern cell fate decisions [25] [27]. This Application Note details how scRNA-seq is applied to overcome the challenges of cellular heterogeneity in embryo research, providing structured data, detailed protocols, and essential tools for the scientific community.
Key Evidence: How Single-Cell Resolution Reveals Embryonic Complexity
Deconstructing the Embryo: A Quantitative Leap in Cell Type Identification
High-throughput scRNA-seq allows researchers to systematically catalog the cellular composition of embryos at unprecedented scale and resolution. Large-scale atlases profiling millions of cells have bridged critical knowledge gaps in human development [25]. For instance, a 2025 study created a comprehensive human embryo reference by integrating six published scRNA-seq datasets, encompassing 3,304 individual cells from the zygote to the gastrula stage [7]. This resource was able to resolve:
- Three main lineages: the epiblast (EPI), hypoblast, and trophectoderm (TE) trajectories from the zygote.
- Sub-lineage specification: including cytotrophoblast (CTB), syncytiotrophoblast (STB), and extravillous trophoblast (EVT) from the TE.
- Gastrulation cell types: such as primitive streak (PriS), definitive endoderm, mesoderm, and amnion cells [7].
Table 1: Composition of an Integrated Human Embryo scRNA-seq Reference Dataset
| Developmental Stage | Key Cell Populations Resolved | Number of Cells in Reference |
|---|---|---|
| Pre-implantation | Zygote, Morula, Trophectoderm (TE), Inner Cell Mass (ICM) | Integrated data from 6 published datasets [7] |
| Early Post-implantation | Epiblast (EPI), Hypoblast, Cytotrophoblast (CTB) | |
| Gastrulation (Carnegie Stage 7) | Primitive Streak, Definitive Endoderm, Mesoderm, Amnion, Extraembryonic Mesoderm | |
| Total Cells | 3,304 [7] |
Mapping Cell Fate Decisions: From Lineage Trajectories to Regulatory Networks
Beyond static cataloging, scRNA-seq enables the dynamic reconstruction of developmental pathways. Computational methods infer pseudotime, ordering cells along a continuum of differentiation to model the progression from pluripotency to committed states [26] [28].
Application of trajectory analysis to the integrated human embryo reference revealed three distinct lineage trajectories originating from the zygote, each associated with specific transcription factors [7]:
- Epiblast trajectory: 367 transcription factor genes were dynamically regulated, including a decrease in NANOG and POU5F1 post-implantation and an increase in HMGN3 [7].
- Hypoblast trajectory: 326 transcription factor genes were modulated, featuring early expression of GATA4 and SOX17 and upregulation of FOXA2 and HMGN3 in later stages [7].
- Trophectoderm trajectory: 254 transcription factor genes were identified, with early expression of CDX2 and NR2F2 and increased expression of GATA2, GATA3, and PPARG during cytotrophoblast development [7].
Multiomic technologies, which simultaneously profile gene expression and chromatin accessibility in the same cell, further bridge the gap between lineage and regulation. The SUM-seq method, for example, can link transcription factor activity, enhancer dynamics, and the expression of their target genes during processes like macrophage polarization, a principle directly applicable to embryogenesis [29].
Table 2: Key Findings from scRNA-seq in Embryology
| Application Area | Finding | Implication |
|---|---|---|
| Lineage Specification | Identification of distinct transcriptional states during mouse early gastrulation (E5.5-E6.5), revealing a primitive streak population and subclusters of uncommitted EPI cells [27]. | Provides a high-resolution map of exit from pluripotency and lineage commitment. |
| Cross-Species Comparison | Integration of human and mouse atlases reveals that cell-type similarity in orthologous gene expression overrides species differences [25]. | Identifies conserved and divergent transcriptional programs in mammalian development. |
| Stem Cell-Based Models | An integrated scRNA-seq reference tool authenticates stem cell-based embryo models by benchmarking their transcriptomic fidelity to in vivo counterparts [7]. | Provides a universal standard for validating the utility of in vitro models of human development. |
| Regulatory Dynamics | Single-cell ultra-high-throughput multiplexed chromatin and RNA profiling (SUM-seq) reveals gene regulatory networks underlying cell differentiation [29]. | Unravels the complex interplay between transcription factors, enhancers, and gene expression in fate decisions. |
Detailed Experimental Protocols
Protocol 1: Constructing an Integrated Embryo Reference Using scRNA-seq
This protocol outlines the creation of a comprehensive transcriptional roadmap for human embryogenesis, essential for benchmarking embryo models and annotating query datasets [7].
I. Experimental Workflow
II. Key Reagents and Equipment
- Biological Samples: Human preimplantation embryos, 3D cultured postimplantation blastocysts, and in vivo gastrula (e.g., Carnegie Stage 7) samples [7].
- Software for Alignment: Standardized pipeline (e.g., HISAT2) using GRCh38 human genome reference [7] [28].
- Software for Integration: Fast mutual nearest neighbor (fastMNN) method for batch correction and integration [7].
- Software for Analysis:
III. Procedure
- Data Collection & Reprocessing: Collect raw sequencing data from public repositories. Reprocess all datasets uniformly using the same genome reference (GRCh38) and a standardized alignment/counting pipeline to minimize technical batch effects [7].
- Data Integration: Employ the fastMNN algorithm to integrate the expression profiles of all cells (e.g., 3,304 cells) into a common low-dimensional space [7].
- Visualization & Clustering: Generate a Uniform Manifold Approximation and Projection (UMAP) plot to visualize the integrated data. Perform graph-based clustering to identify distinct cell populations [7] [28].
- Lineage Annotation: Annotate cell clusters based on known marker genes (e.g., POU5F1 for epiblast, SOX17 for hypoblast, TBXT for primitive streak) and contrast with original study annotations [7].
- Trajectory & Regulatory Inference: Use Slingshot to infer developmental trajectories and pseudotime. Apply SCENIC analysis to identify cell-type-specific transcription factor regulons [7].
- Validation & Tool Deployment: Validate lineage annotations against independent human and non-human primate datasets. Build a user-friendly online prediction tool where new datasets can be projected for annotation [7].
Protocol 2: Multiomic Profiling of Gene Regulation with SUM-seq
This protocol describes SUM-seq, a highly scalable method for co-assaying chromatin accessibility (snATAC-seq) and gene expression (snRNA-seq) in the same nucleus, ideal for dissecting gene regulatory dynamics during embryogenesis [29].
I. Experimental Workflow
II. Key Reagents and Equipment
- Nuclei Preparation: Glyoxal for fixation; glycerol for cryopreservation [29].
- Indexing Reagents:
- ATAC: Tn5 transposase pre-loaded with barcoded oligos.
- RNA: Barcoded oligo-dT primers for reverse transcription.
- Additive: Polyethylene glycol (PEG) to increase mRNA capture efficiency [29].
- Barcoding & Sequencing: 10x Chromium controller and library kits; Illumina sequencer [29].
- Blocking Reagent: Blocking oligonucleotide to mitigate barcode hopping in overloaded droplets [29].
III. Procedure
- Nuclei Preparation & Fixation: Isolate nuclei from embryonic tissues or embryo models. Fix nuclei with glyoxal to preserve molecular information. Samples can be cryopreserved at this stage [29].
- First-Step Indexing (Sample Multiplexing):
- Distribute fixed nuclei into aliquots. For each sample, introduce unique sample indices for both ATAC and RNA modalities via Tn5 tagmentation and reverse transcription, respectively [29].
- Sample Pooling & Droplet Barcoding: Pool all indexed samples together. Overload the pooled nuclei into a 10x Chromium channel to achieve high throughput. Within the droplets, fragments receive a second, cell-specific droplet barcode [29].
- Library Preparation & Sequencing: Break the droplets and pre-amplify the products. Split the library into two equal parts for modality-specific amplification and sequencing [29].
- Data Processing & Analysis: Use the SUM-seq Snakemake pipeline to demultiplex reads by sample index and droplet barcode, map reads, and generate matched gene expression and chromatin accessibility matrices. Infer enhancer-mediated gene regulatory networks (eGRNs) and TF activities [29].
Table 3: Key Research Reagent Solutions for Embryo scRNA-seq
| Item | Function/Description | Example Use Case |
|---|---|---|
| Barcoded Oligo-dT Beads | Capture polyadenylated mRNA from single cells/nuclei; contain UMI and cell barcode. | Core of droplet-based methods (10x Genomics, Drop-seq) for transcriptome counting [29] [9]. |
| Tn5 Transposase | Enzyme that simultaneously fragments and tags accessible genomic DNA. | Essential for snATAC-seq in multiomic protocols like SUM-seq [29]. |
| Nucleoside Analogs (4sU, 5-EU) | Metabolically incorporated into newly synthesized RNA, allowing its isolation and sequencing. | Studying RNA dynamics in time-resolved scRNA-seq during embryogenesis [30]. |
| Glyoxal Fixative | Crosslinking fixative that preserves RNA and chromatin structure better than formaldehyde. | Sample fixation for SUM-seq, compatible with frozen storage and multiomics [29]. |
| Polyethylene Glycol (PEG) | Additive that increases the efficiency of reverse transcription. | Boosts UMI and gene counts per cell in scRNA-seq protocols [29]. |
Table 4: Essential Computational Tools & Databases
| Resource | Type | Application |
|---|---|---|
| Seurat | R Software Package | Industry-standard for scRNA-seq data analysis, including QC, integration, clustering, and visualization [28] [31]. |
| Cell Ranger | Pipeline | Official 10x Genomics software for demultiplexing, alignment, and UMI counting from raw sequencing data [31]. |
| SCENIC | R/Python Package | Infers transcription factor regulons and cellular regulatory networks from scRNA-seq data [7]. |
| Slingshot | R Package | Infers developmental trajectories and pseudotime from scRNA-seq data [7]. |
| Human Embryo Reference | Database | Integrated transcriptomic roadmap from zygote to gastrula for benchmarking and annotation [7]. |
| SUM-seq Pipeline | Snakemake Pipeline | Processes ultra-high-throughput multiomic data, assigning reads and generating expression/accessibility matrices [29]. |
Single-cell RNA sequencing (scRNA-seq) has revolutionized biological research by enabling the profiling of transcriptomes at the level of individual cells. This technology provides an unparalleled view of cellular heterogeneity, revealing rare cell populations, developmental trajectories, and complex molecular interactions within tissues [32]. For embryo cell profiling research, scRNA-seq offers a powerful tool to decipher the intricate processes of development, differentiation, and tissue specification at unprecedented resolution. The core workflow encompasses a series of critical steps, from the initial isolation of viable cells to sophisticated computational analysis, each requiring careful optimization to ensure the generation of high-quality, biologically meaningful data [33] [34]. This application note details a standardized and optimized protocol for scRNA-seq, with specific considerations for high-throughput studies of embryonic systems.
Sample Preparation and Cell Isolation
The foundation of a successful scRNA-seq experiment lies in the preparation of high-quality single-cell suspensions. This step is particularly crucial for embryonic tissues, which can be fragile and contain diverse, rapidly changing cell types.
Tissue Dissociation and Cell Viability
Generating a comprehensive inventory of cell types from an embryo often requires the dissociation of multiple tissues or whole small embryos. It is advisable to process tissues from separate dissections to retain limited spatial information and allow for customized dissociation protocols tailored to different tissue characteristics [34]. The dissociation process itself can induce transcriptomic stress responses in cells. To mitigate this, performing digestions on ice is recommended, though it may prolong digestion times as most commercial enzymes are optimized for 37°C activity [34].
The Choice of Cells vs. Nuclei
A critical decision in experimental design is whether to sequence single cells or single nuclei:
- Single Cells: Ideal for capturing a greater number of mRNAs, as the cytoplasmic RNA content is higher than that of the nucleus. This is the standard approach for most applications [34].
- Single Nuclei: Advantageous for tissues where cells are difficult to isolate intact (e.g., due to complex morphology or extensive processes) or for archived samples. This approach focuses on actively transcribed genes and is compatible with multiome studies that combine transcriptomics with assays for open chromatin (e.g., ATAC-seq) [34].
In general, single nuclei data are comparable to their single-cell counterparts, though some cell types may show different distributions between the two methods [34].
Fixation Strategies
Fixation-based methods can be employed to stabilize the transcriptome and minimize artifactual changes induced during dissociation. Options include:
- Methanol Maceration (ACME): Optimized for single-cell sequencing [34].
- Reversible DSP Fixation: Applied immediately following cell dissociation to "pause" the cellular state [34]. Fixed samples are particularly beneficial for fluorescence-activated cell sorting (FACS), as fixation stops the transcriptomic response and allows for safer storage and transport [17] [34].
Cell Sorting and Enrichment
Fluorescence-Activated Cell Sorting (FACS) is a valuable tool for:
- Debris Elimination: Using live/dead stains to clean cell suspensions.
- Specific Cell Enrichment: Isolating rare populations based on fluorophore expression (e.g., in transgenic lines) or antibody labeling of surface markers [34]. When working with fixed cells, FACS is the preferred method for enrichment. However, sorting carries the risk of introducing cell stress artifacts or selectively losing more fragile cell types, and must be carefully optimized [34].
Single-Cell Partitioning, Barcoding, and Library Preparation
Following cell isolation, the next phase involves capturing individual cells, labeling their RNA content with unique barcodes, and preparing sequencing libraries.
Core Principle of Barcoding
The fundamental goal is to tag all mRNA molecules from a single cell with a unique cellular barcode that distinguishes them from transcripts of all other cells. This allows the sequencing output from a pool of thousands of cells to be computationally demultiplexed, reconstructing the individual transcriptome of each cell [17]. Additionally, Unique Molecular Identifiers (UMIs) are added to each transcript molecule to correct for amplification bias and enable accurate digital counting of original mRNA molecules [17].
Commercial Platform Options
The choice of platform depends on project scale, sample number, and cell type.
Table 1: Comparison of Commercial scRNA-seq Solutions
| Commercial Solution | Capture Platform | Throughput (Cells/Run) | Capture Efficiency | Sample Multiplexing | Nuclei Capture | Fixed Cell Support |
|---|---|---|---|---|---|---|
| 10x Genomics Chromium | Microfluidic oil partitioning | 500 - 20,000 [34] | 70-95% [34] | 1-8 samples [34] | Yes [34] | Yes [17] [34] |
| Parse Biosciences | Multiwell-plate (Combinatorial barcoding) | 1,000 - 1 Million [34] [35] | >85% [34] (Note: Cell recovery ~27% [35]) | Up to 96-384 samples [34] [35] | Yes [34] | Yes [34] |
| BD Rhapsody | Microwell partitioning | 100 - 20,000 [34] | 50-80% [34] | Up to 12 samples [34] | Yes [34] | Yes [34] |
| Fluent/PIPseq (Illumina) | Vortex-based oil partitioning | 1,000 - 1 Million [34] | >85% [34] | No [34] | No [34] | Yes [34] |
The Barcoding Workflow: A 10x Genomics Example
The following diagram illustrates the typical journey of an mRNA molecule through a droplet-based barcoding and library preparation workflow, as used in 10x Genomics and similar platforms.
Cell Partitioning and Barcoding: A suspension of single cells or nuclei is loaded onto a microfluidic chip alongside reagents, including gel beads coated with barcoded oligonucleotides. The instrument generates Gel Beads-in-Emulsion (GEMs), where each droplet ideally contains a single cell and a single gel bead. Within the GEM, the cell is lysed, releasing mRNA. The gel bead dissolves, and the barcoded primers bind to the poly-A tails of mRNAs. Reverse transcription then occurs, producing cDNA molecules each tagged with the cell's unique 10x Barcode and a UMI [17].
cDNA Amplification and Library Preparation: The GEMs are broken, and the barcoded cDNA is purified and amplified by PCR. The amplified cDNA is then enzymatically fragmented to an optimal size for sequencing. In a subsequent Sample Index PCR step, platform-specific adapter sequences (e.g., P5 and P7 for Illumina) and sample index sequences are added, resulting in the final sequencing-ready library [17].
Sequencing and Data Analysis Pipeline
After library preparation and sequencing, the raw data undergoes a multi-step computational analysis to extract biological insights.
From Raw Data to Count Matrix
The initial data processing involves:
- Demultiplexing: Converting raw sequencing files (BCL) into FASTQ files.
- Alignment and Quantification: Using tools like Cell Ranger (10x Genomics' official pipeline) to map sequencing reads to a reference genome and generate a feature-barcode matrix. This matrix records the number of UMIs per gene per cell, providing a digital count of gene expression [33] [36].
Key Bioinformatics Tools for Downstream Analysis
A robust ecosystem of bioinformatics tools exists for analyzing scRNA-seq data. The choice often depends on the researcher's preference for R or Python.
Table 2: Essential Bioinformatics Tools for scRNA-seq Analysis
| Tool | Language | Primary Function | Key Features in 2025 |
|---|---|---|---|
| Seurat [33] [36] | R | Comprehensive analysis and integration | Most mature and flexible R toolkit; supports spatial transcriptomics, multiome data, and label transfer [36]. |
| Scanpy [36] | Python | Large-scale scRNA-seq analysis | Optimized for millions of cells; integrates with scvi-tools and Squidpy [36]. |
| Cell Ranger [36] | - | Primary data processing | Gold standard for processing raw 10x Genomics data into count matrices [36]. |
| scvi-tools [36] | Python | Deep generative modeling | Uses variational autoencoders for superior batch correction and data integration [36]. |
| Harmony [36] | R/Python | Batch effect correction | Efficiently integrates datasets across batches or donors while preserving biological variation [36]. |
| Monocle 3 [36] | R | Trajectory inference | Models developmental lineages and pseudotemporal ordering of cells [36]. |
| Velocyto [36] | Python | RNA velocity | Infers future cell states by quantifying spliced and unspliced mRNAs [36]. |
| CellBender [36] | Python | Ambient RNA removal | Uses deep learning to clean background noise in droplet-based data [36]. |
Standard Computational Workflow
The downstream analysis typically follows a standardized path, as visualized below.
Quality Control (QC): Cells are filtered based on metrics such as the number of detected genes, total UMI counts, and the percentage of mitochondrial reads. This removes low-quality cells, dead cells, and empty droplets [33]. For example, one study filtered out cells with fewer than 200 or more than 2500 genes and those with >5% mitochondrial reads [33].
Normalization and Scaling: Data is normalized to account for differences in sequencing depth between cells (e.g., using "LogNormalize" in Seurat). Highly variable genes are identified for downstream analysis, and data is scaled to regress out unwanted sources of variation like cell cycle effects or mitochondrial percentage [33].
Dimensionality Reduction and Clustering: Principal Component Analysis (PCA) is performed on the scaled data. Significant principal components are used for graph-based clustering, which groups cells based on transcriptional similarity. Cells are visualized in two dimensions using methods like UMAP (Uniform Manifold Approximation and Projection) or t-SNE, where each dot represents a cell and clusters are readily visible [33] [36].
Cell Type Annotation: Clusters are annotated into cell types by identifying differentially expressed genes (marker genes) for each cluster and comparing them to known cell-type-specific markers from the literature or existing databases (e.g., PanglaoDB, CellMarker) [37].
Advanced Analysis: Cell-Cell Communication
A common advanced application is inferring intercellular communication networks. Tools like CellChat and frameworks like LIANA leverage curated databases of ligand-receptor interactions to predict potential communication events between identified cell clusters [38]. This is particularly powerful for understanding signaling dynamics within the embryonic microenvironment.
The Scientist's Toolkit
Table 3: Essential Research Reagent Solutions and Materials
| Item | Function | Examples / Notes |
|---|---|---|
| Commercial scRNA-seq Kits | Provides all necessary reagents for library prep from cells. | 10x Genomics Chromium Next GEM Kits [33], Parse Biosciences Evercode [35]. |
| Fluorescence-Activated Cell Sorter (FACS) | Isolates specific cell populations or removes debris from suspension. | Critical for enriching rare cell types or cleaning difficult samples [34]. |
| Viability Stains | Distinguishes live cells from dead cells during sorting. | e.g., Propidium Iodide, DAPI. Reduces ambient RNA from dead cells [34]. |
| Dissociation Enzymes | Breaks down extracellular matrix to create single-cell suspensions. | Collagenase, Trypsin; activity often temperature-sensitive [34]. |
| Fixation Reagents | Stabilizes the transcriptome for storage or later processing. | Methanol (ACME protocol) [34], Dithio-bis(succinimidyl propionate) (DSP) [34]. |
| Bioinformatic Databases | Provides reference for cell annotation and analysis. | CellMarker, PanglaoDB [37], Ligand-Receptor interaction databases [38]. |
From Data to Discovery: Methodologies and Applications in Embryo Research
The construction of a universal, high-quality reference atlas from single-cell RNA sequencing (scRNA-seq) data of human embryos is a critical endeavor in developmental biology and stem cell research. Such a resource serves as an essential benchmark for authenticating stem cell-based embryo models, which are vital tools for overcoming the ethical and technical limitations associated with direct human embryo research [7] [1]. The usefulness of these in vitro models hinges entirely on their demonstrated fidelity to in vivo development, necessitating unbiased, transcriptome-wide comparisons [7]. This Application Note details the experimental and computational protocols for integrating multiple human embryo scRNA-seq datasets into a comprehensive reference, framed within the broader context of high-throughput scRNA-seq for embryo cell profiling.
Application Notes: The Value of an Integrated Embryo Reference
An integrated scRNA-seq reference provides a transcriptional roadmap of human embryogenesis, from the zygote through gastrulation. It enables several key applications:
- Authentication of Embryo Models: It allows researchers to project data from stem cell-derived embryo models (e.g., blastoids, gastruloids) onto the reference to assess their cellular composition and transcriptional similarity to real embryos, thereby quantifying their fidelity [7] [1].
- Cell Identity Annotation: The reference acts as a high-dimensional dictionary for annotating cell types and states in new, uncharacterized scRNA-seq datasets from human embryos or related models, using label-centric projection methods [39] [40].
- Discovery of Developmental Trajectories: Integrated data reveals continuous developmental progressions and lineage relationships, allowing for the inference of pseudotemporal ordering and the identification of key transcription factors driving cell fate decisions [7].
The need for this resource is underscored by the risk of misannotation in embryo models when analyses rely on limited markers or irrelevant references, rather than a comprehensive, integrated human embryo atlas [7].
Experimental Protocol: Data Collection and Preprocessing
The following protocol outlines the steps for creating a unified reference from publicly available human embryo scRNA-seq datasets.
Data Sourcing and Selection
- Objective: Curate multiple scRNA-seq datasets covering a continuous developmental window.
- Procedure:
- Identify published scRNA-seq studies of human embryos from stages of zygote to gastrula (e.g., preimplantation embryos, postimplantation blastocysts cultured in 3D, and in vivo gastrula samples) [7].
- Ensure datasets include key lineage annotations: Inner Cell Mass (ICM), Epiblast (EPI), Hypoblast, Trophectoderm (TE), and its derivatives (Cytotrophoblast/CTB, Syncytiotrophoblast/STB, Extravillous Trophoblast/EVT), and gastrula lineages like Primitive Streak (PriS), Mesoderm, Definitive Endoderm (DE), and Amnion [7] [1].
- Obtain raw sequencing data (FASTQ files) or unique molecular identifier (UMI) count matrices from public repositories.
Standardized Data Reprocessing
- Objective: Minimize technical batch effects introduced by different laboratory and computational protocols.
- Procedure:
- Mapping and Feature Counting: Reprocess all raw sequencing data through a unified pipeline.
- Genome Reference: Use a consistent human genome reference (e.g., GRCh38) and annotation for all datasets [7].
- Tools: Standard tools like
Cell Ranger(10x Genomics data) orSTARsolocan be used.
- Quality Control and Filtering:
- Filter out cells with an unusually low or high number of detected genes.
- Exclude cells with a high percentage of mitochondrial reads, indicating poor cell viability.
- Remove genes detected in fewer than a minimum number of cells (e.g., 3 cells) [40].
- Normalization and Scaling:
- Feature Selection: Identify highly variable genes (HVGs) that will be used for downstream integration and analysis. This focuses the analysis on biologically relevant genes [39] [40].
- Mapping and Feature Counting: Reprocess all raw sequencing data through a unified pipeline.
Computational Protocol: Data Integration and Analysis
This protocol describes the computational methods for harmonizing the preprocessed datasets and building the reference tool.
Batch Correction and Data Integration
- Objective: Align datasets in a shared low-dimensional space to facilitate joint analysis while preserving biological variation.
- Procedure:
- Select an Integration Algorithm: Choose a method capable of handling non-linear batch effects. Benchmarking studies are recommended, but common choices include:
- fastMNN: A mutual nearest neighbor-based method used successfully for human embryo data integration [7].
- cVAE-based methods (e.g., scVI, sysVI): Particularly useful for integrating datasets with substantial technical or biological differences (e.g., across species or protocols). The sysVI method, which uses VampPrior and cycle-consistency, has been shown to improve integration in such challenging scenarios [41].
- Execute Integration: Run the chosen algorithm using the highly variable genes from all datasets. The output is a corrected matrix or a shared low-dimensional embedding (e.g., in PCA space) for all cells.
- Select an Integration Algorithm: Choose a method capable of handling non-linear batch effects. Benchmarking studies are recommended, but common choices include:
Dimensionality Reduction and Visualization
- Objective: Visualize the integrated data to observe developmental trajectories and cell-type relationships.
- Procedure:
- Perform dimensionality reduction on the integrated data using Uniform Manifold Approximation and Projection (UMAP) or t-SNE.
- Generate a UMAP plot colored by dataset of origin to visually confirm successful batch correction.
- Generate a UMAP plot colored by cell type and developmental stage to observe the biological structure [7].
Reference Tool Construction and Label Transfer
- Objective: Build a tool that can automatically annotate cell identities in a new query dataset.
- Procedure:
- Stabilize the Reference: Fix the integrated dataset (e.g., the UMAP embedding and cell labels) to serve as a static reference [7].
- Implement a Projection Method: Employ a label-centric algorithm to project query cells onto the reference. Options include:
- scmap: Projects cells or clusters from a query dataset to the closest reference cell-type based on a pre-built index [39].
- scCompare: Transfers phenotypic labels based on correlation to prototype signatures derived from the reference clusters, with statistical thresholds for unmapping novel cell types [40].
- Build a User Interface: For broad accessibility, create a user-friendly online tool, such as a Shiny app, that allows researchers to upload their query data and receive predicted cell identities [7].
Downstream Biological Analysis
- Objective: Extract biological insights from the integrated reference.
- Procedure:
- Trajectory Inference: Use tools like Slingshot on the UMAP embedding to infer developmental lineages and calculate pseudotime for each cell [7].
- Differential Expression & Marker Gene Identification: Find genes that are significantly enriched in specific cell clusters or lineages compared to all other cells.
- Regulatory Network Inference: Perform SCENIC analysis to identify active gene regulatory networks and key transcription factors for each cell state [7].
Data Presentation
Table 1: Key Metrics for an Integrated Human Embryo scRNA-seq Reference
This table summarizes quantitative aspects of a successfully constructed reference, as demonstrated in recent studies [7].
| Metric | Description | Exemplary Value from Literature |
|---|---|---|
| Total Cells Integrated | The number of high-quality single-cell transcriptomes in the final reference. | 3,304 cells [7] |
| Developmental Window | The embryonic stages covered by the reference. | Zygote to Carnegie Stage 7 (E16-19) [7] |
| Number of Datasets | The count of independent studies integrated. | 6 published datasets [7] |
| Key Lineages Captured | Major cell types and lineages annotated. | EPI, Hypoblast, TE, CTB, STB, EVT, PriS, Mesoderm, DE, Amnion [7] |
| Trajectories Inferred | Number of distinct developmental paths analyzed. | 3 main trajectories (EPI, Hypoblast, TE) [7] |
| Transcription Factors Analyzed | Number of TFs with modulated expression along trajectories. | 367 (EPI), 326 (Hypoblast), 254 (TE) [7] |
Table 2: Essential Research Reagent Solutions
This table lists key computational tools and resources required for building and utilizing the universal reference.
| Item Name | Function / Description | Application in Protocol |
|---|---|---|
| SCANPY / Seurat | Comprehensive toolkits for single-cell data analysis in Python/R. | Data preprocessing, normalization, HVG selection, clustering, and UMAP visualization [40]. |
| fastMNN / Harmony | Batch effect correction algorithms. | Integrating multiple datasets into a shared space during the computational protocol [7]. |
| scVI / sysVI | Deep generative models (cVAEs) for scRNA-seq data integration. | Advanced integration, especially for datasets with substantial batch effects (e.g., cross-species) [41]. |
| SCENIC | Tool for inferring gene regulatory networks. | Identifying key transcription factors and regulatory activity in different embryonic cell states [7]. |
| Slingshot | Algorithm for inferring developmental trajectories. | Mapping lineage paths and ordering cells by pseudotime in the integrated reference [7]. |
| scmap / scCompare | Label-transfer and cell-type projection tools. | Annotating cell types in a new query dataset by projecting it onto the established reference [39] [40]. |
| Human Genome GRCh38 | Standardized reference genome and annotation. | Unified genomic alignment for all datasets during preprocessing to minimize technical variation [7]. |
Mandatory Visualization
Diagram 1: Workflow for Building a Universal Embryo scRNA-seq Reference
Diagram 2: Logical Structure of the Integrated Embryo Atlas
Lineage annotation and trajectory inference represent cornerstone methodologies in modern developmental biology, enabling the deconvolution of complex cellular decision-making processes during embryogenesis. The advent of high-throughput single-cell RNA sequencing (scRNA-seq) has provided an unprecedented lens through which to observe the continuum of cellular states, moving beyond static snapshots to dynamic models of differentiation [42]. These analyses allow researchers to characterize the molecular progression of all embryonic cell lineages, from pluripotency to terminal differentiation, and to understand how cell-cell signaling pathways control lineage choices at every step [43]. The fundamental goal is to reconstruct developmental trajectories by ordering individual cells along a pseudotemporal axis based on transcriptional similarity, thereby revealing the sequence of molecular events that drive cell fate specification [44].
In the context of human embryo research, where ethical and technical limitations restrict access to precious samples, these computational approaches have become particularly valuable [7] [1]. They provide a powerful strategy for benchmarking stem cell-derived embryo models against their in vivo counterparts, offering unbiased assessment of transcriptional fidelity [7]. Furthermore, trajectory inference has illuminated previously unrecognized routes of development, such as the discovery of abundant direct neurogenesis bypassing intermediate progenitors in the human developing neocortex [45]. As the field progresses toward comprehensive human embryo reference atlases, integrating data from zygote to gastrula stages, lineage annotation and trajectory inference serve as essential computational frameworks for deciphering the blueprint of human development [7].
Theoretical Foundations: From Single-Cell Data to Lineage Maps
Core Computational Concepts
The transformation of single-cell expression data into lineage trajectories relies on several key computational principles. Pseudotime is defined as a quantitative metric representing a cell's relative progression along a dynamic biological process, such as differentiation [44]. It is important to note that "pseudotime" does not necessarily correlate directly with real chronological time but rather describes progression through a transcriptional continuum [44]. For branched trajectories, multiple pseudotime values are typically generated—one for each path through the trajectory—and these values are not directly comparable across paths [44].
The analysis workflow begins with dimensionality reduction, where high-dimensional gene expression data is transformed into a lower-dimensional space using techniques such as principal component analysis (PCA), t-distributed stochastic neighbor embedding (t-SNE), or Uniform Manifold Approximation and Projection (UMAP) [43]. UMAP has gained prominence as it preserves more global data structure than t-SNE with faster computation times, providing better resolution of transitional states between main cell clusters [43]. Cells are then clustered based on their expression profiles, and trajectory inference algorithms apply various mathematical approaches to reconstruct the paths connecting these clusters [42] [44].
Trajectory Inference Algorithms
Multiple computational methods have been developed for trajectory inference, each with distinct strengths and methodological approaches. The TSCAN algorithm employs a cluster-based minimum spanning tree (MST) approach, where cluster centroids are computed by averaging coordinates of member cells, and the MST—an undirected acyclic graph that passes through each centroid exactly once—is constructed to capture transitions between clusters [44]. This approach offers computational efficiency and stability against per-cell noise, though it may overlook variation within overly broad clusters [44].
Slingshot represents an alternative approach that fits principal curves through the cellular data cloud, effectively providing a non-linear generalization of PCA where the axes of most variation are allowed to bend [44]. This method can capture continuous trajectories without relying exclusively on discrete clusters. More recently, tradeSeq has emerged as a powerful generalized additive model framework based on the negative binomial distribution that allows flexible inference of both within-lineage and between-lineage differential expression [46]. Unlike earlier methods that test only whether genes are associated with branching events, tradeSeq provides several distinct tests that pinpoint specific types of differential expression patterns, leading to clearer biological interpretation [46].
Table 1: Comparison of Major Trajectory Inference Methods
| Method | Statistical Approach | Strengths | Limitations |
|---|---|---|---|
| TSCAN | Cluster-based minimum spanning tree | Computational efficiency; intuitive interpretation; robust to noise | May miss intra-cluster variation; struggles with complex trajectories |
| Slingshot | Principal curves | Continuous trajectory modeling; less reliant on discrete clustering | Limited capability for complex branching patterns |
| Monocle 2 | Reversed graph embedding | Handles complex tree structures | Restricted to specific dimensionality reduction methods |
| tradeSeq | Generalized additive models (GAMs) | Flexible within- and between-lineage DE testing; clear interpretation | Requires pre-calculated pseudotime |
| GPfates | Gaussian processes | Models uncertainty in trajectory inference | Limited to simple bifurcations |
Experimental Protocols for Trajectory Inference
Sample Preparation and Single-Cell Sequencing
The foundation of successful trajectory analysis lies in proper sample preparation and sequencing. For embryonic tissues, careful dissociation is required to liberate individual cells while preserving RNA integrity [43]. Current capture methods include:
- Microwell plates (microwell-seq)
- High-throughput droplet encapsulation (Drop-Seq, inDrops)
- Single cell combinatorial indexing (sci-seq)
Microdroplet methods utilize microfluidics to partition samples into thousands of droplets containing single cells, following a Poisson distribution where many droplets contain zero cells, some contain one cell, and a few contain multiple cells [43]. Following capture, cells are lysed and mRNA is reverse transcribed with cellular barcodes that allow assignment of sequences to their cell of origin after multiplexed sequencing [43]. Unique molecular identifiers (UMIs) are incorporated to distinguish between different mRNA molecules from the same gene, enabling accurate transcript counting.
Computational Analysis Workflow
Data Processing and Quality Control The initial computational step involves constructing a gene × cell read count matrix by aligning reads to a reference genome or transcriptome [43]. Quality control metrics include:
- Number of counts per barcode (count depth)
- Number of genes per barcode
- Fraction of counts from mitochondrial genes (indicator of cell stress or damage)
Cells with high mitochondrial gene expression or low gene detection are typically filtered out, as these may represent dying cells or technical artifacts [43]. Expression values are normalized to account for differences in sequencing depth between cells, often using methods that stabilize variance across the dynamic range of expression.
Dimensionality Reduction and Clustering Following quality control, highly variable genes (HVGs) are identified to focus subsequent analysis on genes with meaningful biological variation rather than technical noise [43]. Dimensionality reduction techniques such as PCA are applied to these HVGs, and the resulting components are used for visualization (UMAP/t-SNE) and clustering. Clustering algorithms group cells based on transcriptional similarity, defining the discrete cell states that will serve as nodes for trajectory reconstruction.
Trajectory Inference with Slingshot The Slingshot algorithm can be implemented through the following step-by-step protocol:
- Input Preparation: Processed count data or reduced-dimensionality coordinates (e.g., PCA components)
- Cluster Identification: Define cellular clusters using methods like Seurat or Scanpy
- Global Lineage Structure: Slingshot infers global lineage structure using cluster-based minimum spanning tree
- Smoothing Curves: Construct smooth lineage curves through the ordered clusters
- Pseudotime Calculation: Project cells onto curves to calculate pseudotime values
For complex trajectories with multiple branches, Slingshot identifies shared and lineage-specific segments, assigning each cell a pseudotime value for each lineage it belongs to [44]. The algorithm efficiently handles trajectories with multiple branches and endpoints, making it suitable for modeling complex differentiation processes.
Diagram 1: scRNA-seq Trajectory Analysis Workflow. The standard pipeline from raw sequencing data to biological insights involves sequential steps of quality control, dimensionality reduction, clustering, and trajectory inference.
Differential Expression Analysis with tradeSeq
Once pseudotime values are established, tradeSeq enables sophisticated differential expression analysis along lineages. The method models gene expression measures as nonlinear functions of pseudotime using generalized additive models (GAMs) based on the negative binomial distribution [46]. The core statistical model is:
$$\left{\begin{array}{lll}{Y}{gi} \sim NB({\mu }{gi},{\phi }{g})\ {\mathrm{log}}\,({\mu }{gi})={\eta }{gi} \quad \ {\eta }{gi}=\sum {l=1}^{L}{s}{gl}({T}{li}){Z}{li}+{{\bf{U}}}{i}{{\boldsymbol{\alpha }}}{g}+{\mathrm{log}}\,({N}_{i})\end{array}\right.$$
Where:
- $Y_{gi}$ represents read counts for gene $g$ in cell $i$
- $\mu_{gi}$ is the cell- and gene-specific mean
- $\phi_g$ is the gene-specific dispersion parameter
- $s{gl}$ are lineage-specific smoothing splines functions of pseudotime $T{li}$
- $Z_{li}$ is the assignment of cells to lineages
- $Ui$ represents cell-level covariates with coefficients $\alphag$
- $N_i$ is the cell-specific offset for sequencing depth
The implementation protocol for tradeSeq includes:
- Input Preparation: Pseudotime values and cell lineage assignments from Slingshot
- Model Fitting: Fit negative binomial GAMs for each gene using the
fitGAMfunction - Association Testing: Test genes for significant association with pseudotime using
associationTest - Pattern Analysis: Identify different expression patterns between lineages with
patternTest - Early Differentiation: Detect genes that are differentially expressed early in the trajectory using
earlyDETest
tradeSeq provides distinct advantages over earlier methods by specifically testing for different classes of differential expression: genes associated with the trajectory, genes with different expression patterns between lineages, and genes involved in early lineage decisions [46].
Applications in Embryo Development Research
Case Study: Human Embryogenesis Atlas
A comprehensive human embryo reference tool integrating six published scRNA-seq datasets demonstrates the power of trajectory analysis for mapping development from zygote to gastrula [7]. This integrated atlas comprises 3,304 early human embryonic cells, with Slingshot trajectory inference revealing three main trajectories corresponding to epiblast, hypoblast, and trophectoderm lineages [7]. The analysis identified 367 transcription factor genes showing modulated expression along the epiblast trajectory, 326 along the hypoblast trajectory, and 254 along the trophectoderm trajectory [7].
Notably, transcription factors such as DUXA and FOXR1 exhibited high expression during morula stages but decreased during development across all three lineages, while lineage-specific factors like GATA4 and SOX17 showed early expression in the hypoblast trajectory [7]. This application highlights how trajectory inference can systematically map the transcriptional programs driving lineage specification during critical stages of human development.
Case Study: Neocortical Development
Trajectory analysis has revealed unexpected routes of neurogenesis in the human developing neocortex. Through live imaging of hundreds of dividing basal radial glial cells (bRGs) combined with fixed-cell fate mapping, researchers discovered abundant direct neurogenesis bypassing intermediate progenitors [45]. This finding challenges the conventional model of cortical neurogenesis and demonstrates how single-cell approaches can uncover previously unrecognized fate decision mechanisms.
The analysis revealed that bRG cells undergo frequent self-consuming direct neurogenic divisions, particularly in the upper part of the subventricular zone, with asymmetric Notch activation in self-renewing daughter cells independent of basal fibre inheritance [45]. This case study exemplifies how trajectory inference can be complemented with live imaging to validate computational predictions and establish novel biological mechanisms.
Table 2: Key Signaling Pathways in Embryonic Cell Fate Decisions
| Signaling Pathway | Role in Development | Key Molecular Components | Developmental Stage |
|---|---|---|---|
| Notch Signaling | Asymmetric cell division; progenitor maintenance | Notch receptors, Delta/Jagged ligands | Neurogenesis [45] |
| ANNEXIN Pathway | Heart development; cellular communication | Annexin proteins | Fetal heart development (GW8-GW17) [47] |
| MIF Signaling | Cardiac cell differentiation; intercellular signaling | MIF cytokine, CD74 receptor | Fetal heart development [47] |
| OSM Pathway | Gradual decrease during cardiac maturation | OSM cytokine, OSMR receptor | Fetal heart development (GW8-GW17) [47] |
| NF-κB System | Immune response; cell survival; differentiation | RelA, RelB, c-Rel, p50, p52 subunits | Multiple stages [48] |
The Scientist's Toolkit: Essential Research Reagents and Computational Tools
Wet-Lab Reagents and Materials
Successful lineage trajectory analysis requires carefully selected reagents and experimental materials throughout the workflow:
- Tissue Dissociation Kits: Enzymatic mixtures (e.g., collagenase, trypsin) optimized for specific embryonic tissues to maintain cell viability while achieving single-cell suspensions
- Cell Viability Stains: Propidium iodide or DAPI for identifying dead cells during quality control
- Single-Cell Partitioning Reagents: Barcoded beads and partitioning oils for droplet-based systems (10x Genomics)
- Reverse Transcription Master Mix: For cDNA synthesis with template switching for full-length transcript capture
- PCR Amplification Reagents: For cDNA amplification with minimal bias
- Library Preparation Kits: For adding sequencing adapters with unique dual indices
- Cell Surface Antibodies: For hashtagging or CITE-seq to track multiple samples or protein levels
Computational Tools and Packages
- Slingshot: R package for trajectory inference using cluster-based minimum spanning trees and principal curves [44]
- tradeSeq: R package for differential expression analysis along trajectories using generalized additive models [46]
- Seurat: Comprehensive R toolkit for single-cell genomics, including clustering and visualization
- Scanpy: Python-based scalable toolkit for analyzing single-cell gene expression data
- Monocle 3: R package for trajectory analysis and differential expression testing
- SCENIC: R/Python package for simultaneous gene regulatory network reconstruction and cell-state identification [7]
Diagram 2: Cell Fate Decisions and Signaling Pathways. Schematic representation of lineage branching during embryogenesis, highlighting key transcription factors and signaling pathways that influence fate decisions at critical branch points.
Lineage annotation and trajectory inference have fundamentally transformed our approach to studying embryonic development, providing a dynamic view of cellular differentiation that was previously inaccessible. The integration of computational trajectory analysis with functional validation, such as the correlative live imaging and fixed-cell fate mapping approach used in neocortical development studies [45], represents a powerful strategy for establishing and testing models of how individual stem cells change through time to differentiate and self-renew [42].
As the field advances, several emerging trends promise to enhance these approaches further. The development of multi-omic single-cell technologies—simultaneously measuring transcriptome, epigenome, and proteome from the same cell—will provide richer data for trajectory inference. Computational methods are increasingly incorporating RNA velocity to predict future cell states based on splicing dynamics, adding temporal directionality to trajectory models. Additionally, spatial transcriptomics technologies are being integrated with trajectory analysis to map lineage decisions within their tissue context, bridging the gap between cellular genealogy and positional information.
For the field of human embryo research, these methodologies offer particular promise for authenticating stem cell-based embryo models through rigorous comparison to in vivo reference atlases [7] [1]. As these reference datasets expand and computational methods mature, lineage annotation and trajectory inference will continue to illuminate the complex choreography of human development, with profound implications for understanding congenital disorders, improving regenerative medicine, and unraveling the fundamental principles of cell fate decision-making.
Transcription factors (TFs) are fundamental proteins that regulate gene expression by binding to specific DNA sequences, thereby controlling crucial cellular processes including development, differentiation, and growth. In early embryonic development, the precise dynamics of TF activity drive the transformation from a single fertilized egg to a complex multicellular organism. The emergence of high-throughput single-cell RNA sequencing (scRNA-seq) has revolutionized our ability to profile these TF dynamics at unprecedented resolution, revealing the complex regulatory networks that orchestrate embryogenesis. This Application Note details how scRNA-seq methodologies can be systematically applied to identify and characterize key transcription factor regulators during early mammalian development, providing researchers with robust protocols and analytical frameworks for embryonic cell profiling research.
Transcription Factor Expression Patterns in Early Embryos
Dynamic TF Expression Modules
Single-cell RNA sequencing analyses of human preimplantation embryos have revealed that transcription factors exhibit distinct temporal expression patterns throughout early development. Systematically profiling 387 expressed TFs across consecutive developmental stages from oocyte to morula has identified four primary expression modules [49]:
- Maternal RNA Degradation Module (M1): Comprising 57 TFs (15% of expressed TFs), these maternal mRNAs are rapidly degraded after fertilization, with decreasing expression continuing until the four-cell stage.
- Minor Zygotic Genome Activation Module (M2): Including 174 TFs (45%), these factors show a rapid increase after fertilization and maintain high expression levels until the two-cell stage.
- Major Zygotic Genome Activation Module (M3): Containing 70 TFs (18%), these genes peak at the eight-cell stage followed by a rapid decrease.
- Mid-preimplantation Genome Activation Module (M4): Encompassing 86 TFs (22%), these factors increase rapidly from the four-cell stage and reach maximum expression at the morula stage.
Comparative Analysis of Biparental and Uniparental Embryos
Research comparing biparental (BI), parthenogenetic (PG), and androgenetic (AG) embryos has revealed both conserved and distinct TF networks. While uniparental embryos show overall similar TF expression trajectories with biparental embryos, critical differences exist, particularly during maternal RNA degradation and minor ZGA stages from one-cell to four-cell stages [49]. Network analysis has identified key hub TFs with different parental contributions:
Table 1: Hub Transcription Factors in Early Embryonic Development
| TF Category | Transcription Factors | Functional Significance |
|---|---|---|
| Shared TFs | ZNF480, ZNF581, PHB, POU5F1 | Validated in hESC differentiation; target genes responsible for stem cell maintenance and differentiation |
| Androgenic (AG) Specific | ZFN534, GTF3A, ZNF771, TEAD4, LIN28A | Paternally-expressed regulators |
| Parthenogenetic (PG) Specific | ZFP42 | The only maternally-specific hub TF identified |
Dominant Transcription Factor Families
Analysis of early embryogenesis has identified three dominant TF families that repeatedly appear during early development [49]:
- Zf-C2H2: Zinc finger C2H2 domain-containing TFs
- HMG: High Mobility Group box TFs
- MYB: Myeloblastosis viral oncogene homolog TFs
These families represent fundamental regulatory modules that coordinate the complex gene expression programs driving embryonic development.
Experimental Protocols for TF Analysis
Single-Cell RNA Sequencing for Comprehensive Transcriptome Profiling
SUPeR-seq Method for Poly(A)+ and Poly(A)- RNA Detection The Single-cell Universal Poly(A)-independent RNA sequencing (SUPeR-seq) method enables simultaneous detection of both polyadenylated and non-polyadenylated RNAs, providing a more complete transcriptome profile than standard poly(A)-dependent methods [50].
Table 2: Key Reagents for SUPeR-seq Protocol
| Reagent | Function | Specifications |
|---|---|---|
| Random Anchor Primers | Reverse transcription | AnchorX-T15N6 design |
| Terminal Deoxynucleotidyl Transferase (TdT) | Poly(A) tail addition | Adds poly(A) tail to 1st strand cDNA |
| dATP/ddATP Mixture | Tail length control | 100:1 ratio for optimal tail length |
| Second Strand Primer | cDNA synthesis | AnchorY-T24 design |
| 5'-amine-terminated PCR Primers | Library amplification | Prevents primer ligation to adaptors |
Protocol Workflow:
- Cell Lysis: Lyse individual cells in specific lysis buffer that minimizes rRNA amplification.
- Reverse Transcription: Use random primers (AnchorX-T15N6) instead of oligo(dT) to detect both poly(A)+ and poly(A)- RNA species.
- ExoSAP-IT Treatment: Digest excess primers to eliminate primer-dimer formation.
- Poly(A) Tailing: Add poly(A) tail to 3' end of synthesized first-strand cDNA using TdT with dATP/ddATP (100:1 ratio).
- Second-Strand Synthesis: Synthesize second-strand cDNA using AnchorY-T24 primer.
- PCR Amplification: Amplify cDNA using 5'-amine-terminated primers to reduce amplification bias.
- Library Preparation & Sequencing: Prepare libraries using standard Illumina protocols.
This method demonstrates robust sensitivity, detecting 10,911 genes from individual HEK293T cells compared to 9,148 genes detected by traditional Tang2009 protocol, with minimal rRNA contamination (<1.5% of total reads) [50].
Multiplexed scRNA-seq for Embryonic Tissue Analysis
Droplet-based single-cell mRNA sequencing combined with multiplexing strategies enables simultaneous profiling of multiple embryonic samples, significantly reducing reagent costs and minimizing batch effects [51]. This approach is particularly valuable for comparative studies across different genetic backgrounds, developmental stages, or anatomical locations.
Multiplexing Strategies:
- Lipid-Based Barcoding:
- Uses lipid-modified oligonucleotides (anchor/barcode and co-anchor)
- Incubate cells with anchor/barcode solution (5 minutes on ice)
- Add co-anchor solution (additional 5 minutes incubation)
- Wash with cold PBS with 1% BSA
- Compatible with 96-plex multiplexing
- Antibody-Based Barcoding:
- Uses oligo-conjugated antibodies against surface antigens
- Incubate cells with Fc blocking reagent (10 minutes at 4°C)
- Add antibody staining solution (30 minutes at 4°C)
- Limited to 12-plex multiplexing
- Requires cells expressing target antigen proteins
Embryonic Heart Dissection and Cell Preparation:
- Dissect embryonic hearts from E18.5 mouse embryos in cold PBS.
- Micro-dissect hearts into chambers (left atrium, right atrium, left ventricle, right ventricle).
- Enzymatically dissociate tissues using 0.25% Trypsin/EDTA (10 minutes at 37°C).
- For older embryos (>E11.5), add collagenase A/B mixture (10-20 minutes at 37°C).
- Filter cells through 40μm strainer and assess viability (>95% recommended).
Standardized Flow Cytometry for TF Protein Level Measurement
A standardized flow-cytometry-based protocol enables simultaneous measurement of multiple TFs at the protein level in single cells, allowing direct comparison across experimental conditions and time points [52].
Key Protocol Considerations:
- Antibody Selection: Use directly conjugated antibodies against intranuclear TFs; avoid primary-secondary systems when possible.
- Validation: Validate each TF antibody using known positive and negative control cells.
- Permeabilization: Select appropriate intranuclear permeabilization kit (e.g., True-Nuclear Transcription Factor Buffer Set).
- Controls: Include isotype controls and fluorescence minus one (FMO) controls for accurate gating.
Workflow:
- Prepare single-cell suspension from embryonic tissue.
- Fix cells with 1% paraformaldehyde.
- Permeabilize cells using nuclear permeabilization buffer.
- Stain with titrated, directly conjugated TF antibodies.
- Acquire data on flow cytometer with daily standardization using calibration beads.
- Analyze relative TF abundance using appropriate software (e.g., FlowJo).
Analytical Frameworks for TF Dynamics
scRNA-seq Data Normalization and Noise Quantification
Accurate quantification of transcriptional noise and TF expression dynamics requires appropriate normalization methods. Comparative studies have evaluated multiple scRNA-seq algorithms for their performance in quantifying genome-wide expression noise [53]:
Table 3: scRNA-seq Normalization Algorithms for TF Analysis
| Algorithm | Methodological Approach | Noise Amplification Detection | Key Features |
|---|---|---|---|
| SCTransform | Negative binomial model with regularization | 73-88% of genes | Variance stabilization |
| scran | Cell-specific size factors from pooled data | 73-88% of genes | Deconvolution approach |
| Linnorm | Transformation using homogeneous genes | 73-88% of genes | Variance stabilization |
| BASiCS | Hierarchical Bayesian framework | 73-88% of genes | Separates technical and biological noise |
| SCnorm | Quantile regression based on count-depth | 73-88% of genes | Group-based normalization |
Studies utilizing the noise-enhancer molecule 5′-iodo-2′-deoxyuridine (IdU) have demonstrated that appropriate normalization is critical for accurate TF dynamics quantification, with all major algorithms detecting noise amplification for 73-88% of expressed genes while maintaining unchanged mean expression levels (homeostatic noise amplification) [53].
Principal Component Analysis for Developmental Staging
PCA based on 387 expressed TFs effectively clusters embryonic cells according to developmental stage rather than embryo type (BI, PG, or AG), with clear separation between early (one-cell to four-cell) and late (eight-cell to morula) stages, highlighting the four- to eight-cell transition as a critical period of embryonic genome activation [49].
Research Reagent Solutions
Table 4: Essential Research Reagents for TF Dynamics Studies
| Reagent Category | Specific Products | Application Notes |
|---|---|---|
| scRNA-seq Platforms | Droplet-based systems (10X Genomics) | Enable multiplexed analysis of thousands of cells |
| Nuclear Permeabilization Kits | True-Nuclear Transcription Factor Buffer Set | Critical for intranuclear TF detection |
| Reverse Transcription Primers | SUPeR-seq random primers (AnchorX-T15N6) | Detect both poly(A)+ and poly(A)- RNAs |
| Multiplexing Barcodes | Lipid-modified oligonucleotides | Enable sample multiplexing without cell type bias |
| TF Validation Antibodies | Cell type-specific validated antibodies | Must be validated in relevant primary cells |
| Normalization Algorithms | SCTransform, BASiCS, Linnorm | Essential for accurate noise quantification |
Visualization of Experimental Workflows
Comprehensive TF Analysis Workflow
Transcription Factor Expression Modules
The integration of high-throughput scRNA-seq technologies with robust analytical frameworks provides unprecedented capability to decipher transcription factor dynamics during early embryonic development. The protocols and methodologies detailed in this Application Note empower researchers to systematically identify key regulatory TFs, characterize their expression trajectories, and validate their functional roles in development. As single-cell technologies continue to evolve, combining transcriptomic analyses with protein-level measurements and functional validation will further enhance our understanding of the fundamental regulatory principles governing embryogenesis, with significant implications for developmental biology, regenerative medicine, and therapeutic development.
Stem cell-based embryo models (SCBEMs) are three-dimensional stem cell-derived structures that replicate key aspects of early embryonic development, offering unprecedented potential to enhance our understanding of human developmental biology and reproductive science [54]. The usefulness of these models hinges entirely on their molecular, cellular, and structural fidelity to their in vivo counterparts [7]. As the field progresses into a new phase focused on applying these models to address specific scientific questions [55], rigorous benchmarking against authentic embryonic references becomes increasingly critical for validating research outcomes.
The challenges of studying early human development are substantial, including the scarcity of embryos donated for research, technical limitations, and ethical/legal challenges such as the 14-day rule [7] [55]. Well-validated SCBEMs can overcome these limitations while easing some of the ethical concerns associated with the use of donated human embryos [56]. This application note provides a comprehensive framework for benchmarking SCBEMs against in vivo references using high-throughput single-cell RNA sequencing (scRNA-seq) methodologies, with detailed protocols for implementation in research settings.
Construction of a Comprehensive Human Embryo Reference Atlas
Data Integration and Processing
A robust embryonic reference tool has been established through the integration of six published human scRNA-seq datasets covering developmental stages from zygote to gastrula (Carnegie stage 7, embryonic day 16-19) [7]. The standardized processing pipeline ensures data comparability and minimizes batch effects.
Table 1: Integrated Human Embryo scRNA-seq Datasets
| Developmental Stage | Key Lineages Captured | Culture Method | Primary Annotations |
|---|---|---|---|
| Preimplantation embryos | ICM, Trophectoderm | In vitro culture | Zygote, Morula, Blastocyst |
| Postimplantation blastocysts | Epiblast, Hypoblast, Trophoblast derivatives | 3D extended culture | Early/Late Epiblast, Early/Late Hypoblast, CTB, STB, EVT |
| Carnegie Stage 7 gastrula | Primitive Streak derivatives, Extraembryonic tissues | In vivo isolated | Primitive Streak, Amnion, Mesoderm, Definitive Endoderm, Yolk Sac Endoderm, Extraembryonic Mesoderm, Hematopoietic lineages |
The data processing workflow employs:
- Genome reference: GRCh38 (v.3.0.0) with standardized annotation
- Integration method: Fast mutual nearest neighbor (fastMNN) for batch correction
- Visualization: Stabilized Uniform Manifold Approximation and Projection (UMAP)
- Cell count: 3,304 early human embryonic cells embedded in 2D space [7]
Lineage Annotation and Validation
The reference atlas captures continuous developmental progression with time and lineage specification, validated against available human and nonhuman primate datasets [7]. Key lineage branch points include:
- E5: Inner cell mass (ICM) and trophectoderm (TE) divergence
- Post-ICM bifurcation: Epiblast and hypoblast specification
- E9-CS7: Distinct late epiblast cluster formation
- E10: Early to late hypoblast transition
- Extended culture: TE maturation into cytotrophoblast (CTB), syncytiotrophoblast (STB), and extravillous trophoblast (EVT)
Experimental Workflows for Benchmarking
Core Benchmarking Protocol Using scRNA-seq
The following workflow provides a standardized approach for comparing SCBEMs to the embryonic reference:
Protocol Steps:
Sample Preparation
- Dissociate SCBEMs to single-cell suspension using enzymatic digestion appropriate for the model system
- Include viability staining (e.g., DAPI exclusion) to assess cell integrity
- Target cell concentration: 700-1,200 cells/μL [7]
Library Preparation and Sequencing
- Process samples using 10x Genomics Chromium platform or equivalent
- Utilize standardized processing pipeline with GRCh38 genome reference
- Sequence to minimum depth of 50,000 reads per cell [7]
Data Integration and Projection
- Implement fastMNN correction to address technical variability
- Project query datasets onto stabilized UMAP reference
- Annotate cell identities using the embryonic prediction tool [7]
Advanced Multiomic Profiling with SUM-seq
For enhanced regulatory insight, the Single-cell Ultra-high-throughput Multiplexed sequencing (SUM-seq) method enables co-assaying of chromatin accessibility and gene expression:
Key SUM-seq Advantages:
- Throughput: Profiles up to 1.5 million cells across hundreds of samples in one 10x Chromium channel [29]
- Multiplexing: Enables complex experimental designs including time courses and perturbation screens
- Flexibility: Compatible with fixed and frozen samples, ideal for prolonged sample collection [29]
- Data Quality: Maintains high performance metrics with ~70% cell recovery in overloaded droplets [29]
Metabolic RNA Labeling for Dynamic Transcriptome Analysis
For studying transcriptional dynamics during embryo model development, metabolic RNA labeling combined with scRNA-seq enables precise measurement of RNA synthesis and degradation [30].
Table 2: Metabolic RNA Labeling Methods Comparison
| Chemical Method | Conversion Efficiency | RNA Recovery | Platform Compatibility | Key Applications |
|---|---|---|---|---|
| mCPBA/TFEA pH 7.4 | 8.40% (high) | Moderate | Drop-seq, 10x Genomics | Embryogenesis, cell state transitions |
| mCPBA/TFEA pH 5.2 | 8.11% (high) | Moderate | Drop-seq, 10x Genomics | Embryogenesis, cell state transitions |
| NaIO4/TFEA pH 5.2 | 8.19% (high) | Moderate | Drop-seq, 10x Genomics | Embryogenesis, cell state transitions |
| On-beads IAA (32°C) | 6.39% (moderate) | High | Drop-seq, 10x Genomics | High RNA recovery applications |
| In-situ IAA | 2.62% (low) | Variable | 10x Genomics, MGI C4 | Limited sample availability |
Optimized Protocol (mCPBA/TFEA):
- Labeling: Apply 100μM 4-thiouridine (4sU) for 4 hours to incorporate into newly synthesized RNA
- Fixation: Use methanol fixation for sample preservation
- Conversion: Perform on-beads chemical conversion with mCPBA/TFEA at pH 7.4
- Processing: Utilize high-capture efficiency platforms (10x Genomics, MGI C4) for limited cell samples [30]
Data Analysis and Interpretation Framework
Computational Analysis Pipeline
The analytical workflow for benchmarking involves multiple validation steps:
Quality Control and Preprocessing
- Filter cells with >10% mitochondrial reads and low unique gene counts
- Normalize using standard scRNA-seq pipelines (Seurat, Scanpy)
Reference Mapping and Annotation
- Project query data onto the integrated embryo reference using stabilized UMAP
- Assign predicted cell identities using the embryogenesis prediction tool [7]
Trajectory Analysis
- Apply Slingshot trajectory inference to model developmental pathways
- Identify transcription factors with modulated expression across pseudotime [7]
Regulatory Network Inference
- Perform SCENIC analysis to explore transcription factor activities
- Identify key regulators of lineage specification [7]
Key Benchmarking Metrics
Table 3: Quantitative Metrics for SCBEM Validation
| Validation Category | Specific Metrics | Acceptance Criteria | Tools/Methods |
|---|---|---|---|
| Transcriptomic fidelity | Correlation with stage-matched reference cells | Pearson's r > 0.7 | Spearman correlation, PCA |
| Lineage composition | Proportion of expected cell types present | >75% major lineages detected | Cluster composition analysis |
| Marker expression | Expression of lineage-specific markers | Adjusted p-value < 0.05 | Differential expression testing |
| Developmental progression | Pseudotime alignment with reference | Hausdorff distance < 0.5 | Slingshot, Monocle3 |
| Regulatory dynamics | Transcription factor activity patterns | Regulon specificity score > 0.5 | SCENIC analysis |
The Scientist's Toolkit: Essential Research Reagents
Table 4: Key Reagents for Embryo Model Benchmarking
| Reagent/Category | Specific Examples | Function | Application Notes |
|---|---|---|---|
| scRNA-seq platforms | 10x Genomics, MGI C4, Drop-seq | High-throughput single-cell profiling | Higher capture efficiency (~50%) crucial for limited samples [30] |
| Multiomic technologies | SUM-seq, SHARE-seq, Paired-seq | Joint chromatin accessibility and gene expression | SUM-seq enables ultra-high-throughput multiplexing [29] |
| Metabolic labeling reagents | 4-thiouridine (4sU), 5-Ethynyluridine (5EU) | Tagging newly synthesized RNA | mCPBA/TFEA combination provides highest conversion efficiency [30] |
| Chemical conversion kits | SLAM-seq, TimeLapse-seq, TUC-seq | Detecting nucleoside analog incorporation | On-beads methods outperform in-situ approaches [30] |
| Bioinformatic tools | fastMNN, UMAP, SCENIC, Slingshot | Data integration, visualization, network inference | Standardized pipelines essential for reproducibility [7] |
| Reference datasets | Human Embryo Atlas (zygote to gastrula) | Benchmarking and annotation | Integrated dataset of 3,304 embryonic cells [7] |
Regulatory and Ethical Considerations
The International Society for Stem Cell Research (ISSCR) has issued updated guidelines for SCBEM research, effective 2025 [54] [57]:
- Oversight Requirements: All organized 3D SCBEMs require appropriate review, clear scientific rationale, and defined endpoints [56]
- Terminology Update: The classification of "integrated" vs. "non-integrated" models is retired in favor of the inclusive term "SCBEMs" [54] [57]
- Strict Prohibitions:
Robust benchmarking of stem cell-derived embryo models against comprehensive in vivo references is essential for validating their utility in studying human development. The integrated reference tool spanning zygote to gastrula stages, combined with standardized scRNA-seq and multiomic profiling protocols, provides a rigorous framework for assessing model fidelity. As the field advances with increasingly complex SCBEMs, these benchmarking approaches will ensure that research outcomes are biologically meaningful and reproducible, ultimately advancing our understanding of human development and reproductive health while maintaining the highest ethical standards.
The advent of single-cell RNA sequencing (scRNA-seq) has revolutionized our understanding of cellular heterogeneity, yet conventional methods have been largely limited to profiling polyadenylated (poly-A) coding RNAs. This restriction overlooks a significant portion of the transcriptome, including crucial regulatory noncoding RNAs and viral transcripts that play pivotal roles in development and disease. Total transcriptome sequencing represents a methodological evolution that extends beyond poly-A capture to enable a comprehensive landscape of both coding and noncoding RNA species. Within the context of high-throughput scRNA-seq for embryo cell profiling, this approach provides unprecedented resolution for deciphering the complex gene regulatory networks that orchestrate early development. By capturing the full spectrum of RNA biotypes, researchers can now investigate previously obscured layers of transcriptional regulation, from lineage specification in embryogenesis to the dynamic host-pathogen interactions that may impact developmental pathways.
The limitation of traditional scRNA-seq methods becomes particularly consequential in embryonic research, where precise temporal regulation of both coding and noncoding RNAs dictates cell fate decisions. Current spatial transcriptomics methods are restricted to capturing polyadenylated transcripts and lack sensitivity to many species of non-A-tailed RNAs, including microRNAs, newly transcribed RNAs, and many nonhost RNAs [58]. Extending the scope of spatial transcriptomics to the total transcriptome enables observation of spatial distributions of regulatory RNAs and their targets, links nonhost RNAs and host transcriptional responses, and deepens our understanding of spatial biology [58]. For embryo research specifically, where material is often scarce and developmental transitions are rapid, maximizing informational yield from each cell is paramount.
Methodological Approaches for Total RNA Capture
Enzymatic Polyadenylation for Spatial Total RNA-Seq
A breakthrough method for total transcriptome profiling, termed Spatial Total RNA-sequencing (STRS), addresses the fundamental limitation of conventional approaches through enzymatic in situ polyadenylation of RNA. This technique enables detection of the full spectrum of RNAs by adding a single step to the widely used Visium spatial transcriptomics protocol from 10x Genomics [58]. After sample sectioning, fixation, and histological staining, the tissue is incubated with yeast poly(A) polymerase for 25 minutes at 37°C. This enzyme adds poly(A) tails to the 3' end of all RNAs—endogenously polyadenylated transcripts are extended, while non-A-tailed transcripts are polyadenylated [58]. Following this in situ polyadenylation step, the protocol proceeds with the standard Visium workflow without modification.
The strategic incorporation of enzymatic polyadenylation is particularly powerful because it leverages the proven infrastructure of an already widely adopted commercial platform. This methodology requires minimal optimization and adds negligible cost and time to existing workflows, making it readily accessible to the research community. One critical feature that must be preserved is the use of a strand-aware library preparation, which is essential for accurate annotation of noncoding and antisense RNAs in downstream bioinformatic analyses [58]. When applied to mouse models of skeletal muscle regeneration and viral-induced myocarditis, STRS demonstrated robust capture of numerous RNA biotypes that are poorly recovered or completely undetectable with conventional methods, including ribosomal RNAs (rRNAs), microRNAs (miRNAs), transfer RNAs (tRNAs), small nucleolar RNAs (snoRNAs), and unspliced nascent transcripts [58].
Comparative Analysis of scRNA-seq Methodologies
The landscape of scRNA-seq technologies is diverse, with protocols differing significantly in their ability to capture various RNA species. While most conventional methods target only polyadenylated RNA, emerging approaches are expanding this capability. The table below summarizes the characteristics of selected scRNA-seq methods, highlighting their differing capacities for total RNA capture:
Table 1: Comparison of Single-Cell RNA Sequencing Methodologies
| Method | Target RNA Type | Transcript Coverage | Throughput | UMI Incorporation |
|---|---|---|---|---|
| STRS | polyA+ and polyA- | 3' | High | Yes [58] |
| Smart-Seq2 | polyadenylated RNA | Full-length | Low | No [59] |
| MATQ-Seq | polyA+ and polyA- | Full-length | Medium | Yes [59] |
| 10X Chromium V3 | polyadenylated RNA | 3' | High | Yes [59] |
| VASA-drop | polyA+ and polyA- | Full-length | High | Yes (UFI) [59] |
Full-length scRNA-seq methods offer unique advantages over 3' end counting protocols for certain applications. They excel in tasks like isoform usage analysis, allelic expression detection, and identifying RNA editing due to their comprehensive coverage of transcripts [60]. Furthermore, in the detection of specific lowly expressed genes or transcripts, full-length scRNA-seq approaches may outperform 3' end sequencing methods [60]. However, droplet-based techniques like those used in STRS often enable a higher throughput of cells and a lower sequencing cost per cell as compared to whole-transcript scRNA-seq [60].
For embryonic research, where cellular diversity and transcriptional dynamics are extreme, the choice of methodology must balance capture efficiency, transcriptome coverage, and cellular throughput. Methods like STRS that preserve spatial information while expanding RNA biotype coverage are particularly valuable for understanding the topographic organization of embryonic tissues and the spatial patterns of noncoding RNA expression with near-cellular resolution [58].
Experimental Protocol: Spatial Total RNA-Sequencing
Sample Preparation and Library Construction
The following protocol details the application of STRS for profiling the total transcriptome in embryonic tissues, with specific considerations for the unique challenges posed by embryonic material.
- Tissue Collection and Preservation: For embryonic tissues, immediate stabilization of RNA is critical due to rapid transcriptional changes. Fresh tissues should be embedded in Optimal Cutting Temperature (OCT) compound and flash-frozen in liquid nitrogen-cooled isopentane. Alternatively, tissues can be fixed with methanol for 30 minutes at -20°C for spatial transcriptomics applications [58].
- Sectioning and Staining: Cryosection tissues at appropriate thickness (typically 10-20 μm) onto Visium spatial gene expression slides. Follow standard cryosectioning protocols, maintaining temperatures between -15°C to -20°C. Sections are then fixed in pre-chilled methanol for 30 minutes at -20°C, followed by staining with hematoxylin and eosin (H&E) or other appropriate histological stains according to the Visium tissue preparation guide [58].
- Imaging and Permeabilization: Image stained sections using a high-resolution slide scanner according to Visium protocols. Following imaging, permeabilize tissues with the recommended enzyme concentration and incubation time determined by tissue optimization experiments. For embryonic tissues, which may be more delicate, consider reducing permeabilization time by 25-50% compared to adult tissues.
- In Situ Polyadenylation: This critical added step enables total transcriptome capture. Rehydrate the sample and incubate with yeast poly(A) polymerase for 25 minutes at 37°C [58]. This enzyme adds poly(A) tails to the 3' end of all RNAs, enabling subsequent capture of both normally polyadenylated and non-polyadenylated transcripts.
- cDNA Synthesis and Library Preparation: Following in situ polyadenylation, continue with the standard Visium spatial gene expression protocol without modification [58]. This includes reverse transcription with template switching, cDNA amplification, library construction, and sequencing.
Quality Control and Optimization
Rigorous quality control is essential throughout the STRS workflow, particularly when working with precious embryonic samples:
- RNA Integrity Assessment: Prior to library preparation, assess RNA quality using appropriate methods. For embryonic tissues, RNA integrity numbers (RIN) above 8.0 are ideal.
- Library QC: Evaluate final libraries using appropriate methods, ensuring adequate fragment size distribution and concentration.
- Sequencing Parameters: Sequence libraries following Visium recommendations, typically aiming for 50,000-100,000 reads per spot. Consider increasing depth if analyzing low-abundance noncoding RNAs.
The following workflow diagram illustrates the key steps in the STRS protocol:
Figure 1: Experimental workflow for Spatial Total RNA-sequencing (STRS) incorporating enzymatic polyadenylation for total transcriptome capture.
Data Analysis Framework for Total Transcriptome Data
Preprocessing and Normalization
Analysis of total transcriptome data requires specialized computational approaches that account for the diversity of captured RNA biotypes. The initial preprocessing of STRS data follows similar quality control steps as conventional scRNA-seq but requires additional considerations for non-polyadenylated RNA species.
- Quality Control and Filtering: Begin with standard scRNA-seq QC metrics, including the number of counts per barcode, the number of genes per barcode, and the fraction of counts from mitochondrial genes [61]. However, for total RNA-seq, also monitor the distribution of RNA biotypes to ensure successful capture of noncoding RNAs. Filter out low-quality barcodes that may represent dying cells, broken cells, or doublets [61].
- Normalization and Transformation: Single-cell RNA-seq count tables are heteroskedastic, with counts for highly expressed genes varying more than for lowly expressed genes [62]. Various transformation approaches exist to adjust for this, including methods based on the delta method, model residuals, inferred latent expression state, and factor analysis [62]. For UMI-based data, a theoretically and empirically well-supported model is the gamma-Poisson distribution [62]. A rather simple approach—the logarithm with a pseudo-count followed by principal-component analysis—often performs as well or better than more sophisticated alternatives [62].
Specialized Analysis for Noncoding RNAs and Novel Features
The expanded transcriptional capture of STRS enables several advanced analytical approaches:
- Biotype Quantification: Quantify the percentage of unique molecular identifiers (UMIs) as a function of RNA biotype using appropriate annotations. Compared to the standard Visium method, STRS shows similar counts for protein-coding transcripts but enables robust detection of noncoding RNAs, including rRNAs, miRNAs, tRNAs, snoRNAs, and several other biotypes [58].
- Intergenic and Antisense Transcription Analysis: STRS libraries typically have an increased fraction of reads mapping to intergenic regions, reflecting enhanced capture of unannotated transcriptional products [58]. Tools like TAR-scRNA-seq, a gene-annotation-free pipeline that identifies transcriptionally active regions, can be applied to characterize these novel features [58].
- Integration with Embryo Reference Atlas: For embryonic applications, leverage existing integrated references such as the human embryogenesis transcriptome reference spanning zygote to gastrula stages [7]. Project STRS data onto these references to annotate cell identities and validate developmental stages.
The following diagram illustrates the key computational steps in processing total transcriptome data:
Figure 2: Computational workflow for analyzing total transcriptome sequencing data, highlighting specialized steps for noncoding RNA and novel feature detection.
Applications in Embryonic Development and Disease Modeling
Insights into Embryonic Development
Total transcriptome profiling has yielded significant insights into embryonic development by revealing the spatial and temporal dynamics of noncoding RNAs alongside coding transcripts. When applied to stem cell-based embryo models, comprehensive transcriptome references enable unbiased validation and benchmarking against in vivo counterparts [7]. The creation of integrated human embryo reference datasets covering developmental stages from zygote to gastrula provides a critical framework for authenticating these models [7].
In practice, STRS analysis of developing tissues has identified spatially defined expression of noncoding transcripts that correlate with key developmental processes. For instance, in studies of skeletal muscle regeneration, STRS revealed distinct localization of noncoding RNAs like Meg3, Gm10076, and Rpph1 within injury loci at specific timepoints, suggesting potential roles in myoblast differentiation and tissue repair [58]. Similarly, in embryonic contexts, total transcriptome approaches can identify stage-specific noncoding RNAs that may drive lineage specification events.
Viral RNA Detection in Developmental Contexts
An often-overlooked application of total transcriptome profiling in embryonic research is the detection of nonhost RNAs, including viral transcripts. Unlike conventional methods that only capture polyadenylated host RNA, STRS enables detection of nonpolyadenylated viral RNAs [58]. This capability is particularly relevant for understanding how viral infections during pregnancy may impact embryonic development.
In studies of viral-induced myocarditis, STRS enabled detection of more than 200 UMIs representing all ten gene segments of Type 1-Lang reovirus, which were completely undetectable with the standard Visium workflow [58]. When combined with targeted enrichment, this approach increased viral UMIs by approximately 26-fold, allowing precise spatial correlation between viral RNA presence and host transcriptional responses [58]. For embryonic research, this capability opens new avenues for investigating how vertical viral transmission may disrupt developmental programs.
Successful implementation of total transcriptome profiling requires specific reagents and computational resources. The following table outlines key components:
Table 2: Essential Research Reagents and Resources for Total Transcriptome Profiling
| Category | Item | Function | Example/Note |
|---|---|---|---|
| Enzymes | Poly(A) Polymerase | Adds poly(A) tails to non-polyadenylated RNAs | Yeast poly(A) polymerase for in situ polyadenylation [58] |
| Library Prep | Visium Spatial Gene Expression Kit | Spatial barcoding and library construction | 10x Genomics platform [58] |
| Strand-switch RT | Template Switching Oligos | cDNA synthesis with template switching | For full-length transcript capture [60] |
| Bioinformatics | scRNA-seq Analysis Tools | Data processing and normalization | Scanpy, Seurat [61] |
| Reference Data | Embryo Transcriptome Atlas | Cell identity annotation and benchmarking | Integrated human embryo reference [7] |
| Quality Control | RNA Integrity Assessment | Sample quality verification | RIN >8.0 recommended for embryonic tissues |
Total transcriptome profiling with advanced methods like STRS represents a significant technological leap beyond conventional poly-A-selected RNA sequencing. By capturing the full spectrum of coding and noncoding RNAs, these approaches provide a more comprehensive view of the transcriptional landscape in embryonic development and disease. The simple modification of adding enzymatic polyadenylation to existing spatial transcriptomics workflows makes this powerful approach readily accessible to the research community. As we continue to refine these methods and develop more sophisticated analytical frameworks, total transcriptome profiling will undoubtedly yield new insights into the complex regulatory networks that govern embryogenesis and the pathological processes that disrupt normal development. For researchers focused on high-throughput scRNA-seq for embryo cell profiling, adopting these total transcriptome approaches will be essential for uncovering the full complexity of developmental transcription programs.
Navigating Experimental Challenges: Optimization and Troubleshooting Strategies
In high-throughput single-cell RNA sequencing (scRNA-seq) for embryo cell profiling, library efficiency is a critical metric determining data quality, experimental cost, and biological validity. This parameter encompasses two fundamental components: the cell capture rate (the proportion of input cells successfully barcoded and sequenced) and the valid read fraction (the percentage of sequencing reads containing usable cellular information). For embryonic development research, where sample availability is often severely limited by ethical and technical constraints, maximizing library efficiency is paramount to capturing rare cell populations and constructing comprehensive transcriptional roadmaps from zygote to gastrula stages [7] [1].
Optimizing these parameters ensures that precious embryo-derived cells are not wasted and that sequencing resources generate maximal biological insight. This protocol details methodologies for quantifying, benchmarking, and enhancing library efficiency specifically within the context of embryonic scRNA-seq studies, incorporating recent benchmarking data and platform-specific considerations.
Core Concepts and Quantitative Benchmarks
Defining Key Efficiency Metrics
- Cell Capture Rate: Calculated as the number of barcodes associated with intact cells divided by the number of input cells, expressed as a percentage. This metric is influenced by cell viability, sample preparation, and platform-specific capture mechanics [35] [63].
- Valid Read Fraction: The proportion of sequencing reads that contain correct cell barcodes, UMIs, and align to the reference transcriptome, versus total generated reads. High valid read fractions reduce sequencing costs and improve signal-to-noise ratio [35].
- Library Efficiency: The overall effectiveness of the scRNA-seq workflow in converting input cells into high-quality, transcriptome-wide data. It is a function of both cell capture rates and valid read fractions [35].
Platform Performance Comparison
Recent systematic comparisons of high-throughput scRNA-seq platforms provide crucial benchmarks for expected performance in complex tissues, which informs experimental design for embryo studies. The table below summarizes key performance metrics from published comparisons.
Table 1: Performance Comparison of scRNA-seq Platforms
| Performance Metric | 10x Genomics Chromium (3' v3.1) | Parse Biosciences (Evercode WT v2) | BD Rhapsody |
|---|---|---|---|
| Typical Cell Recovery Rate | ~53% [35] | ~27% [35] | Similar to 10x [63] |
| Fraction of Valid Reads | ~98% [35] | ~85% [35] | Data not available |
| Gene Detection Sensitivity | Median ~1,900 genes/cell (PBMCs) [35] | Median ~2,300 genes/cell (PBMCs) [35] | Similar to 10x [63] |
| Multiplet Rate | Low double-digit percentage [64] | Low single-digit percentage [64] | Data not available |
| RNA Transcript Capture | ~30-32% of mRNA transcripts per cell [65] | Data not available | Data not available |
Diagram 1: Factors influencing library efficiency.
Experimental Protocols for Efficiency Assessment
Protocol: Calculating Cell Capture Efficiency
Purpose: To accurately determine the proportion of input cells successfully recovered in scRNA-seq data.
Materials:
- Hemocytometer or automated cell counter (e.g., Countess II)
- Viability stain (e.g., Trypan Blue)
- scRNA-seq library preparation kit
- High-performance computing cluster
Procedure:
- Input Cell Quantification:
- Resuspend the single-cell suspension thoroughly by pipetting gently.
- Mix 10 µL of cell suspension with 10 µL of Trypan Blue stain.
- Load onto a hemocytometer and count live, unstained cells in all four quadrants.
- Calculate total input live cells:
Input Cells = (Total live cells counted / 4) * Dilution Factor * 10,000.
Recovered Cell Quantification:
- Process raw sequencing FASTQ files through the appropriate alignment pipeline (e.g., Cell Ranger for 10x, Parse Tools for Parse).
- The pipeline generates a barcode rank plot, which distinguishes barcodes associated with real cells from those containing ambient RNA.
- The number of recovered cells is automatically determined by the pipeline based on the inflection point in the barcode rank plot [35] [64].
Efficiency Calculation:
- Calculate cell capture efficiency:
(Number of Recovered Cells / Number of Input Live Cells) * 100.
- Calculate cell capture efficiency:
Troubleshooting:
- Low Recovery: Ensure high cell viability (>90%) and minimize cell clumping by passing the suspension through a flow cytometry strainer cap or appropriate cell filter. If cells are unusually sticky, consider adding DNase to the suspension [64].
- Inconsistent Counting: Use the same counting method (manual or automated) across all replicates to minimize variability.
Protocol: Determining Valid Read Fraction
Purpose: To measure the percentage of sequencing data that is usable for downstream biological analysis.
Materials:
- Demultiplexed FASTQ files from the sequencing run
- Computing resources with tools like FastQC and MultiQC
Procedure:
- Primary QC Analysis:
- Run FastQC on the received FASTQ files for a preliminary quality check.
- Use MultiQC to aggregate FastQC reports from multiple samples into a single interactive summary [64].
Platform-Specific Processing:
- For 10x Genomics data, process files through
cellranger count. The summary CSV file will report the "Fraction of Reads in Cells" and "Fraction of Reads Confidently Mapped to Transcriptome" [35]. - For Parse Biosciences data, the preprocessing pipeline will report the "Fraction of reads with valid barcodes" directly [35].
- For 10x Genomics data, process files through
Valid Read Calculation:
- The valid read fraction is typically provided by the processing pipeline. It can be manually verified by examining the alignment statistics and the proportion of reads containing correct barcodes and UMIs.
Troubleshooting:
- Low Valid Read Fraction: Check for library preparation issues, such as adapter contamination or poor-quality cDNA. For droplet-based systems, ensure microfluidics are not clogged. For combinatorial indexing, confirm that barcode ligation steps were efficient [64].
The Scientist's Toolkit: Essential Reagents and Materials
Table 2: Key Research Reagent Solutions for scRNA-seq Library Preparation
| Item | Function | Example Use Case |
|---|---|---|
| Oligo-dT Primers | Binds to poly-A tail of mRNA for cDNA synthesis; on beads for capture. | Standard 3' scRNA-seq (10x Genomics). |
| Combinatorial Barcodes | Unique nucleotide sequences added over multiple rounds to index individual cells. | Parse Biosciences SPLiT-seq protocol [35]. |
| Unique Molecular Identifiers (UMIs) | Random nucleotide tags attached to each transcript molecule to correct for amplification bias. | Quantifying absolute transcript counts in both 10x and Parse platforms [35]. |
| DNase I | Degrades genomic DNA to reduce cell clumping and background noise. | Added to sticky cell suspensions to improve capture efficiency [64]. |
| Viability Stain (Trypan Blue) | Distinguishes live from dead cells for accurate counting and viability assessment. | Pre-capture cell quality control [15]. |
| Cell Strainers | Removes cell clumps and aggregates to prevent multiplets and clogging. | Pre-filtering cell suspension before loading onto 10x Chromium chip [64]. |
Workflow Integration for Embryo Profiling
The ultimate goal of maximizing library efficiency in embryonic research is to create high-fidelity reference atlases. A comprehensive human embryo reference tool has been established by integrating multiple scRNA-seq datasets, covering development from zygote to gastrula (E3 to E7 and Carnegie Stage 7). This tool enables precise annotation of epiblast, hypoblast, trophectoderm, and their derivatives, providing a essential benchmark for authenticating stem cell-based embryo models [7] [20] [1]. The accuracy of such references is directly dependent on the library efficiency of the constituent datasets.
Diagram 2: An integrated scRNA-seq workflow for building a embryo reference atlas.
Achieving high library efficiency is a foundational requirement for generating robust and comprehensive scRNA-seq data in the context of human embryo profiling. By systematically optimizing cell capture rates and valid read fractions through the protocols outlined herein, researchers can better leverage limited embryonic samples to construct authoritative transcriptional roadmaps. These references are indispensable for validating in vitro embryo models and advancing our understanding of human development, infertility, and congenital disorders [7] [1]. The choice of platform and rigorous attention to technical metrics directly impacts the biological insights attainable from each precious sample.
Single-cell RNA sequencing (scRNA-seq) has revolutionized our understanding of cellular heterogeneity, proving particularly transformative in embryonic development research where it uncovers intricate cell fate decisions. However, the journey from cell suspension to data interpretation is fraught with technical challenges that can obscure true biological signals. For embryo cell profiling, where defining precise developmental trajectories and rare progenitor populations is paramount, addressing these artifacts is not merely optional but fundamental to deriving biologically valid conclusions.
This Application Note details structured protocols to identify, quantify, and mitigate three pervasive sources of technical noise: batch effects, ambient RNA, and dropout events. We focus specifically on their implications for high-throughput scRNA-seq studies of embryonic systems, providing a practical framework to safeguard data integrity and empower discovery in developmental biology.
Batch Effects: Integration Across Diverse Systems
Understanding the Challenge in Embryonic Studies
Batch effects arise from technical variations between experiments, such as different sequencing runs, protocols, or operators. In embryonic research, these are compounded when integrating data from different genetic backgrounds, developmental time points, or in vitro models like organoids. Left uncorrected, batch effects can conflate technical with biological variation, leading to spurious conclusions about lineage relationships [66].
Conditional Variational Autoencoders (cVAEs) are a popular integration method, but traditional strategies for strengthening batch correction, like increasing Kullback–Leibler (KL) divergence regularization, often fail. This approach indiscriminately removes both technical and biological variation, while adversarial learning methods can artificially mix unrelated cell types that have unbalanced proportions across batches [66].
Protocol: Systematic Batch Correction Using sysVI
Principle: The sysVI method leverages a combination of VampPrior (a multimodal variational mixture of posteriors) and cycle-consistency constraints to achieve robust integration while preserving delicate biological signals, such as those defining embryonic subpopulations [66].
Table 1: Key Components of the sysVI Workflow
| Step | Component | Function in Batch Correction |
|---|---|---|
| 1 | Conditional VAE (cVAE) | Non-linear correction of batch effects; scalable to large datasets. |
| 2 | VampPrior | Serves as an informative prior for the latent space, enhancing biological preservation. |
| 3 | Cycle-Consistency Constraints | Ensures robust alignment of datasets from different systems (e.g., species, protocols). |
Procedure:
- Data Preprocessing: Normalize and log-transform your count matrices (e.g., from 10X Genomics output) for each batch separately using standard scRNA-seq workflows.
- Feature Selection: Identify highly variable genes (HVGs) common across all batches to be integrated.
- Model Training:
- Input the log-normalized, HVG-filtered expression matrix along with a batch covariate vector.
- The sysVI model (e.g.,
sysVItool fromscvi-tools) is trained to learn a integrated latent representation that minimizes batch differences while conserving biological variance. - Key parameters to monitor include the weight of the cycle-consistency loss and the VampPrior configuration.
- Downstream Analysis: Utilize the integrated latent representation for uniform manifold approximation and projection (UMAP) visualization, clustering, and trajectory inference.
Evaluation: Assess integration success using the graph integration local inverse Simpson’s Index (iLISI) to score batch mixing and metrics like normalized mutual information (NMI) to confirm preservation of known biological cell types [66].
Ambient RNA: Contamination and Decontamination
The Problem of "Free-Floating" Transcripts in Embryonic Samples
Ambient RNA consists of transcripts from lysed or dead cells that are present in the cell suspension and are subsequently captured in droplets containing a single cell, contaminating its true expression profile [67] [68]. In embryonic tissues, which can be sensitive to dissociation, this is a major concern. The consequence is the false detection of a cell's expression of genes highly specific to other, often more abundant, cell types. This can lead to misannotation of cell identities and the masking of rare but developmentally crucial populations [69] [70].
Protocol: In silico Decontamination with DecontX
Principle: DecontX is a Bayesian method that models a cell's observed expression as a mixture of two multinomial distributions: one for its native transcripts and another for the contaminating ambient RNA pool. It estimates and subtracts the contamination contribution for each cell individually [68].
Table 2: Tools for Ambient RNA Identification and Correction
| Tool Name | Category | Mechanism | Key Considerations |
|---|---|---|---|
| CellBender [67] | Cell Calling & Ambient Removal | Deep generative model that learns background noise profile. | Computationally intensive; GPU use recommended. |
| SoupX [67] | Ambient Removal | Estimates ambient profile from empty droplets; corrects cell barcodes. | Allows manual setting of contamination fraction using known markers. |
| DecontX [67] [68] | Ambient Removal | Bayesian method deconvoluting native and contaminating counts. | Integrates well with R/Bioconductor workflows. |
| EmptyNN [67] | Cell Calling | Neural network classifier for empty vs. cell-containing droplets. | May have tissue-specific performance variability. |
Procedure:
- Identify Signs of Contamination:
- Inspect the barcode rank plot for a lack of a clear "steep cliff" between cells and empty droplets [67].
- Check for enrichment of highly expressed genes from abundant cell types in unexpected clusters.
- In nucleus samples (snRNA-seq), a low intronic read ratio can indicate cytoplasmic ambient RNA contamination [69].
- Run DecontX:
- Input a raw (unfiltered) gene-by-cell count matrix. Cell population labels can be provided or will be estimated by the algorithm.
- DecontX performs variational inference to estimate the parameters for each cell: the native expression distribution (Φ), the contamination distribution (η), and the proportion of counts that are native (θ).
- Output and Validation:
- The tool outputs a decontaminated count matrix.
- Validate by comparing the expression of known marker genes for abundant lineages (e.g., trophectoderm markers in an embryo dataset) in other cell types before and after decontamination. A successful correction will show a marked reduction of these markers in inappropriate cell types.
Dropout Events: From Imputation to Utilization
The Double-Edged Sword of Sparsity
Dropout events are zero counts in the expression matrix for genes that are actually expressed at low to moderate levels in the cell. They occur due to the stochastic nature of gene expression and technical limitations of scRNA-seq protocols, leading to a highly sparse data matrix [71] [72]. This sparsity breaks the assumption that "similar cells are close in space," negatively impacting the stability of clustering and the identification of local cell neighborhoods, which is critical for reconstructing fine-grained developmental trajectories [73].
Protocol: Handling Dropouts with GNNImpute and Co-occurrence Analysis
Principle: Two emerging strategies address dropouts: 1) Imputation using methods like GNNImpute, which employs graph neural networks to aggregate information from similar cells to predict missing values, and 2) Leveraging the dropout pattern itself as a analytical signal, as it can be informative of cell state [74] [71].
Table 3: Selected Methods for Addressing Dropout Events
| Method | Category | Underlying Approach | Reported Performance (ARI) |
|---|---|---|---|
| GNNImpute [74] | Imputation | Graph Attention Network on cell-cell graph. | 0.8199 |
| DrImpute [72] | Imputation | Averaging expression from similar cells identified via clustering. | N/A |
| MAGIC [74] | Imputation | Markov Affinity-based Graph Imputation. | N/A |
| Co-occurrence Clustering [71] | Pattern Utilization | Clusters cells based on binary (0/1) dropout patterns. | N/A |
Procedure A: Imputation with GNNImpute
- Data Preprocessing: Filter the raw count matrix to remove cells with low total counts (<200) and genes detected in few cells (<3). Normalize and log-transform the data.
- Graph Construction: Perform PCA on the preprocessed matrix. Calculate Euclidean distances between cells and construct a K-nearest neighbor (KNN) graph (default K=5).
- Model Training and Imputation:
- The GNNImpute autoencoder uses graph attention layers to aggregate information from a cell's direct and second-level neighbors.
- The model is trained to reconstruct the expression matrix, learning to impute dropout values from similar cells while preserving true zeros.
- The output is a denoised and imputed expression matrix.
- Validation: Use the imputed matrix for clustering and calculate metrics like Adjusted Rand Index (ARI) and Normalized Mutual Information (NMI) against known cell labels to assess improvement [74].
Procedure B: Co-occurrence Clustering Using Dropout Patterns
- Binarization: Transform the count matrix into a binary matrix where 0 indicates a dropout and 1 indicates a detected gene.
- Gene-Gene Graph: Calculate a co-occurrence measure (e.g., Jaccard index) for gene pairs and construct a gene-gene graph. Genes with similar dropout patterns across cells will be connected.
- Pathway Identification: Use community detection (e.g., Louvain algorithm) on this graph to identify "gene pathways" – sets of genes that co-dropout or co-express.
- Cell Clustering: For each identified gene pathway, calculate the percentage of detected genes per cell. Use this low-dimensional representation to cluster cells, effectively grouping them by their shared dropout patterns, which can reveal cell types defined by coordinated gene module activity [71].
The Scientist's Toolkit: Essential Reagents and Computational Tools
Table 4: Key Research Reagent Solutions and Computational Tools
| Category | Item / Tool Name | Function / Application |
|---|---|---|
| Wet-Lab Reagents | Chromium Nuclei Isolation Kit (10x Genomics) [67] | Isolate high-quality nuclei for snRNA-seq, potentially reducing cytoplasmic ambient RNA. |
| Fluorescence-Activated Nuclei Sorting (FANS) [69] | Physical separation of nuclei (e.g., DAPI+) to remove debris and non-nuclear ambient RNA. | |
| NeuN Antibody for FANS [69] | Physical separation of neuronal nuclei to prevent neuronal ambient RNA contamination in glia. | |
| Computational Tools | sysVI [66] | Python-based tool for integrating scRNA-seq datasets with substantial batch effects. |
| DecontX [68] | R/Bioconductor package for ambient RNA contamination removal. | |
| CellBender [67] | Python tool for cell calling and ambient RNA removal via deep generative models. | |
| SoupX [67] | R package for quantifying and removing ambient RNA contamination. | |
| GNNImpute [74] | Python-based imputation method using graph attention networks. | |
| Harmony [75] | R package for batch effect correction, noted for introducing minimal artifacts. |
In the field of high-throughput single-cell RNA sequencing (scRNA-seq) for embryo cell profiling, the precise detection of gene expression is paramount. The biological complexity of early development, characterized by rare cell types and subtle transcriptional differences, demands methodologies with exceptional sensitivity—the ability to detect lowly expressed genes—and high specificity—the ability to minimize false positives from technical artifacts such as ambient RNA or amplification errors. Advances in third-generation sequencing (TGS) platforms and refined wet-lab protocols are directly addressing these challenges, enabling unprecedented resolution in studying lineages from the zygote to the gastrula [7] [76].
This application note details strategies and protocols to enhance these critical parameters, providing a framework for reliable embryo model authentication and the discovery of novel biological insights in developmental research.
Performance Comparison of scRNA-seq Platforms and Methods
The selection of a sequencing platform and library preparation method fundamentally influences the sensitivity and specificity of an experiment. The table below summarizes the performance of key technologies.
Table 1: Performance Comparison of scRNA-seq Methodologies
| Method / Platform | Key Feature | Gene Detection Sensitivity | Specificity / Accuracy | Best Suited Application |
|---|---|---|---|---|
| SCAN-seq2 [77] | TGS-based (full-length) | ~4,000 genes & ~4,500 isoforms/cell (960 cells/run) | High reproducibility (Pearson R=0.95); Low cross-contamination (0.28%) | Novel isoform discovery; Pseudogene expression; V(D)J analysis |
| 10x Chromium [63] | 3'-end counting (NGS) | High gene sensitivity (complex tissues) | Cell type detection biases (e.g., lower in granulocytes) | High-throughput cell atlas construction |
| BD Rhapsody [63] | 3'-end counting (NGS) | Similar to 10x Chromium | Lower proportion of endothelial/myofibroblasts; Different ambient RNA source | High-throughput profiling with plate-based benefits |
| PacBio (TGS) [76] | Long-read sequencing | Lower per-cell genes vs. NGS, but superior in full-length isoform detection | Superior in novel isoform identification and allele-specific expression | Isoform-level analysis; Allele-specific expression |
| Oxford Nanopore (TGS) [76] | Long-read sequencing | Generates more raw cDNA reads | Good cell type identification; Less accurate than PacBio for novel isoforms | Rapid, long-read transcriptome characterization |
| Smart-seq2 [9] | Full-length (plate-based) | High sensitivity for low-abundance genes | High accuracy for full-length transcripts | Detailed analysis of individual cells; Lowly expressed genes |
| Drop-seq [9] | 3'-end counting (droplet) | High throughput, lower cost per cell | Uses UMIs to improve quantification accuracy | Large-scale population screening |
Detailed Experimental Protocols for Enhanced Detection
Protocol: High-Sensitivity Full-Length scRNA-seq (SCAN-seq2)
This protocol is designed for TGS platforms to achieve high sensitivity and specificity in full-length transcriptome coverage [77].
Key Research Reagent Solutions:
- Barcoded Reverse Transcription Primers: Contains cell-specific barcodes for multiplexing.
- Barcoded PCR Primers: Introduces a second set of barcodes during amplification for increased throughput.
- Third-Generation Sequencing Platform: PacBio Sequel II or Oxford Nanopore PromethION for long-read sequencing.
Workflow:
- Single-Cell Capture and Lysis: Isolate individual cells into 96-well plates.
- Reverse Transcription (RT): Perform first-strand cDNA synthesis using reverse transcriptase and barcoded poly-dT primers. Each well uses a unique barcode.
- cDNA Pooling: Pool the first-strand cDNA products from every 32 cells.
- PCR Amplification: Amplify the pooled cDNA using primers containing a second set of barcodes (e.g., 96 different barcodes). This enables a theoretical multiplexing of 3,072 single cells per run (32 x 96).
- Library Preparation & TGS Sequencing: Prepare the library according to the chosen TGS platform's specifications (e.g., using the PacBio MAS-ISO-seq kit) and sequence.
Protocol: Metabolic RNA Labeling for Nascent Transcript Detection (scGRO-seq)
This protocol uses click chemistry to label and capture newly synthesized RNA, providing high specificity for active transcription sites and gene dynamics [78].
Key Research Reagent Solutions:
- 3′-(O-propargyl)-NTPs: Alkyne-modified nucleotides for metabolic labeling of nascent RNA.
- 5′-Azide Single-Cell-Barcoded (5′-AzScBc) DNA Molecules: Covalently link to labeled RNA via click chemistry for single-cell resolution.
- Copper(I) Catalysts: For the click chemistry conjugation reaction.
Workflow:
- Nuclear Run-on Reaction: Isolate intact nuclei from cells. Incubate with
3′-(O-propargyl)-NTPsto label nascent RNA transcripts by elongating RNA polymerases. - Single-Nucleus Sorting: Sort individual nuclei into a 96-well plate, each well containing a unique
5′-AzScBc DNA moleculein a urea lysis buffer. - Click Chemistry Conjugation: Perform a copper(I)-catalyzed azide-alkyne cycloaddition (CuAAC) to covalently link the propargyl-labeled nascent RNA to the azide-functionalized barcode.
- Library Construction: Pool contents from all wells, reverse transcribe the barcoded RNA, amplify via PCR with a template-switching oligonucleotide (TSO), and prepare for sequencing.
Data Analysis and Validation for Specificity
Wet-Lab Validation of Findings
Computational findings, especially novel isoforms or expressed pseudogenes, require wet-lab validation.
- RT-PCR and Sanger Sequencing: As performed in the SCAN-seq2 study, select highly expressed novel transcripts or pseudogenes (e.g., TPM > 10) for validation. Design primers flanking the predicted novel splice junction, amplify cDNA from the original cell type, and sequence the products to confirm the exact sequence [77].
- Q-rtPCR for Sensitivity/Specificity Measurement: To quantitatively measure the sensitivity and specificity of the scRNA-seq data, select a panel of genes detected and not detected by sequencing. Perform Q-rtPCR on the same single-cell cDNA libraries. Sensitivity can be calculated as the percentage of sequencing-detected genes confirmed by Q-rtPCR, while specificity is the percentage of genes not detected by sequencing that are also negative by Q-rtPCR [79].
Computational Quality Control and Ambient RNA Removal
Robust bioinformatic preprocessing is critical for specificity.
- Cell Filtering: Filter cells based on library size, number of detected genes, and mitochondrial read percentage (e.g., <20%) to remove low-quality cells and debris [76].
- Doublet Detection: Use tools like
Scrubletto identify and remove multiplets [76]. - Ambient RNA Correction: Employ algorithms like
SoupXorDecontXto estimate and subtract background noise. Note that the source of ambient RNA can differ between droplet-based (e.g., 10x Chromium) and plate-based (e.g., BD Rhapsody) platforms, requiring tailored approaches [63]. - UMI-based Deduplication: Using Unique Molecular Identifiers (UMIs) to correct for PCR amplification bias is standard practice in most high-throughput protocols and is essential for accurate transcript counting [77] [9].
Application in Embryo Profiling Research
The integration of these sensitive and specific methods is revolutionizing human embryo research. A key application is the creation and authentication of a comprehensive human embryo reference tool.
- Reference Construction: By integrating multiple scRNA-seq datasets from human embryos (zygote to gastrula) and processing them through a unified pipeline, a high-resolution transcriptomic roadmap can be established. This reference allows for the continuous visualization of developmental progression and lineage specification [7].
- Model Authentication: This universal reference enables the unbiased benchmarking of stem cell-based embryo models. Querying model data against the reference accurately predicts cell identities and highlights transcriptional discrepancies, preventing misannotation [7]. The high sensitivity of modern protocols is crucial for detecting key transcription factors that drive lineage bifurcation, while specificity is needed to distinguish closely related embryonic cell types.
Table 2: Key Marker Genes for Embryonic Cell Types
| Cell Lineage | Key Marker Genes | Functional/Role Significance |
|---|---|---|
| Trophectoderm (TE) [7] | CDX2, NR2F2 | Early lineage specification |
| Cytotrophoblast (CTB) [7] | GATA2, GATA3, PPARG | Trophoblast differentiation |
| Epiblast (Epi) [7] | POU5F1 (OCT4), NANOG, VENTX | Pluripotency |
| Hypoblast [7] | GATA4, SOX17 | Primitive endoderm precursor |
| Primitive Streak (PriS) [7] | TBXT (Brachyury) | Mesoderm formation |
| Amnion [7] | ISL1, GABRP | Extraembryonic tissue development |
| Extraembryonic Mesoderm [7] | LUM, POSTN | Structural support and signaling |
In the context of high-throughput single-cell RNA sequencing (scRNA-seq) for embryo cell profiling, sample multiplexing has emerged as a foundational technique that enables the simultaneous processing of multiple samples in a single sequencing run. This approach, also referred to as "pooling," uses unique molecular tags to label individual cells or nuclei from different specimens, allowing them to be combined and processed together while maintaining sample identity throughout wet-lab and computational workflows [80] [81]. The strategic implementation of multiplexing is particularly valuable for embryonic development studies, where researchers must often balance the need to profile numerous specimens across developmental timepoints with constraints on technical resources and sequencing costs.
The core principle of sample multiplexing involves labeling cells from each independent sample with a unique identifier—typically a nucleotide barcode—before pooling them for downstream processing. These barcodes are then recovered during sequencing alongside the cellular transcriptomes, enabling computational demultiplexing to reconstitute individual sample identities [80]. For embryo research, this capability facilitates direct comparison of gene expression patterns across different developmental stages, genetic backgrounds, or experimental conditions while minimizing technical artifacts.
Multiplexing Strategies and Methodologies
Core Technical Approaches
Several biochemical strategies have been developed for introducing sample-specific barcodes into single-cell libraries, each with distinct advantages for particular experimental designs:
Lipid-based Membrane Anchoring: Methods like MULTI-seq utilize lipid- and cholesterol-modified oligonucleotides that integrate into live cell membranes, enabling sample multiplexing prior to single-cell partitioning [80]. This approach preserves cellular viability and is compatible with standard scRNA-seq workflows.
Antibody-based Hashtagging: Cell Hashing and Nucleus Hashing employ oligo-tagged antibodies targeting ubiquitous cell-surface proteins or nuclear pore complexes [80]. These techniques are particularly valuable for applications involving frozen nuclei or fixed cells, conditions often encountered in embryo research with precious clinical samples.
Genetic Barcoding: Vector-based systems such as CellTagging and Perturb-seq introduce heritable barcodes through lentiviral integration, enabling combinatorial tracing of cell lineages and transcriptomes over time [80]. This approach is powerful for longitudinal studies of embryonic development.
Chemical Internalization: sciPlex-RNA-seq exploits the propensity of permeabilized nuclei to absorb unmodified single-stranded DNA oligos, which are stabilized through chemical fixation [82]. This inexpensive and robust strategy enables virtually unlimited multiplexing capacity for large-scale perturbation studies.
Ultra-High-Throughput Methods
For massive-scale embryo profiling projects, combinatorial indexing approaches provide exceptional scalability. Single-cell ultra-high-throughput multiplexed sequencing (SUM-seq) extends two-step combinatorial indexing to co-assay chromatin accessibility and gene expression in single nuclei, enabling profiling of hundreds of samples at the million-cell scale [29]. This method uses barcoded oligos for ATAC and barcoded oligo-dT primers for RNA within a unified workflow, achieving a 7-fold increase in throughput compared to standard workflows while maintaining data quality [29].
Table 1: Performance Comparison of Select Multiplexing Methods
| Method | Multiplexing Capacity | Cell Recovery | Key Applications | Reference |
|---|---|---|---|---|
| Cell Hashing | 8 samples | 16,976 cells | PBMC profiling, species mixing | [80] |
| MULTI-seq | Up to 96 samples | 14,377-21,753 cells | Multiple cell lines, primary cells | [80] |
| sciPlex-ATAC | Virtually unlimited | 8,655 cells (in screen) | Chemical epigenomics, immune stimulation | [82] |
| SUM-seq | Hundreds of samples | 1.5 million nuclei per channel | Differentiation time courses, CRISPR screens | [29] |
Experimental Design and Protocol Implementation
SUM-seq Workflow for Embryo Profiling
The SUM-seq protocol represents a state-of-the-art approach for multiomic profiling of embryonic development, combining RNA and ATAC modalities with enhanced throughput:
Sample Preparation and Fixation
- Isolate nuclei from embryo specimens using standard protocols
- Fix nuclei with glyoxal to preserve molecular integrity
- Distribute fixed nuclei into equal bulk aliquots for barcoding
Combinatorial Indexing
- For ATAC modality: Index accessible genomic regions using Tn5 transposase loaded with barcoded oligos
- For RNA modality: Index mRNA molecules with barcoded oligo-dT primers via reverse transcription
- Add polyethylene glycol (PEG) to reverse transcription reaction to increase UMI and gene detection (~2.5- and ~2-fold improvements observed) [29]
Microfluidic Partitioning and Library Preparation
- Pool indexed samples and overload onto microfluidic system (e.g., 10x Chromium), allowing multiple nuclei per droplet
- Within droplets, fragments receive a second barcode (droplet barcode)
- Break droplets and pre-amplify both modalities
- Split library into equal proportions for modality-specific amplification
- Introduce library index for multiplexed sequencing
Data Processing
- Process reads using scalable Snakemake pipelines
- Assign reads to sample indices and demultiplex to single-cell resolution using droplet barcodes
- Generate matched gene expression and chromatin accessibility matrices [29]
Quality Control and Optimization
Robust quality control is essential for successful multiplexed experiments. Key considerations include:
Mitigating Barcode Hopping In initial SUM-seq experiments, barcode hopping within multinucleated droplets primarily affected the ATAC modality. This was successfully mitigated through two complementary strategies:
- Adding a blocking oligonucleotide in excess to the droplet barcoding step
- Reducing linear amplification cycles during droplet barcoding from 12 to 4 [29]
These optimizations reduced collision rates to 0.1% (UMIs) and 3.8% (ATAC fragments) in species-mixing experiments [29].
Cell Quality Assessment Standard quality control metrics should be applied with modality-specific considerations:
- For snRNA-seq: Assess UMIs and genes per cell
- For snATAC-seq: Evaluate fragments in peaks per cell, TSS enrichment score, and fragment size distribution [29] [83]
Table 2: Quality Control Metrics in Multiplexed Single-Cell Experiments
| Quality Metric | Target Range | Importance | Implementation |
|---|---|---|---|
| Hash Enrichment Score | >2-fold minimum | Sample identification confidence | Ratio of top to second hash count [82] |
| Mitochondrial Read Fraction | Variable by sample type | Cell viability assessment | Percentage of reads mapping to mitochondrial genes [83] |
| TSS Enrichment Score | >8 (snATAC-seq) | Chromatin data quality | Ratio of fragment density at TSSs to flanking regions [29] |
| Doublet Rate | <5% expected | Data integrity | Detection via scrublet or hash-based identification [82] |
Applications in Embryonic Development Research
Resolving Developmental Trajectories
Multiplexed single-cell technologies have enabled unprecedented resolution in studying embryonic development. In a landmark study of maize embryogenesis, researchers employed a combinatorial approach integrating scRNA-seq, spatial transcriptomics, and laser-microdissection RNA-seq to characterize gene expression networks during embryonic organ initiation [84]. This multiplexed framework allowed identification of shared, co-expressed genes during the initiation of embryonic organs, revealing an hourglass pattern of gene expression with evolutionarily ancient and conserved transcripts peaking during mid-embryogenesis [84].
Comparative Embryology Across Species
Cross-species comparisons benefit tremendously from multiplexed designs. By applying multiplexed spatial transcriptomic analyses to maize, Arabidopsis, and moss embryogenesis, researchers identified an inverse hourglass pattern across plant phyla, mirroring patterns observed in animal systems [84]. These findings suggest that phylotypic stages in both plants and animals are characterized by expression of ancient and conserved genes during histogenesis, organization of embryonic axes, and initial morphogenesis.
The Scientist's Toolkit: Essential Reagents and Materials
Table 3: Key Research Reagent Solutions for Multiplexed Single-Cell Studies
| Reagent/Material | Function | Application Notes |
|---|---|---|
| Barcoded Oligos | Sample multiplexing | CellPlex (CMOs), TotalSeq antibodies, or custom designs [81] |
| Glyoxal Fixative | Sample preservation | Enables asynchronous sampling; compatible with frozen storage [29] |
| PEG Additive | Reverse transcription enhancement | ~2.5x increase in UMIs and ~2x increase in genes detected [29] |
| Tn5 Transposase | Chromatin tagmentation | Loaded with barcoded oligos for ATAC indexing [29] |
| Blocking Oligonucleotides | Reduce barcode hopping | Added in excess during droplet barcoding step [29] |
| Unique Dual Indices | Library multiplexing | Enable index error correction; reduce misassignment [85] |
Workflow Visualization
Sample multiplexing represents a transformative methodology for embryonic development research, effectively balancing the competing demands of throughput, cost, and data quality. As single-cell technologies continue to evolve, multiplexed approaches will enable increasingly ambitious experimental designs—from comprehensive atlas-building projects characterizing entire embryogenic timelines to sophisticated perturbation studies dissecting gene regulatory networks. The integration of multiplexing with emerging spatial technologies and multiomic assays promises a more complete understanding of the complex molecular programs governing embryonic development, with profound implications for developmental biology, regenerative medicine, and evolutionary studies.
Best Practices in Experimental Design and Sample Preparation for Embryonic Tissues
Single-cell RNA sequencing (scRNA-seq) has revolutionized the study of embryonic development by enabling the unbiased transcriptional profiling of individual cells. This reveals cellular heterogeneity, lineage specification, and developmental trajectories that are impossible to discern with bulk sequencing methods [1] [9]. The quality of the resulting data, however, is profoundly dependent on the initial steps of experimental design and sample preparation. Optimal handling of embryonic tissues ensures that the transcriptional profiles captured are biologically accurate and minimally altered by technical artifacts [86]. This document outlines best practices for the experimental design and sample preparation of embryonic tissues, providing a standardized framework for researchers engaged in high-throughput scRNA-seq for embryo cell profiling.
Sample Preparation Fundamentals
Tissue Dissociation and Single-Cell Suspension
The primary goal of tissue dissociation is to generate a high-viability (>90%) single-cell suspension that preserves the original in vivo transcriptional state [86]. The chosen protocol must be optimized for the specific embryonic stage and tissue type, as their cellular composition and extracellular matrix (ECM) vary significantly.
- Embryonic and Newborn Tissues: For more delicate embryonic tissues, a gentle dissociation using TrypLE alone is often sufficient. This enzyme helps reduce incubation time and mechanical stress, which is crucial for minimizing stress-induced transcriptional changes [87].
- Adult or Denser Tissues: Tissues with a denser ECM may require a more robust approach. A two-step process involving a pre-treatment with Collagenase II to break down the ECM, followed by further dissociation, can significantly improve cell yield and viability [87].
During dissociation, it is critical to use nuclease-free reagents and add RNase inhibitors to prevent RNA degradation. Furthermore, resuspension buffers containing EDTA (>0.1 mM) or excess Mg²⁺ and Ca²⁺ ions should be avoided as they can interfere with the reverse transcription reaction, reducing cDNA yield [86].
Cell Viability and Stress Mitigation
Dead and dying cells can release RNA, causing contamination in downstream sequencing and confounding gene expression analysis. To eliminate these cells, methods such as gradient centrifugation or fluorescence-activated cell sorting (FACS) with cell viability dyes are recommended [86]. It is also vital to monitor for cellular stress, which can trigger aberrant expression of pro-apoptotic and stress-related genes. Employing "cold dissociation" techniques, where possible, can help minimize these dissociation-induced artifacts [86].
Alternative Approaches: Single-Nucleus RNA-seq (snRNA-seq)
For tissues that are exceptionally difficult to dissociate or when working with archived snap-frozen samples, single-nucleus RNA sequencing (snRNA-seq) presents a robust alternative [86]. This approach involves purifying nuclei from frozen tissue and has been shown to be less susceptible to dissociation-induced stress. snRNA-seq is particularly useful for:
- Complex and fragile tissues like brain, heart, or lung.
- Large cells, such as cardiomyocytes (up to 100 µm), which are difficult to capture on standard droplet-based microfluidic platforms [86]. It is important to note that nuclear transcriptomes are enriched for nascent transcripts and long non-coding RNAs (lncRNAs) and contain lower amounts of cytoplasmic mRNA compared to whole-cell preparations [86].
Sample Preservation Strategies
When immediate processing of fresh material is not feasible, particularly for clinical or logistically challenging samples, preservation is necessary. The two primary methods compatible with scRNA-seq are:
- Cryopreservation: Freezing cells in a cryoprotectant like DMSO.
- Methanol Fixation: Fixing cell suspensions with 80% methanol and storing at -80°C [86]. A manufacturer's protocol from 10x Genomics also indicates that fixation with 4% formaldehyde and storage at -80°C for up to three months can be compatible with single-nucleus whole-transcriptome profiling [86].
Table 1: Summary of Sample Preparation and Isolation Methods
| Method | Principle | Advantages | Limitations | Best For |
|---|---|---|---|---|
| Enzymatic Dissociation (TrypLE) [87] | Enzymatic breakdown of ECM. | Gentle, reduced stress, shorter incubation. | May be insufficient for dense tissues. | Embryonic and newborn tissues. |
| Enzymatic Dissociation (Collagenase-based) [87] | Robust enzymatic breakdown of dense ECM. | High yield from dense tissue. | Longer incubation, higher stress risk. | Adult or dense tissues. |
| Single-Nucleus RNA-seq (snRNA-seq) [86] | Isolation and sequencing of nuclei. | Minimizes dissociation artifacts; works with frozen tissue. | Lower mRNA amount; different transcript profile. | Difficult-to-dissociate, fragile, or frozen tissues. |
| FACS [9] | Cell sorting based on light scattering/fluorescence. | High purity; can select specific cell types. | Requires specialized equipment; can be stressful to cells. | Selecting specific populations from a heterogeneous sample. |
Experimental Design for High-Throughput Studies
Balanced Experimental Design and Batch Effect Control
In high-throughput scRNA-seq studies, technical variation is inevitable. A "balanced experimental design" is paramount, where different experimental conditions and controls are evenly distributed across all stages of processing—from sample preparation to library construction [86]. For example, all conditions should be represented on each multi-well plate or droplet chip. This design allows for the clear identification and statistical correction of batch effects during data analysis.
To proactively manage batch effects, researchers can use molecular techniques such as:
- Cell "Hashtagging": Labeling cells from different samples with unique barcoded antibodies before pooling [86].
- Genetic Demultiplexing: Using natural genetic variation (e.g., Single Nucleotide Polymorphisms, SNPs) to distinguish cells from different donors after sequencing [86].
scRNA-seq Technology Selection
Selecting the appropriate scRNA-seq platform depends on the specific research goals, as methods differ in sensitivity, throughput, and transcript coverage.
- Plate-based methods (e.g., Smart-Seq2): Generally offer higher sensitivity and detect more genes per cell. They are full-length transcript protocols, making them ideal for isoform usage analysis, allelic expression detection, and identifying low-abundance genes [86] [9].
- Droplet-based methods (e.g., 10x Genomics, Drop-Seq): Provide much higher throughput, processing thousands to tens of thousands of cells in a single run at a lower cost per cell. These are typically 3'- or 5'-end counting protocols and are excellent for large-scale atlas projects and discovering cellular heterogeneity in complex samples like whole embryos [86] [9].
Table 2: Comparison of Key scRNA-seq Technologies
| Protocol | Isolation Strategy | Transcript Coverage | UMI | Amplification Method | Key Application in Embryonic Research |
|---|---|---|---|---|---|
| Smart-Seq2 [9] | FACS/Microfluidics | Full-length | No | PCR | High-detection of genes; ideal for low-abundance transcripts and alternative splicing in rare embryonic cell types. |
| Drop-Seq [9] | Droplet-based | 3'-end | Yes | PCR | High-throughput, cost-effective profiling of thousands of cells from entire embryos or complex tissues. |
| inDrop [9] | Droplet-based | 3'-end | Yes | IVT | Similar to Drop-Seq; uses hydrogel beads for barcoding. |
| CEL-Seq2 [9] | FACS | 3'-only | Yes | IVT | Linear amplification can reduce bias. |
| Seq-well [9] | Droplet-based | 3'-only | Yes | PCR | Portable, low-cost platform; suitable for resource-limited settings. |
Analytical Validation and Benchmarking
The Importance of a Unified Embryonic Reference
For research involving stem cell-based embryo models (SCBEMs) or embryonic cells, benchmarking against a reliable in vivo reference is crucial. An integrated and well-annotated scRNA-seq dataset from human embryos provides an unbiased standard for evaluating the molecular and cellular fidelity of in vitro models [7]. Without such a reference, there is a significant risk of misannotating cell lineages in embryo models [7].
A comprehensive human embryo reference tool has been developed by integrating multiple published datasets, covering development from the zygote to the gastrula stage. This tool allows researchers to project their own scRNA-seq data onto the reference map to predict cell identities and assess developmental maturity [7]. Key lineages and their known marker genes used for validation include:
- Trophectoderm (TE) / Trophoblast: Expresses CDX2, GATA2, GATA3 [7] [1].
- Epiblast (EPI): Expresses POU5F1 (OCT4), NANOG, SOX2 [7] [1].
- Hypoblast / Primitive Endoderm (PrE): Expresses GATA4, GATA6, SOX17 [7] [1].
- Primitive Streak (PriS): Expresses TBXT (T Brachyury) [7].
- Amnion: Expresses ISL1, GABRP [7].
Trajectory Inference Analysis
Beyond static cell identity, tools like Slingshot can be used to infer developmental trajectories and pseudotemporal ordering of cells [7]. This analysis helps reconstruct the continuum of development and identify transcription factors dynamically expressed along lineage paths, such as the downregulation of DUXA and FOXR1 after the morula stage and the upregulation of HMGN3 in post-implantation stages of the epiblast, hypoblast, and trophoblast lineages [7].
The Scientist's Toolkit: Research Reagent Solutions
Table 3: Essential Reagents for Embryonic Tissue scRNA-seq
| Reagent / Material | Function | Example & Notes |
|---|---|---|
| TrypLE [87] | Gentle enzyme for tissue dissociation. | Ideal for dissociating delicate embryonic and newborn tissues. |
| Collagenase II [87] | Robust enzyme for digesting dense extracellular matrix. | Used for a pre-treatment step in dissociating adult or dense tissues. |
| RNase Inhibitors | Protects RNA from degradation during sample processing. | Critical for maintaining RNA integrity. |
| Viability Dyes | Labels dead cells for removal via FACS. | e.g., Propidium Iodide; allows for selection of high-viability cells. |
| DMSO | Cryoprotectant for cell freezing/preservation. | Used for cryopreservation of single-cell suspensions. |
| Barcoded Beads | Carries cell-specific barcodes and primers for droplet-based scRNA-seq. | e.g., SeqB beads for inDrop; essential for in-droplet reverse transcription. |
| Cell Hashing Antibodies | Allows sample multiplexing to counter batch effects. | Antibodies conjugated to sample-specific barcodes enable pooling of samples pre-processing. |
Integrated Experimental Workflow
The following diagram summarizes the key decision points and pathways in a comprehensive scRNA-seq workflow for embryonic tissues.
Key Signaling Pathways in Embryonic Development
Understanding key signaling pathways is essential for designing experiments and interpreting scRNA-seq data from embryonic tissues and models. The following diagram outlines critical pathways and their interactions.
Ensuring Rigor and Relevance: Validation and Comparative Analysis Frameworks
High-throughput single-cell RNA sequencing (scRNA-seq) has become an indispensable tool for deconstructing the complex cellular heterogeneity of early human development. For embryo cell profiling research, where sample availability is extremely limited and cell numbers per embryo are low, the sensitivity and accuracy of the technology are paramount [7]. The usefulness of stem cell-based embryo models, a key tool in developmental biology, hinges on their molecular fidelity to in vivo embryos, making precise and sensitive transcriptional profiling a critical step for validation [7]. This application note provides a structured benchmark of current high-throughput scRNA-seq and spatial transcriptomics (ST) platforms, framing their performance within the specific context of embryo cell profiling to guide researchers in selecting the optimal methodology for their experimental goals.
Performance Benchmarking of scRNA-seq and Spatial Transcriptomics Platforms
Key Metrics for scRNA-seq Platform Evaluation
The foundational step in any scRNA-seq experiment is the effective isolation of viable single cells or nuclei from the tissue of interest [88]. Following this, the basic analytical workflow involves processing raw data, controlling quality, normalizing data, and performing dimensionality reduction to uncover cellular heterogeneity [15]. The performance of a scRNA-seq platform is typically evaluated based on its sensitivity—the ability to detect a high fraction of expressed genes, particularly low-abundance transcripts—and its accuracy in quantifying gene expression levels without technical bias.
Benchmarking High-Sensitivity Commercial Platforms
A recent technical note highlights the performance of Lexogen's LUTHOR HD, a scRNA-seq kit leveraging THOR (T7 High-resolution Original RNA amplification) technology. This platform is designed for high sensitivity, demonstrating the capability to detect a single gene copy within a cell and to capture up to 95% of expressed genes at a sequencing depth of 1 million reads [89]. This level of sensitivity is crucial for embryo research, where detecting low-copy genes can be key to identifying rare cell subtypes or subtle transcriptional changes during lineage specification.
Comparative Analysis of Imaging-Based Spatial Transcriptomics (iST) Platforms
For research where spatial context is critical, imaging-based spatial transcriptomics (iST) platforms offer single-cell resolution within intact tissue sections. A systematic benchmark of three commercial iST platforms—10X Genomics Xenium, Vizgen MERSCOPE, and NanoString CosMx—on Formalin-Fixed Paraffin-Embedded (FFPE) tissues provides critical performance insights [90].
Table 1: Benchmarking of Imaging-Based Spatial Transcriptomics Platforms on FFPE Tissues
| Performance Metric | 10X Genomics Xenium | NanoString CosMx | Vizgen MERSCOPE |
|---|---|---|---|
| Relative Sensitivity | Consistently higher transcript counts per gene without sacrificing specificity [90] | High total transcript recovery, though gene-wise counts may deviate from scRNA-seq [90] [91] | Lower total transcript counts compared to Xenium and CosMx [90] |
| Concordance with scRNA-seq | High concordance with orthogonal scRNA-seq data [90] | Measures RNA transcripts in concordance with scRNA-seq [90] | Information not specified in search results |
| Spatial Cell Typing | Capable of spatially resolved cell typing with slight edge in sub-clustering over MERSCOPE [90] | Capable of spatially resolved cell typing with slight edge in sub-clustering over MERSCOPE [90] | Capable of spatially resolved cell typing, but finds slightly fewer clusters than Xenium and CosMx [90] |
| Key Technical Notes | Improved segmentation capabilities with additional membrane staining [90] | Updated detection algorithms; high total transcript recovery but potential deviation from scRNA-seq profile [90] [91] | Relies on tiling transcripts with many probes for signal amplification [90] |
A more recent benchmark including next-generation platforms like Xenium 5K and CosMx 6K reinforces that Xenium demonstrates superior sensitivity for multiple marker genes and shows high gene-wise correlation with matched scRNA-seq profiles [91]. While CosMx 6K can detect a high total number of transcripts, its gene-wise counts showed a substantial deviation from the scRNA-seq reference, a discrepancy not fully resolved by adjusting quality control thresholds [91].
Experimental Protocols for Embryo Cell Profiling
Integrated Workflow for Embryo Model Validation
A comprehensive experimental protocol for profiling embryo and embryo model cells involves both single-cell and spatial transcriptomics, integrated with a robust computational reference.
Diagram 1: Experimental workflow for embryo model validation.
Protocol 1: Establishing a Universal Human Embryo Reference
To authenticate human embryo models, an organized and integrated scRNA-seq dataset serving as a universal reference is essential [7].
- Data Collection and Reprocessing: Collect published human embryogenesis scRNA-seq datasets covering developmental stages from zygote to gastrula. Reprocess all raw data using a standardized pipeline with the same genome reference and annotation to minimize batch effects [7].
- Data Integration and Annotation: Employ fast mutual nearest neighbor (fastMNN) methods to integrate the expression profiles of thousands of early human embryonic cells into a unified embedding, such as a UMAP. Annotate cell lineages based on known markers and original publications, capturing continuous developmental progression [7].
- Trajectory Inference and Marker Identification: Use trajectory inference tools (e.g., Slingshot) on the integrated data to reveal developmental trajectories for the epiblast, hypoblast, and trophectoderm lineages. Identify unique marker genes for each distinct cell cluster across development [7].
- Tool Deployment: Create a user-friendly online prediction tool (e.g., with Shiny interfaces) that allows researchers to project their own query datasets onto the integrated reference for automated cell identity annotation and benchmarking [7].
Protocol 2: High-Sensitivity scRNA-seq for Low-Abundance Transcripts
This protocol leverages ultra-sensitive chemistry for profiling precious embryo samples where capturing the full transcriptome depth is critical.
- Single-Cell Suspension: Prepare a single-cell suspension from the embryo or embryo model using gentle dissociation protocols to maximize cell viability and minimize stress responses [88] [15].
- Library Preparation with LUTHOR HD: Use the LUTHOR High-Definition Single Cell 3’ mRNA-Seq Kit. This protocol utilizes THOR technology, which amplifies RNA directly from the original mRNA template. This direct amplification is key to achieving high sensitivity for low-copy genes [89].
- Sequencing: Sequence the libraries to a sufficient depth (e.g., 1 million reads per cell) to leverage the platform's capability to detect up to 95% of expressed genes [89].
- Data Transformation and Analysis: Process the raw count data. A benchmark study suggests that for many downstream analyses, a simple logarithmic transformation with a pseudo-count followed by principal component analysis performs as well as or better than more sophisticated alternatives for UMI-based data [62]. Proceed with standard clustering and differential expression analysis.
Data Analysis and Computational Methods
Analytical Workflow for scRNA-seq Data
The analysis of scRNA-seq data follows a structured workflow to transform raw sequencing data into biological insights. Key steps include stringent quality control to remove damaged cells and doublets, data normalization and transformation to handle heteroskedasticity, and dimensionality reduction for visualization and clustering [15]. Cell type annotation is then performed using marker genes, which can be validated against a custom embryo reference atlas [7].
Diagram 2: Computational analysis pipeline for scRNA-seq data.
Critical Data Transformation Choices
A critical preprocessing step is adjusting the counts for variable sampling efficiency and transforming them to stabilize variance across the dynamic range, which makes subsequent statistical analysis more reliable [62]. For UMI-based data, which follows a gamma-Poisson distribution, several transformation approaches exist:
- Delta Method (e.g., Shifted Logarithm): Applies a non-linear function like
log(y/s + y0), whereyis the count,sis a size factor, andy0is a pseudo-count. The choice of pseudo-count is critical and can be parameterized based on the dataset's typical overdispersion [62]. - Pearson Residuals: As implemented in tools like
sctransform, this method fits a gamma-Poisson generalized linear model (GLM) to the data and calculates residuals, which effectively stabilizes variance and can better handle variations in cell size factors compared to the delta method [62]. - Latent Expression and Factor Analysis: These methods infer latent gene expression values or directly produce a low-dimensional representation using count-based models like gamma-Poisson factor analysis [62].
A comprehensive benchmark found that for many common analytical tasks, a rather simple approach—the logarithm with a pseudo-count followed by principal component analysis—performed as well as or better than more sophisticated alternatives [62].
Table 2: Key Research Reagent Solutions and Computational Tools
| Item Name | Function / Application | Key Features / Notes |
|---|---|---|
| LUTHOR HD Single Cell 3' Kit | High-sensitivity scRNA-seq library preparation | Utilizes THOR technology for direct RNA amplification; detects single gene copies and up to 95% of expressed genes [89]. |
| 10X Genomics Xenium | Targeted in situ transcriptomics on FFPE tissues | High transcript counts per gene, strong concordance with scRNA-seq, excellent for spatial cell typing [90] [91]. |
| NanoString CosMx 6K | Targeted in situ transcriptomics on FFPE tissues | High-plex gene panel (6000+ genes), high total transcript recovery, single-molecule resolution [91]. |
| Integrated Human Embryo Reference | Computational tool for annotating and benchmarking embryo models | Integrated scRNA-seq dataset from zygote to gastrula; provides a universal reference for cell identity prediction [7]. |
| sctransform / transformGamPoi | R packages for data normalization and transformation | Uses Pearson residuals from a gamma-Poisson GLM for effective variance stabilization [62]. |
In the field of developmental biology, high-throughput single-cell RNA sequencing (scRNA-seq) has revolutionized our ability to profile embryonic cells and understand the molecular dynamics of embryogenesis. However, a significant challenge remains in establishing a definitive ground truth for cell identity and transcriptional dynamics, as different single-cell platforms and methodologies can yield varying results. This application note addresses the critical need for cross-platform concordance by presenting a standardized framework that combines metabolic labeling techniques with multi-modal data integration. We focus specifically on applications for embryonic cell profiling, providing validated protocols and analytical workflows to enhance the reliability and reproducibility of research in this sensitive and rapidly advancing field. The establishment of such ground truth is particularly vital for studies of the maternal-to-zygotic transition, lineage commitment, and the characterization of novel cellular states in early development [92].
Recent benchmarking studies have quantitatively evaluated the performance of various chemical conversion methods used in metabolic RNA labeling for scRNA-seq. The table below summarizes the performance of key methods when applied to zebrafish embryonic cells, providing a critical reference for selecting appropriate protocols for embryonic cell studies [92].
Table 1: Performance Benchmarking of Chemical Conversion Methods for Metabolic scRNA-seq on ZF4 Cells (Drop-seq Platform)
| Chemical Conversion Method | Condition | Average T-to-C Substitution Rate (%) | Median UMIs per Cell | Median Genes per Cell |
|---|---|---|---|---|
| mCPBA/TFEA | pH 7.4 | 8.40 | 2,472 | 1,109 |
| mCPBA/TFEA | pH 5.2 | 8.11 | 2,472 | 1,109 |
| NaIO4/TFEA | pH 5.2 | 8.19 | 2,472 | 1,109 |
| IAA (on-beads) | 32 °C | 6.39 | 2,472 | 1,109 |
| IAA (in-situ) | 37 °C | 2.62 | 2,472 | 1,109 |
The data demonstrates that on-beads methods, particularly the mCPBA/TFEA combination, achieve superior T-to-C conversion efficiency—a key metric for accurately detecting newly synthesized RNA. This is critical for embryonic studies where capturing precise transcriptional dynamics is essential. Furthermore, the same study highlighted that on-beads IAA chemistry showed optimal performance when paired with commercial scRNA-seq platforms like 10x Genomics and MGI C4, which offer higher cell capture efficiency (~50%), a vital consideration for working with the limited cell numbers available from early-stage embryos [92].
Establishing ground truth also benefits from cross-modal validation. A direct comparison of scRNA-seq and mass cytometry on a split-sample of human PBMCs revealed the extent of correlation—and divergence—between transcriptomic and proteomic measurements. This dataset serves as a valuable gold standard for developing integrative computational tools that can refine cell population identification, an approach directly applicable to embryonic cell characterization [93].
Experimental Protocols
Metabolic Labeling and scRNA-seq of Zebrafish Embryonic Cells
This protocol is optimized for capturing transcriptional dynamics during the maternal-to-zygotic transition in zebrafish embryogenesis [92].
Reagents and Equipment
- Zebrafish embryos at desired developmental stage(s)
- 4-Thiouridine (4sU), 100 μM working concentration
- Methanol (for fixation)
- mCPBA/TFEA pH 5.2 reaction reagents
- Single-cell suspension kit (e.g., gentle dissociation enzyme mix)
- Drop-seq platform or commercial alternative (10x Genomics, MGI C4)
- Appropriate barcoded beads (for Drop-seq) or chips/chambers (for commercial platforms)
Procedure
- Metabolic Labeling: Incubate dechorionated zebrafish embryos in 100 μM 4sU for 4 hours to incorporate the nucleoside analog into newly synthesized RNA [92].
- Cell Dissociation and Fixation:
- Manually dissociate the embryos into a single-cell suspension using a gentle enzymatic dissociation kit to preserve cell integrity.
- Centrifuge and resuspend the cell pellet. Fix cells by slow drop-wise addition of cold methanol to a final concentration of 80% under continuous gentle vortexing. Incubate at -20°C for 15 minutes.
- Centrifuge, remove methanol, and wash the fixed cell pellet with cold PBS. Cryopreserve the fixed cells or proceed directly to single-cell encapsulation.
- Single-Cell Encapsulation and Library Preparation:
- For Drop-seq Platform: Perform single-cell encapsulation with barcoded beads and lyse cells to release mRNA, which is captured on the beads. Perform the on-beads mCPBA/TFEA pH 5.2 chemical conversion reaction to induce T-to-C conversions in 4sU-labeled transcripts.
- For 10x Genomics Platform: Perform the mCPBA/TFEA chemical conversion on-beads after mRNA capture, following platform-specific protocols.
- Proceed with reverse transcription, cDNA amplification, and library construction according to the chosen platform's standard instructions.
- Sequencing and Data Processing: Sequence the libraries on an Illumina platform. Process the raw sequencing data using the dynast pipeline [92] to align reads and quantify T-to-C substitution rates, or use Cell Ranger (for 10x data) followed by analysis with Seurat or Scanpy [36] [93] [94].
Multi-Modal Ground Truth Validation with scRNA-seq and Mass Cytometry
This protocol describes a split-sample approach for direct comparison of transcriptomic and proteomic profiles from the same cell population, establishing a robust ground truth for cell identity [93].
Reagents and Equipment
- Single-cell suspension (e.g., from dissociated embryonic tissue)
- RPMI 1640 with 5% FBS (for cell recovery)
- Metal-conjugated antibody panel for mass cytometry (see Table 2 for suggested markers)
- Cisplatin (viability stain)
- Paraformaldehyde (fixative)
- Iridium intercalator (DNA stain)
- 10x Genomics Single Cell 3' Reagent Kit
- Mass cytometer (CyTOF)
Procedure
- Split-Sample Preparation:
- Thaw or prepare a single-cell suspension and incubate at 37°C for 1 hour for recovery.
- Split the cell sample into two aliquots: one for scRNA-seq (e.g., 3×10^5 cells) and one for mass cytometry.
- scRNA-seq Sample Processing:
- Process the first aliquot according to the standard 10x Genomics protocol. Include a viability stain during sample prep if not using fixed cells.
- Generate gene expression count matrices using Cell Ranger.
- Mass Cytometry Sample Processing:
- Stain the second aliquot with cisplatin to identify viable cells.
- Fix cells in 1.6% paraformaldehyde for 10 minutes at room temperature. Permeabilize with cold methanol if intracellular markers are targeted.
- Stain the fixed/permeabilized cells with a pre-titrated panel of metal-conjugated antibodies.
- Incubate with Iridium intercalator overnight at 4°C for DNA staining.
- Acquire data on the mass cytometer at a target rate of ~250 cells/second.
- Data Integration and Analysis:
- Process scRNA-seq data using Seurat or Scanpy, performing clustering and cell type annotation based on canonical marker genes.
- Process mass cytometry data (normalization, debarcoding) using instrument-specific software and perform clustering in Scanpy.
- Compare cell type proportions and marker expression between the two modalities. Use computational tools like COMET [93] to infer protein expression from scRNA-seq data and validate against the mass cytometry ground truth.
The following workflow diagram illustrates the integrated experimental and computational pipeline for establishing cellular ground truth.
Computational Analysis
The establishment of ground truth requires a robust computational pipeline for data integration and validation. The following diagram outlines the key steps and tool recommendations for analyzing multi-modal single-cell data.
For embryonic studies, tools like Velocyto (for RNA velocity) and Monocle 3 (for trajectory inference) are particularly valuable for modeling dynamic processes like differentiation [36]. When integrating data from multiple platforms or experiments, Harmony or scvi-tools provide superior batch correction while preserving biological variation [36] [94]. The dynast pipeline is specifically designed for the analysis of metabolic labeling scRNA-seq data, enabling precise quantification of RNA synthesis and degradation rates [92].
The Scientist's Toolkit
Table 2: Essential Research Reagent Solutions for Embryonic Cell Profiling
| Category | Item | Function/Application | Example/Note |
|---|---|---|---|
| Metabolic Labeling | 4-Thiouridine (4sU) | Nucleoside analog incorporated into newly synthesized RNA for tracking transcriptional dynamics. | Use at 100 μM for 4 hours in zebrafish embryos [92]. |
| 5-Ethynyluridine (5EU) | Alternative nucleoside analog for metabolic RNA labeling. | Compatible with click chemistry detection [92]. | |
| Chemical Conversion | mCPBA/TFEA | High-efficiency chemistry for inducing T-to-C conversions in 4sU-labeled RNA. | Highest performance in on-beads format [92]. |
| Iodoacetamide (IAA) | Alternative alkylating agent for 4sU conversion (SLAM-seq). | Optimal for use with commercial 10x Genomics platform [92]. | |
| scRNA-seq Platforms | Drop-seq | Customizable, low-cost droplet-based scRNA-seq platform. | Enables flexible on-beads chemical conversion [92]. |
| 10x Genomics | Commercial droplet-based platform with high cell capture efficiency. | Ideal for limited embryonic cell samples [92] [94]. | |
| Proteomic Validation | Metal-Conjugated Antibodies | Panel for mass cytometry to validate protein-level expression. | Targets for embryonic cells: CDX2, SOX2, NANOG, GATA6 [93]. |
| Bioinformatics Tools | dynast | Dedicated pipeline for analyzing metabolic labeling scRNA-seq data. | Quantifies T-to-C rates and RNA dynamics [92]. |
| Seurat / Scanpy | Comprehensive toolkits for primary scRNA-seq data analysis. | R and Python standards, respectively [36] [93]. | |
| CellBender | Deep learning tool to remove ambient RNA noise from droplet data. | Crucial for improving data quality [36]. |
Ethical and Regulatory Considerations
Research involving embryonic cells and embryo models necessitates rigorous ethical oversight. The International Society for Stem Cell Research (ISSCR) has established clear guidelines for such work. Key considerations for your research include:
- Oversight and Rationale: All research involving stem cell-based embryo models (SCBEMs) must have a clear scientific rationale, a defined endpoint, and be subject to appropriate oversight mechanisms [57] [95].
- Ex Utero Culture Limits: A fundamental ethical red line is the prohibition on culturing any human SCBEM to the point of potential viability (ectogenesis). Furthermore, these models must never be transferred to the uterus of a human or animal host [57] [95].
- Informed Consent: The use of human embryos or gametes for research, where permitted by law, depends on voluntary and informed consent from donors [57].
Adherence to these principles, alongside local laws and regulations, is essential for maintaining scientific and ethical integrity in the field [57].
In the context of high-throughput single-cell RNA sequencing (scRNA-seq) for embryo cell profiling, a significant limitation persists: the loss of native spatial context. While scRNA-seq excels at resolving cellular heterogeneity and identifying novel cell states in developing embryos, it requires tissue dissociation, thereby disrupting the precise spatial coordinates and tissue architecture that are fundamental to understanding embryonic patterning, morphogenesis, and cell-fate decisions [96] [97]. Spatial transcriptomics (ST) has emerged as a pivotal complementary technology that maps gene expression within intact tissue sections, preserving this critical spatial localization information [98] [99]. This application note details protocols for integrating scRNA-seq and ST data to spatially validate single-cell findings, thereby bridging the gap between cell identity and location within the complex tissue architecture of embryonic systems.
Methodologies for Data Integration
The integration of scRNA-seq and ST data primarily leverages two computational strategies: deconvolution and mapping. These methods allow researchers to infer cell-type compositions within spatial spots or to project single-cell data back into a spatial context.
Deconvolution-Based Integration
Deconvolution algorithms use scRNA-seq data as a reference to estimate the abundance of different cell types within each capture location of a lower-resolution ST dataset.
SPECTRUM Protocol: This unified method performs cell-type deconvolution by leveraging prior known cell-type-specific marker genes and incorporating spatial pattern weighting [98].
- Data Preparation: Input ST data with location information and a curated set of cell-type-specific marker genes, obtainable from literature and public databases. The expression data is filtered using this list to retain informative gene features.
- Feature Matrix Factorization: Apply nonnegative matrix factorization (NMF) to the raw feature matrix to decompose it into interpretable components representing distinct spatial patterns. The number of latent factors is limited to the number of potential cell types, L.
- Spatial Pattern Weighting: Quantify the spatial restriction of each feature's expression by computing a localized score. This score is derived from the correlation between the spatial size and connectivity of expressing cells, represented as an undirected graph.
- Weighted Cell-Type Assignment: A weighted least squares approach, specifically non-negative least squares (NNLS), is used to find the relationship between cell types and latent factors, ultimately yielding the proportion of each cell type across all spatial spots [98].
Alternative Tools: Other established deconvolution tools include SPOTlight, RCTD, and CARD, which use single-cell transcriptomic data to define cell-type-specific profiles for decoding cell-type compositions in ST data. Methods like STdeconvolve do not require a parallel single-cell reference but may have lower deconvolution efficiency [98].
Mapping-Based Integration
Mapping algorithms aim to precisely assign individual cells from a scRNA-seq dataset to specific locations within a spatial transcriptomics framework.
- CMAP Protocol: Cellular Mapping of Attributes with Position (CMAP) is a method designed to map large-scale individual cells to their precise spatial locations through a divide-and-conquer strategy [99].
- CMAP-DomainDivision (Level 1): Utilizes expression profiles and spatial coordinates from ST data to identify spatially specific genes and cluster spatial domains using a hidden Markov random field (HMRF). A classification model, such as a support vector machine (SVM), is then trained to assign spatial domain labels to individual cells, effectively reducing the search space.
- CMAP-OptimalSpot (Level 2): Within each spatial domain, spatially variable genes are identified. A random alignment matrix between cells and spots is generated, and a cost function measuring the discrepancy between actual and aggregated spatial expression patterns is constructed. This cost function is optimized using deep learning-based optimization, incorporating an image-based metric (Structural Similarity Index, SSIM) and information entropy.
- CMAP-PreciseLocation (Level 3): A nearest neighbor graph is built to represent relationships among spots. A Spring Steady-State Model, learned from a physical field, is then employed to assign each cell an exact (x, y) coordinate within the spatial context, achieving resolution beyond the spot level [99].
Table 1: Benchmarking Performance of Mapping Tools on Simulated Mouse Olfactory Bulb Data
| Method | Cell Usage Ratio | Mapping Accuracy (to correct spot) | Key Features |
|---|---|---|---|
| CMAP | 99% (2215/2242 cells) | 74% (1629 cells) | Three-step mapping; precise coordinate assignment |
| CellTrek | 45% (999/2242 cells) | Not specified | Co-embedding and mutual nearest neighbor |
| CytoSPACE | 52% (1164/2242 cells) | Not specified | Relies on deconvolution and cell number estimation |
Experimental Protocols for Spatial Validation
Identifying Spatial Communities and Niches
Beyond cell-type mapping, SPECTRUM provides a protocol for identifying spatial communities—distinct tissue regions sharing similar cellular compositions and spatial relationships that often reflect functional structures [98].
- Feature Construction: Use the deconvoluted cell-type proportion matrix
P, where each row represents a spot's cell-type abundance vector. - Neighborhood Information Incorporation: Enrich each spot's feature vector by aggregating the cell-type compositions of its neighboring spots within a predefined radius. A decay function (e.g., exponential) models the decreasing influence of spots with increasing spatial distance.
- Clustering Analysis: Perform clustering analysis, using the Louvain algorithm by default, on the PCA embeddings of these enriched feature vectors to reveal spatially coherent communities.
Inferring Cell-Cell Communication in Spatial Context
SPECTRUM can also infer cell-cell communication (CCC) in low-resolution ST data by constraining interactions to the spot level [98].
- Ligand-Receptor (LR) Pair Screening: Select LR pairs from databases like CellChatDB, retaining only interactions with detectable expression in the sample.
- Spatial Constraint: Extract downstream transcription factor targets linked to these LR pairs from the OmniPath database. These targets serve as indicators of active signaling pathways.
- Spatial Proximity Analysis: The inference is inherently spatial, as it examines potential interactions based on the co-localization or proximity of cell types expressing ligands and receptors within the tissue architecture.
Spatial Validation Workflow for scRNA-seq Data
Application to Embryonic Development
Applying these integrated approaches to embryonic development can uncover profound biological insights.
- Uncovering Functional Plasticity in Limb Development: In a study on human limb development, applying SPECTRUM revealed that context-dependent cellular communication supports the functional plasticity of cells within spatial communities, illustrating how tissue organization is linked to function [98].
- Resolving Endothelial Cell Heterogeneity: CMAP has demonstrated the capacity to dissect nuanced spatial-organ-specific endothelial cell heterogeneity, a finding highly relevant to understanding vascular patterning in developing embryos [99].
Table 2: Essential Research Reagent Solutions for scRNA-seq and ST Integration
| Item | Function | Example/Note |
|---|---|---|
| Curated Marker Gene Panel | Provides prior knowledge for cell-type identification in deconvolution. | Obtain from literature or databases; crucial for SPECTRUM [98]. |
| Spatial Transcriptomics Slide | Captures genome-wide expression data with spatial barcodes. | e.g., 10x Genomics Visium, Xenium [99]. |
| Cell-Cell Interaction Database | Provides ligand-receptor pairs for communication inference. | e.g., CellChatDB, OmniPath [98]. |
| Nuclear Stain | Aids in cell segmentation and spot assignment in ST data. | e.g., DAPI; used in CMAP validation [99]. |
| Combinatorial Indexing Reagents | Enables ultra-high-throughput single-cell profiling for large atlases. | Used in SUM-seq for scalable multiomics [29]. |
Visualization and Data Interpretation
Effective visualization is critical for interpreting spatially resolved data.
- Spatially Aware Color Palettes: When visualizing clusters or cell types on spatial maps, default color assignments can assign similar colors to neighboring clusters, confusing interpretation. The Palo tool optimizes color palette assignments in a spatially aware manner. It calculates a spatial overlap score between cluster pairs and then assigns visually distinct colors to clusters with high spatial overlap, thereby improving the discernibility of tissue domains [100].
- Visualization Packages: Tools like scCustomize offer optimized default color palettes for discrete and continuous variables, including colorblind-friendly options from the viridis package, which enhance the clarity and accessibility of spatial plots [101].
Spatial Analysis Applications in Embryonic Systems
The synergistic integration of single-cell and spatial transcriptomic technologies provides a powerful framework for validating scRNA-seq findings within the native tissue architecture of embryos. The combined application of deconvolution and mapping methods, complemented by spatially-aware bioinformatic tools for visualization and communication inference, enables a comprehensive understanding of embryonic development at molecular, cellular, and tissue organizational levels. This approach is indispensable for moving beyond cataloging cell types towards a mechanistic understanding of how spatial context instructs cell fate and tissue formation.
Application Note: Assessing Cluster Stability with scICE
Background and Purpose
In single-cell RNA sequencing (scRNA-seq) analysis, clustering algorithms are foundational for identifying cell sub-populations. However, widely used graph-based methods like Leiden and Louvain rely on stochastic processes, leading to significant variability in clustering results across different runs due to random seed changes [102]. This inconsistency undermines the reliability of downstream biological interpretations, especially in sensitive applications like human embryo profiling where accurate lineage identification is critical. This note details the application of the single-cell Inconsistency Clustering Estimator (scICE) to evaluate clustering consistency and generate robust results for embryo cell type identification [102].
Detailed Protocol
Step 1: Data Preprocessing and Dimension Reduction
- Input: Raw UMI count matrix from scRNA-seq of human embryo samples.
- Quality Control: Filter out low-quality cells and genes using standard thresholds (e.g., mitochondrial gene percentage, number of genes per cell, total counts per cell).
- Normalization: Normalize the filtered count data to correct for library size differences.
- Dimension Reduction: Apply the scLENS method for automatic signal selection to reduce data size and computational burden [102].
- Output: A reduced dimension matrix for graph construction.
Step 2: Parallel Generation of Multiple Cluster Labels
- Graph Construction: Using the reduced dimension matrix, calculate distances between cells and construct a graph (e.g., a k-nearest neighbor graph).
- Parallel Clustering: Distribute the graph to multiple processes running across CPU cores. On each process, run the Leiden clustering algorithm simultaneously with the same resolution parameter but different random seeds [102].
- Output: Multiple cluster labels (e.g., 100 iterations) for a single resolution parameter.
Step 3: Calculate the Inconsistency Coefficient (IC)
- Similarity Matrix Construction: For all pairs of generated cluster labels, calculate the Element-centric Similarity (ECS) to create a similarity matrix S [102].
- Probability Vector: Calculate the probability p of each unique cluster label occurring.
- IC Calculation: Compute the Inconsistency Coefficient using the formula IC = 1 / (pSp^T). An IC close to 1 indicates high label consistency and reliability, while an IC > 1 indicates inconsistency [102].
Step 4: Iterate and Identify Stable Cluster Numbers
- Repeat Steps 2 and 3 for a range of resolution parameters.
- Identify the resolution parameters (and corresponding number of clusters) that yield an IC ~1, indicating stable and reliable clustering.
Expected Outcomes and Interpretation
Applying scICE to a dataset of ~6000 mouse brain cells revealed that a clustering result yielding 6 clusters was perfectly consistent (IC=1), a result with 7 clusters was highly inconsistent (IC=1.11), and a result with 15 clusters was consistent again (IC=1.01) [102]. This allows researchers to narrow their analysis to only the most reliable cluster configurations, preventing misannotation of embryo cell lineages.
The workflow for cluster stability analysis is summarized in the following diagram:
Application Note: Ensuring Marker Gene Reliability
Background and Purpose
Marker genes are crucial for annotating the biological cell types of clusters identified in scRNA-seq data. A comprehensive benchmark study evaluated 59 computational methods for selecting marker genes, assessing their ability to recover known cell-type markers and provide informative, interpretable gene sets [103]. Selecting a robust method is paramount for correctly identifying embryo lineages such as epiblast, hypoblast, and trophectoderm.
Comparative Performance of Marker Gene Selection Methods
The table below summarizes the key characteristics and performance of the most effective methods as identified by the benchmark.
Table 1: Benchmark of High-Performing Marker Gene Selection Methods
| Method | Underlying Principle | Key Strengths | Considerations for Embryo Research |
|---|---|---|---|
| Wilcoxon Rank-Sum Test [103] | Non-parametric test for difference in gene expression distributions. | High recovery rate of expert-annotated markers; computational efficiency. | Recommended default for most studies; effective for identifying lineage-specific markers (e.g., GATA4 for hypoblast). |
| Student's t-test [103] | Parametric test for difference in means between two groups. | High predictive performance for cluster annotation. | Assumes normality; can be powerful but may be sensitive to outliers common in scRNA-seq data. |
| Logistic Regression [103] | Models the log-odds of a cell belonging to a cluster as a linear function of gene expression. | Provides a model-based framework for marker selection. | Allows for incorporation of covariates; interpretation is less straightforward than simple tests. |
Detailed Protocol: Marker Gene Identification with Wilcoxon Test
Step 1: Obtain Stable Clusters
- Begin with a reliably clustered dataset (e.g., validated using the scICE protocol in Section 1).
Step 2: Perform "One-vs-Rest" Comparisons
- For each cluster, test every gene using the Wilcoxon rank-sum test. The test compares the expression distribution of the gene in the target cluster against its expression in all other cells combined [103].
Step 3: Adjust for Multiple Testing and Filter
- Apply a multiple testing correction (e.g., Bonferroni or Benjamini-Hochberg) to the p-values of all genes for a given cluster.
- Filter genes based on adjusted p-value (e.g., < 0.05) and a minimum log-fold change threshold (e.g., > 0.25) to select statistically significant and biologically relevant markers.
Step 4: Annotation and Validation
- Use the top-ranked marker genes (e.g., by fold-change or p-value) to annotate clusters by comparing to known lineage markers from literature (e.g., NANOG for epiblast, GATA6 for hypoblast) [7] [1].
Application Note: Establishing Trajectory Confidence
Background and Purpose
Pseudotime analysis infers the latent temporal sequence of cells along a dynamic process, such as embryonic development. Validating the confidence of these trajectories is essential for accurately reconstructing lineage bifurcations, like the divergence of the inner cell mass into epiblast and hypoblast [7]. This protocol leverages an integrated human embryo reference and trajectory inference tools to build confident developmental models.
Detailed Protocol
Step 1: Projection onto a Unified Reference
- Reference Atlas: Utilize a comprehensive integrated reference, such as one built from six public human embryo scRNA-seq datasets covering stages from zygote to gastrula [7].
- Data Integration: Project your query embryo or embryo-model data onto this reference using a stabilized UMAP. This allows the reference to annotate cell identities in the query data and provides a common space for trajectory analysis [7].
Step 2: Trajectory Inference with Slingshot
- Input: Use the 2D UMAP embeddings from the integrated dataset as input for the Slingshot algorithm [7].
- Lineage Specification: Manually specify the starting point (e.g., zygote or a progenitor population) and allow Slingshot to identify the principal curves representing major lineages (e.g., epiblast, hypoblast, and trophectoderm trajectories) [7].
Step 3: Inference of Underlying Regulatory Dynamics
- SCENIC Analysis: Perform Single-Cell Regulatory Network Inference and Clustering (SCENIC) on the MNN-corrected expression matrix [7].
- Transcription Factor Activity: This analysis infers transcription factor regulons and their activity, providing a mechanistic underpinning for the inferred trajectories (e.g., identifying VENTX activity in the epiblast or ISL1 in the amnion) [7].
Step 4: Validate with Pseudotime-Ordered Expression
- Identify Dynamic Genes: Using the pseudotime ordering from Slingshot, identify genes whose expression is significantly modulated along each trajectory.
- Biological Plausibility: Confirm that the dynamic patterns align with known biology from human and non-human primate studies (e.g., decrease of DUXA and FOXR1 after morula stage, increase of HMGN3 in post-implantation stages across lineages) [7].
The workflow for trajectory analysis is summarized in the following diagram:
The Scientist's Toolkit: Research Reagent Solutions
Table 2: Essential Computational Tools for scRNA-seq Validation in Embryo Research
| Item | Function in Validation | Example Use Case |
|---|---|---|
| scICE [102] | Evaluates clustering consistency and identifies reliable cluster numbers. | Applied to cluster cells from a human blastoid model to ensure trophectoderm, epiblast, and primitive endoderm clusters are stably identified. |
| Integrated Human Embryo Reference [7] | Serves as a universal benchmark for authenticating stem cell-based embryo models. | Projecting a gastruloid model onto the reference to assess its fidelity to in vivo human gastrula cells at Carnegie Stage 7. |
| Slingshot [7] | Infers pseudotemporal ordering of cells along developmental trajectories. | Reconstructing the lineage bifurcation from inner cell mass to epiblast and hypoblast in a cultured post-implantation embryo dataset. |
| SCENIC [7] | Infers gene regulatory networks and transcription factor activity from scRNA-seq data. | Identifying key transcription factors (e.g., VENTX in epiblast, OVOL2 in trophectoderm) driving lineage specification in human embryos. |
| Wilcoxon Rank-Sum Test [103] | A simple, effective statistical method for selecting cluster-specific marker genes. | Used in a "one-vs-rest" approach to find genes that robustly distinguish primitive streak cells from other lineages in a gastrulation dataset. |
Single-cell RNA sequencing (scRNA-seq) has revolutionized our capacity to study cellular heterogeneity in complex biological systems, including human embryogenesis [9]. While this technology generates extensive catalogs of putative cell-type-specific markers, a formidable challenge remains in translating these descriptive transcriptomic profiles into functionally validated targets with therapeutic potential [104]. The largely descriptive nature of scRNA-seq studies produces lengthy ranked lists of marker genes with predicted biological functions, yet without rigorous validation, it remains unknown which markers truly exert the putative function [104]. This gap between marker identification and functional confirmation represents a critical "valley of death" in therapeutic development, where only 1-4% of academic research findings are ever translated into clinical therapy [104]. Within embryo research, where ethical and technical constraints limit material availability, robust validation frameworks become particularly essential for distinguishing correlative signals from causative mechanisms in early human development.
Establishing a Framework for Target Prioritization
The GOT-IT Guideline Adaptation for Embryonic Targets
Given the lengthy and costly nature of functional validation studies, systematic gene prioritization is required to select the most promising candidates. The Guidelines On Target Assessment for Innovative Therapeutics (GOT-IT) provide a structured framework for target prioritization that can be adapted for embryonic development research [104]. This framework evaluates targets across multiple assessment blocks (ABs) including target-disease linkage (AB1), target-related safety (AB2), and strategic considerations such as target novelty (AB4).
For embryonic targets, this prioritization must be contextualized within developmental stage-specific considerations. As demonstrated in a comprehensive human embryo reference tool integrating data from zygote to gastrula stages, lineage bifurcations occur at precise developmental windows, with the first branch point emerging as inner cell mass (ICM) and trophectoderm (TE) cells diverge during E5, followed by ICM differentiation into epiblast and hypoblast lineages [7]. Target prioritization should therefore account for both temporal specificity and lineage restriction.
Practical Application: Prioritizing Tip Endothelial Cell Genes
A practical implementation of this framework focused on tip endothelial cells (ECs) demonstrates its utility [104]. Starting with top-ranking tip EC markers from scRNA-seq datasets, researchers applied sequential filters including:
- Target-Disease Linkage: Focus on targets restricted to pathological angiogenic niches (99.3% of human tip cells originated from tumor ECs)
- Target-Related Safety: Exclusion of markers with genetic links to other adult diseases
- Target Novelty: Selection of minimally characterized genes (<20 publications in angiogenesis context)
- Technical Feasibility: Consideration of perturbation tool availability and cellular localization
This process narrowed 50 candidate genes to six prioritized targets (CD93, TCF4, ADGRL4, GJA1, CCDC85B, and MYH9) for functional validation [104].
Table 1: Target Prioritization Criteria Adapted from GOT-IT Guidelines
| Assessment Block | Key Considerations | Application to Embryonic Targets |
|---|---|---|
| AB1: Target-Disease Linkage | Developmental stage specificity, lineage restriction, conservation across species | Validate marker specificity to embryonic lineage (e.g., epiblast-restricted expression) |
| AB2: Target-Related Safety | Genetic links to diseases, expression in adult tissues | Exclude targets with pleiotropic functions affecting multiple organ systems |
| AB4: Strategic Issues | Target novelty, scientific rationale, publication record | Prioritize poorly characterized "mystery genes" without developmental annotation |
| AB5: Technical Feasibility | Perturbation tools, antibody availability, model systems | Ensure available reagents for functional testing in relevant model systems |
Experimental Protocols for Functional Validation
In Vitro Functional Assays for Embryonic Lineage Validation
Functional validation of prioritized targets requires standardized protocols that recapitulate key developmental processes. The following methodologies have been successfully employed to assess gene function in developmental contexts:
siRNA-Mediated Knockdown in Primary Cells
- Utilize three different non-overlapping siRNAs per target gene to control for off-target effects
- Transfect primary cells (e.g., human umbilical vein endothelial cells) using appropriate transfection reagents
- Confirm knockdown efficiency at both RNA (qRT-PCR) and protein (Western blot) levels 48-72 hours post-transfection
- Select the two most efficient siRNAs for subsequent functional assays [104]
Proliferation and Migration Assays
- Assess proliferative capacity using ³H-Thymidine incorporation assays or alternative methods like EdU staining
- Evaluate migratory function through wound healing assays or Boyden chamber transwell migration
- Perform sprouting assays in 3D collagen matrices to model invasive morphogenic processes [104]
Multi-omics Integration for Regulatory Inference
- Apply frameworks like functional inference of gene regulation (FigR) to computationally pair scATAC-seq with scRNA-seq data
- Connect distal cis-regulatory elements to putative target genes
- Infer gene-regulatory networks to identify candidate transcription factor regulators of developmental processes [105]
In Vivo Validation Approaches
While in vitro models provide initial functional insights, in vivo validation remains essential for contextualizing gene function within developing embryos. Advanced spatial transcriptomics platforms enable high-resolution validation of target expression patterns:
Spatial Transcriptomics Validation
- Utilize subcellular resolution platforms (Stereo-seq v1.3, Visium HD FFPE, CosMx 6K, Xenium 5K) for precise localization
- Generate serial tissue sections from embryo samples for parallel profiling across multiple platforms
- Establish ground truth datasets using protein profiling (CODEX) on adjacent sections
- Leverage manual nuclear segmentation and detailed annotations for accurate cell typing [106]
Table 2: Spatial Transcriptomics Platforms for Embryonic Target Validation
| Platform | Resolution | Gene Panel Size | Key Advantages | Considerations for Embryonic Tissues |
|---|---|---|---|---|
| Stereo-seq v1.3 | 0.5 μm | Whole transcriptome | Unbiased detection, high spatial resolution | Ideal for detailed embryonic patterning studies |
| Visium HD FFPE | 2 μm | 18,085 genes | Compatibility with FFPE samples, high sensitivity | Suitable for archival embryonic tissue samples |
| CosMx 6K | Subcellular | 6,175 genes | Single-molecule precision, high-plex protein co-detection | Excellent for rare cell populations in embryos |
| Xenium 5K | Subcellular | 5,001 genes | High detection sensitivity, rapid turnaround | Optimal for high-throughput screening |
Integrating Transcriptomic Data with Phenotypic Measurements
Multimodal Single-Cell Integration Strategies
Linking transcriptomic signatures to functional phenotypes requires specialized methodologies that capture both molecular profiles and biophysical measurements from the same cells. Three primary integration approaches have emerged:
Morphological Profiling
- Combine scRNA-seq with high-content image-based screening to quantify morphological features
- Capture cell size, shape, granularity, and subcellular compartment density
- Apply automated digital microscopy to quantify thousands of morphological features across multiple cells [107]
Calcium Imaging and Electrophysiology
- Integrate scRNA-seq with calcium (Ca²⁺) imaging to monitor signaling dynamics across timescales (milliseconds to minutes)
- Employ patch-seq methodology to combine transcriptomic profiling with electrophysiological measurements in excitable cells
- Correlate action potential firing patterns with transcriptional states [107]
Multi-omics Regulatory Mapping
- Pair scATAC-seq with scRNA-seq to identify expression-linked regulatory elements
- Define domains of regulatory chromatin (DORCs) associated with specific developmental transitions
- Construct gene-regulatory networks to infer transcription factor drivers of lineage commitment [105]
Analytical Frameworks for Data Integration
The complex, high-dimensional nature of multimodal single-cell data requires specialized analytical approaches:
Correlative Analysis
- Employ non-parametric tests (Spearman correlation) to identify relationships between functional phenotypes and gene expression
- Apply information theory tools (mutual information) to detect features with non-monotonic trends
- Utilize sparse regression models to obtain interpretable visualizations of paired datasets [107]
Machine Learning Applications
- Train models with intrinsic feature selection (Lasso) to identify predictive transcripts
- Implement more complex non-linear models (random forests, neural networks) once initial gene sets are established
- Address overfitting through cross-validation and independent test sets [107]
Network-Based Analysis
- Leverage correlation structures between gene modules to enhance predictive power
- Construct gene-regulatory networks from paired multi-omics data
- Identify key transcription factor regulators of phenotypic states [107] [105]
Table 3: Essential Research Reagents for Functional Validation Studies
| Reagent/Resource | Function | Examples/Specifications |
|---|---|---|
| siRNA Libraries | Gene knockdown validation | Three non-overlapping siRNAs per target; chemically modified for stability |
| scRNA-seq Platforms | Single-cell transcriptome profiling | 10x Genomics Chromium (droplet-based); Fluidigm C1 (microfluidics); Smart-Seq2 (full-length) |
| Spatial Transcriptomics | Tissue context preservation | Visium HD (FFPE compatible); Xenium (subcellular resolution); Stereo-seq (nanoscale resolution) |
| Primary Cell Cultures | Physiologically relevant models | Human umbilical vein endothelial cells (HUVECs); embryonic stem cell-derived lineages |
| Multi-omics Analysis Tools | Data integration and interpretation | FigR (gene regulatory networks); Seurat (single-cell analysis); SCENIC (regulatory network inference) |
The integration of rigorous functional validation frameworks with high-throughput scRNA-seq technologies represents a critical pathway for advancing developmental biology and therapeutic discovery. By implementing systematic prioritization strategies, standardized experimental protocols, and multimodal data integration, researchers can bridge the gap between descriptive transcriptomic profiles and functionally annotated targets. This validation-first approach is particularly crucial in embryonic research, where the accurate interpretation of lineage-specific expression patterns informs our fundamental understanding of human development while creating opportunities for addressing developmental disorders and improving regenerative medicine strategies.
Conclusion
High-throughput scRNA-seq has fundamentally transformed the landscape of developmental biology, providing an unprecedented, cell-by-cell view of human embryogenesis. The integration of comprehensive reference datasets now serves as an indispensable benchmark for authenticating stem cell-based embryo models, thereby accelerating discoveries in regenerative medicine and illuminating the causes of early pregnancy loss and congenital disorders. Future advancements will hinge on the seamless integration of multi-omic data—including spatial transcriptomics, epigenomics, and proteomics—to build a more holistic understanding of developmental processes. As computational methods and sequencing technologies continue to evolve, high-throughput scRNA-seq will undoubtedly remain a cornerstone technology for deciphering the complexities of early human development, with profound implications for improving human health and combating disease.
References
- 1. Single Cell RNA Sequencing and Its Impact on ... [https://www.mdpi.com/1422-0067/26/16/7741]
- 2. Decoding the blueprints of embryo development with ... [https://www.sciencedirect.com/science/article/pii/S1084952125000059]
- 3. Fetal Development: Week-by-Week Stages of Pregnancy [https://my.clevelandclinic.org/health/articles/7247-fetal-development-stages-of-growth]
- 4. Human embryonic development [https://en.wikipedia.org/wiki/Human_embryonic_development]
- 5. Timeline human development [https://embryology.med.unsw.edu.au/embryology/index.php/Timeline_human_development]
- 6. Embryology - Cellular Division - Gastrulation [https://teachmeanatomy.info/the-basics/embryology/gastrulation/]
- 7. A comprehensive human embryo reference tool using ... [https://www.nature.com/articles/s41592-024-02493-2]
- 8. Global analysis of patterns of gene expression during ... [https://pmc.ncbi.nlm.nih.gov/articles/PMC2323238/]
- 9. Navigating single-cell RNA-sequencing: protocols, tools ... [https://pmc.ncbi.nlm.nih.gov/articles/PMC12085826/]
- 10. Applications of single-cell RNA sequencing in drug discovery ... [https://pmc.ncbi.nlm.nih.gov/articles/PMC10141847/]
- 11. Understanding Bulk and Single-Cell RNA Sequencing [https://www.cd-genomics.com/resource-bulk-rna-sequencing-vs-single-cell-rna-sequencing.html]
- 12. From bulk, single-cell to spatial RNA sequencing [https://www.nature.com/articles/s41368-021-00146-0]
- 13. A comprehensive human embryo reference tool using ... [https://pubmed.ncbi.nlm.nih.gov/39543283/]
- 14. Quantitative single-cell transcriptomics - PMC - PubMed Central [https://pmc.ncbi.nlm.nih.gov/articles/PMC6063296/]
- 15. Data analysis guidelines for single-cell RNA-seq in ... [https://pmc.ncbi.nlm.nih.gov/articles/PMC9716519/]
- 16. Single cell RNA-seq: An introductory overview and tools for ... [https://www.10xgenomics.com/blog/single-cell-rna-seq-an-introductory-overview-and-tools-for-getting-started]
- 17. How does single cell RNA-seq work [https://www.10xgenomics.com/blog/how-does-single-cell-rna-seq-work]
- 18. Parse Biosciences Announces FFPE-compatible ... [https://www.parsebiosciences.com/news/parse-biosciences-announces-ffpe-compatible-barcoding-technology-for-whole-transcriptome-single-cell-analysis/]
- 19. Single Cell RNA Sequencing Products [https://www.parsebiosciences.com/products/]
- 20. Single‐Cell Analysis of Alternative Splicing and Gene ... [https://pmc.ncbi.nlm.nih.gov/articles/PMC12239682/]
- 21. Discover Endless Parseabilities in Single Cell at ASHG 2025 [https://www.parsebiosciences.com/ashg-2025/]
- 22. Best Practices for Analysis of 10x Genomics Single Cell ... [https://www.10xgenomics.com/analysis-guides/best-practices-analysis-10x-single-cell-rnaseq-data]
- 23. Global trends in machine learning applications for single-cell ... [https://pmc.ncbi.nlm.nih.gov/articles/PMC12357469/]
- 24. Advancing Automated Cell Type Annotation with Large ... [https://www.sciencedirect.com/science/article/pii/S2001037025004775]
- 25. Understanding embryonic development at single-cell ... [https://pmc.ncbi.nlm.nih.gov/articles/PMC7838059/]
- 26. Single cell genomics and developmental biology [https://www.sciencedirect.com/science/article/abs/pii/S0959437X20300848]
- 27. Cell lineage specification at single cell resolution - PMC [https://pmc.ncbi.nlm.nih.gov/articles/PMC5639035/]
- 28. High-resolution single-cell RNA-seq data and ... [https://www.nature.com/articles/s41597-025-05024-6]
- 29. Single-cell ultra-high-throughput multiplexed chromatin ... [https://www.nature.com/articles/s41592-025-02700-8]
- 30. Benchmarking metabolic RNA labeling techniques for high ... [https://pmc.ncbi.nlm.nih.gov/articles/PMC12215390/]
- 31. Data analysis guidelines for single-cell RNA-seq in ... [https://mmrjournal.biomedcentral.com/articles/10.1186/s40779-022-00434-8]
- 32. Navigating single-cell RNA-sequencing: protocols, tools, ... [https://pubmed.ncbi.nlm.nih.gov/40382658/]
- 33. Optimizing single cell RNA sequencing of stem ... [https://www.frontiersin.org/journals/cell-and-developmental-biology/articles/10.3389/fcell.2025.1590889/full]
- 34. Establishing single cell RNA transcriptomics: a brief guide [https://pmc.ncbi.nlm.nih.gov/articles/PMC12403637/]
- 35. Comparative Analysis of Single-Cell RNA Sequencing ... [https://pmc.ncbi.nlm.nih.gov/articles/PMC11011421/]
- 36. Top 10 Bioinformatics Tools for scRNA-seq in 2025 [https://neovarsity.org/blogs/top-bioinformatics-tools-for-scrna-seq]
- 37. Public RNA-Seq and scRNA-Seq Databases [https://bigomics.ch/blog/ultimate-guide-to-public-rnaseq-and-sc-rna-seq-databases/]
- 38. Comparison of methods and resources for cell ... [https://www.nature.com/articles/s41467-022-30755-0]
- 39. 14 Comparing and combining scRNA-seq datasets [https://biocellgen-public.svi.edu.au/mig_2019_scrnaseq-workshop/comparing-and-combining-scrna-seq-datasets.html]
- 40. A Strategy to Compare Single-Cell RNA Sequencing Data ... [https://pmc.ncbi.nlm.nih.gov/articles/PMC11457179/]
- 41. Integrating single-cell RNA-seq datasets with substantial ... [https://pmc.ncbi.nlm.nih.gov/articles/PMC12577435/]
- 42. Creating Lineage Trajectory Maps Via Integration of Single ... [https://pmc.ncbi.nlm.nih.gov/articles/PMC6161781/]
- 43. Single-Cell Profiling for Advancing Birth Defects Research ... [https://pmc.ncbi.nlm.nih.gov/articles/PMC8562675/]
- 44. Chapter 10 Trajectory Analysis | Advanced Single-Cell ... [https://bioconductor.org/books/3.14/OSCA.advanced/trajectory-analysis.html]
- 45. A cell fate decision map reveals abundant direct ... [https://www.nature.com/articles/s41556-024-01393-z]
- 46. Trajectory-based differential expression analysis for single- ... [https://www.nature.com/articles/s41467-020-14766-3]
- 47. Single-cell RNA sequencing reveals the gene expression ... [https://www.sciencedirect.com/science/article/pii/S0012160624001544]
- 48. Linking signaling dynamics and cell fate decisions through ... [https://www.frontiersin.org/journals/cell-and-developmental-biology/articles/10.3389/fcell.2025.1656051/full]
- 49. The Dynamic Changes of Transcription Factors During the ... [https://pmc.ncbi.nlm.nih.gov/articles/PMC8484909/]
- 50. - Single -seq transcriptome analysis of linear and circular... cell RNA [https://genomebiology.biomedcentral.com/articles/10.1186/s13059-015-0706-1]
- 51. Multiplexed Single mRNA Cell Analysis of Mouse... Sequencing [https://www.jove.com/t/60647/multiplexed-single-cell-mrna-sequencing-analysis-mouse-embryonic]
- 52. Standardized flow-cytometry-based protocol to ... [https://pmc.ncbi.nlm.nih.gov/articles/PMC8141467/]
- 53. Quantitative comparison of single-cell RNA sequencing ... [https://pmc.ncbi.nlm.nih.gov/articles/PMC11326230/]
- 54. The ISSCR Releases Targeted Update to the Guidelines ... [https://www.isscr.org/isscr-news/the-isscr-releases-targeted-update-to-the-guidelines-for-stem-cell-research-and-clinical-translation]
- 55. Stem cell-based human embryo models [https://pmc.ncbi.nlm.nih.gov/articles/PMC12395930/]
- 56. Stem cell-based embryo models: The 2021 ISSCR ... [https://pmc.ncbi.nlm.nih.gov/articles/PMC12181966/]
- 57. Guidelines — International Society for Stem Cell Research [https://www.isscr.org/guidelines]
- 58. Spatial mapping of the total by in situ polyadenylation... transcriptome [https://pmc.ncbi.nlm.nih.gov/articles/PMC10110464/]
- 59. Single-cell RNA Sequencing (scRNA-Seq) Protocols [https://www.bgee.org/support/scRNA-seq-protocols-comparison]
- 60. Navigating single-cell RNA-sequencing: protocols, tools ... [https://genomicsinform.biomedcentral.com/articles/10.1186/s44342-025-00044-5]
- 61. Current best practices in single‐cell RNA‐seq analysis [https://pmc.ncbi.nlm.nih.gov/articles/PMC6582955/]
- 62. Comparison of transformations for single-cell RNA-seq data [https://www.nature.com/articles/s41592-023-01814-1]
- 63. Performance comparison of high throughput single-cell ... [https://www.sciencedirect.com/science/article/pii/S2405844024132161]
- 64. Getting Started with scRNA-seq: Library Preparation, QC ... [https://www.parsebiosciences.com/blog/getting-started-with-scrna-seq-library-preparation-qc-and-sequencing/]
- 65. Why is the fraction of mRNA transcripts captured per cell so ... [https://www.biostars.org/p/9549968/]
- 66. Integrating single-cell RNA-seq datasets with substantial ... [https://bmcgenomics.biomedcentral.com/articles/10.1186/s12864-025-12126-3]
- 67. Introduction to Ambient RNA Correction [https://www.10xgenomics.com/analysis-guides/introduction-to-ambient-rna-correction]
- 68. Decontamination of ambient RNA in single-cell RNA-seq with ... [https://genomebiology.biomedcentral.com/articles/10.1186/s13059-020-1950-6]
- 69. Neuronal ambient RNA contamination causes misinterpreted ... [https://pmc.ncbi.nlm.nih.gov/articles/PMC9789184/]
- 70. The impact of ambient RNA [https://www.nature.com/articles/s41593-022-01232-0]
- 71. Embracing the dropouts in single-cell RNA-seq analysis [https://www.nature.com/articles/s41467-020-14976-9]
- 72. imputing dropout events in single cell RNA sequencing data [https://pmc.ncbi.nlm.nih.gov/articles/PMC5994079/]
- 73. The impact of dropouts in scRNAseq dense neighborhood ... [https://www.sciencedirect.com/science/article/pii/S2001037025001023]
- 74. An efficient scRNA-seq dropout imputation method using ... [https://bmcbioinformatics.biomedcentral.com/articles/10.1186/s12859-021-04493-x]
- 75. Batch correction methods used in single-cell RNA sequencing ... [https://genome.cshlp.org/content/early/2025/07/07/gr.279886.124]
- 76. Systematic evaluation of single-cell RNA-seq analyses ... [https://pmc.ncbi.nlm.nih.gov/articles/PMC12126699/]
- 77. High-throughput and high-sensitivity full-length single-cell ... [https://www.nature.com/articles/s41421-022-00500-4]
- 78. Single-cell nascent RNA sequencing unveils coordinated ... [https://www.nature.com/articles/s41586-024-07517-7]
- 79. Feasibility of Whole RNA Sequencing from Single-Cell ... [https://pmc.ncbi.nlm.nih.gov/articles/PMC3885331/]
- 80. Sample-multiplexing approaches for single-cell sequencing [https://pmc.ncbi.nlm.nih.gov/articles/PMC11073057/]
- 81. What is Sample Multiplexing? [https://www.10xgenomics.com/support/software/cell-ranger/latest/getting-started/cr-3p-what-is-cellplex]
- 82. High-capacity sample multiplexing for single cell chromatin ... [https://bmcgenomics.biomedcentral.com/articles/10.1186/s12864-023-09832-1]
- 83. 6. Quality Control [https://www.sc-best-practices.org/preprocessing_visualization/quality_control.html]
- 84. Multiplexed transcriptomic analyzes of the plant embryonic ... [https://www.nature.com/articles/s41467-024-55803-9]
- 85. RNA Lexicon - Indexing Strategies and Solutions [https://www.lexogen.com/blog/rna-lexicon-indexing-strategies-and-solutions/]
- 86. Approaches for single-cell RNA sequencing across tissues ... [https://pmc.ncbi.nlm.nih.gov/articles/PMC10807473/]
- 87. Integrated protocol for single-cell RNA sequencing, organoid ... [https://bmcmethods.biomedcentral.com/articles/10.1186/s44330-025-00035-6]
- 88. A practical guide to single-cell RNA-sequencing for ... [https://genomemedicine.biomedcentral.com/articles/10.1186/s13073-017-0467-4]
- 89. Lexogen's LUTHOR HD App Note Published in Nature [https://www.lexogen.com/blog/luthor-hd-application-note-in-nature/]
- 90. Systematic benchmarking of imaging spatial ... [https://www.nature.com/articles/s41467-025-64990-y]
- 91. Systematic benchmarking of high-throughput subcellular ... [https://pmc.ncbi.nlm.nih.gov/articles/PMC12534522/]
- 92. Benchmarking metabolic RNA labeling techniques for high ... [https://www.nature.com/articles/s41467-025-61375-z]
- 93. Direct comparison of mass cytometry and single-cell RNA ... [https://www.nature.com/articles/s41597-024-03399-6]
- 94. Powerful scRNA-seq Data Analysis Tools in 2025 [https://www.nygen.io/resources/blog/single-cell-scrna-seq-multi-omics-data-analysis-tools]
- 95. Scientific panel puts new guardrails around stem cell-based ... [https://www.statnews.com/2025/08/11/international-society-stem-cell-research-isscr-stem-cell-embryo-models-guidelines/]
- 96. Advancements in single-cell RNA sequencing and spatial ... [https://www.frontierspartnerships.org/journals/acta-biochimica-polonica/articles/10.3389/abp.2025.13922/full]
- 97. Single-cell and spatial transcriptomics integration [https://www.frontiersin.org/journals/immunology/articles/10.3389/fimmu.2025.1649468/full]
- 98. Spatial pattern enhanced cellular and tissue recognition for ... [https://pmc.ncbi.nlm.nih.gov/articles/PMC12311794/]
- 99. High-resolution mapping of single cells in spatial context [https://www.nature.com/articles/s41467-025-61667-4]
- 100. spatially aware color palette optimization for single-cell and ... [https://pmc.ncbi.nlm.nih.gov/articles/PMC9272793/]
- 101. Customized Color Palettes & Themes • scCustomize [https://samuel-marsh.github.io/scCustomize/articles/Color_Palettes.html]
- 102. scICE: enhancing clustering reliability and efficiency of ... [https://www.nature.com/articles/s41467-025-60702-8]
- 103. A comparison of marker gene selection methods for single-cell ... [https://pmc.ncbi.nlm.nih.gov/articles/PMC10895860/]
- 104. Prioritization and functional validation of target genes from ... [https://www.nature.com/articles/s42003-023-05006-7]
- 105. Functional inference of gene regulation using single-cell ... [https://www.sciencedirect.com/science/article/pii/S2666979X22001082]
- 106. Systematic benchmarking of high-throughput subcellular ... [https://www.nature.com/articles/s41467-025-64292-3]
- 107. Integrating single-cell transcriptomics with cellular phenotypes [https://pmc.ncbi.nlm.nih.gov/articles/PMC10937895/]