Whole Mount FISH with Fructose-Glycerol Clearing: A Complete Guide for 3D Gene Expression Imaging
This article provides a comprehensive resource for researchers and drug development professionals on implementing whole-mount fluorescent in situ hybridization (FISH) combined with fructose-glycerol tissue clearing.
Whole Mount FISH with Fructose-Glycerol Clearing: A Complete Guide for 3D Gene Expression Imaging
Abstract
This article provides a comprehensive resource for researchers and drug development professionals on implementing whole-mount fluorescent in situ hybridization (FISH) combined with fructose-glycerol tissue clearing. We cover foundational principles of tissue clearing and FISH technology, detailed methodological protocols for combined mRNA and protein visualization, troubleshooting for common optimization challenges, and comparative validation against alternative clearing methods. The protocol is particularly valuable for 3D spatial transcriptomics in developmental biology, neurobiology, and disease modeling, enabling deep-tissue imaging with standard microscopy equipment while preserving fluorescent signal integrity.
Understanding Whole Mount FISH and Tissue Clearing Principles
The Critical Role of 3D Gene Expression Analysis in Development and Disease
Unravelling spatio-temporal patterns of gene expression is crucial to understanding core biological principles from embryogenesis to disease [1]. Our body plan and tissue identity rely on the correct deployment of developmental gene regulatory networks (GRNs), where the precise location, timing, and level of gene expression are fundamental [1]. Deviations from these programmed expression patterns can lead to congenital disorders and diseases such as cancer [1]. Historically, gene expression analysis relied on two-dimensional methods that failed to capture the complex three-dimensional architecture of biological systems. The emergence of 3D gene expression analysis technologies, particularly those enabling spatially resolved quantitative data at single-cell resolution, has revolutionized our ability to decipher the molecular origins of developmental defects and improve medical diagnostics [1]. This application note explores these advanced methodologies, with a specific focus on whole-mount fluorescence in situ hybridization (FISH) coupled with fructose-glycerol clearing, detailing protocols and applications for researchers and drug development professionals.
The Critical Importance of Spatial Context in Gene Expression
Gene expression is inherently spatial, and understanding this dimensionality is essential for grasping both normal development and disease processes. Morphogens, such as the bicoid gene in Drosophila, operate through concentration gradients to pattern tissue differentiation and development [1]. Similarly, Hox genes—highly conserved across species—define body axis patterning through precise spatial and temporal restriction, where ectopic expression can fundamentally reorganize developmental structures [1]. In disease contexts, dysregulated spatial expression of biomarkers, as seen in highly heterogeneous cancer tumors, informs clinical prognosis and therapies [1]. Furthermore, genetic variations associated with disease often appear in non-coding regions of the genome that affect the complex three-dimensional regulatory landscape, including enhancers that influence gene expression over long distances through chromosome looping [2].
Table 1: Key 3D Gene Expression Analysis Technologies
| Technology | Key Principle | Spatial Resolution | Multiplexing Capacity | Primary Applications |
|---|---|---|---|---|
| HCR-FISH | Hybridization chain reaction with signal amplification | Single-molecule | Medium (~4-5 genes simultaneously) | Whole-mount embryonic imaging, neuronal marker analysis [3] |
| smFISH | Single-molecule detection via multiple short probes | Single-molecule | Limited by fluorescence channels | Quantitative subcellular RNA localization [1] |
| MERFISH | Multiplexed error-robust FISH with barcoding | Subcellular | High (>1000 RNA species) | Single-cell transcriptomic profiling [1] |
| Digital Spatial Profiling | Photocleavable barcoded tags | Single-cell | High (~1000-plex RNA) | Tumor microenvironment analysis, biomarker discovery [1] |
| DNA Microsc | In situ tagging with random nucleotides | N/A | Potentially high | Molecular proximity mapping [1] |
Whole-Mount FISH with Fructose-Glycerol Clearing: An Optimized Protocol
The integration of whole-mount FISH with optical clearing represents a significant advancement for 3D gene expression mapping, preserving spatial relationships while enabling visualization deep within intact tissues. Below, we detail an optimized protocol based on recent research in Octopus vulgaris embryos [3].
Probe Design and Preparation
Principle: Effective FISH relies on specifically designed probes that bind target mRNA sequences, with subsequent signal amplification enabling detection.
Protocol:
- Automated Probe Design: Utilize tools like
Easy_HCRto design HCR v3.0-type probe pairs. For example, in octopus studies, 26-33 split-initiator probe pairs were designed for neuronal markers (Ov-elav, Ov-apolpp, Ov-ascl1, Ov-neuroD) [3]. - Oligo Synthesis: Order DNA Oligo Pools and dissolve in Nuclease-Free Distilled Water.
- HCR Amplifiers: Select appropriate HCR amplifiers with different fluorophores (e.g., B1-Alexa Fluor-546, B2-Alexa Fluor-647, B3-Alexa Fluor-488) for multiplexing [3].
Sample Preparation and Fixation
Materials:
- Octopus embryos at desired developmental stage (e.g., stage XV)
- 4% Paraformaldehyde (PFA) in PBS
- Phosphate Buffered Saline with Tween (PBST)
- Methanol (MeOH) series for dehydration
Protocol:
- Fix embryos in 4% PFA in PBS overnight at 4°C.
- Wash with Diethyl pyrocarbonate-treated PBS (PBS-DEPC).
- Manually dechorionate embryos using fine tweezers.
- Dehydrate through a graded MeOH/PBST series (25%, 50%, 75%, 100%, 100%), 10 minutes each.
- Store dehydrated embryos in 100% MeOH at -20°C until use [3].
Hybridization Chain Reaction v3.0
Protocol:
- Rehydration: Gradually rehydrate embryos from MeOH to PBST through a reverse MeOH series.
- Permeabilization: Treat with proteinase K (10 μg/ml in PBS-DEPC) for 15 minutes at room temperature.
- Pre-hybridization: Incubate in probe hybridization buffer for 30 minutes at 37°C.
- Hybridization: Add probe solution (0.4 pmol of each probe in 100 µl hybridization buffer) and incubate overnight at 37°C.
- Post-hybridization Washes: Remove unbound probes with 4×15-minute washes in probe wash buffer at 37°C, followed by 2×5-minute washes in 5xSSCT.
- Amplification:
- Prepare hairpin amplifiers by snap-cooling (95°C for 90 seconds, then 30 minutes at room temperature).
- Add 3 pmol of each hairpin to amplification buffer.
- Incubate overnight in the dark at room temperature.
- Remove excess hairpins with 3×5-minute 5xSSCT washes [3].
Fructose-Glycerol Clearing and Imaging
Principle: Fructose-glycerol clearing is a hydrophilic method that preserves fluorescent signals while rendering tissues transparent through refractive index matching, compatible with light sheet fluorescence microscopy (LSFM) [3].
Protocol:
- Clearing Solution: Prepare fructose-glycerol solution (specific proportions optimized for sample type).
- Clearing Process: Immerse stained samples in fructose-glycerol solution, incubating until transparent. For octopus embryos, this method effectively cleared eye pigmentation at stage XV [3].
- Mounting: Mount cleared samples in fructose-glycerol for imaging.
- 3D Imaging: Image using LSFM or confocal microscopy. LSFM is ideal for large samples and rapid imaging, while high-NA confocal objectives provide subcellular resolution [3] [4].
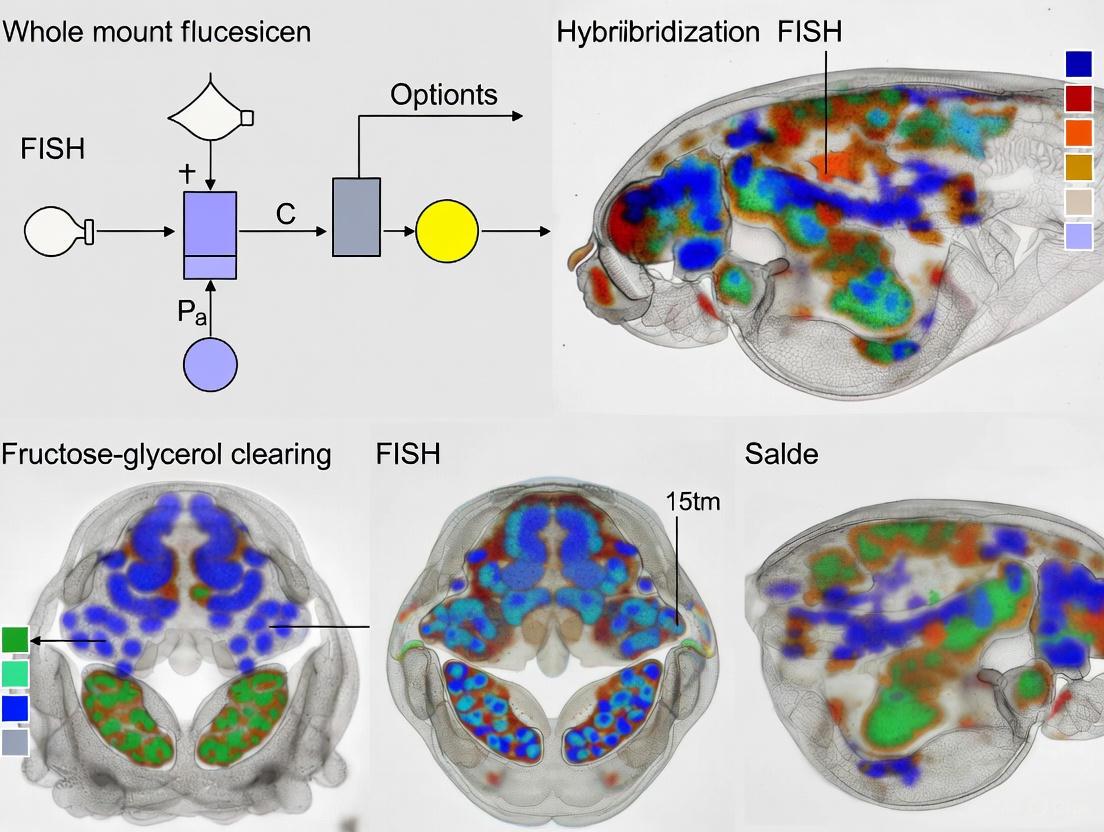
Diagram 1: Experimental workflow for whole-mount FISH with fructose-glycerol clearing.
Advanced Applications and Integrated Methodologies
Combining FISH with Immunohistochemistry (IHC)
The integration of FISH with IHC enables simultaneous detection of mRNA and protein within the same sample, providing comprehensive insights into gene expression and protein localization [3] [4].
Protocol Integration:
- Perform FISH protocol first, followed by IHC using standard protocols with fluorescently labeled secondary antibodies.
- Use fructose-glycerol clearing after combined staining, as it preserves both FISH signals and antibody fluorescence [3].
- This approach has been successfully used to visualize neural progenitor markers (Ov-ascl1) with phosphorylated-histone H3 (mitosis marker) in octopus embryos [3].
Alternative Clearing Method: 3D-LIMPID-FISH
For researchers requiring an alternative aqueous clearing method, LIMPID (Lipid-preserving index matching for prolonged imaging depth) offers a single-step approach compatible with FISH:
Protocol Highlights:
- Solution: Saline-sodium citrate, urea, and iohexol
- Process: Passive diffusion into stained tissues
- Advantages: Preserves tissue structure and lipids, compatible with high-NA objectives
- Application: Successful in adult mouse brain sections (250 μm) and trigeminal ganglia, enabling multiplexed imaging of mRNA and protein [4].
Single-Molecule Resolution and Quantification
Advanced FISH methodologies now enable quantitative analysis at single-molecule resolution:
- smFISH and osmFISH: Detect individual RNA molecules with high sensitivity, achieving lower zero-count rates compared to scRNA-seq [1].
- Quantitative HCR: By limiting amplification time, HCR can be used to visualize and count individual RNA molecules as discrete fluorescent dots, enabling precise quantification of gene expression at single-cell level [4].
Table 2: Research Reagent Solutions for 3D Gene Expression Analysis
| Reagent Category | Specific Examples | Function & Application | Technical Notes |
|---|---|---|---|
| HCR Probe Systems | HCR v3.0 B1-Alexa Fluor-546, B2-Alexa Fluor-647, B3-Alexa Fluor-488 | Signal amplification for mRNA detection in whole-mount samples | Enables multiplexing; linear amplification allows quantification [3] |
| Optical Clearing Agents | Fructose-glycerol, LIMPID (iohexol-based) | Refractive index matching for tissue transparency | Aqueous methods preserve fluorescence and tissue integrity [3] [4] |
| Permeabilization Enzymes | Proteinase K | Enables probe penetration through tissue membranes | Concentration and timing critical for signal preservation [3] |
| Fixation Reagents | 4% Paraformaldehyde (PFA) | Tissue preservation and morphology maintenance | Overfixation can reduce FISH signals [4] |
| Molecular Probes | Custom DNA Oligo Pools | Target-specific mRNA binding | Designed using automated tools (e.g., Easy_HCR) for non-model organisms [3] |
Discussion and Future Perspectives
The advancements in 3D gene expression analysis technologies are transforming our understanding of developmental biology and disease mechanisms. The integration of whole-mount FISH with fructose-glycerol clearing represents a particularly powerful approach for preserving spatial context while enabling comprehensive visualization of gene expression patterns. This methodology has proven effective even in challenging models like octopus embryos, where it revealed additional spatial organization not apparent in two-dimensional sections [3].
Future developments in this field will likely focus on increasing multiplexing capabilities, enhancing computational tools for 3D reconstruction and data analysis, and improving accessibility for researchers working with diverse model organisms. Techniques such as MERFISH and Digital Spatial Profiling already demonstrate the potential for highly multiplexed analysis, though they often require specialized instrumentation [1]. The ongoing optimization of accessible methods like HCR v3.0 with fructose-glycerol or LIMPID clearing will continue to democratize 3D gene expression analysis, enabling broader adoption across basic research and drug development contexts.
For drug development professionals, these technologies offer unprecedented opportunities to understand disease mechanisms in three-dimensional contexts, such as tumor microenvironments or organoid models of disease. The ability to simultaneously map multiple biomarkers in spatial context will enhance target validation and therapeutic development strategies. As these methodologies continue to evolve, they will undoubtedly yield new insights into the spatial regulation of gene expression in both development and disease.
Tissue clearing has revolutionized biomedical research by enabling high-resolution three-dimensional imaging of intact biological specimens. For researchers investigating gene expression patterns via whole-mount fluorescent in situ hybridization (FISH), effective clearing is indispensable for achieving adequate probe penetration and high-quality signal detection throughout thick tissues and organoids. The fundamental principle underlying all tissue clearing techniques is refractive index matching, a physical process that minimizes light scattering within heterogeneous biological samples. This application note examines the core mechanisms of refractive index matching, provides quantitative comparisons of clearing methods, and details optimized protocols for fructose-glycerol clearing in whole-mount FISH applications, framing this information within the context of advanced transcriptional mapping research.
The Principles of Refractive Index Matching
The Physical Basis of Tissue Opacity
Biological tissues appear opaque due to light scattering caused by heterogeneous cellular components. Proteins and lipids typically have a high refractive index (RI ~1.45-1.47), while the aqueous cytosol has a refractive index closer to water (RI = 1.33) [5]. When light passes through these regions with different refractive indices, it diffracts and scatters, creating opacity [5]. The more cellular structures a sample contains, the greater the light scattering, ultimately limiting imaging depth in microscopy to approximately 50-200 µm in non-cleared samples [5].
This scattering phenomenon follows physical principles described by the Beer-Lambert law, where light intensity decreases exponentially with depth due to both absorption and scattering effects [6]. The attenuation can be modeled as Iz = I0 × e^(-μeff × z), where I0 is the initial light intensity, Iz is the intensity at depth z, and μeff is the effective coefficient accounting for both absorption and scattering [6].
Achieving Transparency Through Index Matching
Tissue clearing works by equalizing the refractive index throughout the sample, allowing light to pass through without significant scattering or distortion [5]. The process involves replacing or modifying tissue components to create a homogeneous optical path, effectively rendering the specimen transparent [7]. As illustrated in Figure 1, this refractive index matching enables light to traverse millimeters or even centimeters into previously opaque tissues, facilitating deep-tissue imaging without physical sectioning [5].
Figure 1: The principle of refractive index matching in tissue clearing. Created using the DOT script provided in the Appendix.
Classification of Tissue Clearing Methods
Various tissue clearing techniques have been developed, each employing distinct chemical approaches to achieve refractive index matching. These methods can be broadly categorized into three primary classes, each with unique mechanisms and applications.
Table 1: Primary Categories of Tissue Clearing Methods
| Method Type | Clearing Mechanism | Key Reagents | RI Range | Tissue Effects | FISH Compatibility |
|---|---|---|---|---|---|
| Organic Solvent-Based [5] [6] | Dehydration, lipid dissolution, and high-RI organic solvent replacement | BABB, THF, DBE, ECi [6] | 1.55-1.56 [5] | Significant shrinkage [5]; quenches fluorescent proteins [5] | Limited due to RNA degradation risks |
| Aqueous-Based [5] [7] | Hyperhydration with high-RI aqueous solutions | Fructose-glycerol [8], sucrose, urea, iohexol [4] | 1.38-1.48 [5] [7] | Mild expansion or preservation [5] [4] | Excellent; preserves RNA integrity [4] |
| Hydrogel-Embedding [5] [9] | Protein-hydrogel cross-linking followed by lipid removal | Acrylamide, SDS, FocusClear [9] | 1.38-1.48 [5] | Well-preserved structure [5] | Good with optimized protocols [9] |
Aqueous Methods for Whole-Mount FISH Applications
For whole-mount FISH applications, aqueous clearing methods present distinct advantages. Techniques such as fructose-glycerol clearing [8] and LIMPID (Lipid-preserving Index Matching for Prolonged Imaging Depth) [4] maintain an aqueous environment that preserves RNA integrity and supports hybridization chain reaction (HCR) probes for sensitive RNA detection [4]. These methods use high-refractive-index molecules like fructose, glycerol, or iohexol to achieve refractive index matching between 1.38-1.48, sufficient for most imaging applications while preserving tissue architecture and biomolecular integrity [4] [8].
The compatibility of aqueous methods with RNA preservation makes them particularly suitable for whole-mount FISH, as they maintain the tissue's biomolecular environment while achieving the optical clarity needed for deep imaging [4]. LIMPID, for instance, has been successfully demonstrated in clearing 250 µm thick adult mouse brain slices while maintaining subcellular resolution of RNA distribution [4].
Quantitative Comparison of Clearing Efficacy
To objectively evaluate clearing methods, researchers have developed quantification approaches such as Punching-Assisted Clarity Analysis (PACA), which measures light transmittance through cleared tissue samples [10]. Table 2 summarizes performance metrics for various methods, particularly relevant to whole-organ imaging.
Table 2: Performance Metrics of Selected Clearing Methods
| Clearing Method | Method Type | Transmittance (%) | Clearing Time | Tissue Size Compatibility | Endogenous Fluorescence Preservation |
|---|---|---|---|---|---|
| BABB [5] [6] | Organic solvent | High (>90% in some tissues) [10] | Hours to days [5] | Whole adult mouse brain [5] | Poor; quenches fluorescent proteins [5] |
| CUBIC [5] | Aqueous (hyperhydration) | Medium-high [10] | Days [5] | 1-2 mm tissues [5] | Good [5] |
| fructose-glycerol [8] | Aqueous | Medium [7] | Days [7] | Organoids, tissue sections [8] | Excellent [8] |
| CLARITY [5] [9] | Hydrogel embedding | Medium-high [10] | Days to weeks [5] | Whole mouse brain [5] | Good [5] |
| LIMPID [4] | Aqueous | Medium-high [4] | Single step (hours) [4] | Up to whole-mount tissues [4] | Excellent for FISH signals [4] |
Regional differences in tissue composition significantly affect clearing efficacy. Studies using PACA have demonstrated that cerebellar tissues consistently achieve lower clearing levels compared to prefrontal or cerebral cortex regions across multiple protocols [10]. This highlights the importance of considering tissue-specific optimization, particularly for heterogeneous samples.
Fructose-Glycerol Clearing Protocol for Whole-Mount FISH
The following protocol for fructose-glycerol clearing has been optimized for ECM gel-embedded pancreatic organoids [8] and is readily adaptable to other tissue types used in whole-mount FISH experiments. Figure 2 illustrates the complete experimental workflow.
Figure 2: Workflow for whole-mount FISH with fructose-glycerol clearing. Created using the DOT script provided in the Appendix.
Materials and Reagents
Table 3: Essential Research Reagents for Fructose-Glycerol Clearing and Whole-Mount FISH
| Reagent/Chemical | Function/Application | Notes for Whole-Mount FISH |
|---|---|---|
| Paraformaldehyde (PFA) [9] | Tissue fixation | Preserves tissue architecture and RNA integrity; typically used at 4% |
| Fructose-glycerol solution [8] | Refractive index matching | Aqueous clearing agent with RI ~1.44-1.48 |
| Hybridization Chain Reaction (HCR) probes [4] | RNA detection | Enable signal amplification and quantitative RNA imaging |
| Proteinase K [4] | Permeabilization | Enhances probe penetration; concentration requires optimization |
| Formamide [4] | Hybridization buffer component | Increases fluorescence intensity in FISH protocols |
| SSC buffer (Saline-Sodium Citrate) [4] | Hybridization and washing | Standard buffer for FISH procedures |
| DAPI [5] | Nuclear counterstain | Compatible with most clearing methods |
| Iohexol [4] | RI matching component | Alternative for tunable RI matching in LIMPID protocol |
Step-by-Step Protocol
Sample Preparation and Fixation
- Harvest tissues or organoids and fix immediately in 4% PFA for 24 hours at 4°C [9]. The fixation time may require optimization based on tissue size and density.
- Wash samples thoroughly with PBS to remove residual PFA.
- (Optional) For tissues with high autofluorescence, perform bleaching with H₂O₂ to reduce background [4].
Whole-Mount FISH Procedure
- Permeabilize fixed samples with Proteinase K (concentration and duration must be optimized for each tissue type) [4].
- Perform pre-hybridization in appropriate buffer.
- Hybridize with HCR FISH probes designed for target RNAs. Incubate for 16-48 hours at appropriate temperature [4].
- Perform post-hybridization washes with SSC buffer containing formamide to reduce background [4].
- (Optional) For multiplexed imaging, perform sequential FISH or combine with immunofluorescence using validated antibodies [4].
Fructose-Glycerol Clearing and Mounting
- Prepare fructose-glycerol clearing solution according to published formulations [8].
- Incubate stained samples in clearing solution for 24-48 hours until transparent [8].
- Mount cleared samples in fresh fructose-glycerol solution for imaging [8].
- Image using confocal or light-sheet microscopy within one week for optimal signal preservation [4].
Troubleshooting and Optimization
- Insufficient clearing: Extend clearing incubation time or consider alternative RI matching agents such as iohexol-based solutions [4].
- Poor FISH signal: Optimize permeabilization conditions and verify probe penetration through z-stack imaging [4].
- Tissue degradation: Ensure adequate fixation time and avoid over-digestion during permeabilization steps.
- High background: Include formamide in wash buffers and ensure adequate post-hybridization washes [4].
Advanced Applications in 3D Gene Expression Mapping
The combination of fructose-glycerol clearing with whole-mount FISH enables sophisticated applications in 3D gene expression analysis. Researchers have successfully achieved subcellular visualization of RNA distribution in 250 µm thick adult mouse brain slices using this approach [4]. Furthermore, the method supports multiplexed imaging, allowing simultaneous mapping of mRNA and protein expression within the same sample [4].
For challenging tissues with high autofluorescence or dense extracellular matrix, such as human brain specimens, advanced hydrogel-based methods like SHIELD or CLARITY may provide superior results [9]. These methods offer enhanced tissue preservation while maintaining compatibility with FISH protocols, though they require more complex procedures and longer processing times [9].
Refractive index matching through tissue clearing methods like fructose-glycerol clearing has become an essential methodology for modern 3D biological imaging, particularly in whole-mount FISH applications. By fundamentally addressing the physical principles of light scattering in biological tissues, these techniques enable researchers to visualize gene expression patterns throughout intact tissues and organoids. The fructose-glycerol protocol detailed herein provides a balanced approach for researchers requiring RNA preservation, compatibility with FISH methodologies, and straightforward implementation. As the field advances, further refinement of these techniques will continue to enhance our ability to map transcriptional activity within native tissue contexts, ultimately accelerating drug discovery and fundamental biological research.
Appendix
Diagram Source Code
Dot script for Figure 1: Principle of Refractive Index Matching
Dot script for Figure 2: Whole-Mount FISH with Fructose-Glycerol Clearing Workflow
Fructose-Glycerol clearing is a hydrophilic (aqueous-based) tissue clearing technique that enhances optical transparency for deep-tissue imaging. This method operates on the fundamental principle of refractive index (RI) matching, where the clearing solution infiltrates the tissue to minimize light scattering caused by RI mismatches between different cellular components, such as lipids, proteins, and water-based cytosol [11] [12]. By homogenizing the tissue's RI, it becomes optically transparent, allowing for high-resolution 3D imaging of structures deep within the sample.
As part of the family of simple immersion techniques, the Fructose-Glycerol protocol is particularly noted for its effectiveness in preserving endogenous fluorescent proteins and its compatibility with various staining protocols, including whole-mount immunofluorescence and potentially whole-mount FISH (fluorescence in situ hybridization) [11] [12]. Its composition of fructose, glycerol, and other water-soluble reagents makes it a robust choice for researchers embarking on 3D histology, especially when maintaining molecular information within the sample's native spatial context is paramount for the research objectives [11].
Key Principles and Advantages
The Fructose-Glycerol method offers several distinct advantages that make it suitable for a wide range of applications, particularly within the context of a thesis involving whole-mount techniques.
- Superior Fluorescence Preservation: As an aqueous-based method, it is inherently gentler on fluorescent proteins and exogenous labels compared to harsh solvent-based techniques. This ensures that fluorescent signals from stains or transgenic expression remain vibrant throughout the clearing and imaging process [12].
- Compatibility with Molecular Techniques: The aqueous environment preserves biomolecules like proteins and RNA better than solvent-based methods. This characteristic is crucial for its potential integration with whole-mount FISH, which relies on the integrity of RNA targets within the intact tissue architecture [12].
- Simplicity and Accessibility: The protocol is straightforward, requiring no specialized equipment like electrophoresis setups or complex hydrogel embedding. The reagents are common, inexpensive, and easy to handle, making it an excellent starting point for laboratories new to tissue clearing [13] [12].
- Validated Performance: Empirical evidence has demonstrated its efficacy. A comparative study on cerebral organoids showed that the Fructose-Glycerol protocol yielded superior image quality throughout the entire sample volume compared to other methods like ClearT2 and ScaleA2, enabling consistent visualization of nuclear structures from the surface to the center [13].
Table 1: Quantitative Comparison of Fructose-Glycerol with Other Common Clearing Methods
| Characteristic | Fructose-Glycerol (Aqueous) | BABB (Solvent) | Scale/Seca (Aqueous) |
|---|---|---|---|
| Clearing Principle | RI matching with high-RI aqueous solution [12] | Lipid dissolution & dehydration with organic solvents [6] [12] | Hyperhydration and RI matching [6] |
| Fluorescence Preservation | Excellent [12] | Poor to Moderate (requires specific pH conditions) [12] | Good |
| Biomolecule Retention (Protein/RNA) | High [12] | Low | Moderate to High |
| Typical Tissue Size | Medium (whole organs of small models) [13] | Medium to Large [6] | Small to Medium |
| Relative Cost & Complexity | Low | Low | Moderate |
| Best Suited For | Preserving fluorescence, IHC, potential FISH applications | Rapid clearing, deep imaging in non-fluorescent samples | Detailed microstructural analysis |
Detailed Experimental Protocol
A. The Scientist's Toolkit: Essential Reagents and Materials
The following table lists the key reagents required to execute the Fructose-Glycerol clearing protocol.
Table 2: Essential Research Reagent Solutions for Fructose-Glycerol Clearing
| Reagent/Material | Function/Purpose | Notes & Considerations |
|---|---|---|
| Paraformaldehyde (PFA) | Tissue fixation; crosslinks proteins to preserve structural integrity. | Concentration (e.g., 4%) and fixation time require optimization for specific tissues [12]. |
| Phosphate-Buffered Saline (PBS) | Washing and dilution buffer; maintains physiological pH and osmolarity. | Used to remove excess fixative and for preparing solutions. |
| Triton X-100 | Detergent; permeabilizes cell membranes to facilitate antibody or probe penetration. | Critical for whole-mount immunohistochemistry and FISH [14]. |
| Dimethyl Sulfoxide (DMSO) | Penetration enhancer; improves permeability of tissues to clearing agents and stains. | Often included in washing and blocking solutions [14]. |
| Fructose | RI-matching agent; primary component for increasing the solution's refractive index. | Often used in high concentrations with other reagents like urea [13]. |
| Glycerol | RI-matching and mounting agent; contributes to transparency and can be used for imaging. | A common component in many aqueous-based clearing solutions [14] [13]. |
| Urea | Denaturing agent; aids in lipid removal and helps break down dense tissue structures. | A key component in many hyperhydration-based clearing solutions like Scale [14]. |
B. Step-by-Step Procedural Workflow
The workflow below outlines the key stages for processing a tissue sample using the Fructose-Glycerol method, from fixation to final imaging.
1. Tissue Fixation and Preparation
- Fixation: Immerse the freshly dissected tissue in 4% Paraformaldehyde (PFA) in PBS. The fixation time must be optimized based on tissue size and type (e.g., 6-12 hours for a mouse embryo at 4°C). Over-fixation can reduce antibody or probe binding efficiency [12].
- Washing: Thoroughly rinse the fixed tissue with PBS containing Triton X-100 (e.g., 0.2-1.0%) to remove residual PFA. This step also begins the permeabilization process. Multiple washes over several hours are recommended [14].
2. Permeabilization and Staining (for FISH or IHC)
- Permeabilization: Treat the tissue with a stronger permeabilization solution, typically PBS containing 1-2% Triton X-100 and 5-10% DMSO, for 12-48 hours with gentle agitation. This step is crucial for allowing large molecules like antibodies or FISH probes to penetrate deep into the tissue [14].
- Staining (Whole-Mount FISH/IHC): Incubate the tissue with the primary antibody or FISH probe in a blocking solution (e.g., PBS with 0.2% Triton X-100, 5% DMSO, and 1-3% BSA) for 24-72 hours. For FISH, stringent washing steps post-hybridization are required to remove unbound probe. Subsequent incubation with fluorescently-labeled secondary antibodies (for IHC) or direct imaging (for labeled FISH probes) follows [11] [14].
3. Optical Clearing with Fructose-Glycerol Solution
- Solution Preparation: Prepare the Fructose-Glycerol clearing solution. A validated recipe includes high concentrations of fructose, glycerol, and urea, dissolved in water. The solution must be prepared carefully, often with gentle heating, to ensure all components dissolve completely and the final solution is clear [14] [13].
- Clearing Process: Transfer the stained and washed tissue into the Fructose-Glycerol solution. The incubation time depends on the size and density of the tissue, typically ranging from 24 hours to several days. The sample should be stored at room temperature or 4°C with gentle agitation until it becomes optically transparent [13].
4. Mounting and 3D Image Acquisition
- Mounting: Once cleared, place the tissue in a microscopy chamber filled with fresh Fructose-Glycerol solution, which also acts as the immersion medium. Ensure the sample is properly immobilized for imaging.
- Imaging: Acquire 3D image stacks using a suitable microscope. Light-sheet fluorescence microscopy (LSFM) is ideal for large samples due to its high speed and low photobleaching. Spinning-disk confocal or two-photon microscopy are also excellent choices for high-resolution imaging of smaller samples [11] [13] [15].
Quality Assessment and Validation
Evaluating the success of the clearing procedure is a critical step. While visual inspection for transparency is a good initial indicator, quantitative metrics provide a more robust assessment.
- FRC-QE (Fourier Ring Correlation - Quality Estimation): This is a powerful, non-subjective metric for assessing image quality in 3D fluorescence microscopy. FRC-QE calculates a score that reflects the clarity and resolution of the acquired images, allowing for direct comparison between different clearing protocols or samples. It has been specifically validated for use with cleared organoids, demonstrating its utility for methods like Fructose-Glycerol [13].
- Comparison with Other Metrics: Unlike simple image intensity, which can be misleading (as intensity may increase where quality decreases due to scattering), FRC-QE accurately recapitulates the visual perception of image quality. It outperforms other no-reference image quality assessment (NR-IQA) methods like DCT Shannon entropy for cross-sample comparisons and is more predictable than machine-learning-based algorithms when applied to new biological image types [13].
Applications in Biomedical Research
The Fructose-Glycerol clearing method is a versatile tool that enables a multitude of applications in 3D biomedical research.
- Oncology and Tumor Microenvironment: It facilitates the study of tumor architecture, cancer cell invasion, and the spatial relationships between tumor cells and the surrounding stroma in 3D, providing insights unavailable from traditional 2D sections [11].
- Developmental Biology and Neuroscience: This method is ideal for creating detailed 3D maps of developing organs or complex neural circuits in the brain, allowing researchers to trace neuronal projections and analyze cell fate in intact embryos or whole organs [11] [14].
- Cardiovascular Research: While challenging, cardiovascular tissues can be cleared and imaged to visualize the 3D structure of blood vessels, heart wall organization, and cell populations within the context of the entire organ [15].
- Spatial Transcriptomics and Whole-Mount FISH: The excellent biomolecule preservation of aqueous-based clearing makes Fructose-Glycerol a promising candidate for integration with whole-mount FISH protocols. This powerful combination allows for the visualization of gene expression patterns within the native 3D context of intact tissues, a key methodology for a thesis in this field [11] [12].
Troubleshooting and Best Practices
- Incomplete Clearing: If the tissue remains opaque, ensure the clearing solution is fresh and properly formulated. Extending the incubation time or gently agitating the sample can improve reagent penetration. For very dense tissues, a pre-treatment with urea-based solutions (like ScaleA2) can enhance clearing [14].
- Loss of Fluorescent Signal: To preserve fluorescence, minimize exposure to light during the protocol. For solvent-sensitive fluorophores, ensure the tissue is fully hydrated before proceeding with aqueous clearing. Optimizing fixation time is also critical to avoid over-fixation, which can mask epitopes [12].
- Tissue Damage or Deformation: Handle tissues gently throughout the process. Using sharp tools during dissection and ensuring the tissue is not physically compressed during incubation or mounting will preserve its natural morphology. Aqueous methods like Fructose-Glycerol generally cause less shrinkage and deformation than solvent-based methods [12].
Advantages of Hybridization Chain Reaction (HCR) Technology for Sensitive mRNA Detection
Hybridization Chain Reaction (HCR) represents a paradigm shift in nucleic acid detection, offering a powerful method for sensitive and specific mRNA analysis. As an isothermal, enzyme-free amplification technique, HCR operates without the need for complex thermocycling equipment or delicate enzymes, making it particularly valuable for both research and potential clinical applications [16]. The fundamental mechanism involves two or more stable DNA hairpins that remain metastable until exposed to a specific initiator strand—typically a target mRNA sequence. Upon recognition, these hairpins undergo a cascade of hybridization events, self-assembling into long double-stranded DNA polymers that serve as amplified signal reporters [17]. This elegant mechanism preserves the spatial information of the original mRNA targets, making HCR especially valuable for whole mount fluorescence in situ hybridization (FISH) applications where maintaining three-dimensional architectural context is essential [18].
The evolution of HCR technology has progressed through several generations, with HCR v3.0 introducing automatic background suppression through split-initiator probes that dramatically reduce non-specific amplification [17]. This innovation, combined with the technique's inherent compatibility with complex biological samples, has established HCR as a cornerstone technology for sensitive mRNA detection across diverse fields including developmental biology, cancer research, and diagnostic assay development.
Key Advantages of HCR Technology
Superior Sensitivity and Specificity
HCR technology achieves exceptional detection sensitivity through signal amplification that directly scales with target abundance. The confined CHA-HCR system demonstrates this capability with a detection limit of 8.7 pM for ANXA2 mRNA, enabling identification of low-abundance targets that challenge conventional methods [16]. This sensitivity is complemented by outstanding specificity; the same system can discriminate between single-base mismatches, ensuring accurate target identification even among highly similar RNA sequences [16]. The split-initiator probe design in HCR v3.0 enhances this specificity further by ensuring that amplification occurs only when two adjacent probes correctly hybridize to their target, providing built-in verification that dramatically reduces false positives [17].
Flexibility and Multiplexing Capabilities
The modular architecture of HCR systems enables remarkable experimental flexibility. With orthogonal amplifier systems that operate independently without cross-talk, researchers can simultaneously detect multiple mRNA targets within the same sample [17] [19]. This multiplexing capability extends beyond theoretical applications—studies have successfully demonstrated simultaneous detection of three different transcripts in whole mount plant tissues [18] and four-target multiplexing in vertebrate embryos [17]. The technology's adaptability also allows combination with other detection modalities; HCR can be seamlessly integrated with immunohistochemistry for parallel protein and RNA visualization, providing a comprehensive view of gene expression patterns within their anatomical context [19] [18].
Robust Performance in Complex Samples
Unlike enzyme-dependent amplification methods that are sensitive to inhibitors and environmental conditions, HCR maintains stable performance across challenging sample types. The technology functions effectively in whole blood, formalin-fixed paraffin-embedded (FFPE) tissues, and whole mount specimens [16] [20]. This robustness stems from its enzyme-free nature, which eliminates vulnerabilities to pH fluctuations, temperature variations, and endogenous inhibitors that can compromise enzymatic reactions [16]. The incorporation of structural modifications, such as cholesterol-labeled probes that integrate into lipidic micelles, further enhances performance in complex environments by improving probe stability and reaction efficiency [16].
Table 1: Quantitative Performance Metrics of HCR Technology
| Performance Characteristic | Performance Metric | Experimental Context |
|---|---|---|
| Detection Sensitivity | 8.7 pM limit of detection | ANXA2 mRNA detection in adenomyosis [16] |
| Single-Base Discrimination | Effective distinction of single-base mismatches | ANXA2 mRNA vs. similar RNA sequences [16] |
| Multiplexing Capacity | Simultaneous detection of 3-5 targets | Whole-mount vertebrate embryos [17] [18] |
| Signal-to-Background Ratio | Median of 90 (range: 15-609) | Protein imaging across various samples [19] |
| Amplification Suppression | ≈50-60 fold reduction in background | Split-initiator probes in HCR v3.0 [17] |
HCR Performance Data and Applications
The quantitative performance of HCR technology has been rigorously validated across multiple research contexts, establishing its value for both basic research and diagnostic applications. In diagnostic settings, the confined CHA-HCR system has demonstrated clinical utility by successfully differentiating ANXA2 mRNA expression between leiomyoma and adenomyosis patient tissues, highlighting its potential for improving pathological discrimination [16]. The signal amplification provided by HCR is not only powerful but also quantitative, with studies confirming that the amplified HCR signal scales approximately linearly with the number of target molecules, enabling accurate expression level assessment [19].
For high-throughput applications, HCR has been adapted to 384-well plate formats compatible with high-content imaging systems, enabling single-cell resolution gene expression analysis across thousands of cellular observations [21]. This approach, termed hcHCR, maintains the sensitivity of traditional HCR while achieving the scalability required for functional genomics and drug discovery applications [21]. The technology's versatility extends across diverse sample types, from whole-mount vertebrate embryos to thick tissue sections and primary immune cells, with consistent performance maintained despite biological complexity [17] [19] [21].
Table 2: HCR Applications Across Sample Types and Research Fields
| Application Domain | Sample Type | Key Demonstration |
|---|---|---|
| Developmental Biology | Whole-mount chicken and zebrafish embryos | Multiplexed mRNA imaging with subcellular resolution [17] [19] |
| Clinical Diagnostics | Human adenomyosis and leiomyoma tissues | Differential ANXA2 mRNA detection [16] |
| Plant Research | Arabidopsis, maize, and sorghum tissues | Whole-mount spatial gene expression in 3D [18] |
| Immunology Research | Human primary immune cells (B cells, T cells, monocytes) | High-throughput transcript quantification at single-cell level [21] |
| Neuroscience | FFPE mouse brain sections | Multiplexed protein and RNA imaging [19] |
Detailed HCR Protocol for Whole Mount FISH
Sample Preparation and Permeabilization
The successful application of HCR for whole mount FISH begins with meticulous sample preparation. For plant tissues, immediately fix samples in 4% formaldehyde in 1× phosphate-buffered saline (PBS) under vacuum infiltration to preserve tissue architecture and RNA integrity [18]. Following fixation, permeabilization is critical for probe accessibility; this involves sequential dehydration through ethanol series (30%, 50%, 70%, 100%) followed by rehydration, and treatment with cell wall digesting enzymes (2% cellulase and 2% pectolyase in Arabidopsis) for 30-60 minutes at room temperature [18]. For animal tissues or whole mount embryos, proteinase K treatment (2-10 μg/mL for 5-30 minutes) may be substituted for enzymatic cell wall digestion. Throughout this process, avoid RNase contamination by using RNase-free reagents and gloves.
Probe Hybridization and HCR Amplification
Following permeabilization, pre-hybridize samples in probe hybridization buffer (e.g., 30% formamide, 5× SSC, 9 mM citric acid pH 6.0, 0.1% Tween-20, 50 μg/mL heparin, 1% blocking reagent) for 30 minutes at the target hybridization temperature [18]. Meanwhile, prepare HCR initiator probes by heating to 95°C for 90 seconds followed by cooling to room temperature. For split-initiator probes (HCR v3.0), use probe pairs targeting adjacent 25-nucleotide sequences on the mRNA target, with each probe containing half of the HCR initiator sequence [17]. Replace pre-hybridization buffer with fresh buffer containing initiator probes (0.5-5 nM final concentration) and incubate overnight at 37°C to allow specific target hybridization.
After hybridization, stringently wash samples to remove non-specifically bound probes: four washes of 15 minutes each with probe wash buffer (30% formamide, 5× SSC, 9 mM citric acid pH 6.0, 0.1% Tween-20) at 37°C, followed by two 5-minute washes with 5× SSCT (5× SSC, 0.1% Tween-20) at room temperature [18]. For HCR amplification, pre-amplify samples for 5-10 minutes in amplification buffer (5× SSC, 0.1% Tween-20, 10% dextran sulfate) before adding HCR hairpins. Prepare HCR hairpins (H1 and H2) by snap-cooling (heat to 95°C for 90 seconds and cool to room temperature over 90 minutes) and add to samples at 60 nM final concentration in amplification buffer. Incubate overnight at room temperature in darkness to allow HCR amplification polymer formation.
Imaging and Analysis
Following HCR amplification, wash samples extensively with 5× SSCT (4×15 minutes, then 2×5 minutes) to remove unamplified hairpins [18]. For whole mount samples requiring optical clearing, employ fructose-glycerol clearing by equilibrating samples in 40% fructose, 0.5% glycerol, and 0.1% Triton X-100 in 1× PBS, followed by mounting in the same solution for imaging [18]. Image samples using confocal or light sheet microscopy with appropriate filter sets for the fluorophores used. For quantitative analysis, the HCR signal can be quantified as spot counts per cell (digital HCR) or as fluorescence intensity, both of which show linear correlation with target abundance [19] [21].
Visualization of HCR Mechanisms and Workflows
Diagram Title: HCR Experimental Workflow and Mechanism
Essential Research Reagent Solutions
The successful implementation of HCR technology depends on carefully selected research reagents optimized for specific applications. The following table outlines key components and their functions in a typical HCR experiment:
Table 3: Essential Research Reagents for HCR Experiments
| Reagent Category | Specific Examples | Function and Application Notes |
|---|---|---|
| HCR Initiator Probes | Split-initiator DNA probes (25-nt target binding) | Target recognition; split-initiator design enables automatic background suppression in HCR v3.0 [17] |
| HCR Hairpin Amplifiers | Fluorophore-labeled H1 and H2 hairpins | Signal amplification; kinetically trapped hairpins that self-assemble upon initiation [17] |
| Hybridization Buffers | 30% formamide, 5× SSC, 9 mM citric acid, 0.1% Tween-20, heparin | Creates optimal stringency conditions for specific probe binding [18] |
| Permeabilization Reagents | Cellulase/pectolyase (plants), proteinase K (animals) | Enables probe access to intracellular targets in whole mount samples [18] |
| Blocking Reagents | Dextran sulfate, heparin, blocking reagents | Reduces non-specific binding in complex biological samples [18] |
| Mounting Media | Fructose-glycerol clearing solution | Provides optical clearing for deep tissue imaging while preserving signal [18] |
Hybridization Chain Reaction technology represents a significant advancement in mRNA detection methodology, combining exceptional sensitivity and specificity with operational simplicity. Its isothermal, enzyme-free nature eliminates requirements for precise thermal cycling or sensitive enzymatic components, making it particularly valuable for resource-limited settings. The technology's compatibility with complex samples—from whole mount embryos to clinical tissue specimens—enables researchers to investigate gene expression within its native morphological context. As HCR methodologies continue to evolve with innovations such as automatic background suppression and enhanced multiplexing capabilities, this technology promises to further expand our understanding of spatial gene regulation in development, disease, and biological response pathways.
Why Combine Whole Mount FISH with Fructose-Glycerol Clearing? Key Benefits and Applications
The analysis of spatial gene expression is fundamental to understanding molecular patterning and organogenesis during embryonic development. While traditional two-dimensional methods have provided valuable insights, they often disrupt the intricate three-dimensional architecture of biological tissues. The combination of whole-mount fluorescence in situ hybridization (FISH) with fructose-glycerol clearing presents a powerful methodological synergy that enables researchers to visualize mRNA localization within intact tissue volumes. This approach is particularly valuable for studying complex developmental processes in non-model organisms where antibody tools are limited and three-dimensional relationships are crucial for understanding function. This application note examines the key benefits, methodological considerations, and practical applications of this integrated approach for research and drug development professionals.
Technical Synergies: How FISH and Fructose-Glycerol Clearing Complement Each Other
The Compatibility Advantage
The combination of whole-mount FISH with fructose-glycerol clearing creates a powerful methodological synergy that addresses key challenges in three-dimensional tissue imaging:
Signal Preservation: Fructose-glycerol clearing effectively maintains the fluorescent signal generated by FISH probes, which is often quenched by harsher organic solvent-based clearing methods [3]. This compatibility is crucial for obtaining high-quality data with sufficient signal-to-noise ratio.
Structural Integrity: Unlike methods that cause significant tissue shrinkage or expansion, fructose-glycerol clearing preserves native tissue morphology with minimal distortion [5]. This ensures that the spatial localization patterns observed through FISH accurately represent biological reality rather than artifacts of sample preparation.
Protocol Simplicity: The aqueous nature of fructose-glycerol solutions makes them straightforward to implement without specialized equipment, reducing the technical barrier for laboratories adopting three-dimensional imaging approaches [4] [3].
Quantitative Comparison of Clearing Methods for FISH Applications
Table 1: Performance comparison of tissue clearing methods for whole-mount FISH applications
| Clearing Method | Compatibility with FISH | Tissue Morphology | Protocol Duration | Signal Preservation | Optical Clarity |
|---|---|---|---|---|---|
| Fructose-Glycerol | Excellent [3] | Preserved [5] | Days [3] | High [3] | Good for embryos/small tissues [5] |
| Organic Solvent (iDISCO+) | Good [4] | Shrinkage [5] | Hours-Days [5] | Moderate (may quench fluorescence) [5] | Excellent (whole adult mouse brain) [5] |
| Hydrogel Embedding (CLARITY) | Excellent [5] [22] | Small expansion/Preserved [5] | Days-Weeks [5] | High [5] [22] | Good (whole mouse brain) [5] |
| Aqueous Hyper-hydrating (CUBIC) | Good [4] [23] | Expansion [5] | Days [5] | High [5] [23] | Limited to 1-2mm tissues [5] |
Experimental Protocols and Workflows
Integrated FISH with Fructose-Glycerol Clearing Protocol
The following workflow outlines a standardized approach for combining whole-mount FISH with fructose-glycerol clearing, adapted from proven methodologies [3]:
Diagram 1: Integrated workflow for whole-mount FISH with fructose-glycerol clearing.
Detailed Protocol Steps
Sample Preparation and Fixation
Permeabilization
- Treat fixed samples with proteinase K (10μg/ml in PBS) for 15 minutes at room temperature to enable probe penetration [3].
- Optimization note: Permeabilization time may require adjustment based on tissue size and density.
FISH Probe Hybridization
- Design split-initiator probes (typically 25-33 probe pairs per target) using automated tools like Easy_HCR [3].
- Hybridize with probe solution (0.4 pmol of each probe in 100μl hybridization buffer) overnight at 37°C.
Signal Amplification
Fructose-Glycerol Clearing
Imaging and Analysis
- Mount cleared samples in fructose-glycerol solution for imaging.
- Acquire data using light-sheet fluorescence microscopy (LSFM) or confocal microscopy [3].
- Reconstruct and analyze three-dimensional expression patterns using appropriate software.
The Scientist's Toolkit: Essential Research Reagents
Table 2: Key reagents and their functions for combined FISH and clearing protocols
| Reagent/Category | Specific Examples | Function | Application Notes |
|---|---|---|---|
| Fixation | 4% Paraformaldehyde (PFA), Acrylamide hydrogel (4-30%) | Preserves tissue architecture and nucleic acid integrity | Higher acrylamide concentrations (15-30%) improve structural support for delicate tissues [22] |
| Permeabilization | Proteinase K, Detergents (Tween-20) | Enables probe penetration into tissue | Concentration and time must be optimized for each tissue type [3] |
| FISH Probes | HCR v3.0 split-initiator probes, Rolling Circle Amplification (RCA) probes | Target-specific mRNA detection | HCR v3.0 offers linear amplification and quantitative capability [4] |
| Signal Amplification | HCR hairpins (B1-Alexa Fluor-546, B2-Alexa Fluor-647, B3-Alexa Fluor-488) | Enhances detection sensitivity | Fluorophore selection should match available imaging systems [3] |
| Clearing Solution | 80% Fructose, Fructose-glycerol mixtures | Reduces light scattering by refractive index matching | Aqueous-based, preserves fluorescence signals [3] [5] |
| Mounting Media | Fructose-glycerol solutions, Commercial mounting media | Maintains cleared state during imaging | Must match refractive index of cleared tissue [3] |
Key Benefits and Research Applications
Advantages for Developmental Biology Research
The fructose-glycerol clearing method combined with whole-mount FISH provides several distinct benefits for studying embryonic development:
Three-Dimensional Spatial Context: Unlike section-based approaches that disrupt tissue continuity, this combination preserves the complete spatial organization of gene expression patterns. Research on octopus embryonic neurogenesis demonstrated that "three-dimensional reconstruction revealed additional spatial organization that had not been discovered using two-dimensional methods" [3].
Multi-Modal Integration: The method is compatible with immunohistochemistry, enabling simultaneous detection of mRNA and protein in the same sample. This allows researchers to "correlate gene expression with protein localization and function" within an intact tissue context [4].
Applicability to Non-Model Organisms: For species where transgenic approaches or antibody development is impractical, FISH with fructose-glycerol clearing provides an accessible alternative. This has been successfully demonstrated in diverse organisms including octopus, sea urchins, and quail embryos [4] [3] [22].
Quantitative Performance Metrics
Diagram 2: Performance profile of fructose-glycerol clearing for FISH applications.
Applications in Drug Development and Disease Modeling
For pharmaceutical researchers, this methodology offers unique capabilities for evaluating drug effects and modeling disease processes:
Developmental Toxicity Screening: Enables comprehensive assessment of drug-induced alterations in gene expression patterns throughout entire embryos, providing more informative data than traditional section-based histology.
Disease Mechanism Elucidation: Facilitates three-dimensional mapping of pathogenic gene expression signatures in intact tissues, particularly valuable for neurological disorders and cancer models where spatial organization influences pathology.
Biomarker Discovery: The compatibility with multiplexed FISH allows simultaneous detection of multiple mRNA targets, enabling identification of coordinated expression patterns that may serve as diagnostic or prognostic biomarkers [4] [3].
Technical Considerations and Optimization Guidelines
Method Selection Criteria
When implementing whole-mount FISH with fructose-glycerol clearing, researchers should consider several factors to ensure success:
Tize Size and Type: Fructose-glycerol clearing is particularly suitable for embryonic tissues and small organs (<1-2mm). Larger samples may require alternative clearing methods such as CLARITY or iDISCO+ [5].
Signal Intensity Requirements: For low-abundance targets, HCR v3.0 amplification provides superior sensitivity compared to traditional FISH methods while maintaining linear quantification [4].
Multiplexing Capability: The method supports simultaneous detection of multiple mRNA targets through orthogonal amplification systems, with practical limits of 3-5 targets depending on imaging system capabilities [3].
Troubleshooting Common Challenges
Incomplete Clearing: For pigmented tissues, additional bleaching with H₂O₂ may be necessary to reduce autofluorescence [24] [3].
Poor Probe Penetration: Increasing permeabilization time or incorporating additional detergent treatments can improve probe access to interior regions of thick tissues.
Signal Quenching: Ensure that fructose-glycerol solutions are prepared at appropriate pH and contain antioxidants to preserve fluorescence during storage and imaging.
The strategic combination of whole-mount FISH with fructose-glycerol clearing represents a significant methodological advancement for three-dimensional gene expression analysis. Its unique strengths in signal preservation, morphological integrity, and protocol accessibility make it particularly valuable for developmental biology research and drug development applications. While the method has limitations for very large tissue samples, its compatibility with diverse organisms and multi-modal approaches provides researchers with a powerful tool for investigating spatial gene expression patterns in their native three-dimensional context. As tissue clearing technologies continue to evolve, the integration with increasingly sophisticated FISH methodologies will further expand our ability to visualize and quantify gene expression throughout intact biological systems.
Step-by-Step Protocol: Implementing Whole Mount FISH with Fructose-Glycerol Clearing
Sample Preparation and Fixation Optimization for Different Tissue Types
Effective sample preparation and fixation are foundational to successful whole-mount fluorescent in situ hybridization (FISH), a technique pivotal for visualizing gene expression in three-dimensional biological specimens. The core challenge in whole-mount imaging lies in achieving sufficient antibody or probe penetration while preserving pristine tissue morphology and RNA integrity, especially when paired with advanced clearing techniques like fructose-glycerol. The inherent diversity of tissue types—varying in cellular density, lipid content, and extracellular matrix composition—demands a tailored, rather than a one-size-fits-all, approach. This application note provides a detailed, tissue-specific framework for optimizing sample preparation and fixation protocols to ensure high-quality outcomes in whole-mount FISH experiments utilizing fructose-glycerol clearing.
Tissue clearing transforms opaque biological samples into transparent specimens, enabling high-resolution 3D microscopy. The principle revolves around homogenizing the refractive index (RI) throughout the sample to minimize light scattering [7]. Fructose-glycerol clearing is a hydrophilic, aqueous-based method that immerses tissue in a high-refractive index solution containing fructose and glycerol, achieving transparency through refractive index matching without harsh lipid removal [8] [4]. This method is particularly valued for its simplicity, compatibility with fluorescent proteins, and ability to preserve tissue structure and lipid content, making it an excellent choice for FISH protocols [4] [7].
Tissue-Specific Optimization Strategies
The table below summarizes key challenges and tailored optimization strategies for different tissue categories.
Table 1: Tissue-Specific Challenges and Optimization Strategies for Whole-Mount FISH
| Tissue Category | Key Challenges | Recommended Fixation | Permeabilization Strategy | Notes for Fructose-Glycerol Clearing |
|---|---|---|---|---|
| Soft Tissues & Organoids (e.g., Pancreatic Organoids [8]) | High water content, delicate morphology, ECM gel embedding limits penetration. | 4% PFA, 1 hour at room temperature or overnight at 4°C [8] [25]. | Detergent-based (e.g., Tween-20) in wash buffers [8]. | ECM gel can be left embedded to prevent morphological disruption. Fructose-glycerol solution effectively clears these samples post-hybridization [8]. |
| Dense & Protein-Rich Tissues (e.g., Muscle, Heart [26]) | High density of contractile proteins and collagen, limiting probe diffusion. | 4% PFA, extended fixation (e.g., several hours to overnight). | Proteinase K treatment (e.g., 5 μg/ml) [25]; requires titration to avoid over-digestion. | Ensure thorough washing post-fixation to avoid cross-linking that hinders clearing. |
| Lipid-Rich Tissues (e.g., Brain [4], Liver [26]) | High lipid content scatters light and can hinder aqueous solutions. | 4% PFA, overnight at 4°C. | Extended detergent washes; consider mild delipidation if compatible with research goals [4]. | Fructose-glycerol preserves lipids. While effective, transparency may be slower than with solvent-based methods [4] [7]. |
| Cardiovascular Tissues (e.g., Arteries [6]) | Dense, fibrous network of collagen and elastin, high autofluorescence. | Fixation time must be optimized; extended formalin fixation can reduce transparency in some clearing protocols [6]. | Combination of detergents and potentially mild collagenase (requires extensive optimization). | Hydrophilic clearing like glycerol shows lower transparency for arteries; BABB (hydrophobic) is more effective for this specific tissue type [6]. |
The following workflow diagram synthesizes the key decision points and steps in a generalized, optimized protocol for whole-mount FISH.
Diagram 1: Optimized Workflow for Whole-Mount FISH with Tissue-Specific Decision Points.
Detailed Experimental Protocols
Core Protocol: Whole-Mount FISH for Marine Embryos and Larvae
This protocol, adapted from a method validated in diverse marine species, serves as a robust foundation [25]. The hybridization time is notably short, and the protocol is compatible with fructose-glycerol mounting.
Step 1: Fixation
- Fix specimens in 4% PFA in MOPS Buffer (0.1 M MOPS pH 7.0, 0.5 M NaCl).
- Incubate for 1 hour at room temperature or overnight at 4°C.
- Wash 3-5 times with MOPS buffer (with 0.1% Tween-20).
- Dehydrate through a graded ethanol series (50%, 60%, 70%) and store in 70% ethanol at -20°C.
Step 2: Pre-hybridization and Hybridization
- Rehydrate samples to MOPS buffer through a descending ethanol series.
- Replace MOPS buffer with pre-warmed hybridization buffer (50% formamide, 0.1 M MOPS pH 7.0, 0.5 M NaCl, 0.1% Tween-20, 1 mg/ml BSA).
- Pre-hybridize at 65°C for 3 hours.
- Replace buffer with fresh hybridization buffer containing the labeled antisense RNA probe.
- Hybridize overnight at 65°C.
Step 3: Post-Hybridization Washes and Mounting
- Remove the probe solution and perform stringent washes: 2x in pre-warmed hybridization buffer, 1x in a 1:1 mix of hybridization buffer and MOPS buffer, and 2x in MOPS buffer.
- Counterstain nuclei with DAPI if required.
- Mount samples directly in a fructose-glycerol clearing solution [8].
Protocol: Immunofluorescence of ECM Gel-Embedded Organoids
This protocol highlights the specialized handling required for samples embedded in extracellular matrix (ECM) gels [8].
Step 1: Fixation and Blocking
- Fix ECM gel-embedded organoids in 4% PFA.
- Wash with PBS-glycine buffer and IF-wash buffer.
- Block to reduce non-specific background.
Step 2: Antibody Incubation and Clearing
- Incubate with primary and secondary antibodies.
- Perform antibody washes thoroughly.
- Mount using the fructose-glycerol clearing solution. The ECM gel remains in place, preserving the 3D structure.
The Scientist's Toolkit: Research Reagent Solutions
Table 2: Essential Reagents for Whole-Mount FISH with Fructose-Glycerol Clearing
| Reagent | Function | Example Formulation / Notes |
|---|---|---|
| Paraformaldehyde (PFA) | Cross-linking fixative that preserves tissue architecture and RNA integrity. | Typically used at 4% in a physiological buffer (e.g., MOPS, PBS). Concentration and time are tissue-dependent [25] [8]. |
| MOPS Buffer | A buffered saline solution used during fixation and washing to maintain pH and osmolarity. | 0.1 M MOPS pH 7.0, 0.5 M NaCl. Can be supplemented with 0.1% Tween-20 as a detergent [25]. |
| Hybridization Buffer | Creates optimal conditions for specific probe-target mRNA binding; formamide lowers melting temperature. | 50% formamide, 0.1 M MOPS pH 7.0, 0.5 M NaCl, 0.1% Tween-20, 1 mg/ml BSA [25]. |
| Formamide | A denaturing agent used in hybridization buffer to facilitate probe access to target mRNA. | Use high-grade, nuclease-free formamide. |
| Proteinase K | A protease that digests proteins to permeabilize dense tissues. Must be carefully titrated. | Used at 5 μg/ml for specific tissues like amphioxus [25]. Over-digestion destroys morphology. |
| Fructose-Glycerol Solution | Aqueous clearing agent that renders tissues transparent by refractive index matching. | A clearing solution of fructose and glycerol is used for mounting after FISH or immunofluorescence [8]. |
| Tween-20 | A non-ionic detergent used in wash buffers to permeabilize lipid membranes and reduce non-specific binding. | Typically used at 0.1-0.5% in buffer solutions [8] [25]. |
| Bovine Serum Albumin (BSA) | A blocking agent used to adsorb to hydrophobic sites and prevent non-specific binding of probes/antibodies. | Used at 1 mg/ml in hybridization buffer or at higher percentages (1-5%) in blocking buffers [25]. |
Quantitative Comparisons of Clearing Efficacy
The choice of clearing agent must be tailored to the tissue type. The following table summarizes findings from a systematic evaluation of clearing methods on cardiovascular tissue, providing a quantitative benchmark.
Table 3: Quantitative Comparison of Clearing Agents on Porcine Left Anterior Descending Artery [6]
| Clearing Method | Clearing Type | Relative Tissue Transparency | Signal Intensity (AF-AUC, SHG-AUC) | Tissue Preservation | Suitability for Cardiovascular Tissue |
|---|---|---|---|---|---|
| Glycerol | Hydrophilic | Lower | Baseline (AF: 0.0035 ± 0.0009) | Good, improved with fixation | Low |
| BABB | Hydrophobic (Solvent) | High | Significantly Increased (AF: 0.1205 ± 0.0168) | Good, but fixation can reduce transparency | High |
| Fructose-Glycerol | Hydrophilic (Aqueous) | Moderate (Inferred) | Preserved (Inferred from compatibility with FISH) | Excellent for morphology and lipids | High for soft tissues, not cardiovascular |
Optimizing sample preparation and fixation is a critical determinant for the success of whole-mount FISH. The protocols and data presented herein underscore that the most reliable results are achieved when the fixation, permeabilization, and clearing strategies are deliberately matched to the unique physicochemical properties of the target tissue. By leveraging the detailed, tissue-specific guidance in this application note—from the foundational principles to the precise reagent formulations—researchers can systematically overcome common barriers and consistently generate high-fidelity, quantifiable 3D gene expression data using whole-mount FISH and fructose-glycerol clearing.
Hybridization Chain Reaction v3.0 (HCR v3.0) represents a significant advancement in fluorescence in situ hybridization (FISH) technology, enabling multiplexed, quantitative mRNA imaging within intact biological specimens. When combined with fructose-glycerol clearing techniques, HCR v3.0 provides researchers with a powerful methodology for three-dimensional gene expression mapping in whole-mount tissues and embryos. This approach is particularly valuable for studying complex spatial expression patterns during development and in disease models, offering superior signal-to-noise ratio through linear signal amplification [4] [3]. The compatibility of HCR v3.0 with whole-mount specimens and optical clearing methods makes it an indispensable tool for creating comprehensive 3D gene expression atlases, especially in non-model organisms where antibody resources may be limited [3].
HCR v3.0 Probe Design Fundamentals
Probe Structure and Mechanism
HCR v3.0 utilizes split-initiator probe pairs that hybridize to adjacent target regions on mRNA molecules. Each probe consists of a target-binding region (approximately 25-35 nucleotides) flanked by initiator sequences that trigger the hybridization chain reaction upon probe pair binding. This split-initiator design significantly reduces non-specific amplification and background signal compared to previous HCR versions [4] [3]. The mechanism involves:
- Probe Hybridization: Split-initiator probes bind contiguously to target mRNA
- Hairpin Assembly: Fluorophore-labeled hairpin amplifiers remain stable in solution until initiator exposure
- Signal Amplification: Upon initiator exposure, hairpins self-assemble into fluorescent polymers
- Linear Signal Accumulation: Fluorescence intensity scales linearly with target abundance, enabling quantitative analysis [4]
Table 1: Key Design Parameters for HCR v3.0 Probe Pairs
| Parameter | Recommended Specification | Purpose/Rationale |
|---|---|---|
| Probe Length | 25-35 nt per probe | Optimal balance of specificity and binding efficiency |
| Probe Set Size | 20-33 probe pairs per target mRNA | Ensures sufficient signal amplification; fidelity increases with probe set size [27] |
| Target Region | Coding sequence or specific isoforms | Avoids UTRs that may be less conserved or accessible |
| Amplifier System | B1-B5 amplifiers with distinct fluorophores | Enables multiplexing with different Alexa Fluor combinations (488, 546, 647, etc.) [27] |
| Homopolymer Filter | Max 5 bp for polyA/T and polyC/G | Prevents off-target binding to low-complexity regions [28] |
Design Strategies for Optimal Specificity
Effective HCR v3.0 probe design requires careful consideration of multiple factors to ensure high specificity and sensitivity:
- Sequence Selection: Input the sense DNA sequence (T instead of U) of your target mRNA, which can include UTRs, introns, or coding regions based on experimental needs [28]
- Specificity Validation: Implement BLAST analysis against relevant transcriptomes to eliminate probes with significant off-target binding [28]
- Thermodynamic Optimization: Maintain consistent melting temperatures across all probes within a set (typically 55-65°C) to ensure uniform hybridization efficiency
- Secondary Structure Avoidance: Select target regions with minimal secondary structure to enhance probe accessibility [29]
- Genome-Wide Specificity Assessment: For critical applications, consider advanced tools like TrueProbes that perform genome-wide BLAST-based binding analysis with thermodynamic modeling to maximize specificity [29] [30]
Computational Tools for Probe Design
Automated Probe Design Platforms
Several computational tools are available for designing HCR v3.0-compatible probes:
Table 2: Comparison of HCR v3.0 Probe Design Tools
| Tool Name | Access Method | Key Features | Best Suited For |
|---|---|---|---|
| HCR Probe Generator [28] | Python script/Jupyter notebook | User-friendly interface, customizable parameters, BLAST integration, IDT-compatible output | Academic labs with basic bioinformatics capabilities |
| Molecular Instruments HCR Assay Designer [31] | Web-based commercial platform | Validated designs, automated workflow, compatible with various staining platforms | Researchers seeking pre-validated, ready-to-use probe sets |
| TrueProbes [29] [30] | MATLAB-based standalone application | Genome-wide off-target assessment, thermodynamic-kinetic modeling, expression-data integration | Applications requiring maximum specificity and quantitative performance |
| Easy_HCR [3] | Custom code | Tailored for non-model organisms, used successfully in octopus embryonic studies | Research on non-traditional model organisms |
Practical Implementation of Probe Design
The following workflow diagram illustrates the complete process from probe design to 3D imaging:
Integrated Protocol: Whole-Mount HCR v3.0 with Fructose-Glycerol Clearing
Sample Preparation and HCR v3.0
Day 1: Sample Fixation and Permeabilization
- Fixation: Immerse tissues or embryos in 4% paraformaldehyde (PFA) in PBS overnight at 4°C [3]
- Dehydration: Transfer samples through graded methanol/PBST series (25%, 50%, 75%, 100% methanol), 10 min each [3]
- Storage: Store dehydrated samples at -20°C in 100% methanol until use
- Rehydration: Reverse methanol series to rehydrate samples (75%, 50%, 25% methanol in PBST), 10 min each
- Permeabilization: Treat with proteinase K (10 μg/ml in PBS-DEPC) for 15 min at room temperature [3]
- Post-fixation: Refix in 4% PFA for 20 min, followed by 3×5 min washes in PBST
Day 2: HCR v3.0 Hybridization and Amplification
- Pre-hybridization: Equilibrate samples in probe hybridization buffer for 30 min at 37°C
- Hybridization: Incubate with probe solution (0.4 pmol of each probe in 100 μl hybridization buffer) at 37°C for 36 hours [3]
- Post-hybridization washes: 4×15 min washes with probe wash buffer at 37°C, followed by 2×5 min washes with 5xSSCT at room temperature
- Pre-amplification: Incubate in amplification buffer for at least 30 min at room temperature
- Hairpin preparation: Snap-cool hairpins (3 pmol each H1 and H2) by heating to 95°C for 90s, then place on ice for 5 min, and equilibrate to room temperature for 30 min [3]
- Amplification: Add prepared hairpins to amplification buffer and incubate samples overnight in the dark at room temperature
Day 3: Post-Amplification Processing
- Hairpin removal: 3×15 min washes with 5xSSCT at room temperature
- Counterstaining (optional): Incubate with DAPI or other nuclear stains if needed
- Mounting for clearing: Transfer samples to fructose-glycerol clearing solution
Fructose-Glycerol Clearing and Imaging
The fructose-glycerol clearing method effectively balances transparency preservation with signal retention, making it ideal for HCR v3.0-processed samples [3]:
- Clearing Solution Preparation: Prepare 60% fructose (wt/vol) in 0.5% PBS-Tween, adding 1.5% nitrobenzooxadiazole (if needed for refractive index matching) [4] [3]
- Clearing Process: Immerse samples in fructose-glycerol solution and incubate at 4°C for 24-48 hours with gentle agitation
- Refractive Index Matching: Adjust iohexol percentage based on calibration curves to match objective lens RI (typically 1.45-1.52) [4]
- Mounting: Transfer cleared samples to imaging chambers with fresh clearing solution
- 3D Imaging: Acquire images using confocal or light-sheet fluorescence microscopy (LSFM)
Research Reagent Solutions
Table 3: Essential Reagents for HCR v3.0 Whole-Mount FISH
| Reagent Category | Specific Products/Components | Function in Protocol |
|---|---|---|
| HCR Probe Sets | Custom DNA oligo pools (IDT), Split-initiator probes (20-33 pairs) [28] [3] | Target-specific hybridization and signal initiation |
| HCR Amplifiers | B1-B5 hairpin amplifiers with Alexa Fluor dyes (488, 546, 594, 647) [27] | Signal amplification through hybridization chain reaction |
| Hybridization Components | Formamide, Dextran sulfate, SSC buffer, tRNA | Enhance hybridization specificity and efficiency |
| Clearing Reagents | Fructose, Glycerol, PBS-Tween, Iohexol [4] [3] | Tissue transparency through refractive index matching |
| Imaging Compatibility | Mounting media with matched RI, Antioxidants (if needed) | Signal preservation during 3D microscopy |
Troubleshooting and Optimization
Addressing Common Challenges
- High Background: Increase post-hybridization wash stringency; verify probe specificity with BLAST; include pre-amplification step [3]
- Weak Signal: Extend hybridization time (up to 36 hours); increase probe concentration (up to 0.8 pmol/100μl); validate probe set size (minimum 20 pairs) [27]
- Autofluorescence: Incorporate OMAR (oxidation-mediated autofluorescence reduction) photochemical bleaching step prior to hybridization [24]
- Incomplete Clearing: Extend clearing incubation time; optimize fructose concentration (40-80% range); ensure adequate sample permeabilization [4] [3]
- Sample Degradation: Limit proteinase K treatment duration; include RNase inhibitors in solutions; process controls in parallel
Validation and Quality Control
- Specificity Controls: Include no-probe controls; knockout tissues if available; sense probe negative controls [29]
- Signal Linearity: Validate quantitative performance using samples with known expression gradients [4]
- Multiplexing Validation: Image each channel separately to confirm absence of cross-talk between amplifiers [27]
- Reprodubility Assessment: Repeat experiments with independently designed probe sets targeting different regions of the same transcript
This comprehensive protocol enables robust whole-mount mRNA visualization through custom HCR v3.0 probes and fructose-glycerol clearing, facilitating high-resolution 3D gene expression analysis across diverse tissue types and embryonic stages.
In situ hybridization chain reaction version 3.0 (HCR v3.0) offers a robust, sensitive, versatile and low-cost method for simultaneous detection of multiple mRNAs in cells or tissues of any organism [3]. For research on whole mount specimens, combining HCR v3.0 with fructose-glycerol clearing enables detailed three-dimensional mapping of gene expression, providing spatial organization insights not discoverable using two-dimensional methods [3]. This protocol details the optimized parameters for HCR v3.0 in whole mount octopus embryos, though the principles apply broadly to other model systems.
HCR v3.0 Protocol Parameters
Probe Design and Components
Probe design represents a critical initial step for successful HCR v3.0. Researchers can utilize automated tools like Easy_HCR to generate HCR v3.0-type probe pairs for fluorescent in situ mRNA visualization [3]. Following design, DNA Oligo Pools can be ordered from commercial suppliers such as Integrated DNA Technologies and dissolved in Nuclease-Free Distilled Water [3]. HCR amplifiers with different fluorophores (e.g., B1-Alexa Fluor-546, B2-Alexa Fluor-647, B3-Alexa Fluor-488) are obtained from Molecular Instruments, Inc. [3].
Table: HCR v3.0 Probe Design Specifications for Octopus vulgaris Genes
| Gene Target | Number of Split-Initiator Probe Pairs | Biological Function |
|---|---|---|
| Ov-apolpp | 33 | Glial marker [3] |
| Ov-ascl1 | 33 | Neural progenitor marker [3] |
| Ov-elav | 27 | Neuronal marker [3] |
| Ov-neuroD | 26 | Neural precursor marker [3] |
Detailed HCR v3.0 Workflow Parameters
The following protocol is adapted from the Molecular Instruments' HCR v3.0 protocol for whole mount mouse embryos with specific modifications for octopus embryos [3]. All steps are performed at room temperature unless otherwise specified.
Table: Detailed HCR v3.0 Hybridization and Amplification Parameters
| Protocol Step | Key Parameters | Duration | Temperature |
|---|---|---|---|
| Sample Preparation | Rehydrate fixed embryos from MeOH to PBST via graded series [3]. | 10 min per step | Room Temperature |
| Permeabilization | Proteinase K (Roche, 10 μg/ml in PBS-DEPC) [3]. | 15 min | Room Temperature |
| Pre-Hybridization | Probe hybridization buffer alone. | 30 min | Room Temperature |
| Probe Hybridization | 0.4 pmol of each probe in 100 µL probe hybridization buffer [3]. | Overnight | Room Temperature |
| Post-Hybridization Washes | 4x wash buffer, 5X SSCT, 2x 75% SSCT/25% amplification buffer [3]. | 15 min; 10 min; 10 min | Room Temperature |
| Pre-Amplification | Amplification buffer alone. | 30 min | Room Temperature |
| Hairpin Preparation | 3 pmol each of H1 & H2 snap-cooled (95°C for 90s, 5min on ice, 30min RT) [3]. | ~35 min | Various |
| Amplification | Add prepared hairpins to 100 µL amplification buffer. | Overnight | Room Temperature |
| Final Washes | 3x 5X SSCT washes [3]. | 10 min each | Room Temperature |
Fructose-Glycerol Clearing and Imaging
After HCR v3.0, proceed with immunohistochemistry if required [3]. For clearing, the fructose-glycerol method has been found optimal for preserving the fluorescent signal of HCR v3.0 in whole mount octopus embryos [3]. Once cleared, samples can be imaged using light sheet fluorescence microscopy (LSFM) to generate three-dimensional reconstructions [3].
Experimental Workflow
The following diagram illustrates the sequential stages of the combined HCR v3.0 and clearing protocol, highlighting the multi-day process and key decision points.
The Scientist's Toolkit: Research Reagent Solutions
Table: Essential Reagents and Materials for HCR v3.0 Experiments
| Reagent/Material | Function/Purpose | Example Source |
|---|---|---|
| HCR v3.0 DNA Probe Pools | Split-initiator probes designed to bind target mRNA sequences. | Integrated DNA Technologies, Inc [3]. |
| HCR Amplifiers | Fluorescent hairpin molecules that undergo chain reaction upon initiation. | Molecular Instruments, Inc [3]. |
| Probe Hybridization Buffer | Creates optimal conditions for specific probe-mRNA binding. | Molecular Instruments, Inc [3]. |
| Amplification Buffer | Provides the chemical environment for the HCR amplification process. | Molecular Instruments, Inc [3]. |
| Proteinase K | Enzyme for tissue permeabilization, enabling probe access. | Roche [3]. |
| 5X SSCT Wash Buffer | Saline-sodium citrate buffer with Tween for stringency washes to reduce background. | Prepared in lab [3]. |
| Fructose-Glycerol Solution | Aqueous clearing medium that preserves fluorescence for 3D imaging. | Prepared in lab [3]. |
Performance Optimization Tips
To boost performance in HCR v3.0 experiments, consider these evidence-based adjustments [32]:
- Increase Probe Concentration: If using a 4 nM probe concentration, try increasing it to 20 nM for enhanced signal.
- Extend Incubation Times: Incorporating overnight incubations for both probe hybridization and amplification steps can significantly improve signal strength.
- Utilize Boosted Probes: For targets with sufficiently long RNA sequences, upgraded probe designs with more binding sites can elevate signal without protocol changes.
Combining FISH with Immunohistochemistry for Simultaneous mRNA and Protein Detection
The spatial coordination of gene expression is fundamental to developmental biology, disease progression, and drug development research. While transcriptomics and proteomics provide comprehensive molecular profiles, they typically lose crucial spatial context. The integration of fluorescence in situ hybridization (FISH) with immunohistochemistry (IHC) creates a powerful synergistic technology that enables researchers to visualize and quantify mRNA transcripts alongside their corresponding protein products within the same biological sample, preserving valuable three-dimensional architectural information.
This application note details optimized protocols for combining these techniques in whole-mount specimens, with particular emphasis on the use of fructose-glycerol clearing to enable deep-tissue imaging. This approach is especially valuable for characterizing complex biological systems—such as whole embryos, organoids, and tissue explants—where understanding the relationship between gene expression patterns and protein localization is critical for unraveling developmental and disease mechanisms.
Technical Challenges and Solutions
Combining FISH and IHC in whole-mount samples presents several technical hurdles that require careful optimization. Key among these are preserving RNA integrity during protein detection, achieving sufficient antibody penetration while maintaining tissue morphology, and reducing autofluorescence for clear signal detection.
- RNA Degradation During IHC: The incubation steps required for antibody binding can expose RNA to degradation by RNases. Solution: Using RNase-free conditions and incorporating RNase inhibitors (e.g., SUPERase•In) in all IHC buffers is essential [33].
- Simultaneous Permeabilization and Morphology Preservation: The sample must be permeable to both nucleic acid probes and antibodies without compromising structural integrity. Solution: A balanced approach using Triton X-100 for permeabilization, omitting harsh proteinase digestion steps when performing IHC first, has proven effective in mouse preimplantation embryos [33].
- Tissue Autofluorescence: Native fluorescence from lipids and other molecules can obscure specific signals. Solution: Chemical bleaching methods, such as oxidation-mediated autofluorescence reduction (OMAR), can maximally suppress autofluorescence, alleviating the need for digital post-processing [24]. Furthermore, extended ClearSee treatment has been shown to substantially improve the signal-to-noise ratio for single-molecule FISH (smFISH) in plant tissues [34].
- Signal Optimization for Deep Imaging: For thick samples, light scattering and absorption limit penetration and resolution. Solution: Fructose-glycerol clearing provides an optimal balance between tissue transparency and fluorescence preservation, making it compatible with both HCR v3.0 FISH and IHC signals, as demonstrated in octopus embryos [3].
Quantitative Performance Data
The following tables summarize the performance characteristics of combined FISH-IHC protocols across different model systems and methodological variations.
Table 1: Performance Metrics of Combined FISH-IHC Methods
| Model System / Method | mRNA Detection Sensitivity | Protein Detection Compatibility | Key Applications Demonstrated | Reference |
|---|---|---|---|---|
| Mouse Embryonic Limb Buds (OMAR + smFISH) | Maximal autofluorescence suppression | Immunofluorescence (IF) | Whole-mount RNA-FISH and IF on vertebrate embryos | [24] |
| Plant Tissues (WM-smFISH + FP Reporters) | Single-molecule resolution | Fluorescent protein (FP) reporters | Simultaneous quantification of mRNA and protein at single-cell resolution | [34] |
| Octopus Embryos (HCR v3.0 + IHC) | Multiplexed mRNA detection | Phospho-histone H3 IHC | 3D visualization of embryonic neurogenesis | [3] |
| Human Airway Epithelium (RNAscope + IHC) | Detection of viral S mRNA | SARS-CoV-2 S protein IHC | Subcellular localization of S gene products in infected cells | [35] |
| Mouse Preimplantation Embryos (RNAscope + IF) | Detection of low-abundance lncRNAs | Transcription factors (Cdx2, Tead4) | Cell fate specification studies in blastocysts | [33] |
Table 2: Impact of Clearing Methods on Signal Integrity
| Clearing Method | FISH Signal Preservation | IHC/IF Signal Preservation | Tissue Shrinkage | Recommended Imaging Modality | |
|---|---|---|---|---|---|
| Fructose-Glycerol | Excellent (HCR v3.0 compatible) | Excellent | Minimal | Light sheet fluorescence microscopy (LSFM) | [3] |
| ClearSee | Excellent (smFISH compatible) | Good (FP reporters preserved) | Minimal | Confocal microscopy | [34] |
| Organic Solvents (e.g., BABB) | Variable / Often poor | Variable / Often poor | Significant | LSFM or confocal (with caveats) | [3] |
Detailed Experimental Protocols
Sequential Whole-Mount IF/smFISH for Mouse Blastocysts
This protocol, optimized for preimplantation embryos, performs immunofluorescence first to preserve protein antigenicity, followed by sensitive smFISH [33].
Step-by-Step Procedure:
Embryo Collection and Fixation:
- Collect E3.5 blastocysts from pregnant mice by uterine flushing with M2 medium.
- Fix embryos in 4% paraformaldehyde (PFA) in PBS for 30 minutes at room temperature.
- Carefully remove the zona pellucida using acidic Tyrode's solution.
Immunofluorescence (Under RNase-Free Conditions):
- Permeabilization: Treat embryos with 0.1% Triton X-100 in PBS (PBX) for 20 minutes.
- Blocking: Incubate in blocking solution (2% horse serum in PBS with 10 µg/ml SUPERase•In RNase Inhibitor) for 1 hour at room temperature.
- Primary Antibody: Incubate with primary antibody (e.g., anti-Cdx2, anti-Tead4) diluted in blocking solution overnight at 4°C.
- Secondary Antibody: Wash and incubate with fluorescently conjugated secondary antibody (e.g., Alexa Fluor 488) for 1-2 hours at room temperature.
- Post-Fixation: Re-fix embryos in 4% PFA for 30 minutes to crosslink antibodies and preserve the IF signal during subsequent FISH steps.
Single-Molecule FISH (RNAscope):
- Follow the manufacturer's protocol for the RNAscope Multiplex Fluorescent V2 Assay.
- Probe Hybridization: Hybridize with target-specific probes (e.g., Platr4, Pou5f1) for 2 hours at 40°C.
- Signal Amplification: Perform the sequential amplification steps using fluorophore-conjugated amplifiers (e.g., Opal 570, Opal 690).
- Counterstaining: Stain with DAPI to label nuclei.
Mounting and Imaging:
- Mount embryos in an anti-fade mounting medium on glass-bottom dishes.
- Image using a confocal microscope, acquiring z-stacks to capture the 3D expression data.
Critical Steps and Notes:
- RNase Inhibition: The use of RNase inhibitors during the IF steps is non-negotiable for preserving RNA integrity.
- Antigen Preservation: Omitting proteinase K digestion is crucial when performing IF before FISH. The Triton X-100-based permeabilization is sufficient for antibody penetration in many embryonic tissues.
- Controls: Always include negative control probes (e.g., RNAscope 3-plex Negative Control Probe) and no-primary-antibody controls to confirm signal specificity.
Whole-Mount HCR v3.0 with IHC and Fructose-Glycerol Clearing for Octopus Embryos
This protocol is designed for larger, more complex embryos and leverages the signal amplification of HCR and the clearing efficiency of fructose-glycerol for deep imaging [3].
Step-by-Step Procedure:
Sample Preparation and Permeabilization:
- Rehydrate fixed, methanol-dehydrated octopus embryos through a graded series of methanol to PBST.
- Permeabilize embryos by treatment with proteinase K (10 µg/ml in PBS-DEPC) for 15 minutes at room temperature. Note: This step occurs before FISH, unlike the mouse embryo protocol.
- Post-fix in 4% PFA for 1 hour to stabilize tissues after permeabilization.
Hybridization Chain Reaction (HCR) v3.0:
- Pre-hybridization: Incubate embryos in 30% probe hybridization buffer for 30 minutes.
- Probe Hybridization: Replace with fresh hybridization buffer containing 0.4 pmol of each HCR initiator probe per 100 µl. Hybridize overnight at 37°C.
- Post-Hybridization Washes: Wash embryos stringently with 5x SSCT and then 2x 5x SSCT to remove unbound probes.
- Amplification: Snap-cool fluorophore-conjugated HCR hairpins. Incubate embryos in amplification buffer containing the hairpins overnight in the dark at room temperature.
Immunohistochemistry:
- After HCR signal development, perform standard IHC protocols for the target protein (e.g., anti-phospho-histone H3). Blocking, primary, and secondary antibody steps are performed as usual.
Fructose-Glycerol Clearing and Imaging:
- Clear embryos by incubating in a fructose-glycerol solution (2.5:1 mixture of fructose/glycerol to PBS or 1x SSC) for 2-3 days.
- Image the cleared, labeled embryos using Light Sheet Fluorescence Microscopy (LSFM) for rapid 3D data acquisition.
Critical Steps and Notes:
- Probe Design: Tools like
Easy_HCRcan automate the design of HCR v3.0 probe pairs, ensuring high specificity and signal strength. - Hairpin Handling: Proper snap-cooling of HCR hairpins is essential to minimize non-specific amplification.
- Clearing Compatibility: Fructose-glycerol was found to be optimal for preserving the fluorescent signal of HCR v3.0 and IHC in octopus embryos, outperforming organic solvent-based methods [3].
The Scientist's Toolkit: Essential Research Reagents
Table 3: Key Reagent Solutions for Combined FISH-IHC
| Reagent Category | Specific Product / Component | Function in the Protocol | Key Consideration | |
|---|---|---|---|---|
| RNase Control | SUPERase•In RNase Inhibitor | Protects RNA molecules from degradation during IF procedures. | Critical for protocols performing IF before FISH. | [33] |
| Permeabilization | Triton X-100 | Disrupts lipid membranes to allow entry of probes and antibodies. | Concentration must balance access with morphology preservation. | [33] |
| FISH Probes | RNAscope Target Probe Sets | Label target mRNA via a proprietary signal amplification system. | Highly sensitive and specific; suitable for low-abundance RNAs. | [33] |
| FISH Probes | HCR v3.0 Initiator Probes & Hairpins | Bind target mRNA and initiate hybridization chain reaction for amplification. | Cost-effective, customizable, and enable multiplexing. | [3] |
| Detection | Fluorophore-Conjugated Secondary Antibodies | Visualize primary antibody binding for protein detection. | Choose fluorophores with minimal spectral overlap. | [33] |
| Clearing Agent | Fructose-Glycerol Solution | Reduces light scattering by matching refractive index of tissue. | Excellent for preserving fluorescence from FISH and IHC. | [3] |
| Mounting Medium | ProLong Gold Antifade Mountant | Preserves fluorescence and reduces photobleaching during microscopy. | Includes DAPI for nuclear counterstaining. | [35] |
Data Analysis and Quantification
The combination of FISH and IHC enables robust quantitative analysis of the relationship between mRNA and protein in a spatial context.
- Image Processing: Use deconvolution software (e.g., LASX with 2D and 3D Deconvolution) to improve image clarity [35].
- Single-Cell Quantification:
- Cell Segmentation: Tools like Cellpose can automatically segment cells based on cell wall stains (e.g., SR2200) or membrane markers [34].
- mRNA Counting: Software such as FISH-quant is designed to identify and count individual mRNA foci within segmented cells [34].
- Protein Intensity Measurement: Programs like CellProfiler can quantify mean or integrated fluorescence intensity of protein signals per cell [34].
- Correlation Analysis: Generate heatmaps of the log ratio between mRNA counts and protein intensity to visualize spatial patterns of discordance between transcript and protein levels, which can indicate post-transcriptional regulation [34].
- Open-Source Solution: QuPath provides an integrated open-source platform for the fluorescent-based quantification of both mRNA and protein in microscopic images [35].
The integration of FISH and immunohistochemistry in whole-mount samples, enhanced by effective clearing methods like fructose-glycerol, provides a powerful spatial biology toolset. The protocols detailed herein, validated in systems ranging from mouse and octopus embryos to plant tissues, offer researchers a clear path to obtaining quantitative, single-cell resolution data on gene expression and protein localization within an intact 3D context. This approach is indispensable for advancing our understanding of developmental processes, disease mechanisms, and the complex interplay between the transcriptome and the proteome.
Fructose-glycerol clearing is an aqueous-based optical clearing technique that renders biological samples transparent by reducing light scattering. The method operates on the principle of refractive index (RI) matching, where the clearing solution homogenizes the differing RIs of various tissue components (e.g., water, lipids, proteins) that normally cause light to scatter [7]. The fructose component creates a high-RI aqueous environment, while glycerol can serve to fine-tune the RI and preserve fluorescent signals [36]. This method is particularly valued for its compatibility with fluorescent labels, including those from immunohistochemistry (IHC) and RNA in situ hybridization chain reaction (HCR v3.0), making it a powerful tool for volumetric imaging in whole-mount studies [3].
Reagent Formulations and Properties
Standard Fructose-Glycerol Solution
The core clearing agent is typically a saturated fructose solution supplemented with glycerol. A common formulation used successfully for clearing octopus embryos after whole-mount HCR is a mixture of fructose and glycerol [3]. The table below summarizes key properties and formulations.
Table 1: Optical Clearing Solutions and Their Properties
| Solution Name | Composition | Refractive Index (RI) | Key Advantages | Primary Applications |
|---|---|---|---|---|
| Fructose-Glycerol [3] | Fructose, Glycerol, water | ~1.44-1.48 [7] | Preserves HCR and IHC signals, simple formulation | Whole-mount HCR & IHC on embryos, small organs |
| SeeDB [36] | 80.2% (w/w) D(-)-Fructose, 0.5% α-thioglycerol | ~1.49 | Constant sample volume, preserves cellular morphology | Brain samples, embryos, deep imaging >1,000 µm |
| LIMPID [4] | Saline-sodium citrate (SSC), Urea, Iohexol | Adjustable with Iohexol | Lipid-preserving, single-step, tunable RI | 3D FISH imaging, multiplexed with IHC |
| Glycerol (80%) [37] | 80% Glycerol in water | ~1.44 | Simple, effective clearing for organoids | Mounting medium for 3D two-photon imaging of gastruloids |
The Scientist's Toolkit: Essential Research Reagents
Table 2: Key Reagents for Fructose-Glycerol Clearing and Whole-Mount FISH
| Reagent / Solution | Function / Purpose | Example from Literature |
|---|---|---|
| D(-)-Fructose | Primary component for creating a high-refractive index aqueous environment [36]. | Used in SeeDB (80.2% w/w) and fructose-glycerol formulations [3] [36]. |
| Glycerol | Fine-tunes refractive index and aids in signal preservation [7]. | Component of fructose-glycerol clearing solution for octopus embryos [3]. |
| Probe Hybridization Buffer (HCR) | Enables specific binding of initiator probes to target mRNA sequences [38] [3]. | Essential for HCR v3.0 RNA-FISH; provided by Molecular Instruments [38]. |
| HCR Amplification Buffer | Environment for the hybridization chain reaction to polymerize fluorescent hairpins [3]. | Used with snap-cooled hairpins to amplify the FISH signal [38] [3]. |
| Phosphate Buffered Saline (PBS) | Standard saline buffer for washing and diluting solutions throughout the protocol [38] [3]. | Used for preparing PFA, washes, and making buffers [38]. |
| Paraformaldehyde (PFA) | Cross-linking fixative that preserves tissue morphology and immobilizes nucleic acids/proteins [38] [3]. | Typically used at 4% for embryo and tissue fixation [38] [3]. |
| Proteinase K | Enzyme for digesting proteins and permeabilizing tissues to facilitate probe penetration [3]. | Used at 10 µg/ml for permeabilizing octopus embryos [3]. |
| Tween 20 / Triton X-100 | Detergents used to permeabilize lipid membranes and reduce non-specific binding in buffers [38]. | Added to wash buffers (e.g., PBST) to improve antibody and probe access [38] [3]. |
Step-by-Step Protocol
Sample Preparation and Staining
The procedure begins with standard steps for whole-mount FISH, exemplified by protocols for mouse embryos and Octopus vulgaris [38] [3].
- Fixation: Fix tissue or embryos in 4% Paraformaldehyde (PFA) overnight at 4°C [3] [36].
- Permeabilization: Treat samples with Proteinase K (e.g., 10 µg/ml for 15 minutes at room temperature for octopus embryos) to allow probe entry. The concentration and time must be optimized for specific tissue types [3].
- Pre-Hybridization and Hybridization: Follow established HCR v3.0 or RNA-FISH protocols [38] [3] [4].
- HCR v3.0 Example: Incubate samples with probe solution (0.4 pmol of each probe in 100 µl hybridization buffer). This is followed by washes and an overnight amplification step with snap-cooled fluorescent hairpins (3 pmol each in 100 µl amplification buffer) [3].
- Post-Staining Washes: Perform stringent washes to remove unbound probes and hairpins (e.g., 3x 15 minutes with 5x SSCT buffer) [3].
- Optional Immunohistochemistry (IHC): If combining with protein detection, perform IHC at this stage [3].
Fructose-Glycerol Clearing and Mounting
After staining and final washes, proceed with the clearing protocol. The following workflow integrates steps from multiple established methods [3] [36].
The process involves a graded series of fructose incubations to prevent osmotic shock and ensure proper RI matching throughout the sample [36].
- Gradual Fructose Equilibration:
- Prepare a series of fructose solutions in distilled water or 0.1x PBS (e.g., 20%, 40%, 60%, 80% w/w). The use of dilute PBS in these steps can help prevent sample expansion [36].
- Incubate the sample in each solution for 4 to 8 hours (for smaller samples) or 12 hours (for higher concentrations and larger samples) with gentle shaking or rotation at room temperature [36].
- Final Clearing:
- Transfer the sample to the final fructose-glycerol clearing solution (e.g., a saturated fructose solution with glycerol) [3].
- Incubate for 24 to 48 hours with gentle agitation until the sample appears transparent.
- Mounting:
Application Notes and Troubleshooting
Integration in a Whole-Mount FISH Research Pipeline
Fructose-glycerol clearing has been successfully integrated into a complete workflow for 3D gene expression analysis. A representative pipeline is as follows [3]:
- Animal models: The protocol is effective for a wide range of specimens, from mouse embryonic limb buds [38] to octopus embryos [3].
- Staining: Perform multiplexed HCR v3.0 RNA-FISH, which allows for simultaneous detection of multiple mRNA targets. This can be combined with IHC for phosphorylated proteins or other epitopes [38] [3].
- Clearing: Apply the fructose-glycerol protocol as described.
- Imaging: Image the cleared samples using Light Sheet Fluorescence Microscopy (LSFM), confocal, or two-photon microscopy. LSFM is particularly suited for rapid imaging of large, transparent samples with minimal photobleaching [3].
Practical Considerations and Troubleshooting
- Signal Preservation: A key advantage of fructose-glycerol is its excellent preservation of fluorescent signals from HCR and many antibodies, enabling clear 3D reconstruction [3].
- Handling Opaque Tissues: For tissues with high pigmentation or autofluorescence, consider incorporating a photochemical bleaching step like OMAR (Oxidation-Mediated Autofluorescence Reduction) prior to hybridization. This treatment uses light and hydrogen peroxide to reduce autofluorescence, obviating the need for digital post-processing [38].
- Objective Lens Selection: The high refractive index (~1.49) of saturated fructose solutions like SeeDB can cause spherical aberration with standard objective lenses. For high-resolution deep imaging, use water-immersion or glycerol-immersion lenses, which have an RI closer to the clearing medium and perform significantly better than air lenses [36]. Always calibrate the axial scale if using an air or water-immersion lens, as the apparent depth will be shortened in the high-RI solution [36].
- Protocol Flexibility: The core fructose-glycerol method is adaptable. For example, the exact ratios of fructose to glycerol can be optimized, and the duration of each equilibration step can be extended for larger or denser tissues.
The study of gene expression patterns in three-dimensional (3D) space is crucial for understanding developmental biology, organogenesis, and disease progression. Whole-mount fluorescence in situ hybridization (FISH) enables researchers to visualize mRNA distribution within intact tissues and embryos, preserving spatial context lost in traditional sectioning methods. The integration of effective tissue clearing techniques, particularly fructose-glycerol methods, has revolutionized this field by rendering opaque specimens transparent while maintaining fluorescence signal integrity. This application note provides a comprehensive technical framework for selecting, optimizing, and implementing imaging solutions from conventional fluorescence microscopy to advanced light-sheet imaging for whole-mount FISH applications, with specific consideration for fructose-glycerol cleared samples.
Microscopy Platform Comparison
Selecting the appropriate microscopy platform requires careful consideration of performance parameters relative to research objectives. The table below summarizes key characteristics of conventional and light-sheet microscopy platforms for whole-mount FISH imaging.
Table 1: Comparative Performance of Microscopy Platforms for Whole-Mount FISH
| Microscopy Platform | Spatial Resolution | Imaging Speed | Photobleaching/ Phototoxicity | Optimal Sample Size | Compatibility with Fructose-Glycerol Clearing |
|---|---|---|---|---|---|
| Widefield Fluorescence | Moderate (200-300 nm laterally) | Moderate | High | Small embryos, thin tissues | Good |
| Laser Scanning Confocal | High (180-250 nm laterally) | Slow | Moderate | Small to medium specimens | Good |
| Light-Sheet Fluorescence Microscopy (LSFM) | High (similar to confocal) | Very fast | Low | Large specimens, whole embryos | Excellent |
Light-sheet fluorescence microscopy (LSFM) represents a transformative approach for 3D imaging of cleared specimens, using orthogonal illumination and detection pathways to create exceptionally clear images with minimal photodamage [39] [40]. The fundamental advantage of LSFM lies in its optical sectioning capability, where only the focal plane is illuminated, drastically reducing out-of-focus fluorescence and improving signal-to-noise ratio while minimizing photobleaching [40]. This makes LSFM particularly suitable for long-term imaging of dynamic processes and for large, cleared samples where traditional microscopy would suffer from significant signal degradation.
For fructose-glycerol cleared specimens, which maintain refractive index matching through aqueous solutions, LSFM enables rapid imaging of entire samples with cellular resolution. Studies on Octopus vulgaris embryos demonstrated that fructose-glycerol clearing preserved HCR FISH signals exceptionally well and was compatible with light-sheet imaging, revealing spatial organization not detectable with two-dimensional methods [3].
Experimental Protocol: Whole-Mount FISH with Fructose-Glycerol Clearing and Light-Sheet Imaging
Sample Preparation and Fixation
Begin with high-quality fixation to preserve tissue morphology and RNA integrity:
Fixation: Immerse samples in 4% paraformaldehyde (PFA) in phosphate-buffered saline (PBS) overnight at 4°C. For larger specimens (>5 mm), extend fixation to 24-48 hours with gentle agitation [3].
Permeabilization: Treat fixed tissues with proteinase K (10 μg/mL in PBS) for 15 minutes at room temperature. Optimization may be required for different tissue types [3].
Autofluorescence Reduction: Implement oxidation-mediated autofluorescence reduction (OMAR) using photochemical bleaching to suppress tissue autofluorescence, eliminating the need for digital post-processing [24].
Hybridization Chain Reaction (HCR) FISH
The HCR v3.0 system provides robust, sensitive mRNA detection with minimal background:
Probe Design: Design split-initiator probes (typically 25-33 probe pairs per target) using automated tools like Easy_HCR. Probes should target specific mRNA sequences with high specificity [3].
Hybridization: Prepare probe solution (0.4 pmol of each probe in 100 μL hybridization buffer) and incubate with samples overnight at 37°C [3].
Signal Amplification: Prepare hairpin amplifiers (3 pmol each H1 and H2 in amplification buffer) and incubate with samples overnight in the dark. Use fluorophores compatible with your microscope's laser lines (e.g., Alexa Fluor 488, 546, 647) [3].
Fructose-Glycerol Clearing
The fructose-glycerol method provides excellent refractive index matching while preserving fluorescence:
Gradual Clearing: Transfer samples through a graded series of fructose-glycerol solutions (20%, 40%, 60%, 80% w/v fructose in glycerol-PBS) with 2-4 hour incubations at each step [3].
Final Clearing: Incubate in 80% fructose-glycerol solution overnight at 4°C with gentle agitation.
Refractive Index Matching: The final solution should achieve a refractive index of approximately 1.45, effectively matching most biological tissues and maximizing transparency [3].
Light-Sheet Microscopy Imaging
Optimize LSFM parameters for cleared whole-mount FISH samples:
Sample Mounting: Embed samples in low-melting-point agarose or specialized hydrogels within the imaging chamber. Ensure proper orientation for optimal light-sheet penetration [40].
Light-Sheet Configuration: Use Gaussian or digitally scanned light-sheets with thickness optimized for your resolution requirements (typically 2-6 μm). Thinner sheets provide better axial resolution but have shorter confocal parameters [40].
Image Acquisition: Set appropriate exposure times (50-500 ms) and step sizes (0.5-3 μm) based on signal intensity and desired resolution. Use multi-view imaging with sample rotation to overcome shadowing artifacts [39].
Diagram 1: Comprehensive workflow for whole-mount FISH with fructose-glycerol clearing and light-sheet imaging
Research Reagent Solutions
Successful implementation of whole-mount FISH with fructose-glycerol clearing requires specific reagents optimized for 3D tissue preservation, hybridization, and clearing.
Table 2: Essential Research Reagents for Whole-Mount FISH with Fructose-Glycerol Clearing
| Reagent Category | Specific Products/Formulations | Function | Application Notes |
|---|---|---|---|
| Fixation | 4% Paraformaldehyde (PFA) in PBS | Preserves tissue morphology and RNA integrity | Optimize fixation time based on sample size |
| Permeabilization | Proteinase K (10 μg/mL) | Enhances probe penetration | Overtreatment can damage tissue structure |
| HCR Probes | Split-initiator DNA oligo pools | Target-specific mRNA detection | Design 25-33 probe pairs per target mRNA |
| Signal Amplification | Fluorophore-labeled hairpin amplifiers (HCR v3.0) | Signal enhancement | Overnight amplification maximizes sensitivity |
| Clearing Solution | 80% Fructose in glycerol-PBS | Refractive index matching (RI ≈ 1.45) | Preserves fluorescence better than organic solvents |
| Mounting Medium | Low-melting-point agarose | Sample stabilization during imaging | Compatible with aqueous clearing solutions |
Technical Considerations for Implementation
Optimizing Imaging Depth and Resolution
Achieving high-quality imaging in whole-mount specimens requires addressing several technical challenges:
Refractive Index Matching: Fructose-glycerol solutions effectively match the refractive index of biological tissues (approximately 1.45), significantly reducing light scattering and enabling deeper imaging [3]. The hydrophilic nature of this clearing method better preserves tissue structure compared to organic solvents and maintains compatibility with FISH probes and many antibodies.
Adaptive Imaging Schemes: Modern LSFM systems incorporate smart microscopy approaches that autonomously determine where, when, what, and how to image, overcoming traditional trade-offs between spatiotemporal resolution, field of view, and sample health [39].
Multi-View Fusion: Implement multi-view imaging with sample rotation to overcome optical obstructions and achieve homogeneous image quality throughout the specimen. Computational fusion of these multiple views creates a complete 3D representation without shadows or artifacts [39].
Troubleshooting Common Challenges
Several obstacles may arise when implementing whole-mount FISH with light-sheet imaging:
Insufficient Clearing: If samples remain opaque, ensure adequate incubation times in fructose-glycerol solutions and verify solution concentration. For highly pigmented or calcified tissues, consider incorporating additional depigmentation steps or specialized hydrogel-based methods like See-Star [22].
Weak FISH Signal: Optimize probe concentration and hybridization time. Increase amplification duration or check hairpin folding efficiency. Avoid over-fixation, which can reduce FISH signals by excessive cross-linking [4].
Sample Damage During Handling: For delicate cleared specimens, implement hydrogel embedding (e.g., 30% acrylamide) to provide structural support during processing and imaging [22].
Advanced Applications and Future Directions
The integration of whole-mount FISH with advanced light-sheet microscopy enables groundbreaking applications in biomedical research:
Developmental Biology: Track gene expression patterns in 3D throughout embryogenesis, revealing spatial organization not detectable with 2D methods [3]. Studies on octopus embryonic neurogenesis demonstrated the power of this approach for mapping brain development in non-model organisms [3].
Drug Discovery: Monitor drug distribution, pharmacokinetics, and efficacy at cellular resolution within intact tissues and embryos [41]. LSFM's minimal phototoxicity enables long-term imaging of drug effects during critical developmental phases.
Multimodal Imaging: Combine FISH with immunohistochemistry to simultaneously visualize mRNA and protein localization within the same sample [4] [3]. This approach revealed contrasting subcellular localizations of β-tubulin III mRNA (cell bodies) and protein (nerve fibers) in trigeminal ganglia [4].
High-Throughput Applications: Emerging "open top" light-sheet microscopes enable multi-modal imaging with high throughput, potentially revolutionizing screening applications [39]. When combined with AI-driven data analysis, these systems can automatically identify and quantify expression patterns in large sample sets.
Future developments in LSFM technology will likely focus on increasing imaging speed, improving spatial resolution, and enhancing compatibility with diverse sample types. Computational approaches, including machine learning-based image restoration, will further push the boundaries of what can be achieved with whole-mount FISH imaging [39].
Troubleshooting Common Challenges and Protocol Optimization Strategies
The integration of whole-mount fluorescence in situ hybridization (FISH) with optical clearing techniques represents a transformative approach for three-dimensional (3D) gene expression mapping in intact tissues. However, the critical challenge researchers face is the significant fluorescence signal loss during the clearing process, which can compromise data integrity and experimental outcomes. Signal attenuation arises from multiple factors including fluorophore quenching by clearing reagents, poor penetration of probes and antibodies, and light scattering within dense tissue matrices [4]. For scientists and drug development professionals working with complex 3D models such as organoids and tissue biopsies, preserving fluorescence while achieving sufficient transparency is essential for accurate quantitative analysis. This application note examines the principles of fluorescence preservation during clearing, provides quantitative comparisons of leading methods, and details optimized protocols specifically for whole-mount FISH with fructose-glycerol clearing, enabling reliable 3D imaging for preclinical and clinical research.
Principles of Fluorescence Preservation in Clearing Methods
Optical clearing techniques enhance light penetration by reducing tissue opacity through refractive index (RI) homogenization. The RI mismatch between different tissue components (primarily lipids and aqueous media) causes light scattering, limiting imaging depth and resolution [6] [42]. Clearing methods address this through two primary mechanisms: delipidation (removing scatterers) and RI matching (using solutions with RI similar to tissue components, typically ~1.45) [42].
The compatibility of clearing methods with fluorescence preservation varies significantly based on their chemical basis. Hydrophilic methods (e.g., fructose-glycerol, LIMPID) utilize aqueous solutions with high RI to reduce RI mismatches, generally providing better preservation of endogenous fluorescence and fluorescent protein signals [6] [4]. In contrast, hydrophobic methods (e.g., BABB, uDISCO) employ organic solvents that efficiently dehydrate tissues and dissolve lipids, but often quench fluorescent signals, particularly from fluorescent proteins like GFP [6] [43]. Hydrogel-based methods (e.g., CLARITY) preserve biomolecules within a hydrogel mesh but require lengthy processing and specialized equipment [44].
For whole-mount FISH applications, maintaining RNA integrity and fluorescence signal presents additional challenges. The clearing method must preserve target mRNA molecules while allowing efficient penetration of FISH probes and supporting signal amplification steps without introducing autofluorescence or background noise [4].
Figure 1: Decision Workflow for Fluorescence-Preserving Clearing Methods. This diagram outlines the critical factors influencing fluorescence preservation during clearing, highlighting hydrophilic methods as most suitable for FISH applications.
Quantitative Comparison of Clearing Methods
Selecting an appropriate clearing method requires balancing multiple parameters, including transparency efficiency, fluorescence preservation, structural integrity, and processing time. The table below provides a quantitative comparison of leading clearing methods relevant to whole-mount FISH applications.
Table 1: Quantitative Comparison of Optical Clearing Methods for Fluorescence Preservation
| Method | Type | RI | Processing Time | Fluorescence Preservation | Tissue Morphology | FISH Compatibility |
|---|---|---|---|---|---|---|
| Fructose-Glycerol [8] | Hydrophilic | ~1.45 | 2-24 hours | Good (endogenous fluorescence) | Minimal expansion | Excellent |
| LIMPID [4] [45] | Hydrophilic | 1.41-1.57 | 1-6 hours | Excellent (>60 days) | Minimal change | Excellent |
| FLUID [44] | Hydrophilic | Adjustable | 5-30 minutes | Excellent (lipophilic tracers) | Negligible distortion | Good |
| BABB [6] | Hydrophobic | ~1.55 | 6-24 hours | Moderate (quenches GFP) | Significant shrinkage | Limited |
| a-uDISCO [43] | Hydrophobic | ~1.56 | 2-5 days | Good (GFP with pH optimization) | 40-60% shrinkage | Moderate |
| CUBIC [44] | Aqueous (delipidating) | ~1.48 | 7-14 days | Good (endogenous fluorescence) | Tissue expansion | Moderate |
For whole-mount FISH applications, the hydrophilic methods (fructose-glycerol, LIMPID, FLUID) demonstrate superior performance in preserving RNA integrity and fluorescence signals while maintaining tissue architecture. The BABB method, despite providing excellent transparency for cardiovascular tissues and preserving fluorescent signals after extended storage [6], may not be ideal for FISH due to potential RNA degradation and fluorescence quenching.
The recently developed FLUID method offers exceptional processing speed (minutes instead of hours or days) while preserving both fluorescence and lipid components, making it particularly valuable for clinical applications where rapid turnaround is essential [44]. The LIMPID method stands out for its long-term fluorescence preservation, maintaining signals for over 60 days, which is crucial for repeated imaging of archived samples [4].
Table 2: Performance Metrics of Clearing Methods for Specific Applications
| Method | Transparency Efficiency | Signal-to-Noise Ratio | Implementation Complexity | Best Applications |
|---|---|---|---|---|
| Fructose-Glycerol | Moderate (varies by tissue) | High (low background) | Low (simple immersion) | Pancreatic organoids, clinical biopsies [8] |
| LIMPID | High (depth >500 μm) | Very High | Moderate | Whole-mount FISH, multiplexed imaging [4] |
| FLUID | High (rapid clearing) | High | Low | Human brain tissue, lipid research [44] |
| BABB | Very High | Moderate (autofluorescence) | Moderate | Cardiovascular tissue, SHG imaging [6] |
| a-uDISCO | Very High | High (with pH optimization) | High | Whole-brain imaging, neuronal circuits [43] |
Optimized Protocol: Whole-Mount FISH with Fructose-Glycerol Clearing
Reagent Preparation
Table 3: Research Reagent Solutions for Fructose-Glycerol FISH
| Reagent | Composition | Function | Storage |
|---|---|---|---|
| Fructose-Glycerol Clearing Solution | 20-40% fructose, 10-20% glycerol in PBS | Refractive index matching, tissue transparency | 4°C, protected from light |
| Hybridization Buffer | 4× SSC, 50% formamide, 10% dextran sulfate | Facilitates FISH probe binding | -20°C in aliquots |
| Wash Buffer | 2× SSC, 50% formamide | Removes unbound probes, reduces background | Room temperature |
| Amplification Buffer | HCR components in SSC buffer | Signal amplification for detection | -20°C, protected from light |
| Blocking Buffer | 10% normal serum, 1% BSA, 0.1% Triton X-100 in PBS | Reduces non-specific antibody binding | 4°C for short-term |
Step-by-Step Protocol
Phase 1: Sample Preparation and Fixation
- Tissue Collection: Excise fresh tissue samples (≤5 mm thickness for optimal clearing) and immediately place in ice-cold PBS. For organoids embedded in ECM gels, maintain matrix integrity to preserve morphology [8].
- Fixation: Immerse samples in 4% paraformaldehyde (PFA) in 0.01 M PBS at 4°C overnight. Critical: Avoid over-fixation (>24 hours) as it reduces FISH signals by excessive cross-linking [4].
- Permeabilization: Treat samples with proteinase K (1-10 μg/mL depending on tissue density) for 15-30 minutes at room temperature to enhance probe accessibility.
- Washing: Rinse samples 3× with PBS-glycine buffer (100 mM glycine in PBS) to quench residual PFA.
Phase 2: Whole-Mount FISH
- Pre-hybridization: Equilibrate samples in hybridization buffer without probes for 30 minutes at 37°C.
- Probe Hybridization: Incubate with FISH probes (0.5-1 μM) in hybridization buffer at 37°C for 16-48 hours with gentle agitation. For difficult tissues, add 10% dextran sulfate to enhance probe penetration [4].
- Post-hybridization Washes:
- Wash 2× with wash buffer at 37°C for 30 minutes each
- Wash 1× with 1× SSC at room temperature for 15 minutes
- Wash 1× with PBS at room temperature for 15 minutes
- Signal Amplification (if using HCR):
- Incubate with HCR hairpins in amplification buffer for 2-6 hours at room temperature
- For single-molecule detection, limit amplification to 2 hours [4]
Phase 3: Fructose-Glycerol Clearing
- Equilibration: Gradually introduce clearing solution through a stepped series:
- 10% fructose/5% glycerol in PBS: 1 hour
- 20% fructose/10% glycerol in PBS: 2 hours
- 30% fructose/15% glycerol in PBS: 4 hours
- 40% fructose/20% glycerol in PBS: Overnight
- Clearing: Transfer samples to fresh fructose-glycerol clearing solution (40% fructose, 20% glycerol) and incubate until transparent (typically 6-24 hours depending on tissue density).
- Mounting: Mount cleared samples in fructose-glycerol solution between two coverslips separated by a 0.5-1.0 mm spacer. Seal with nail polish or VALAP.
Phase 4: Imaging and Analysis
- Microscopy: Image using confocal, light-sheet, or two-photon microscopy systems.
- Optimization: Adjust the refractive index of the clearing solution to match your objective lens (RI ~1.45 for fructose-glycerol) to minimize spherical aberrations.
- Quantification: Use computational tools like TDAExplore for quantitative analysis of fluorescence distribution and intensity [46].
Troubleshooting Guide
Table 4: Troubleshooting Common Issues in Fluorescence Preservation During Clearing
| Problem | Potential Causes | Solutions |
|---|---|---|
| Poor FISH signal | RNA degradation, insufficient probe penetration, over-fixation | Use RNAse-free techniques; optimize permeabilization; reduce fixation time [4] |
| High background | Inadequate washing, non-specific probe binding | Increase formamide concentration; optimize salt conditions; include dextran sulfate |
| Incomplete clearing | Insufficient clearing time, inappropriate tissue size | Increase clearing time; reduce tissue thickness to <5 mm; use graded series |
| Fluorescence quenching | Chemical incompatibility, pH mismatch, oxidation | Test fluorophore compatibility; adjust pH to 7.5-8.5; include antioxidants |
| Tissue deformation | Osmotic shock, too rapid dehydration | Use graded series; optimize solution osmolarity; include tissue stabilizers |
Advanced Applications and Future Directions
The combination of whole-mount FISH with fructose-glycerol clearing enables diverse research applications from developmental biology to clinical diagnostics. In cancer research, this approach allows 3D mapping of gene expression patterns in intact tumor organoids, providing insights into tumor heterogeneity and drug resistance mechanisms [42]. For neuroscience, researchers can visualize mRNA distribution throughout entire neural circuits in cleared brain tissues, revealing spatial organization of gene expression at single-cell resolution [4].
Emerging innovations in clearing technology continue to enhance fluorescence preservation capabilities. The development of pH-adjusted clearing methods like a-uDISCO (alkaline pH-based uDISCO) demonstrates that modifying the chemical environment can significantly improve GFP fluorescence preservation without compromising transparency [43]. Similarly, lipid-preserving methods like FLUID and LIMPID open new possibilities for studying lipid-associated biological processes and using lipophilic tracers in cleared tissues [44] [4].
For clinical applications, clearing methods compatible with human tissue biopsies enable 3D pathological analysis that could transform diagnostic accuracy. The ability to image entire biopsy specimens at cellular resolution rather than relying on thin sections reduces sampling error and provides more comprehensive information about tissue architecture and disease distribution [42]. As these technologies mature, we anticipate increased integration of 3D cleared tissue imaging in both preclinical drug development and clinical diagnostic settings.
Within the context of a broader thesis on whole-mount fluorescence in situ hybridization (FISH) combined with fructose-glycerol clearing, the permeabilization step emerges as a critical determinant of experimental success. This protocol focuses on achieving the delicate balance between providing sufficient access for nucleic acid probes while preserving the structural integrity of the tissue sample. Whole-mount FISH enables three-dimensional gene expression mapping in intact tissues, but its effectiveness is often limited by the inability of probes to penetrate deep into the tissue without causing morphological damage. The fructose-glycerol clearing method, noted for its compatibility with lipophilic dyes and ability to preserve fluorescence, relies heavily on optimized permeabilization to achieve clear, interpretable results [8] [47]. This application note provides a detailed, optimized protocol for permeabilization in whole-mount FISH procedures, incorporating quantitative data and step-by-step methodologies to guide researchers and drug development professionals in implementing this critical technique.
Key Optimization Parameters and Quantitative Data
The optimization of permeabilization involves balancing multiple, often competing, factors. The table below summarizes the key parameters, their impact on probe access and tissue integrity, and optimal ranges based on empirical data.
Table 1: Key Parameters for Optimizing Permeabilization in Whole-Mount FISH
| Parameter | Impact on Probe Access | Impact on Tissue Integrity | Optimal Range / Condition | Supporting Evidence |
|---|---|---|---|---|
| Detergent Type & Concentration | Increases membrane porosity; facilitates probe entry. | High concentrations can disrupt lipid ultrastructure and cause protein loss. | Low concentration Triton X-100 (0.1-0.5%) or minimal detergent formulations. [48] [49] | ScaleS uses Triton X-100 (0.1-0.2%) for mild permeabilization. [48] |
| Urea Concentration | Acts as a hyperhydration agent; denatures proteins to reduce scattering and improve diffusion. | High concentrations (>8 M) can cause significant tissue deformation and swelling. [50] | 4-8 M; effective penetration with controlled deformation. [50] [4] | OptiMuS uses 4 M urea for rapid clearing with negligible shrinkage (0.93%). [50] |
| Formamide Concentration | Acts as a denaturant; can influence hybridization stringency and signal intensity. [4] | Over-fixation can reduce FISH signals, potentially requiring protease treatment. [4] | Varies with probe design; requires empirical screening (e.g., 0-50%). [51] | Protocol optimization identified optimal formamide ranges for different probe target lengths. [51] |
| Permeabilization Duration | Longer duration increases probe penetration depth. | Extended exposure to detergents/denaturants increases risk of morphological damage. | Tissue-dependent; must be empirically determined (hours to days). [51] | MERFISH encoding probe hybridization was optimized at 37°C for 1 day. [51] |
| Fixation Method | Cross-linking density directly impacts the permeability of the tissue matrix. | Under-fixation leads to loss of structural integrity; over-fixation hinders probe access. [4] | PLP fixation can improve diffusion in challenging tissues like human brain. [47] | PLP fixation substantially facilitated DiI diffusion in human post-mortem tissue. [47] |
The following diagram illustrates the core concept and key trade-offs in the permeabilization optimization process:
Optimized Whole-Mount FISH Protocol with Fructose-Glycerol Clearing
This protocol integrates an optimized permeabilization and hybridization workflow with a fructose-glycerol clearing solution, suitable for a variety of tissues and organoids. [8]
Materials and Reagent Solutions
Table 2: Research Reagent Solutions for Whole-Mount FISH
| Reagent / Solution | Composition / Specification | Function in Protocol |
|---|---|---|
| Fixative | 4% Paraformaldehyde (PFA) in 0.1 M PBS, pH 7.4. Alternative: PLP fixative for difficult tissues. [47] | Preserves tissue architecture and immobilizes nucleic acids. |
| Permeabilization Buffer | PBS with 0.5% Triton X-100. Alternative: 0.2% Saponin in PBS. [8] [49] | Solubilizes lipid membranes to enable probe entry. |
| Prehybridization Buffer | Saline-sodium citrate (SSC) buffer with formamide (concentration optimized for probe set). [51] [4] | Equilibrates tissue and establishes correct stringency for hybridization. |
| Hybridization Buffer | SSC buffer, formamide, dextran sulfate, Denhardt's solution, and yeast tRNA. | Creates an environment conducive to specific probe-target binding. |
| FISH Probes | Labeled DNA or RNA probes. HCR probes are recommended for high signal-to-noise and quantifiable data. [4] | Target and bind to specific mRNA sequences for detection. |
| Fructose-Glycerol Clearing Solution | A hyperhydration-based aqueous solution containing fructose and glycerol. [8] [47] | Reduces light scattering by refractive index matching, enabling deep-tissue imaging. |
| Wash Buffer | Saline-sodium citrate (SSC) buffer with Tween-20. [8] | Removes unbound and non-specifically bound probes to reduce background. |
Step-by-Step Workflow Protocol
The entire procedure, from sample preparation to imaging, is visualized in the following workflow:
Sample Fixation
- Procedure: Immerse freshly dissected tissue or organoids in 4% PFA at 4°C for 6-24 hours, depending on sample size and density. For tissues with high lipid content or challenging penetration (e.g., adult human brain), consider using Periodate-Lysine-Paraformaldehyde (PLP) fixative for 2-7 days. [47]
- Critical Step: Avoid over-fixation, as it can reduce FISH signals by excessive cross-linking. [4]
Permeabilization
- Procedure: Wash fixed samples 3 x 20 minutes in PBS. Incubate samples in Permeabilization Buffer (PBS with 0.5% Triton X-100) for 12-48 hours at room temperature with gentle agitation. The duration must be determined empirically for each tissue type.
- Optimization Note: For delicate samples or when preserving lipophilic structures is crucial, a milder detergent like saponin (0.2%) or a detergent-free hyperhydration method using 4-8 M urea can be used. [49] [50]
Prehybridization and Probe Hybridization
- Procedure: Equilibrate samples in Prehybridization Buffer for 1-2 hours at the hybridization temperature. Replace the buffer with Hybridization Buffer containing the FISH probes (e.g., HCR initiator probes). Hybridize for 12-48 hours at the appropriate temperature in a dark, humidified chamber.
- Probe Design: For smFISH-based methods like MERFISH, encoding probes with target regions of 30-50 nt have shown weak dependence on formamide concentration, providing a robust performance window. [51]
Post-Hybridization Washes and Signal Amplification
- Procedure: Wash the sample stringently 3-5 times with Wash Buffer at the hybridization temperature to remove excess probe. If using HCR, incubate with the appropriate fluorescent hairpin amplifiers for 2-12 hours at room temperature. [4]
- Note: Limiting HCR amplification time to 2 hours allows for single-molecule resolution, visualizing each RNA as a distinct fluorescent dot. [4]
Oxidation-Mediated Autofluorescence Reduction (Optional but Recommended)
- Procedure: To suppress tissue autofluorescence without digital post-processing, treat samples with a photochemical bleaching step, such as Oxidation-Mediated Autofluorescence Reduction (OMAR), prior to clearing. [24]
Optical Clearing with Fructose-Glycerol Solution
- Procedure: Immerse the stained sample in the fructose-glycerol clearing solution. Incubate at room temperature or 37°C with gentle agitation until the sample is transparent. Clearing times range from several hours for spheroids and small organoids to days for larger tissue samples. [8] [47]
- Mechanism: This aqueous-based solution homogenizes the refractive index within the tissue, reducing light scattering and enabling deep imaging while preserving fluorescent signals and lipid structures. [47] [49]
Mounting and 3D Imaging
- Procedure: Mount the cleared sample in the same fructose-glycerol solution for imaging. Perform 3D image acquisition using confocal or light-sheet fluorescence microscopy.
Achieving optimal permeabilization is a foundational step in whole-mount FISH that requires careful calibration of multiple chemical and temporal factors. The integrated protocol presented here, which combines empirical optimization data with a fructose-glycerol clearing workflow, provides a robust framework for researchers to maximize probe accessibility while safeguarding the ultrastructural details of their samples. This balance is essential for generating high-quality, quantifiable data in 3D spatial transcriptomics, ultimately advancing research in drug development and fundamental biology.
Addressing Autofluorescence and Background Noise Reduction Techniques
Autofluorescence and background noise represent significant challenges in fluorescence in situ hybridization (FISH), particularly in complex tissue environments and whole-mount samples. These interfering signals can obscure specific fluorescence signals, compromising data interpretation and reliability. Within the specific context of whole-mount FISH combined with fructose-glycerol clearing—a method gaining traction for its ability to preserve fluorescent signals while enabling three-dimensional imaging—addressing autofluorescence is paramount. This application note details validated techniques to suppress autofluorescence, thereby enhancing the signal-to-noise ratio and the overall quality of FISH data in research aimed at drug development and molecular diagnostics.
Key Technical Approaches and Quantitative Comparison
Several methods have been developed to mitigate autofluorescence, ranging from enzymatic treatments to photochemical bleaching and optimized clearing. The table below summarizes the core techniques, their mechanisms, and their performance outcomes as reported in recent studies.
Table 1: Comparison of Autofluorescence Reduction Techniques for FISH Applications
| Technique | Underlying Mechanism | Sample Type / Application | Key Performance Outcome | Reference |
|---|---|---|---|---|
| Elastase Pretreatment | Enzymatic digestion of autofluorescent elements in tissue [52] [53]. | ALK FISH on NSCLC lung tissue sections [52] [53]. | Reduced retest rate from 86.7% to 0%; enabled detection of 2 additional ALK+ cases [52] [53]. | |
| OMAR (Oxidation-Mediated Autofluorescence Reduction) | Photochemical bleaching using light and oxidizers to quench autofluorescent molecules [24]. | Whole-mount RNA-FISH on mouse embryonic limb buds [24]. | Eliminated need for digital post-processing; suitable for whole-mount RNA-FISH and immunofluorescence [24]. | |
| Fructose-Glycerol Clearing | Aqueous-based refractive index matching that preserves signal and tissue integrity [3]. | Whole-mount multiplexed HCR v3.0 on Octopus vulgaris embryos [3]. | Optimal for preserving HCR v3.0 signal; enabled 3D LSFM imaging; compatible with IHC [3]. | |
| 3D-LIMPID | Lipid-preserving refractive index matching with a single-step aqueous solution [4]. | Whole-mount RNA FISH on adult mouse brain and quail embryos [4]. | Enabled high-resolution confocal imaging up to 250 μm depth; compatible with antibody co-labeling [4]. | |
| Standard Pepsin Pretreatment | Enzymatic digestion of proteins for antigen retrieval [52]. | ALK FISH on NSCLC lung tissue sections (Control) [52]. | 86.7% retest rate due to persistent autofluorescence interfering with interpretation [52]. |
Detailed Experimental Protocols
Elastase-Based Pretreatment for Autofluorescence Reduction in Tissue Sections
This protocol, optimized for ALK FISH in lung cancer samples, effectively reduces tissue autofluorescence [52] [53].
- Materials: Non-small cell lung cancer (NSCLC) tissue sections, Elastase (optimized concentration), ALK break-apart FISH probes, Standard hybridization and wash buffers.
- Methodology:
- Sample Preparation: Deparaffinize and rehydrate formalin-fixed, paraffin-embedded (FFPE) tissue sections according to standard protocols.
- Enzymatic Pretreatment: Apply the optimized elastase solution to the tissue sections and incubate at 37°C. The concentration and incubation time must be determined empirically for each tissue type and fixation condition to preserve nuclear morphology while reducing background [52] [54].
- Enzyme Inactivation: Rinse slides thoroughly to remove the enzyme.
- FISH Assay: Proceed with standard FISH denaturation, hybridization, and stringency washes. Using freshly prepared wash buffers is critical for minimizing background [54].
- Technical Notes: This method was directly compared against collagenase types I, II, IV, and pepsin, with elastase proving superior for autofluorescence reduction and nuclear integrity preservation [52]. Always include a negative control (no probe) and a positive control to validate the assay stringency.
Whole-Mount RNA-FISH with Fructose-Glycerol Clearing
This combined protocol is designed for 3D gene expression mapping in embryonic tissues, as demonstrated in Octopus vulgaris [3].
- Materials: Fixed whole-mount embryos, HCR v3.0 probe sets and amplifiers, Fructose-Glycerol clearing solution, Light Sheet Fluorescence Microscope (LSFM).
- Methodology:
- Fixation and Permeabilization: Fix embryos in 4% PFA overnight. Manually dechorionate and dehydrate through a graded methanol series. Rehydrate and permeabilize with Proteinase K (e.g., 10 μg/ml for 15 minutes at room temperature) [3].
- Hybridization Chain Reaction (HCR v3.0)
- Hybridization: Incubate embryos in a solution containing gene-specific probe sets (0.4 pmol per 100 µl probe hybridization buffer) overnight [3].
- Amplification: Wash off excess probes. Snap-cool hairpin amplifiers and add them to the amplification buffer. Incubate overnight in the dark to allow for signal amplification [3].
- Fructose-Glycerol Clearing
- After final washes, clear the embryos by immersing them in a fructose-glycerol solution. This aqueous-based clearing method was found to be optimal for preserving the HCR v3.0 fluorescent signal while rendering the tissue transparent for deep imaging [3].
- Imaging: Mount the cleared samples and image using LSFM or confocal microscopy for 3D reconstruction [3].
- Technical Notes: This protocol is compatible with immunohistochemistry (IHC), allowing for simultaneous detection of mRNA and protein. The workflow includes stop points where samples can be stored cold after key steps like delipidation or amplification [4] [3].
The Scientist's Toolkit: Research Reagent Solutions
Table 2: Essential Reagents and Kits for Autofluorescence Reduction and FISH
| Item / Reagent | Function / Application | Specific Example / Note |
|---|---|---|
| Elastase | Enzymatic reduction of background autofluorescence in tissue sections. | Identified as the most effective enzyme for lung tissue; improves FISH clarity [52] [53]. |
| HCR v3.0 System | Sensitive and multiplexable RNA detection in whole-mount samples. | Allows low-cost, custom probe design; compatible with clearing protocols [4] [3]. |
| Fructose-Glycerol Solution | Aqueous optical clearing agent for 3D imaging. | Preserves fluorescent signals from HCR and antibodies; ideal for LSFM [3]. |
| CytoCell LPS 100 Tissue Pretreatment Kit | Standardized pre-treatment for FFPE tissue sections. | Optimized for reducing background in clinical FISH assays [54]. |
| OMAR Reagents | Chemical bleaching for suppressing intrinsic tissue autofluorescence. | Used in whole-mount RNA-FISH protocols for mouse embryos [24]. |
Workflow and Pathway Diagrams
The following diagram illustrates the integrated experimental workflow for whole-mount FISH, incorporating key steps for autofluorescence reduction and clearing:
Diagram 1: Whole-mount FISH workflow with autofluorescence reduction.
In the field of three-dimensional (3D) biological imaging, whole-mount fluorescence in situ hybridization (FISH) combined with optical tissue clearing has revolutionized our ability to visualize gene expression and tissue architecture at a system level. Fructose-glycerol clearing has emerged as a particularly valuable method for its ability to render tissues transparent while effectively preserving fluorescent signals from FISH and immunohistochemistry [3]. However, the presence of endogenous pigments and calcified tissues presents a significant challenge, as these components can obstruct light penetration, cause unwanted autofluorescence, and impede the diffusion of molecular probes, thereby compromising image quality and data interpretation.
This Application Note provides detailed protocols for managing pigmented and calcified tissues within the context of whole-mount FISH research using fructose-glycerol clearing. We present optimized bleaching and decalcification approaches that maintain tissue integrity and molecular information while enabling high-quality 3D imaging of challenging biological specimens.
Background and Principles
The Impact of Tissue Opacity on 3D Imaging
Biological tissues are naturally opaque due to light scattering and absorption caused by heterogeneous refractive indices among tissue components and the presence of light-absorbing substances [55]. This opacity is particularly problematic for 3D imaging techniques such as light-sheet and confocal microscopy, as it limits penetration depth and resolution. Tissue clearing methods address this issue by homogenizing the refractive index throughout the tissue, but endogenous pigments and calcified areas present additional challenges that require specialized pretreatment [42].
Pigments such as melanin and heme strongly absorb light and can generate autofluorescence that interferes with signal detection, while calcified regions create physical barriers that block probe penetration and cause severe light scattering. Effective management of these components is therefore essential for successful whole-mount FISH experiments, particularly when working with mineralized tissues or heavily pigmented specimens [3].
Fructose-Glycerol Clearing in Whole-Mount FISH
Fructose-glycerol clearing represents a hydrophilic, aqueous-based approach that achieves tissue transparency through refractive index matching while preserving fluorescent signals and tissue architecture [3]. This method has demonstrated excellent compatibility with hybridization chain reaction (HCR) v3.0, a sensitive and multiplexed whole-mount RNA detection technique, enabling detailed 3D visualization of gene expression patterns in complex tissues [3]. The method's effectiveness has been established even in challenging pigmented specimens such as Octopus vulgaris embryos, where it successfully cleared eye pigmentation while maintaining signal integrity throughout the imaging process [3].
Table 1: Comparison of Tissue Clearing Methods Compatible with Whole-Mount FISH
| Clearing Method | Chemical Basis | Compatibility with FISH | Impact on Tissue Size | Processing Time | Key Advantages |
|---|---|---|---|---|---|
| Fructose-Glycerol | Aqueous solution | Excellent [3] | Minimal change [3] | Days [3] | Preserves fluorescence, simple implementation |
| BABB | Organic solvent | Limited [6] | Significant shrinkage [6] | Hours [6] | Rapid clearing, high transparency |
| CLARITY | Hydrogel embedding | Moderate [42] | Variable [42] | Weeks [42] | Excellent structural preservation |
| LIMPID | Aqueous solution | Good [4] | Minimal change [4] | Days [4] | Lipid-preserving, compatible with lipophilic dyes |
Methodological Approaches
Bleaching Strategies for Pigmented Tissues
Chemical Bleaching with Hydrogen Peroxide
The following protocol has been optimized for bleaching pigmented tissues prior to whole-mount FISH with fructose-glycerol clearing:
Fixation and Pre-treatment: Fix tissues appropriately for your specimen (e.g., 4% PFA overnight for octopus embryos [3]). For heavily pigmented tissues, consider partial dissection or micro-injection of bleaching agents to enhance penetration.
Bleaching Solution Preparation: Prepare a solution of 3-5% hydrogen peroxide (H₂O₂) in phosphate-buffered saline (PBS) or the appropriate buffer for your tissue type. Higher concentrations may be required for deeply pigmented tissues but should be optimized to prevent RNA degradation.
Bleaching Incubation: Immerse fixed tissues in the bleaching solution and incubate at 4°C in the dark for 24-72 hours, with gentle agitation. Monitor bleaching progress visually, refreshing the solution every 24 hours if necessary.
Post-bleaching Processing: Thoroughly rinse tissues with PBS-DEPC or the appropriate buffer for your FISH protocol [3]. Proceed with standard whole-mount FISH procedures, followed by fructose-glycerol clearing.
This approach has been successfully applied to stage XV Octopus vulgaris embryos, which possess prominent eye pigmentation that was effectively cleared while preserving mRNA targets for neural markers [3].
Oxidation-Mediated Autofluorescence Reduction
For tissues where autofluorescence rather than visible pigmentation is the primary concern, the Oxidation-Mediated Autofluorescence Reduction (OMAR) protocol provides an effective alternative:
Fixation: Fix tissues in 4% PFA as standard.
OMAR Solution: Prepare a bleaching solution containing 4% potassium hexafluorophosphate and 4% hydrogen peroxide in PBS.
Treatment: Incubate tissues in the OMAR solution for 4-7 days at room temperature with gentle agitation.
Washing: Rinse thoroughly with PBS before proceeding with FISH protocols [24].
This method achieves maximal suppression of autofluorescence without the need for digital post-processing, making it particularly valuable for quantitative imaging applications [24].
Table 2: Comparison of Bleaching Methods for Pigmented Tissues
| Method | Chemicals Used | Incubation Time | Temperature | Key Applications | Effect on RNA Integrity |
|---|---|---|---|---|---|
| Standard Chemical Bleaching | 3-5% H₂O₂ | 24-72 hours | 4°C | Heavily pigmented tissues [3] | Minimal with optimization |
| OMAR Protocol | 4% KPF₆ + 4% H₂O₂ | 4-7 days | Room temperature | Autofluorescence reduction [24] | Preserved with proper fixation |
| Photochemical Bleaching | Light exposure in H₂O₂ | Variable | Room temperature | Mouse embryonic limb buds [24] | Maintains RNA quality |
Decalcification Methods for Calcified Tissues
Calcified tissues present a unique challenge for whole-mount FISH due to their mineral content, which impedes probe penetration and light transmission. While specific decalcification protocols compatible with fructose-glycerol clearing are not extensively documented in the literature, general principles can be adapted from histology practice:
Fixation Prior to Decalcification: Always fix tissues thoroughly before decalcification to preserve RNA integrity and tissue morphology.
Acid-Based Decalcification: Use weak acid solutions such as 5-10% formic acid or 5% trichloroacetic acid. Ethylenediaminetetraacetic acid (EDTA) at concentrations of 10-15% provides a gentler, though slower, alternative that better preserves RNA for FISH applications.
Determining Decalcification Endpoint: Monitor decalcification progress through physical testing (needle penetration) or chemical methods (ammonium oxalate precipitation test). The duration ranges from hours to weeks depending on tissue size and mineral content.
Neutralization and Washing: Thoroughly rinse decalcified tissues with neutral buffer solutions to remove residual acid before proceeding with FISH protocols.
While decalcification is commonly applied to musculoskeletal tissues and teeth, cardiovascular tissues may also contain calcified regions that require similar treatment, particularly in pathological conditions [6].
Integrated Workflow for Whole-Mount FISH with Problematic Tissues
The following workflow diagram illustrates the integrated process for managing pigmented and calcified tissues in whole-mount FISH studies:
Integrated Workflow for Managing Challenging Tissues
The Scientist's Toolkit: Essential Reagents and Materials
Table 3: Essential Research Reagent Solutions for Managing Pigmented and Calcified Tissues
| Reagent/Category | Specific Examples | Function/Application | Considerations for Whole-Mount FISH |
|---|---|---|---|
| Bleaching Agents | Hydrogen peroxide (H₂O₂) [3] | Reduces pigmentation and autofluorescence | Use at 3-5% concentration; optimize exposure to preserve RNA |
| Decalcifying Agents | EDTA, formic acid, trichloroacetic acid | Removes mineral content from calcified tissues | EDTA is gentler and better for RNA preservation despite slower action |
| Clearing Solutions | Fructose-glycerol [3] | Refractive index matching for tissue transparency | Excellent FISH compatibility; minimal tissue deformation |
| Fixatives | Paraformaldehyde (PFA) [3] | Preserves tissue architecture and RNA | Standard 4% concentration; avoid over-fixation |
| Permeabilization Agents | Proteinase K [3] | Enhances probe penetration | Titrate concentration and time to balance access vs. morphology |
| HCR Components | HCR v3.0 initiator probes, amplifiers [3] | Signal amplification for RNA detection | Enables multiplexing; provides linear signal quantification |
| Mounting Media | Fructose-glycerol solution [3] | Refractive index matching for imaging | Serves as both clearing agent and mounting medium |
Troubleshooting and Optimization
Addressing Common Challenges
Incomplete Bleaching: For persistently pigmented tissues after standard H₂O₂ treatment, consider:
- Increasing reagent concentration gradually (up to 10% H₂O₂)
- Enhancing penetration through mild detergent addition (0.1-0.3% Triton X-100)
- Combining chemical bleaching with photobleaching approaches [24]
RNA Degradation During Decalcification:
- Use EDTA-based decalcification instead of strong acids
- Include RNase inhibitors in decalcification solutions
- Limit decalcification time to the minimum required
- Validate RNA integrity through control experiments
Impaired FISH Signal in Treated Tissues:
- Optimize permeabilization after decalcification (e.g., proteinase K treatment [3])
- Increase probe concentration and hybridization time
- Validate signal preservation with known positive controls
Quality Assessment Metrics
Implement the following quality control checks throughout the protocol:
- Pre-clearing Transparency: Visually assess tissue transparency after bleaching/decalcification and after clearing
- Signal-to-Noise Ratio: Quantitatively measure SNR at increasing depths to assess clearing efficacy [50]
- Autofluorescence Levels: Compare untreated and treated samples using control channels without specific probes
- Morphological Integrity: Assess tissue structure preservation through nuclear staining and structural markers
Effective management of pigmented and calcified tissues is essential for successful whole-mount FISH studies employing fructose-glycerol clearing. The specialized bleaching and decalcification approaches outlined in this Application Note provide researchers with robust methodologies to overcome these common obstacles. By implementing these optimized protocols, scientists can extend the application of whole-mount FISH to previously challenging tissue types, enabling comprehensive 3D gene expression analysis across diverse biological systems.
The integration of these pretreatment strategies with the excellent signal preservation and transparency achieved through fructose-glycerol clearing creates a powerful pipeline for advancing spatial transcriptomics in complex tissues, with significant implications for both basic research and drug development applications.
Maintaining native tissue structure by preventing shrinking or swelling is a critical requirement for reliable 3D imaging and analysis in whole-mount investigations. This application note provides a structured overview of methods and detailed protocols to achieve superior tissue preservation, specifically contextualized for whole-mount FISH research utilizing fructose-glycerol clearing.
Quantitative Comparison of Tissue Clearing Methods
The choice of optical clearing method directly impacts tissue integrity. The following table summarizes the effects of various aqueous-based methods on tissue size and transparency, key indicators of structural preservation [50].
| Clearing Method | Key Chemical Components | Reported Size Change | Transparency Performance | Compatibility with FISH/Lipidic Dyes |
|---|---|---|---|---|
| OptiMuS [50] | Urea, Iohexol, D-Sorbitol | 0.93% shrinkage (1mm thick rat brain) | High (~75%) | Yes |
| BABB [6] | Benzyl Alcohol, Benzyl Benzoate | Significant shrinkage common with solvent-based methods | High | Poor (quenches fluorescence, dissolves lipids) |
| Glycerol [6] | Glycerol | Moderate swelling possible | Relatively lower | Yes |
| Fructose-Glycerol [8] | Fructose, Glycerol | Not specified in results; aqueous-based methods generally show good size retention | Sufficient for whole-mount organoid imaging | Yes (Used in whole-mount protocols) |
| CUBIC [50] | Urea, Amines | Significant expansion | Moderate | Limited (lipid-removing) |
| ScaleS [50] | Urea, Glycerol | Significant shrinkage | Moderate | Limited (lipid-removing) |
| MACS [50] | m-Xylylenediamine (MXDA), Sorbitol | Significant expansion | Moderate | Yes |
Experimental Protocols for Structure Preservation
Protocol 1: Whole-Mount Immunofluorescence Staining with Fructose-Glycerol Clearing
This protocol, adapted for whole-mount FISH compatibility, outlines steps for preparing and clearing ECM gel-embedded samples like pancreatic organoids, focusing on maintaining morphology [8].
Graphical Workflow: Sample Processing and Clearing
Materials & Reagents:
- PBS-Glycine Buffer: Quenches autofluorescence from residual fixative.
- IF-Wash Buffer: Used for washing steps to reduce non-specific background.
- Fructose-Glycerol Clearing Solution: An aqueous-based solution that reduces light scattering by refractive index (RI) matching, thereby preserving fluorescent signals and minimizing structural damage [8].
Procedure:
- Sample Fixation: Fix dissected samples overnight in 4% Paraformaldehyde (PFA) at 4°C.
- Blocking: Incubate samples in an appropriate blocking buffer to prevent non-specific binding of probes or antibodies.
- FISH/Immunostaining: Perform the whole-mount FISH procedure or incubate with primary and secondary antibodies.
- Washing: Thoroughly wash samples with IF-wash buffer after each staining and incubation step.
- Clearing: Mount the samples using the fructose-glycerol clearing solution to achieve transparency [8].
Protocol 2: SHIELD Enhanced Tissue Preservation
For experiments requiring harsh conditions or multiple rounds of staining, SHIELD (Stabilization under Harsh conditions via Intramolecular Epoxide Linkages to prevent Degradation) offers superior preservation. This hydrogel-based method cross-links biomolecules to maintain tissue architecture, endogenous fluorescence, and nucleic acids for FISH [56].
Graphical Workflow: SHIELD Preservation Process
Materials & Reagents:
- SHIELD Epoxy Solution: Polyfunctional epoxides that form intra- and intermolecular cross-linkages.
- SHIELD Buffer Solution.
- SHIELD ON Solution: Ready-to-use solution that activates the stabilization process.
Procedure:
- Initial Fixation: Perform standard perfusion and post-fixation with 4% PFA.
- SHIELD OFF Incubation: Incubate dissected samples in a mix of SHIELD Buffer and SHIELD-Epoxy solution for 3-4 days at 4°C.
- SHIELD ON Incubation: Transfer samples to SHIELD ON solution and incubate at 37°C.
- Post-Processing: Samples can be cleared immediately or stored at 4°C for several months without degradation of structure or signal [56].
The Scientist's Toolkit: Essential Research Reagent Solutions
| Reagent / Solution | Function in Protocol | Key Benefit for Native Structure |
|---|---|---|
| Fructose-Glycerol Solution [8] | Aqueous clearing agent | Homogenizes RI with minimal structural perturbation. |
| SHIELD Reagents [56] | Tissue-gel hybridization preservative | Cross-links biomolecules to stabilize architecture under harsh conditions. |
| Paraformaldehyde (PFA) [56] | Standard tissue fixative | Preserves structural integrity by cross-linking proteins. |
| OptiMuS [50] | Optimized aqueous clearing solution | Combines urea, iohexol, and sorbitol for high transparency and minimal shrinkage. |
| BABB [6] | Organic solvent-based clearing agent | Provides high transparency but often causes tissue shrinkage and quenches fluorescence. |
| PBS-Glycine Buffer [8] | Washing and quenching buffer | Reduces background autofluorescence, improving signal-to-noise ratio. |
Understanding the complex spatial relationships between gene expression and protein localization is fundamental to elucidating tissue organization and function in three-dimensional (3D) space. While traditional thin-section analysis provides valuable information, it is technically challenging, often damages tissue, and makes it difficult to reimage the same sample for multiple targets [4]. Whole-mount fluorescence in situ hybridization (FISH) combined with tissue clearing overcomes these limitations by enabling the visualization of nucleic acids and proteins within intact tissue volumes.
This application note details optimized strategies for multiplexed detection of RNA and protein targets, framed within a research paradigm utilizing whole-mount FISH coupled with fructose-glycerol clearing. We provide a consolidated guide on probe design, signal amplification, clearing compatibility, and quantitative imaging to empower researchers in drug development and basic science to implement these powerful techniques.
Signal Amplification and Multiplexing Strategies
A critical step for successful multiplexed imaging is the generation of bright, specific signals from multiple RNA targets. Several robust probe systems have been developed for this purpose. The table below summarizes the key features of three prominent methods.
Table 1: Comparison of Signal Amplification Methods for Multiplexed FISH
| Method | Mechanism | Key Advantages | Optimal Use Case |
|---|---|---|---|
| HCR v3.0 (Hybridization Chain Reaction) | Linear, enzyme-free amplification via metastable hairpin probes [3]. | High signal-to-noise ratio, quantitative signal scaling, preservation of tissue morphology, cost-effective for non-model organisms [4] [3]. | Whole-mount samples, sequential protein co-detection, quantification of RNA expression levels. |
| SABER (Signal Amplification By Exchange Reaction) | Probe concatemerization to aggregate fluorescent imager strands [57]. | High level of simultaneous amplification (5- to 450-fold), compatibility with both RNA and DNA FISH, enables high-order multiplexing (e.g., 17-plex) [57]. | Highly multiplexed imaging in cells and tissues, detection of low-abundance targets. |
| MERFISH (Multiplexed Error-Robust FISH) | Two-step labeling with encoding probes and fluorescent readout probes for combinatorial barcoding [51]. | Massive multiplexing (hundreds to thousands of RNAs), single-molecule sensitivity, high detection efficiency [51]. | Genomic-scale cellular transcriptomics, cell type and state identification in complex tissues. |
Optimized Protocol: Whole-Mount Multiplexed HCR v3.0
The following protocol, optimized for Octopus vulgaris embryos and applicable to other model systems, ensures robust multiplexed RNA detection compatible with subsequent immunohistochemistry and clearing [3].
Probe Design and Preparation:
- Automated Design: Utilize tools like
Easy_HCRto design HCR v3.0 split-initiator probe pairs. Aim for 25-35 probe pairs per mRNA target, each 25-50 base pairs in length for optimal tissue penetration [4] [3]. - Synthesis: Order DNA oligo pools with target-complementary sequences flanked by initiator sequences. Dissolve in nuclease-free water.
- Amplification: Use HCR amplifiers (e.g., B1-Alexa Fluor-546, B2-Alexa Fluor-647, B3-Alexa Fluor-488) from commercial sources (e.g., Molecular Instruments).
Sample Preparation and Staining:
- Fixation: Fix tissues in 4% Paraformaldehyde (PFA) overnight at 4°C.
- Permeabilization: Rehydrate fixed samples and treat with Proteinase K (e.g., 10 μg/mL for 15 minutes at room temperature) [3].
- Hybridization: Incubate tissues with probe solution (0.4 pmol of each probe in 100 μL hybridization buffer) overnight.
- Signal Amplification:
- Perform a pre-amplification wash for at least 30 minutes.
- Snap-cool hairpins (90°C for 90 seconds, then cool on ice) and incubate with the sample in amplification buffer overnight in the dark [3].
- Washing: Remove excess hairpins with multiple washes in 5x SSCT at room temperature.
Integration with Immunohistochemistry and Tissue Clearing
Combining multiplexed FISH with protein detection and tissue clearing creates a powerful pipeline for 3D molecular mapping.
Co-detection of Protein and RNA
The workflow for simultaneous protein and RNA detection involves performing FISH first, followed by standard immunohistochemistry (IHC) protocols. This sequential approach has been successfully demonstrated, for example, by staining trigeminal ganglia with both anti-beta-tubulin III (TUJ1) antibody and FISH probes, clearly distinguishing protein localization in nerve fibers from mRNA expression in cell bodies [4]. This allows researchers to correlate gene expression with protein localization and function directly within the same tissue sample.
Tissue Clearing Compatibility and Optimization
Clearing is essential for deep-tissue imaging as it reduces light scattering by matching the tissue's refractive index to that of the objective lens [58]. The choice of clearing method is critical for preserving fluorescence signals.
Table 2: Comparison of Tissue Clearing Methods Compatible with FISH
| Clearing Method | Mechanism | Compatibility with FISH/IHC | Impact on Tissue |
|---|---|---|---|
| Fructose-Glycerol | Aqueous, refractive index matching [3]. | Excellent preservation of HCR v3.0 and IHC signals; ideal for delicate samples [3]. | Minimal tissue shrinkage/swelling; preserves morphology. |
| LIMPID | Aqueous, lipid-preserving refractive index matching [4]. | Compatible with FISH probes, antibodies, and lipophilic dyes; single-step, fast clearing [4]. | Minimal swelling/shrinking; preserves most lipids. |
| iDISCO+ | Organic solvent-based, delipidation [4]. | Compatible with some FISH and IHC protocols [4]. | Can cause tissue shrinkage; not compatible with lipophilic dyes. |
Validated Protocol: Fructose-Glycerol Clearing After HCR v3.0 and IHC staining, clear samples by mounting them in a fructose-glycerol solution. This method has been validated to preserve the fluorescent signal of HCR v3.0 in whole-mount octopus embryos and is suitable for imaging via light-sheet fluorescence microscopy (LSFM) [3]. The 3D reconstructions generated from such cleared tissues can reveal spatial organization not discernible through two-dimensional methods [3].
The Scientist's Toolkit
Table 3: Essential Research Reagent Solutions for Multiplexed Whole-Mount FISH
| Reagent / Kit | Function | Application Note |
|---|---|---|
| HCR v3.0 Amplifiers (Molecular Instruments) | Fluorescently labeled DNA hairpins for signal amplification. | Provide high gain, lower cost, and greater durability; essential for multiplexed RNA detection [4] [3]. |
| Oligo Pools (Integrated DNA Technologies) | Source for custom FISH probe libraries. | Enable inexpensive, large-scale synthesis of target-specific probes, ideal for non-model organisms [4] [3]. |
| Formamide | Chemical denaturant in hybridization buffers. | Concentration must be optimized for probe target region length (e.g., 20-50 nt) to balance specificity and signal brightness [51]. |
| Fructose-Glycerol Solution | Aqueous tissue clearing medium. | Effectively clears tissue while preserving the structural integrity and fluorescent signals from HCR and IHC [3]. |
| LIMPID Clearing Solution | Aqueous clearing solution (SSC, urea, iohexol) [4]. | A single-step, fast-clearing option that preserves lipids and is compatible with FISH and IHC [4]. |
| Proteinase K | Enzyme for tissue permeabilization. | Critical for probe access; concentration and incubation time must be titrated to avoid over-digestion and loss of signal [4] [3]. |
Workflow and Data Analysis
The complete experimental pipeline, from sample preparation to data interpretation, is outlined in the following workflow diagram.
For quantitative analysis, the linear amplification scheme of HCR allows fluorescence intensity to be scaled to RNA quantity, enabling RNA counting at the single-molecule level when amplification time is limited [4]. When using MERFISH, performance is highly dependent on protocol choices, and optimization of encoding probe hybridization, buffer composition, and readout probe specificity can significantly improve the RNA detection efficiency and reduce false-positive rates [51].
The integration of robust multiplexed FISH techniques like HCR v3.0 with compatible tissue clearing methods such as fructose-glycerol or LIMPID provides a powerful framework for the simultaneous 3D mapping of multiple gene products and proteins within intact tissues. The optimized protocols and comparative data presented here offer a practical roadmap for researchers aiming to visualize complex molecular interactions in their native spatial context, thereby accelerating discovery in developmental biology, neuroscience, and drug development.
Method Validation and Comparative Analysis with Alternative Techniques
Within the broader scope of whole-mount fluorescence in situ hybridization (FISH) research, validating novel methodologies against established techniques is a critical step in demonstrating reliability and efficacy. This application note provides a detailed comparison between whole-mount FISH with fructose-glycerol clearing and traditional, section-based FISH and immunohistochemistry (IHC). The transition from two-dimensional sectional analysis to three-dimensional whole-mount imaging represents a significant advancement for visualizing complex biological structures, such as the vascular network in zebrafish spinal cords or neurogenesis in octopus embryos [14] [3]. However, the quantitative and qualitative performance of these whole-mount protocols must be rigorously benchmarked. This document summarizes key comparative data and provides detailed experimental protocols to facilitate this essential validation process for researchers and drug development professionals.
Comparative Data Analysis: Whole-Mount vs. Section-Based Methods
The validation of any new methodology rests on its performance against the current gold standard. The following tables summarize quantitative and qualitative comparisons between whole-mount FISH and traditional section-based FISH and IHC, drawing from foundational studies.
Table 1: Quantitative Comparison of HER2 Detection by IHC and FISH in Breast Cancer Samples [59]
This table illustrates a direct comparison between IHC (a common initial test) and FISH (often considered the genetic gold standard), highlighting the diagnostic challenges that advanced 3D methods can help address.
| Test Method | Result Category | Number of Samples | Percentage of Samples | Concordance with FISH |
|---|---|---|---|---|
| IHC | Positive (3+) | 3 | 6.8% | Significant difference (P=0.019) |
| Negative (0/1+) | 5 | 11.4% | ||
| Equivocal (2+) | 36 | 81.8% | ||
| FISH (Gold Standard) | Positive | 21 | 47.7% | N/A |
| Negative | 23 | 52.3% | N/A |
Table 2: Qualitative Comparison of Methodological Attributes [59] [14] [3]
This table compares the core characteristics of traditional section-based methods against the whole-mount approach with fructose-glycerol clearing.
| Attribute | Traditional Section-Based IHC/FISH | Whole-Mount FISH with Fructose-Glycerol |
|---|---|---|
| Spatial Context | Two-dimensional (2D) slices; potential for lost information between sections. | Three-dimensional (3D) preservation of entire structures and networks. |
| Target Analysis | Examines protein expression (IHC) or gene copy number (FISH). | Enables multiplexed mRNA detection (e.g., via HCR v3.0) and can be combined with IHC. |
| Tissue Integrity | Requires physical sectioning, which can disrupt delicate structures. | Maintains intact tissue architecture; no physical sectioning needed for imaging. |
| Throughput | Relatively faster for individual sections; 3D reconstruction is laborious. | Slower per sample, but provides immediate 3D data without reconstruction. |
| Sensitivity & Specificity | FISH is highly specific for gene amplification [59]. IHC can be ambiguous [59]. | HCR v3.0 offers high sensitivity and specificity for mRNA, with low background [3]. |
| Primary Application | Diagnostic pathology (e.g., HER2 scoring); standard gene expression analysis. | 3D developmental biology; mapping complex organ systems; exploratory research. |
Experimental Protocols
Protocol A: Traditional Section-Based FISH and IHC
This protocol outlines the concurrent preparation of tissue for both FISH and IHC on paraffin-embedded sections, as utilized in comparative studies [59].
Materials and Reagents:
- Formalin-fixed, paraffin-embedded (FFPE) tissue samples
- Target Retrieval Solution (e.g., Dako S2367)
- Rabbit Anti-human c-erbB2 Monoclonal Antibody (e.g., Dako A0485) or other primary antibodies
- Liquid DAB+ Substrate Chromogen System (e.g., Dako K3468)
- HER2 FISH-specific fluorescent probe
- Hematoxylin counterstain
- Xylene and graded ethanol series (99.6%, 96%, 70%)
Methodology:
- Sectioning and Mounting: Cut 4 μm sections from the FFPE block using a microtome and mount onto glass slides.
- Deparaffinization and Rehydration: Bake slides at 60-65°C for 2 hours. Soak slides in xylene followed by a graded series of ethanol (100%, 96%, 70%) and finally distilled water, 45 minutes total.
- Antigen Retrieval: Immerse slides in Target Retrieval Solution (pH=9) and heat in an autoclave at 121°C for 20 minutes. Wash with PBS.
- Immunohistochemistry (IHC): a. Quench Endogenous Peroxidase: Incubate slides in 3% Hydrogen Peroxide in methanol for 15 minutes. Wash with PBS. b. Primary Antibody Incubation: Apply primary antibody (e.g., Anti-HER2) and incubate in a humid, dark chamber for 45-120 minutes at room temperature. c. Secondary Antibody Incubation: Apply secondary antibody and incubate for 30-45 minutes. Wash with PBS. d. Chromogen Development: Apply DAB+ chromogenic substrate for 5 minutes. e. Counterstaining: Counterstain with hematoxylin for 30-60 seconds. Wash in water.
- Dehydration and Mounting: Dehydrate tissues through a graded ethanol series and xylene. Mount coverslips for microscopic examination.
- FISH Staining (on consecutive sections): a. After deparaffinization, apply a dedicated HER2 fluorescent probe to the tissue section. b. Follow manufacturer's instructions for hybridization, washing, and counterstaining (e.g., with DAPI).
- Analysis: Visualize IHC slides under a brightfield microscope and score according to established guidelines (0, 1+, 2+, 3+). Analyze FISH slides using a fluorescence microscope to count gene copy numbers [59].
Protocol B: Whole-Mount FISH with Fructose-Glycerol Clearing
This protocol is optimized for whole-mount multiplexed RNA in situ hybridization chain reaction (HCR v3.0) on octopus embryos, followed by fructose-glycerol clearing for 3D imaging [3]. It can be adapted for other tissues, such as zebrafish spinal cords [14].
Materials and Reagents:
- Fixed whole-mount samples (e.g., Octopus vulgaris or zebrafish embryos, zebrafish spinal cord)
- HCR v3.0 DNA Oligo Pools and amplifiers (e.g., B1-Alexa Fluor-546, B2-Alexa Fluor-647, B3-Alexa Fluor-488)
- Probe hybridization buffer and amplification buffer
- Washing solution: 1X PBS with DMSO and Triton X-100
- Whole-mount blocking solution: Washing solution with 1% (w/v) Bovine Serum Albumin (BSA)
- Fructose-glycerol clearing solution (Scale S4) [14]:
- D-sorbitol
- Urea
- Glycerol
- Triton X-100
- Dimethyl sulfoxide (DMSO)
- Milli-Q water
Methodology:
- Sample Preparation and Fixation: Manually dechorionate embryos if necessary. Fix samples in 4% Paraformaldehyde (PFA) overnight at room temperature. Wash with PBS-DEPC. Dehydrate through a graded Methanol/PBST series (25%, 50%, 75%, 100%) and store at -20°C until use.
- Rehydration and Permeabilization: Rehydrate samples by passing through a graded Methanol/PBST series in reverse. Treat with Proteinase K (10 μg/ml in PBS-DEPC) for 15 minutes at room temperature to permeabilize tissues.
- Hybridization Chain Reaction (HCR v3.0): a. Pre-hybridization: Pre-hybridize samples in probe hybridization buffer. b. Hybridization: Incubate samples with probe solution (0.4 pmol of each probe in 100 μl hybridization buffer) overnight. c. Amplification: Wash off excess probes. Snap-cool fluorescent hairpins (H1 and H2), add to amplification buffer, and incubate samples in this solution overnight in the dark.
- Optional Immunohistochemistry: After HCR, samples can be incubated with a primary antibody (e.g., anti-GFP, anti-phosphorylated-histone H3) followed by a fluorescently-labeled secondary antibody, using the whole-mount blocking solution to reduce non-specific binding [3].
- Fructose-Glycerol Clearing: a. Prepare Scale S4 Solution: Dissolve D-sorbitol and urea separately in Milli-Q water. Allow the D-sorbitol solution to cool to room temperature before mixing with the urea solution (which must be <30°C). Add glycerol, Triton X-100, and DMSO. Adjust to the final volume with water. Store at 4°C [14]. b. Clear Samples: Incubate the stained samples in the Scale S4 solution until they achieve optical transparency.
- Mounting and Imaging: Mount cleared samples in the Scale S4 solution for imaging. Acquire 3D image data using Light Sheet Fluorescence Microscopy (LSFM) or confocal microscopy [14] [3].
The Scientist's Toolkit: Research Reagent Solutions
Table 3: Essential Reagents for Whole-Mount FISH with Clearing [14] [3]
| Reagent | Function/Benefit | Example Source / Identifier |
|---|---|---|
| HCR v3.0 DNA Oligo Pools | Split-initiator probes for highly specific, multiplexed mRNA detection with low background and high signal amplification. | Integrated DNA Technologies (Custom) |
| HCR Fluorescent Hairpin Amplifiers | Amplify the HCR signal; available in multiple colors (e.g., Alexa Fluor 488, 546, 647) for simultaneous target detection. | Molecular Instruments, Inc. |
| Scale S4 Clearing Solution | A fructose-glycerol-urea based aqueous clearing agent that preserves fluorescent signal while rendering tissues transparent for deep imaging. | Prepared in-lab [14] |
| Triton X-100 | Non-ionic detergent used in washing and clearing solutions to permeabilize cell membranes and facilitate reagent penetration. | Sigma-Aldrich (Cat#T8787) |
| Dimethyl Sulfoxide (DMSO) | A polar solvent used in clearing and washing solutions to enhance penetration of reagents and clearing agents into deep tissues. | VWR (Cat#VWRC0231) |
| Bovine Serum Albumin (BSA) | Used in blocking buffers to reduce non-specific binding of antibodies and HCR probes, lowering background noise. | NZYtech (Cat#MB04602) |
| Proteinase K | Enzyme used for controlled tissue permeabilization prior to HCR, enabling probe access to mRNA targets. | Roche |
Visualizing the Validation Workflow
The following diagram outlines the logical progression for validating a whole-mount FISH protocol against traditional section-based methods, ensuring robust and reliable results.
Tissue clearing has revolutionized the study of biological structures by enabling three-dimensional imaging of intact tissues and organs. For researchers employing whole-mount fluorescent in situ hybridization (FISH), selecting an appropriate clearing method is paramount, as it must preserve RNA integrity and fluorescence signal while providing sufficient transparency for deep-tissue imaging. This application note provides a detailed comparative analysis of fructose-glycerol clearing against three established methods—CUBIC, CLARITY, and 3DISCO—within the context of whole-mount FISH research. We present quantitative data on their performance characteristics, detailed experimental protocols, and a practical framework for selecting the optimal method based on specific research objectives, sample types, and available imaging infrastructure.
Comparative Analysis of Clearing Methods
The choice of a tissue clearing method involves balancing multiple factors, including transparency efficiency, sample preservation, compatibility with molecular techniques, and practical implementation requirements. The table below summarizes the key characteristics of fructose-glycerol, CUBIC, CLARITY, and 3DISCO.
Table 1: Key Characteristics of Major Tissue Clearing Methods
| Method | Chemical Basis | Primary Mechanism | Typical Clearing Time | Compatibility with Whole-Mount FISH | Key Advantages | Major Limitations |
|---|---|---|---|---|---|---|
| Fructose-Glycerol | Aqueous solution | Refractive index matching via high-RI aqueous solution [7] | Hours to days [3] | High - Directly validated for HCR FISH in octopus embryos [3] | Preserves fluorescence; simple protocol; low toxicity [7] [3] | Less efficient for large samples; high viscosity [7] |
| CUBIC | Hyperhydration | Urea-based delipidation and RI matching [7] | 1-2 weeks [7] | Moderate (depends on protocol variations) | Excellent transparency; effective for whole organs [60] [7] | Long processing time; significant protein loss [7] |
| CLARITY | Hydrogel embedding | Tissue-protein hydrogel hybridization and electrophoretic delipidation [7] | Weeks [7] | Moderate to Low (complex protocol) | Superior structural preservation; compatible with various labeling [60] [7] | Technically complex; requires specialized equipment [60] [7] |
| 3DISCO | Organic solvent | Dehydration and lipid dissolution with organic solvents [7] | Hours to days [7] | Low - Quenches fluorescent proteins; not ideal for RNA preservation [7] | Rapid clearing; high transparency [60] [7] | Quenches fluorescence; tissue shrinkage; toxicity [60] [7] |
Table 2: Performance Metrics Across Different Sample Types
| Method | Signal Preservation (0-5 scale) | Tissue Transparency (0-5 scale) | Tissue Expansion/Shrinkage | Ideal Sample Size | Imaging Depth |
|---|---|---|---|---|---|
| Fructose-Glycerol | 4-5 (Excellent for FISH signals) [3] | 3 (Moderate) [7] | Minimal swelling/shrinkage [7] | Small to medium (embryos, tissues <1mm) [3] | Several hundred microns [7] |
| CUBIC | 3-4 (Good, but some protein loss) [7] | 4-5 (Very high) [7] | Tissue expansion [60] | Small to whole organs [60] | Whole organs [60] |
| CLARITY | 4 (Very good structural preservation) [7] | 4 (High) [7] | Minimal distortion [7] | Whole organs [60] | Whole organs [60] |
| 3DISCO | 1-2 (Poor, quenches fluorescence) [7] | 5 (Exceptional) [7] | Significant shrinkage [60] | Whole organs [60] | Whole organs [60] |
Experimental Protocols
Fructose-Glycerol Clearing for Whole-Mount FISH
This protocol has been optimized for whole-mount FISH in Octopus vulgaris embryos [3] and can be adapted for other model systems.
Reagents Required:
- Fructose-Glycerol solution: 60% Fructose, 30% Glycerol, 0.5% Tris base in DEPC-treated water
- Phosphate Buffered Saline with Tween (PBST)
- Paraformaldehyde (PFA) 4%
- Methanol series (25%, 50%, 75%, 100%)
Procedure:
- Fixation and Permeabilization: Fix samples in 4% PFA overnight at 4°C. Wash with PBST. Permeabilize with proteinase K (10 μg/mL in PBS-DEPC) for 15 minutes at room temperature [3].
- Whole-Mount FISH: Perform standard HCR v3.0 protocol with probe hybridization and amplification [3].
- Clearing: Gradually equilibrate samples in fructose-glycerol solution through a stepped series (25%, 50%, 75% in PBST, 1 hour each) followed by incubation in 100% fructose-glycerol overnight [3].
- Mounting and Imaging: Mount samples in fresh fructose-glycerol solution. Image using light-sheet or confocal microscopy.
Critical Steps and Troubleshooting:
- For pigmented tissues, include a bleaching step (3% H₂O₂ in methanol) after fixation [3].
- Optimize permeabilization time based on sample size and density.
- Ensure complete equilibration in clearing solution to prevent refractive index mismatches.
CUBIC Protocol
Reagents Required:
- CUBIC-R1: 25 wt% Urea, 25 wt% N,N,N',N'-Tetrakis(2-hydroxypropyl)ethylenediamine, 15 wt% Triton X-100 [7]
- CUBIC-R2: 50 wt% Sucrose, 25 wt% Urea, 10 wt% Triethanolamine [7]
Procedure:
- Fixation: Fix samples in 4% PFA for 24-48 hours at 4°C.
- Delipidation and Decolorization: Immerse samples in CUBIC-R1 at 37°C with gentle shaking for 3-7 days (solution refreshed daily) [7].
- Refractive Index Matching: Transfer samples to CUBIC-R2 at 37°C with gentle shaking for 3-7 days until transparent [7].
- Mounting and Imaging: Mount in CUBIC-R2 for imaging.
CLARITY Protocol
Reagents Required:
- Hydrogel solution: 4% Acrylamide, 0.05% Bis-acrylamide, 4% PFA in PBS [7]
- Electrophoresis buffer: 200mM Boric acid, 4% SDS [7]
Procedure:
- Tissue-Hydrogel Hybridization: Perfuse or immerse samples in hydrogel solution and incubate at 4°C for 3 days [7].
- Polymerization: Heat to 37°C for 3 hours to form hydrogel-tissue hybrid.
- Lipid Removal: Use electrophoretic tissue clearing (ETC) apparatus or passive clearing in 8% SDS at 37°C for 2-4 weeks [7].
- Refractive Index Matching: Rinse and immerse in FocusClear or 85% glycerol for RI matching.
- Mounting and Imaging: Mount in appropriate RI solution for imaging.
3DISCO Protocol
Reagents Required:
- Tetrahydrofuran (THF)
- Dichloromethane (DCM)
- Dibenzyl ether (DBE) [7]
Procedure:
- Dehydration: Dehydrate through graded THF series (50%, 70%, 80%, 100%) for 12 hours each.
- Lipid Removal: Incubate in DCM for 2-3 hours.
- Refractive Index Matching: Transfer to DBE for final clearing and RI matching [7].
- Mounting and Imaging: Mount in DBE for immediate imaging.
Quantitative Performance Comparison
Recent studies have provided direct comparisons of clearing efficiency across different methods. The following data highlights the performance characteristics relevant to whole-mount FISH applications.
Table 3: Quantitative Clearing Efficiency Across Methods
| Method | Normalized Brightness at Depth | Maximum Imaging Depth | Signal Preservation Over Time | Sample Integrity Preservation |
|---|---|---|---|---|
| Fructose-Glycerol | Peak intensity at ~50% depth [22] | Full depth of small embryos [3] | Stable for >1 week [3] | Excellent (minimal distortion) [3] |
| See-Star (Hydrogel) | Peak intensity at ~50% depth [22] | >1 cm³ specimens [22] | Not specified | Excellent with high acrylamide [22] |
| BABB (Solvent) | High at surface, rapid decline [6] | Several hundred microns [6] | Preserved over 14 days [6] | Moderate (some shrinkage) [6] |
| CUBIC | High intensity throughout [22] | Whole organs [7] | Moderate (protein loss) [7] | Moderate (expansion) [60] |
Diagram 1: Decision Framework for Clearing Method Selection. This flowchart provides a systematic approach for selecting the optimal clearing method based on research priorities, sample characteristics, and available resources.
The Scientist's Toolkit: Essential Research Reagents
Successful implementation of tissue clearing methods requires specific reagents and equipment. The following table details essential components for establishing these protocols in a research setting.
Table 4: Essential Research Reagents for Tissue Clearing and Whole-Mount FISH
| Reagent Category | Specific Examples | Function | Key Considerations |
|---|---|---|---|
| Clearing Agents | Fructose-Glycerol mixture, BABB (Benzyl Alcohol Benzyl Benzoate), Dibenzyl Ether (DBE), CUBIC reagents [6] [7] [3] | Refractive index matching to reduce light scattering | Aqueous vs. organic solvent basis; compatibility with fluorescent labels [7] |
| Permeabilization Agents | Triton X-100, Tween-20, Proteinase K [3] | Enhance penetration of probes and antibodies | Concentration and timing critical for sample integrity [3] |
| HCR FISH Components | DNA Oligo Pools, HCR amplifiers (B1-Alexa Fluor-546, B2-Alexa Fluor-647, B3-Alexa Fluor-488) [3] | Specific mRNA detection with signal amplification | Enable multiplexing; design tools available (Easy_HCR) [3] |
| Mounting Media | FocusClear, 85% Glycerol, SeeDB2 [7] | Final refractive index matching for microscopy | Match RI to objective lens correction [60] |
| Lipid Removal Agents | SDS, Triton X-100, Tetrahydrofuran (THF) [7] | Remove light-scattering lipids | Varies by method: gentle (aqueous) to harsh (organic) [7] |
The selection of an appropriate tissue clearing method for whole-mount FISH requires careful consideration of multiple experimental factors. Fructose-glycerol clearing emerges as the superior choice for FISH applications in small to medium-sized samples due to its exceptional signal preservation, straightforward protocol, and low toxicity. For larger specimens requiring higher transparency, CUBIC offers a viable alternative despite longer processing times. CLARITY provides outstanding structural preservation but demands significant technical expertise and specialized equipment. 3DISCO, while achieving exceptional transparency, is generally unsuitable for FISH due to its quenching of fluorescent signals. By aligning method capabilities with specific research requirements as outlined in this application note, researchers can effectively implement these powerful techniques to advance three-dimensional gene expression studies.
Whole-mount fluorescence in situ hybridization (FISH) combined with tissue clearing has revolutionized three-dimensional (3D) gene expression analysis by enabling detailed visualization of RNA localization within intact tissues. Within this methodological landscape, fructose-glycerol clearing has emerged as a particularly effective approach for balancing signal preservation with optical transparency. This application note provides a comprehensive quantitative assessment of key performance metrics—signal preservation, imaging depth, and resolution—for whole-mount FISH methodologies utilizing fructose-glycerol and related clearing techniques. We present structured quantitative data, detailed protocols, and analytical frameworks to guide researchers in optimizing these parameters for diverse experimental contexts, with particular emphasis on applications in developmental biology, neurobiology, and drug discovery.
Quantitative Performance Metrics of Clearing Methods
Comparative Analysis of Clearing Efficacy
Table 1: Quantitative performance metrics of tissue clearing methods compatible with whole-mount FISH
| Clearing Method | Reported Imaging Depth | Tissue Integrity | FISH Signal Preservation | Recommended Objective NA | Compatible Imaging Modalities |
|---|---|---|---|---|---|
| Fructose-Glycerol [61] [3] | >500 μm (Octopus embryo) | Minimal shrinkage/swelling | Excellent (HCR v3.0 compatible) | Not specified (LSFM compatible) | Light-sheet, confocal |
| LIMPID [4] | 250 μm (mouse brain slices) | Minimal swelling/shrinking | Excellent (HCR compatible) | 1.515 (63X oil immersion) | Confocal, conventional fluorescence |
| See-Star (30% acrylamide) [22] | >1 cm³ (sea urchin juvenile) | Excellent after decalcification | Compatible with ISH | Not specified | Light-sheet, confocal |
| EZ-Clear [22] | Full depth (~200 μm sea star) | Good | Not assessed | Not specified | Confocal |
| CUBIC [22] | Limited to surface layers | Good | Not assessed | Not specified | Confocal |
Resolution and Signal Quantification Capabilities
Table 2: Signal and resolution metrics for quantitative FISH applications
| Method | Quantification Capability | Single-Molecule Resolution | Multiplexing Capacity | Tissue Compatibility |
|---|---|---|---|---|
| smFISH with ClearSee [34] | Absolute mRNA counts per cell | Yes (discrete fluorescent dots) | Limited by fluorophores | Arabidopsis roots, SAM, ovules, barley |
| HCR v3.0 with fructose-glycerol [61] [3] | Linear amplification for quantification | Yes (with limited amplification time) | 3-plex demonstrated | Octopus embryos, mammalian tissues |
| 3D-LIMPID-FISH [4] | Single-cell expression quantification | Yes (distinct fluorescent dots) | Combined mRNA/protein imaging | Mouse brain slices, trigeminal ganglia |
| Whole-mount HCR in plants [18] | Spatial expression patterns | Not demonstrated | 3-plex demonstrated | Arabidopsis, maize, sorghum |
Experimental Protocols
Whole-Mount FISH with Fructose-Glycerol Clearing
Sample Preparation and Fixation
- Tissue Collection: Collect Octopus vulgaris embryos at stage XV (approximately 1.25 mm × 0.88 mm) and fix in 4% paraformaldehyde (PFA) in phosphate-buffered saline (PBS) overnight at 4°C [61] [3].
- Dechorionation: Manually remove chorion using fine tweezers (Dumont #5 Forceps) in PBS-Tween (PBST) [61] [3].
- Dehydration: Transfer samples through graded methanol/PBST series (25%, 50%, 75%, 100%, 100%), 10 minutes each at room temperature [61] [3].
- Storage: Store dehydrated samples at -20°C in 100% methanol until use [61] [3].
Hybridization Chain Reaction v3.0
- Rehydration: Gradually transfer samples from methanol to room temperature, then rehydrate through reverse methanol/PBST series [61] [3].
- Permeabilization: Treat with proteinase K (10 μg/ml in PBS-DEPC) for 15 minutes at room temperature [61] [3].
- Probe Hybridization: Prepare probe solution with 0.4 pmol of each probe in 100 μl probe hybridization buffer. Incubate samples overnight at 37°C [61] [3].
- Amplification: Prepare hairpin amplifiers (3 pmol each) by snap cooling (95°C for 90 seconds, 5 minutes on ice, 30 minutes at room temperature). Add to amplification buffer and incubate samples overnight in the dark [61] [3].
- Washing: Remove excess hairpins with 3×5-minute washes in 5× SSCT at room temperature [61] [3].
- Nuclear Staining: Incubate in 1:2000 DAPI in 5× SSCT for 2 hours followed by 5-minute wash [61] [3].
Fructose-Glycerol Clearing and Imaging
- Clearing: Transfer samples to fructose-glycerol clearing solution for at least 2 days [61] [3].
- Mounting: Mount cleared samples in fructose-glycerol solution for imaging [61] [3].
- Imaging: Image using light-sheet fluorescence microscopy (LSFM) or confocal microscopy [61] [3].
smFISH with ClearSee for Plant Tissues
Tissue Processing and Clearing
- Fixation and Embedding: Fix plant tissues and embed in hydrogel according to Gordillo et al. protocol [34].
- Clearing: Treat samples with methanol and ClearSee to reduce autofluorescence and improve signal-to-noise ratio [34].
- Cell Wall Staining: Add Renaissance 2200 stain to visualize cell walls and assign transcripts to specific cells [34].
smFISH Protocol
- Probe Design: Design probes against exonic regions of target mRNA (e.g., PP2A, GAPDH) [34].
- Hybridization: Hybridize with Quasar570 or Quasar670-labeled probes [34].
- Imaging: Image using confocal microscopy to collect optical sections of thick specimens [34].
3D-LIMPID-FISH for Mammalian Tissues
Sample Processing
- Workflow Steps: Sample extraction, fixation, bleaching, staining, and clearing [4].
- Refractive Index Matching: Prepare LIMPID solution with saline-sodium citrate, urea, and iohexol. Adjust iohexol percentage to fine-tune refractive index to match objective lens (1.515 for 63× oil immersion) [4].
- Compatibility: Method preserves lipids and enables simultaneous detection of mRNA and protein [4].
Visualization of Experimental Workflows
Whole-Mount FISH with Fructose-Glycerol Clearing Workflow
Workflow for Fructose-Glycerol FISH
Signal Amplification Mechanisms in FISH Methodologies
FISH Signal Amplification Mechanisms
The Scientist's Toolkit: Essential Research Reagents
Table 3: Key research reagents for whole-mount FISH with fructose-glycerol clearing
| Reagent Category | Specific Reagents | Function | Application Notes |
|---|---|---|---|
| Fixation | 4% Paraformaldehyde (PFA) | Tissue preservation and morphology maintenance | Overnight fixation at 4°C [61] [3] |
| Permeabilization | Proteinase K | Enhances probe penetration | 10 μg/ml for 15 minutes at room temperature [61] [3] |
| Probe Systems | HCR v3.0 split-initiator probes | Target mRNA binding | 0.4 pmol per probe in 100 μl hybridization buffer [61] [3] |
| Amplification | HCR hairpin amplifiers (B1-Alexa Fluor-546, B2-Alexa Fluor-647, B3-Alexa Fluor-488) | Signal amplification | 3 pmol each hairpin, snap-cooled before use [61] [3] |
| Clearing | Fructose-glycerol solution | Refractive index matching | Minimum 2 days clearing for optimal transparency [61] [3] |
| Nuclear Staining | DAPI (1:2000 in 5× SSCT) | Nuclear counterstain | 2-hour incubation followed by wash [61] [3] |
| Mounting Media | Fructose-glycerol | Sample mounting for imaging | Same solution as clearing medium [61] [3] |
Discussion and Technical Considerations
Optimizing Signal Preservation
Signal preservation in whole-mount FISH is critically dependent on both the clearing method and amplification technique. Fructose-glycerol clearing demonstrates excellent compatibility with HCR v3.0 signal preservation, maintaining fluorescence through the clearing process [61] [3]. The linear amplification scheme of HCR v3.0 provides quantitative capabilities, with fluorescence intensity scaling to RNA quantity in the region [4]. For absolute quantification of mRNA molecules, smFISH approaches combined with ClearSee treatment offer single-molecule resolution, enabling precise transcript counting in plant tissues [34].
Maximizing Imaging Depth and Resolution
The imaging depth achievable with fructose-glycerol clearing exceeds 500 μm in octopus embryos, sufficient for comprehensive analysis of whole embryos [61] [3]. For thicker specimens, LIMPID and See-Star protocols enable imaging depths up to 250 μm in mouse brain slices and beyond 1 cm³ in juvenile echinoderms, respectively [4] [22]. Resolution at depth is maximized by precise refractive index matching; the LIMPID protocol enables fine-tuning of RI to match high-NA objectives (1.515 for 63× oil immersion), minimizing spherical aberrations and maintaining image quality across hundreds of micrometers of tissue [4].
Method Selection Guidelines
Selection of appropriate methodology depends on experimental requirements:
- Fructose-glycerol with HCR v3.0: Optimal for embryonic samples requiring multiplexed RNA detection with protein co-localization [61] [3].
- smFISH with ClearSee: Essential for absolute mRNA quantification at cellular and subcellular resolution in plant tissues [34].
- 3D-LIMPID-FISH: Preferred for lipid-preserving applications in neural tissues requiring high-resolution subcellular imaging [4].
- See-Star: Necessary for large, calcified, or pigmented specimens requiring structural support during decalcification [22].
Whole-mount FISH combined with fructose-glycerol clearing provides a powerful methodology for 3D gene expression analysis, offering an optimal balance of signal preservation, imaging depth, and resolution. The quantitative metrics and detailed protocols presented herein provide researchers with a framework for implementing these techniques across diverse biological systems. As tissue clearing methodologies continue to evolve, the integration of optimized protocols with advanced imaging platforms will further enhance our ability to visualize and quantify spatial gene expression patterns at unprecedented resolution.
The common octopus, Octopus vulgaris, possesses a complex nervous system capable of sophisticated cognitive behaviors, yet the embryonic development of this system has remained partially unexplored due to technical limitations [3]. Understanding embryonic neurogenesis is crucial to unravel how the octopus develops its expansive and complex brain. Traditional molecular analysis techniques often require tissue sectioning, which disrupts the three-dimensional spatial organization of gene expression patterns and can obscure important architectural information [3]. This case study details the successful optimization of a methodological pipeline combining whole-mount multiplexed RNA in situ hybridization chain reaction version 3.0 (HCR v3.0) with immunohistochemistry (IHC), fructose-glycerol clearing, and light sheet fluorescence microscopy (LSFM) to visualize neurogenesis in Octopus vulgaris embryos at stage XV, a key period of mid-organogenesis [3]. This integrated approach provided unprecedented three-dimensional insights into the spatial organization of neuronal and glial gene expression, revealing patterns that were previously undiscoverable using conventional two-dimensional methods.
Background and Scientific Context
The octopus is a compelling model for neurodevelopmental studies due to its unique neuroanatomy and complex behaviors [3]. Its central brain develops from placodes into cords and lobes, which represent the adult brain structures, containing approximately 200,000 cells at hatching [3]. Recent genomic resources have spurred molecular research on cephalopods, creating a demand for techniques that can spatially resolve gene expression in three dimensions [3]. While antibody-based tools are often expensive and not readily available for non-model species like cephalopods, mRNA detection methods like HCR offer a more versatile and cost-effective alternative [3]. The HCR v3.0 technique is particularly powerful because of its robustness, sensitivity, and capacity for multiplexing, outperforming traditional colorimetric in situ hybridization and providing a lower-cost option compared to other branched DNA methods like RNAscope [3].
Key Findings and Experimental Outcomes
Validation of Spatial Gene Expression
The optimized protocol was used to detect the expression of key neuronal and glial markers in whole mount octopus embryos. The expression patterns observed for neuronal marker Ov-elav and glial marker Ov-apolpp via multiplexed HCR v3.0 matched previous data obtained from paraffin-embedded transverse sections, validating the specificity and accuracy of the whole-mount approach [3]. Furthermore, the combination of neural progenitor marker Ov-ascl1 and precursor marker Ov-neuroD with immunohistochemistry for phosphorylated-histone H3 (a mitotic marker) demonstrated the protocol's capability for simultaneous detection of mRNA and protein, providing a more comprehensive view of the neurogenic process [3].
Advantages of 3D Reconstruction
A significant outcome of this study was the revelation of additional spatial organization through three-dimensional reconstruction, which had remained hidden in two-dimensional analyses [3]. The 3D data provided by light sheet imaging after clearing allowed for a comprehensive mapping of gene expression within the volumetric context of the entire embryo, offering insights into the intricate architecture of the developing octopus brain that are essential for understanding how complex neural structures form [3].
Table 1: Key Markers Used in Octopus Embryonic Neurogenesis Study
| Marker Gene | Cell Type / Process | Number of HCR Probe Pairs | Experimental Combination |
|---|---|---|---|
| Ov-elav | Differentiated Neurons | 27 | Multiplexed HCR with Ov-apolpp |
| Ov-apolpp | Glial Cells | 33 | Multiplexed HCR with Ov-elav |
| Ov-ascl1 | Neural Progenitors | 33 | HCR combined with IHC (pH3) |
| Ov-neuroD | Neural Precursors | 26 | HCR combined with IHC (pH3) |
| Phospho-Histone H3 | Mitotic Cells | N/A (Protein) | IHC combined with HCR |
Table 2: Comparison of 2D Sectioning vs. 3D Whole-Mount Approach
| Feature | Traditional 2D Sections | 3D Whole-Mount HCR with Clearing |
|---|---|---|
| Spatial Context | Limited, reconstructed | Preserved, inherent 3D volume |
| Discovery Potential | Lower risk of missing structures outside the section plane | |
| Tissue Integrity | Disrupted by microtomy | Preserved intact |
| Multiplexing Capacity | Challenging | Streamlined (e.g., 2-3 RNA targets + protein) |
| Throughput | Labor-intensive serial sectioning | Single preparation for entire sample |
| Representative Finding | Confirmed known expression patterns | Revealed novel spatial organization |
Detailed Experimental Protocol
The following diagram illustrates the complete experimental workflow, from embryo preparation to 3D imaging and analysis.
Protocol Steps
Animal and Embryo Preparation
- Embryo Source: Live Octopus vulgaris embryos were obtained from the Instituto Español de Oceanografía (IEO, Tenerife, Spain) and incubated until reaching developmental stage XV [3].
- Fixation: Embryos were fixed in 4% paraformaldehyde (PFA) in phosphate-buffered saline (PBS) overnight [3].
- Dechorionation: Embryos were manually dechorionated using fine tweezers in PBST [3].
- Dehydration: Embryos were dehydrated through a graded methanol (MeOH)/PBST series (25%, 50%, 75%, 100%, 100% MeOH), with each step lasting 10 minutes. Dehydrated embryos were stored at -20°C [3].
Probe Design and HCR v3.0
- Probe Design: The researchers developed a code named Easy_HCR to automate the design of HCR v3.0 type probe pairs. For the target genes (Ov-apolpp, Ov-ascl1, Ov-elav, Ov-neuroD), between 26 and 33 split-initiator probe pairs were designed per gene [3].
- DNA Oligo Pools: Probe sets were ordered from Integrated DNA Technologies, Inc., and dissolved in Nuclease-Free Distilled Water. HCR amplifiers (B1-Alexa Fluor-546, B2-Alexa Fluor-647, B3-Alexa Fluor-488) were obtained from Molecular Instruments, Inc [3].
- HCR Protocol: The protocol was adapted from the Molecular Instruments' HCR v3.0 protocol for whole-mount mouse embryos [3]. Key steps include:
- Rehydration: Gradual rehydration of embryos from methanol to room temperature.
- Permeabilization: Treatment with proteinase K (10 μg/ml) for 15 minutes at room temperature.
- Hybridization: Incubation with probe solution (0.4 pmol of each probe in 100 µl of probe hybridization buffer) [3].
- Amplification: A pre-amplification step of at least 30 minutes was performed. Snap-cooled hairpins (3 pmol each of H1 and H2) were added to the amplification buffer, and amplification was carried out overnight [3].
- Washing: Excess hairpins were removed with multiple washes in 5x SSCT at room temperature [3].
Immunohistochemistry (when combined)
- The protocol allows for seamless integration with immunohistochemistry. After HCR v3.0 and the final post-amplification washes, standard IHC protocols can be performed to detect proteins of interest, such as phosphorylated-histone H3 [3].
Tissue Clearing and Imaging
- Clearing Method Selection: Several tissue clearing methods were compared. Fructose-glycerol clearing was identified as the optimal method for preserving the fluorescent signal generated by HCR v3.0 in octopus embryos [3]. This method effectively cleared the eye pigmentation present in stage XV embryos.
- Imaging: Cleared embryos were imaged using light sheet fluorescence microscopy (LSFM), which allows for rapid high-resolution 3D imaging of the entire transparent specimen [3].
The Scientist's Toolkit: Research Reagent Solutions
Table 3: Essential Research Reagents and Materials
| Item Name | Function/Application | Specification/Example |
|---|---|---|
| HCR v3.0 Probe Sets | Target-specific mRNA detection | Custom DNA oligo pools (26-33 split-initiator pairs per gene; e.g., from Integrated DNA Technologies) |
| HCR Amplifiers | Signal amplification | Fluorescently labeled hairpins (e.g., B1-Alexa546, B2-Alexa647, B3-Alexa488; from Molecular Instruments) |
| Fructose-Glycerol Solution | Optical clearing | Aqueous solution; preserves fluorescence, clears pigments |
| Proteinase K | Tissue permeabilization | Enzymatic treatment to enable probe penetration (e.g., 10 µg/ml, Roche) |
| Paraformaldehyde (PFA) | Tissue fixation | Preserves tissue morphology and RNA integrity (e.g., 4% in PBS) |
| Primary Antibodies | Protein detection (for IHC) | Specific to target protein (e.g., anti-phosphorylated-Histone H3) |
Critical Methodological Insights
Optimization and Troubleshooting
A critical finding was that the fructose-glycerol clearing method was superior for preserving HCR-generated fluorescent signals in octopus embryos compared to other tested methods [3]. This highlights that clearing protocol compatibility must be empirically determined for specific sample types and labeling techniques. Furthermore, to maintain signal integrity during the clearing process, a post-fixation step with 4% PFA for 20 minutes after HCR was necessary before proceeding with dehydration and clearing [62]. This step prevents signal loss or diffusion.
Advantages of the Integrated Approach
- Multiplexing Capability: The use of HCR v3.0 allows for the simultaneous detection of multiple RNA targets within the same sample, providing a co-expression analysis that is more informative than single-gene studies [3] [18].
- RNA and Protein Correlation: Combining HCR with IHC enables researchers to correlate the spatial localization of mRNA with its corresponding protein product or with other protein markers, which is particularly useful when antibodies for all genes of interest are unavailable [3] [62].
- 3D Spatial Context: The ability to image the entire embryo in 3D after clearing reveals architectural relationships and expression patterns that are impossible to discern from 2D sections, leading to novel biological insights [3].
This case study demonstrates a successfully optimized and validated pipeline for 3D gene expression analysis in a non-model invertebrate organism. The integration of whole-mount HCR v3.0, immunohistochemistry, fructose-glycerol clearing, and light sheet microscopy has proven to be a powerful tool for visualizing the complex process of embryonic neurogenesis in the octopus. The methodology provides a robust, sensitive, and relatively low-cost approach that preserves crucial spatial information, enabling discoveries that extend beyond the capabilities of traditional two-dimensional techniques. This protocol is not limited to octopus neurogenesis but serves as a valuable template for molecular morphological studies in a wide range of non-model organisms, thereby expanding the toolbox for evolutionary developmental biology.
Compatibility Analysis with Different Microscopy Platforms and Objectives
Optical tissue clearing has revolutionized three-dimensional (3D) imaging in biological research by rendering opaque samples transparent, thereby enabling deep-tissue visualization. Whole-mount fluorescence in situ hybridization (FISH) coupled with clearing techniques allows for precise spatial mapping of gene expression within intact tissues and organs. The compatibility between specific clearing protocols, microscopy platforms, and objective lenses is paramount for achieving high-quality, high-resolution images. This application note provides a comprehensive analysis of this compatibility, with a specific focus on fructose-glycerol-based clearing methods and their alternatives, to guide researchers in selecting the optimal imaging configuration for their experimental needs.
Optical clearing techniques homogenize the refractive index (RI) within a tissue to reduce light scattering, the primary cause of opacity. These methods can be broadly categorized into hydrophobic (organic solvent-based) and hydrophilic (aqueous-based) approaches [6]. The table below summarizes the core characteristics, advantages, and limitations of these major clearing types.
Table 1: Classification and Properties of Major Tissue Clearing Methods
| Clearing Type | Clearing Process | Common Agents/Techniques | Key Advantages | Key Limitations |
|---|---|---|---|---|
| Hydrophobic | Dehydrates tissue, dissolves lipids, and replaces water/lipids with high-RI organic solvents [6]. | BABB, 3DISCO/iDISCO, ECi, DBE [6] [63]. | High clearing efficiency and rapid RI matching [6]. | Can compromise endogenous fluorescence; often causes tissue shrinkage; toxic [6] [50]. |
| Hydrophilic (High-RI Aqueous) | Immerses tissue in high-RI aqueous solutions to reduce RI mismatches [6]. | Fructose (SeeDB), glycerol, sucrose, TDE, iohexol-based solutions (LIMPID, OptiMuS) [4] [6] [50]. | Better preservation of endogenous fluorescence and tissue structure; less toxic [4] [6]. | Generally slower clearing speed; can cause moderate tissue swelling [6] [50]. |
| Hydrophilic (Hyperhydration) | Uses hyperhydration and lipid removal with water-soluble chemicals [6]. | Urea-based methods (Scale, CUBIC) [6] [50]. | Effective for breaking down dense fibers. | Can be time-consuming; may not achieve complete transparency in large tissues [6] [50]. |
Fructose-glycerol clearing falls under the hydrophilic, high-RI aqueous category. Methods like SeeDB utilize high concentrations of fructose to achieve a high RI but can be limited by high viscosity, which impedes penetration into thick samples [50]. Glycerol alone offers a milder clearing effect with relatively lower tissue transparency compared to stronger agents like BABB [6]. Consequently, many recent protocols have been optimized by combining multiple components to enhance performance. For instance, the OptiMuS method combines urea, iohexol, and sorbitol to achieve rapid clearing with minimal size change and excellent fluorescence preservation [50]. Similarly, the LIMPID method uses a saline-sodium citrate buffer, urea, and iohexol to preserve lipids and ensure compatibility with FISH and immunohistochemistry [4].
Quantitative Comparison of Clearing Performance
The performance of a clearing agent is quantified by its ability to render tissue transparent, the speed of the process, and its impact on tissue dimensions and signal integrity. The following table provides a comparative analysis of several aqueous-based clearing methods, highlighting the performance of optimized solutions relevant to fructose-glycerol approaches.
Table 2: Quantitative Performance of Aqueous-Based Clearing Methods
| Clearing Method | Key Components | Refractive Index (RI) | Transparency (1 mm brain slice) | Size Change | Clearing Time (1 mm brain) | Fluorescence Preservation (after 4 days) |
|---|---|---|---|---|---|---|
| OptiMuS [50] | Urea, Iohexol, D-Sorbitol | 1.47 | ~75% (High) | ~1% shrinkage | 1.5 hours | >90% |
| LIMPID [4] | SSC buffer, Urea, Iohexol | Adjustable to ~1.515 | High (qualitative) | Minimal swelling/shrinking | Single-step, rapid | Compatible with RNA FISH & antibodies |
| CUBIC [50] | Urea, Amino alcohols | N/A | Moderate | Significant expansion | > 1 day | ~90% |
| ScaleS [50] | Urea, Glycerol, Triton X-100 | N/A | Moderate | Significant shrinkage | > 1 day | ~90% |
| Glycerol Alone [6] | Glycerol | ~1.47 | Relatively low | Improved with fixation | N/A | Good |
As shown, optimized solutions like OptiMuS and LIMPID offer significant advantages in speed, transparency, and size preservation, which are critical for maintaining structural integrity and achieving high-quality 3D reconstructions.
Microscope Platform Compatibility with Cleared Tissues
The choice of microscopy platform is determined by the sample size, desired resolution, imaging speed, and the specific clearing protocol used.
Light-Sheet Fluorescence Microscopy (LSFM)
LSFM is arguably the most effective platform for imaging large, cleared samples. Its orthogonal illumination and detection geometry minimize out-of-focus light and photobleaching, enabling rapid volumetric imaging [42] [64]. A key requirement for LSFM is that the clearing medium's RI must be compatible with the detection objective lens.
- Performance with Hydrophilic Media: Advanced LSFM systems are designed to be compatible with a wide range of RIs (from 1.33 to 1.56) [64]. This makes them ideal for imaging samples cleared with fructose-glycerol derivatives or iohexol-based solutions. For example, one study achieved 850 nm isotropic resolution across cleared samples up to 1 cm³ using a system with a multi-immersion detection objective, which can be adjusted for different media without realignment [64].
- Workflow for LSFM of Cleared Tissues: The diagram below outlines the key steps for imaging a cleared sample with LSFM.
Confocal Microscopy
Confocal microscopy is a widely available workhorse for 3D imaging and can produce high-resolution images of cleared tissues, though its penetration depth and speed are lower than LSFM.
- High-NA Imaging: The performance of confocal microscopy with cleared tissues is highly dependent on precise RI matching. With the LIMPID method, for instance, the iohexol concentration can be adjusted to fine-tune the tissue's RI to match a high numerical aperture (NA) oil immersion objective (RI = 1.515). This enables high-resolution subcellular visualization deep within a 250 μm thick mouse brain slice using a 63x objective [4].
- Multiplexing Capability: Confocal systems are effective for simultaneous imaging of FISH signals and antibody labels (immunohistochemistry) in cleared tissues, allowing for correlative analysis of mRNA and protein localization [4].
Multiphoton Microscopy
Multiphoton microscopy (MPM) excels in deep-tissue imaging due to its use of long-wavelength, pulsed lasers, which reduces scattering. It is particularly valuable for label-free imaging based on intrinsic signals like second harmonic generation (SHG) from collagen and two-photon excited fluorescence (TPF) [6].
- Compatibility with Clearing Agents: Studies on cardiovascular tissue have shown that the hydrophobic clearing agent BABB significantly enhances SHG and autofluorescence signal intensities at deeper layers compared to glycerol, making it the superior agent for deep 3D MPM/SHG imaging in these tissues [6]. This highlights that the optimal clearing agent can be platform- and tissue-specific.
The Scientist's Toolkit: Essential Reagents for Whole-Mount FISH with Clearing
Successful whole-mount FISH and 3D imaging relies on a suite of specialized reagents and materials.
Table 3: Key Research Reagent Solutions for Whole-Mount FISH and Clearing
| Reagent / Material | Function / Purpose | Example Use in Protocol |
|---|---|---|
| Iohexol | High-refractive index, low-viscosity compound used in aqueous clearing solutions [4] [50]. | Primary component in LIMPID and OptiMuS for RI matching [4] [50]. |
| Urea | A hyperhydration agent that reduces light scattering and improves penetration of other clearing components [50]. | Used in OptiMuS (4M) and Scale/CUBIC protocols to facilitate clearing [50]. |
| D-Sorbitol | A sugar alcohol that aids in gentle clearing and helps preserve sample size and structure [50]. | Added to OptiMuS (10%) to prevent tissue deformation caused by urea [50]. |
| Formamide | A chemical denaturant used in FISH hybridization buffers to control stringency and enhance specificity [51]. | Concentration is optimized (e.g., in MERFISH) to balance probe binding efficiency and specificity [51]. |
| HCR FISH Probes | Amplifiable fluorescent in situ hybridization probes that provide linear signal amplification for quantitative RNA detection [4]. | Used with LIMPID clearing for single-molecule RNA quantification in thick tissues [4]. |
| BABB (Benzyl Alcohol Benzyl Benzoate) | A classic hydrophobic clearing agent for rapid and efficient clearing [6] [63]. | Effective for clearing connective tissue-rich samples and enabling deep SHG imaging [6] [63]. |
Detailed Experimental Protocol: 3D-LIMPID-FISH for Whole-Mount Tissues
The following protocol, adapted from a published single-step optical clearing method, is compatible with RNA FISH and immunohistochemistry, and is designed for imaging with confocal or light-sheet microscopy [4].
Materials
- Tissue Samples: Freshly dissected whole-mount tissues (e.g., mouse embryonic limb buds, brain slices).
- Fixative: 4% Paraformaldehyde (PFA) in PBS.
- Permeabilization Solution: Phosphate-Buffered Saline (PBS) with 0.1% Tween-20 (PBT).
- FISH Probes: Custom-designed HCR FISH probes or commercial alternatives.
- LIMPID Clearing Solution: 1.5x Saline-Sodium Citrate (SSC) buffer, 4.5M Urea, and 75% (w/v) Iohexol. The RI can be adjusted by varying the iohexol percentage to match the imaging objective [4].
- Blocking Solution: PBT containing 5% normal serum from the host species of secondary antibodies.
- Primary and Secondary Antibodies (if performing immunofluorescence).
Procedure
- Fixation: Fix dissected tissues in 4% PFA for 12-24 hours at 4°C on a rocker. The fixation time may require optimization, as over-fixation can reduce FISH signals [4].
- Permeabilization and Bleaching: Wash tissues 3x with PBT. Permeabilize tissues by incubating in PBT for 1-2 hours. To reduce autofluorescence, a bleaching step with hydrogen peroxide (H₂O₂) or oxidation-mediated autofluorescence reduction (OMAR) can be incorporated [4] [24].
- Pre-hybridization: Equilibrate tissues in hybridization buffer for 1 hour at the hybridization temperature (e.g., 37°C).
- FISH Probe Hybridization: Incubate tissues with FISH probes (diluted in hybridization buffer) for 12-48 hours at the hybridization temperature in the dark.
- Post-Hybridization Washes: Perform stringent washes with pre-warmed SSC-based buffers to remove unbound probes.
- Immunostaining (Optional): If co-staining for proteins, block tissues for 4-6 hours at room temperature. Incubate with primary antibody for 24-48 hours, followed by washes and incubation with fluorescently-conjugated secondary antibody for 24 hours.
- Optical Clearing:
- Transfer the stained tissue directly into the LIMPID clearing solution.
- Incubate until the tissue is transparent. Clearing times vary with tissue size and type (e.g., 1.5 hours for a 1 mm brain slice with OptiMuS) [50].
- Mounting and Imaging:
- Mount the cleared tissue in a chamber filled with fresh LIMPID solution.
- For LSFM, mount the sample in agarose to stabilize it during imaging [64].
- Image using a confocal or light-sheet microscope, ensuring the clearing solution's RI is matched to the objective lens.
Workflow Visualization
The end-to-end experimental workflow, from sample preparation to imaging, is summarized below.
The integration of whole-mount FISH with advanced optical clearing methods like fructose-glycerol derivatives and iohexol-based solutions provides a powerful pipeline for 3D spatial transcriptomics. The key to success lies in understanding the interactions between the chosen clearing protocol, the tissue type, and the capabilities of the available microscopy platforms. Aqueous-based methods such as LIMPID and OptiMuS offer an excellent balance of speed, transparency, and compatibility with fluorescent labels for most applications. For the highest resolution in large volumes, a properly configured light-sheet microscope is unmatched, whereas confocal microscopy remains a robust and accessible option for smaller samples. By following the optimized protocols and compatibility guidelines outlined here, researchers can reliably generate high-quality 3D gene expression data to advance their research in developmental biology, disease mechanisms, and drug development.
ASSESSMENT OF TISSUE INTEGRITY AND MORPHOLOGY PRESERVATION POST-CLEARING
The adoption of whole-mount fluorescence in situ hybridization (WM-FISH) has been pivotal for achieving three-dimensional, quantitative gene expression analysis within intact tissue architecture. A significant technical challenge in this domain is the inherent opacity of biological tissues, primarily caused by light scattering from refractive index (RI) mismatches between components such as lipids, proteins, and water [6] [7]. Tissue clearing techniques are therefore essential to render samples transparent, thereby enabling deep-tissue imaging. However, the chemicals employed for clearing can potentially compromise tissue integrity and morphology, which are critical for accurate cellular and subcellular localization of RNA signals. This application note provides a structured framework for quantitatively assessing tissue integrity and morphology following a fructose-glycerol-based clearing protocol, contextualized within a broader WM-FISH research pipeline.
Comparative Analysis of Clearing Method Performance
Selecting an appropriate clearing agent requires balancing transparency efficacy with the preservation of tissue structure and biomolecules. The table below summarizes key performance characteristics of several clearing methods, including the fructose-glycerol approach relevant to this protocol.
Table 1: Quantitative and Qualitative Comparison of Tissue Clearing Methods
| Clearing Method | Clearing Principle | Key Performance Metrics | Impact on Tissue Integrity | Compatibility with WM-FISH |
|---|---|---|---|---|
| Fructose-Glycerol (e.g., FRUIT, SeeDB2) | Hydrophilic; High-RI aqueous solution [7] | Slower clearing speed; Moderate transparency [6] [7] | Minimal swelling/shrinking; Excellent preservation of endogenous fluorescence and protein epitopes [4] [7] | High; Aqueous environment preserves RNA and enables immunostaining [4] [34] |
| BABB | Hydrophobic; Organic solvent dehydration & lipid dissolution [6] | Rapid clearing; Increased AF-AUC to 0.1205 ± 0.0168; SHG-AUC to 0.0072 ± 0.0040 (p<0.001) [6] | Can quench fluorescent protein emission; potential for tissue shrinkage [6] [7] | Low to Moderate; Solvents can degrade RNA and are often incompatible with antibodies [4] |
| LIMPID | Hydrophilic; Lipid-preserving RI matching [4] | Enables high-resolution confocal imaging in 250 µm brain slices [4] | Preserves lipids and tissue structure; minimal aberrations [4] | High; Specifically validated for 3D FISH and co-labeling with antibodies [4] |
| OptiMuS-prime | Hydrophilic; Passive clearing with sodium cholate & urea [65] | Robust clearing and immunostaining in dense organs (kidney, spleen, heart) [65] | Superior tissue and protein integrity preservation; maintains original tissue size [65] | High; Effective for immunolabeling of neural structures and vasculature [65] |
Protocol: Assessing Tissue Integrity Post Fructose-Glycerol Clearing
This protocol outlines the steps to process tissue and quantitatively evaluate its condition after clearing with a fructose-glycerol solution.
Materials and Reagents
Table 2: Essential Research Reagent Solutions
| Item Name | Function/Description |
|---|---|
| Paraformaldehyde (PFA), 4% | Standard fixative for cross-linking proteins and preserving tissue morphology. |
| Fructose-Glycerol Clearing Solution | Aqueous solution for RI matching; minimal impact on fluorescence and structure [7]. |
| Renaissance 2200 (SR2200) | Cell wall stain for defining cellular boundaries and enabling cell segmentation [34]. |
| Primary & Secondary Antibodies | For immunofluorescence staining of protein targets to assess epitope preservation. |
| smFISH Probe Sets | Labeled oligonucleotide probes for target mRNA detection [34]. |
| Mounting Medium | For immobilizing samples prior to imaging. |
| Phosphate-Buffered Saline (PBS) | Washing and dilution buffer. |
Experimental Workflow
The following diagram illustrates the complete experimental pipeline from sample preparation to final analysis.
Workflow Title: Tissue Integrity Assessment Pipeline
Detailed Methodological Steps
Sample Preparation and Fixation
- Perfusion and Dissection: For animal tissues, perform transcardial perfusion with ice-cold PBS followed by 4% PFA. For plant tissues, direct immersion in 4% PFA is standard [65] [34].
- Post-fixation: Immerse dissected tissue samples in 4% PFA at 4°C for 6–24 hours, depending on sample size and density.
- Washing: Rinse fixed tissues thoroughly with PBS (3 x 10 minutes) to remove residual PFA.
Pre-clearing Baseline Assessment
- Staining: Co-stain samples with a cell wall dye (e.g., Renaissance 2200) and a structural protein antibody (e.g., anti-Tubulin) to establish baseline morphology.
- Imaging: Acquire high-resolution z-stack images of representative regions using a confocal microscope. Record imaging parameters (laser power, gain, resolution) for post-clearing replication.
Fructose-Glycerol Clearing
- Equilibration: Immerse the samples in the fructose-glycerol clearing solution. The protocol can be based on FRUIT or SeeDB2, which use a fructose and urea cocktail or a fructose-glycerol mixture, respectively [7].
- Incubation: Incubate the samples at room temperature or 4°C, protected from light. Clearing time can vary from several hours for small samples to days for whole organs [7].
- Monitoring: Periodically check sample transparency. The endpoint is reached when the tissue appears optically clear and no further changes are observed.
Post-clearing Quantitative Imaging and Analysis
- Image Acquisition: Re-image the exact same regions identified during the baseline assessment using identical microscope settings.
- Co-staining for WM-FISH: To validate compatibility, perform smFISH and immunofluorescence on the cleared tissue as described in the literature [34]. This involves hybridizing probes against a housekeeping gene (e.g., PP2A or GAPDH) and staining with a fluorescent protein reporter or antibody.
- Quantitative Metrics: Analyze the pre- and post-clearing image sets using the following criteria:
Table 3: Key Metrics for Quantitative Assessment of Tissue Integrity
| Assessment Category | Quantitative Metric | Measurement Method | Interpretation |
|---|---|---|---|
| Structural Preservation | Cell & Nuclear Volume | 3D segmentation from cell wall and DAPI stains | A change of <10% indicates excellent structural preservation. |
| Macromolecule Preservation | Fluorescent Protein Intensity | Mean pixel intensity in a defined ROI | A signal loss of <20% suggests good fluorophore preservation. |
| Macromolecule Preservation | smFISH Signal-to-Noise Ratio (SNR) | (Mean signal intensity - Mean background) / Std. background | A high, maintained SNR confirms RNA integrity and probe accessibility. |
| Optical Performance | Imaging Depth | Maximum z-depth where SNR > 3 | An increase post-clearing demonstrates successful transparency. |
The Scientist's Toolkit: Essential Reagents and Materials
Table 4: Key Reagent Solutions for Fructose-Glycerol Clearing and Integrity Assessment
| Reagent/Material | Critical Function | Application Notes |
|---|---|---|
| Fructose-Glycerol Solution | RI matching agent; renders tissue transparent. | Lower viscosity than some sugars; simple protocol but can be slow for large samples [7]. |
| Urea | Hyperhydration agent; disrupts hydrogen bonds to reduce light scattering. | A key component in FRUIT and Scale protocols; enhances clearing efficacy [7]. |
| Renaissance 2200 (SR2200) | Cell wall staining dye. | Allows for precise cell segmentation and morphological analysis post-clearing [34]. |
| smFISH Probe Sets | Target-specific detection of mRNA molecules. | Short oligonucleotide probes penetrate cleared tissue effectively; allow absolute mRNA counting [4] [34]. |
| Proteinase K | Digests proteins; can reverse formalin crosslinks. | Used in some RNA extraction protocols from FFPE tissue; handle with care to avoid over-digestion [66]. |
| Anti-GFP/VENUS Antibodies | Immunodetection of fluorescent reporter proteins. | Enables correlation of mRNA and protein levels in the same cell [34]. |
Rigorous assessment of tissue integrity is not merely a quality control step but a fundamental requirement for validating any tissue clearing protocol intended for WM-FISH. The quantitative framework outlined herein—evaluating structural preservation, macromolecule integrity, and optical performance—enables researchers to objectively benchmark the fructose-glycerol method against alternatives. By ensuring that clearing agents adequately preserve native morphology and biomolecular information, scientists can confidently proceed with high-resolution, three-dimensional gene expression mapping, thereby generating more reliable and biologically meaningful data.
Conclusion
Whole-mount FISH with fructose-glycerol clearing represents a robust, accessible methodology for 3D gene expression mapping that balances excellent signal preservation with practical implementation. This technique enables researchers to visualize spatial gene expression patterns in intact tissues and embryos, providing insights into developmental processes, neural circuitry, and disease mechanisms that are impossible to obtain through traditional sectioning approaches. The compatibility with immunohistochemistry allows for correlative mRNA and protein localization studies, while the aqueous-based clearing preserves tissue architecture and fluorescent signals effectively. As tissue clearing and molecular labeling technologies continue to evolve, this approach will find expanding applications in developmental biology, neuroscience, and clinical research, particularly for studying complex 3D tissue organization and spatial transcriptomics in both model and non-model organisms.
References
- 1. From whole-mount to single-cell spatial assessment of gene ... [https://www.nature.com/articles/s42003-020-01341-1?error=cookies_not_supported&code=74a3d20b-adf3-4d9e-b512-c80b1da17af8]
- 2. Regulation of disease -associated gene in the expression 3 D genome [https://pubmed.ncbi.nlm.nih.gov/27826147/]
- 3. Optimization of Whole Mount RNA Multiplexed in situ ... [https://www.frontiersin.org/journals/physiology/articles/10.3389/fphys.2022.882413/full]
- 4. A simple and fast optical clearing method for whole-mount ... [https://pmc.ncbi.nlm.nih.gov/articles/PMC12342960/]
- 5. Overview of Tissue Clearing Methods and Applications [https://andor.oxinst.com/learning/view/article/overview-of-tissue-clearing-methods-and-applications]
- 6. Evaluation of the effects of clearing agents, fixation, and ... [https://pmc.ncbi.nlm.nih.gov/articles/PMC12331724/]
- 7. Tissue Clearing Techniques [https://www.jacksonimmuno.com/secondary-antibody-resource/immuno-techniques/tissue-clearing-techniques/]
- 8. Protocol for whole-mount immunofluorescence staining of ... [https://www.sciencedirect.com/science/article/pii/S2666166724002971]
- 9. Comparison of Different Tissue Clearing Methods for Three ... [https://pmc.ncbi.nlm.nih.gov/articles/PMC8632656/]
- 10. Comparative Analyses of Clearing Efficacies of Tissue ... [https://pmc.ncbi.nlm.nih.gov/articles/PMC8831720/]
- 11. From morphology to single-cell molecules: high-resolution 3D ... [https://molecular-cancer.biomedcentral.com/articles/10.1186/s12943-025-02240-x]
- 12. TISSUE CLEARING - PMC - PubMed Central [https://pmc.ncbi.nlm.nih.gov/articles/PMC8815095/]
- 13. FRC-QE: a robust and comparable 3D microscopy image ... [https://pmc.ncbi.nlm.nih.gov/articles/PMC8479654/]
- 14. Protocol for whole-mount preparation, clearing, and ... [https://pmc.ncbi.nlm.nih.gov/articles/PMC11683226/]
- 15. Tissue clearing and imaging methods for cardiovascular ... [https://www.sciencedirect.com/science/article/pii/S2589004221003552]
- 16. Confined CHA-HCR system for sensitive and specific ... [https://www.sciencedirect.com/science/article/abs/pii/S0731708525000494]
- 17. Third-generation in situ hybridization chain reaction: multiplexed, quantitative, sensitive, versatile, robust - PMC [https://pmc.ncbi.nlm.nih.gov/articles/PMC6031405/]
- 18. A rapid and sensitive, multiplex, whole mount RNA ... [https://plantmethods.biomedcentral.com/articles/10.1186/s13007-023-01108-9]
- 19. Hybridization chain reaction enables a unified approach to ... [https://pmc.ncbi.nlm.nih.gov/articles/PMC8645210/]
- 20. Branched hybridization chain reaction—using highly ... [https://www.nature.com/articles/s41378-019-0076-z]
- 21. High-throughput imaging of mRNA at the single-cell level in ... [https://pmc.ncbi.nlm.nih.gov/articles/PMC9380748/]
- 22. See-Star: a versatile hydrogel-based protocol for clearing ... [https://evodevojournal.biomedcentral.com/articles/10.1186/s13227-024-00228-0]
- 23. Whole-Body Imaging with Single-Cell Resolution by Tissue ... [https://www.sciencedirect.com/science/article/pii/S0092867414013610]
- 24. Optimized protocol for whole-mount RNA fluorescent in situ ... [https://www.sciencedirect.com/science/article/pii/S2666166723005701]
- 25. A Fast and Efficient Fluorescent In situ Hybridization (FISH) ... [https://www.frontiersin.org/journals/physiology/articles/10.3389/fphys.2022.878062/full]
- 26. Most abundant metabolites in tissues of freshwater fish ... [https://pmc.ncbi.nlm.nih.gov/articles/PMC7555489/]
- 27. FAQ [https://www.moleculartechnologies.org/info/faq]
- 28. rwnull/insitu_probe_generator: Generate HCR-style Probe ... [https://github.com/rwnull/insitu_probe_generator]
- 29. TrueProbes: Quantitative Single-Molecule RNA-FISH ... [https://elifesciences.org/reviewed-preprints/108599]
- 30. Quantitative Single-Molecule RNA-FISH Probe Design ... [https://pubmed.ncbi.nlm.nih.gov/40894740/]
- 31. Meet the HCR™ Assay Designer [https://www.hcrimaging.com/articles/hcr-assay-designer]
- 32. Tips to Boost Performance in Your HCR™ RNA ... [https://www.hcrimaging.com/articles/boost-performance]
- 33. Simultaneous visualization of RNA transcripts and proteins ... [https://www.frontiersin.org/journals/cell-and-developmental-biology/articles/10.3389/fcell.2022.986261/full]
- 34. Whole-mount smFISH allows combining RNA and protein ... [https://www.nature.com/articles/s41477-023-01442-9]
- 35. Simultaneous detection and quantification of spike mRNA ... [https://pmc.ncbi.nlm.nih.gov/articles/PMC9894770/]
- 36. Optical Clearing Using SeeDB [https://en.bio-protocol.org/en/bpdetail?id=1042&type=0]
- 37. A quantitative pipeline for whole-mount deep imaging and ... [https://elifesciences.org/reviewed-preprints/107154]
- 38. Optimized protocol for whole-mount RNA fluorescent in situ ... [https://pmc.ncbi.nlm.nih.gov/articles/PMC10522992/]
- 39. Light-sheets and smart microscopy, an exciting future is ... [https://www.nature.com/articles/s42003-023-04857-4]
- 40. Light Sheet Fluorescence Microscopy [https://www.microscopyu.com/techniques/light-sheet/light-sheet-fluorescence-microscopy]
- 41. Light sheet fluorescence microscopy for monitoring drug ... [https://www.sciencedirect.com/science/article/pii/S0169409X25000055]
- 42. Optical tissue clearing associated with 3D imaging [https://link.springer.com/article/10.1007/s00418-022-02081-5]
- 43. Optimization of GFP Fluorescence Preservation by a ... [https://www.frontiersin.org/journals/neuroanatomy/articles/10.3389/fnana.2018.00067/full]
- 44. FLUID: a fluorescence-friendly lipid-compatible ultrafast ... [https://opg.optica.org/boe/abstract.cfm?uri=boe-15-10-5609]
- 45. Supplementary protocols for 'A simple and fast optical ... [https://www.protocols.io/view/supplementary-protocols-for-39-a-simple-and-fast-o-g8s8bzwhx.html]
- 46. Article TDAExplore: Quantitative analysis of fluorescence ... [https://www.sciencedirect.com/science/article/pii/S2666389921002294]
- 47. hFRUIT: An optimized agent for optical clearing of DiI- ... [https://www.nature.com/articles/s41598-020-66999-3]
- 48. A pH-Adjustable Tissue Clearing Solution That Preserves ... [https://www.mdpi.com/1999-4923/12/11/1070]
- 49. Routine Optical Clearing of 3D-Cell Cultures: Simplicity Forward [https://pmc.ncbi.nlm.nih.gov/articles/PMC7046628/]
- 50. Optimized single-step optical clearing solution for 3D ... [https://www.nature.com/articles/s42003-022-03388-8]
- 51. Protocol optimization improves the performance of ... [https://www.nature.com/articles/s41598-025-17477-1]
- 52. Elastase Reduces Background Autofluorescence in ALK ... [https://www.sciencedirect.com/science/article/pii/S2319417025000149]
- 53. Elastase Reduces Background Autofluorescence in ALK ... [https://pubmed.ncbi.nlm.nih.gov/40057030/]
- 54. How do I reduce high background in my FISH assay? [https://www.ogt.com/us/resources/fish-resources-and-support/fish-resources/optimize-your-fish-assay-simple-fixes-for-reducing-high-background-signal/]
- 55. Tissue clearing technique: Recent progress and ... [https://pmc.ncbi.nlm.nih.gov/articles/PMC7812135/]
- 56. Superior tissue preservation with SHIELD [https://lifecanvastech.com/three-easy-steps-to-superior-tissue-preservation-with-shield/]
- 57. SABER amplifies FISH: enhanced multiplexed imaging of ... [https://www.nature.com/articles/s41592-019-0404-0]
- 58. Clarifying Tissue Clearing - PMC [https://pmc.ncbi.nlm.nih.gov/articles/PMC4537058/]
- 59. Comparison of Immunohistochemical Methods (IHC) and ... [https://pmc.ncbi.nlm.nih.gov/articles/PMC9985809/]
- 60. Tissue clearing and 3D imaging in developmental biology - PMC [https://pmc.ncbi.nlm.nih.gov/articles/PMC8497915/]
- 61. Optimization of Whole Mount RNA Multiplexed in situ ... [https://pmc.ncbi.nlm.nih.gov/articles/PMC9196907/]
- 62. 3D exploration of gene expression in chicken embryos ... [https://bmcbiol.biomedcentral.com/articles/10.1186/s12915-024-01922-0]
- 63. A survey of clearing techniques for 3D imaging of tissues ... [https://www.sciencedirect.com/science/article/pii/S0079633616300043]
- 64. Isotropic, aberration-corrected light sheet microscopy for ... [https://www.nature.com/articles/s41587-025-02882-8]
- 65. A novel protein-preserving passive tissue clearing ... [https://pmc.ncbi.nlm.nih.gov/articles/PMC12586516/]
- 66. Systematic comparison of quantity and quality of RNA ... [https://translational-medicine.biomedcentral.com/articles/10.1186/s12967-024-05890-5]